ISSN 0736-5306 SCIENCE OF TSUNAMI HAZARDS The International Journal of The Tsunami Society Volume 16 Number 1 1998 TSUNAMI FROM ASTEROID AND COMET IMPACTS: THE VULNERABILITY OF EUROPE Jack C. Hills and Partick Goda Los Alamos National Laboratory, Los Alamos, NM USA ASTEROID TSUNAMI INUNDATION OF JAPAN Charles L. Mader Mader Consulting Co., Honolulu, Hi USA MODELING THE ELTANIN ASTEROID T’SUNAM1 Charles L. Mader Mader Consulting Co., Honolulu, Hi USA MODELING ASTEROlD IMPACT AND TSUNAMI David A. Crawford Sandia National Laboratories, Albuquerque, NM USA Charles L. Mader Mader Consulting Co., Honolulu, HI USA POTENTIAL FOR LANDSLIDE-GENERATED TSUNAMIS IN HAWAll Patricia A. Lockridge National Geophysical Data Center, Boulder, CO USA THE NEW TSUNAMI WARNING SYSTEM OF THE JAPAN METEOROLOGICAL SOCIETY Hidee Tatehata Japan Meteorological Agency, Tokyo, Japan ELEVATION CHANGES ASSOCIATED WITH A TSUNAMIGENIC EARTHQUAKE Shigehisa Nakamura Tanabe, Japan THE JULY ]9!)8 NEW GUINEA TSUNAMI CARRIES BAD NEWS FOR HAWAII REAL-TIME VISUAL OBSERVATIONS OF SMALL TSUNAMIS IN HAWAII-GENERATED BY THE DECEMBER 5, 1997 KAMCHATKA EARTHQUAKES Daniel A. Walker Honolulu, Hawaii The Tsunami Society Award to James F. Lander . copyright (6J1998 THE TSUNAMI SOCIETY P. O. Box 25218, Honolulu, HI 96825, USA 3 11 17 21 31 39 51 55 57 62
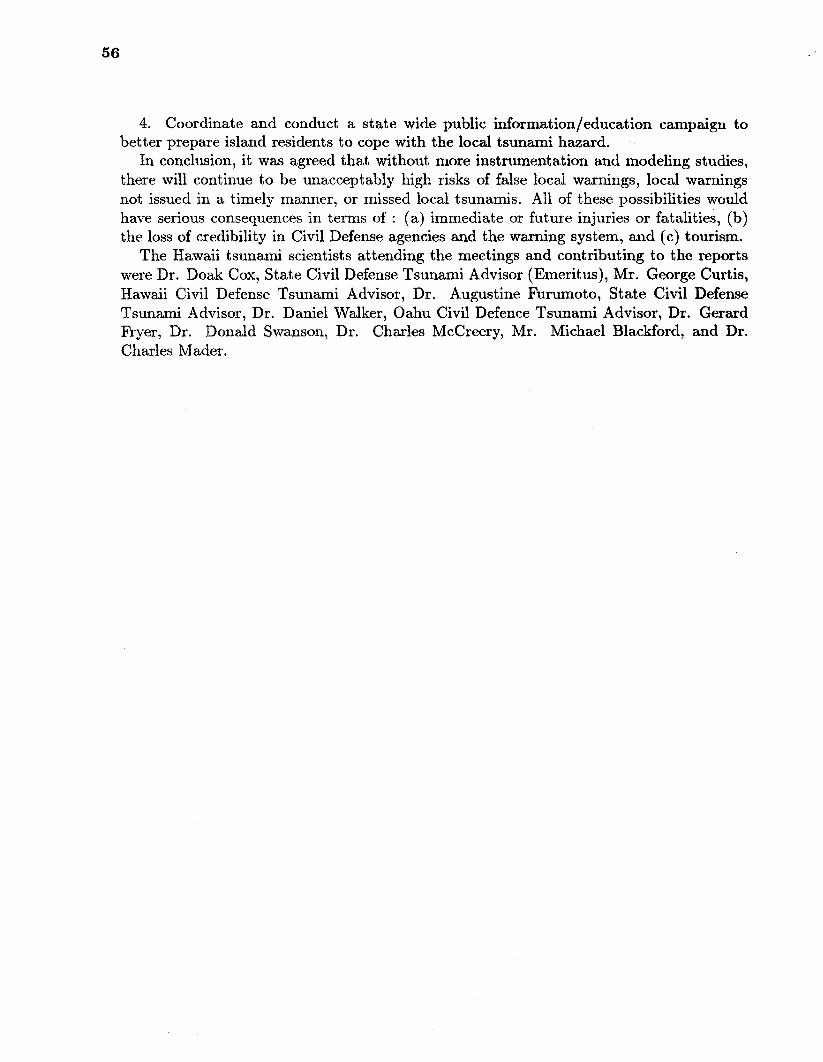
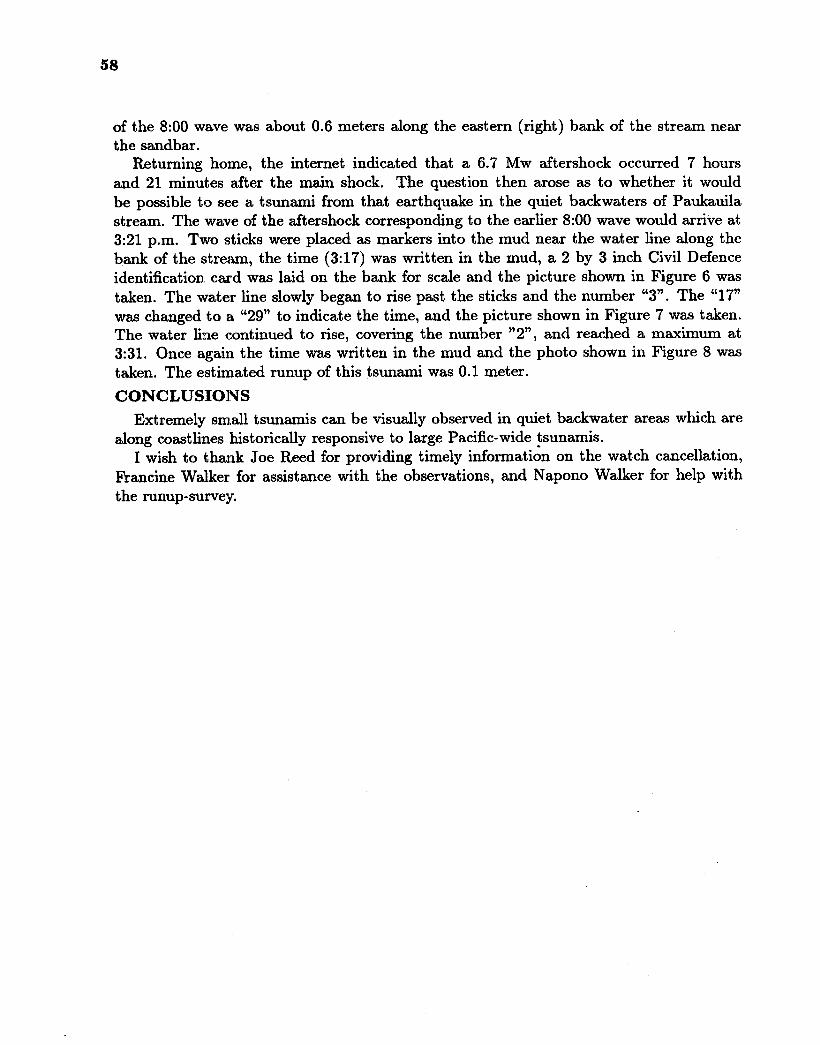
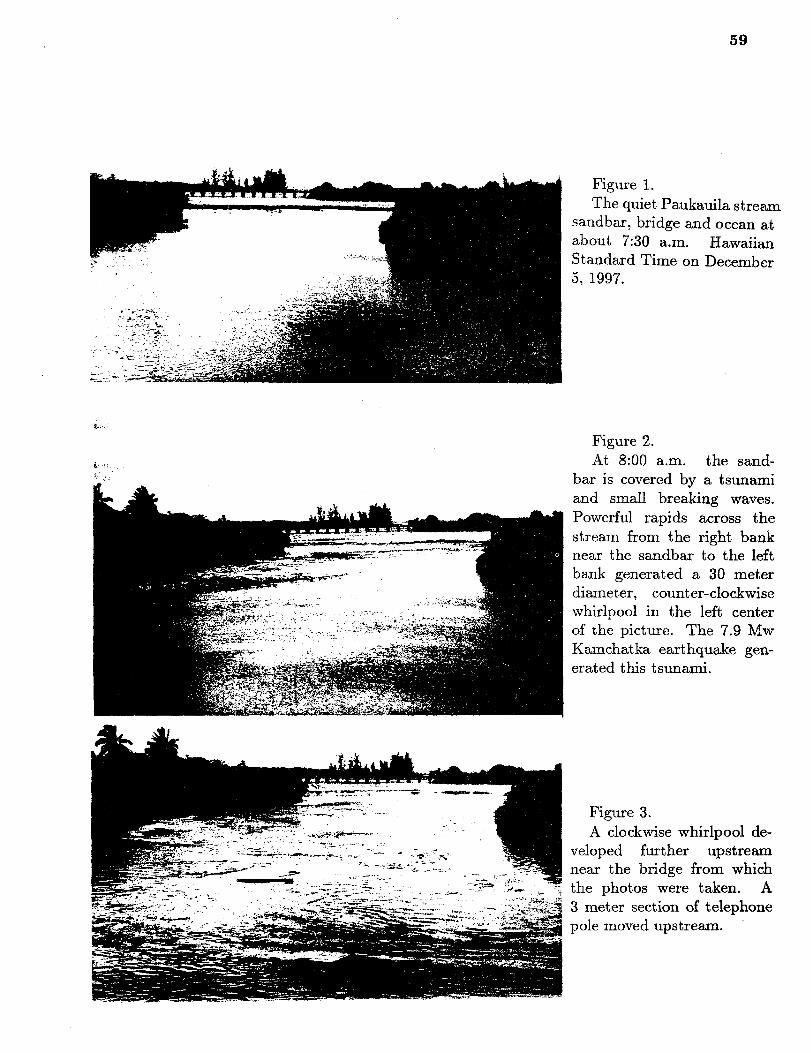
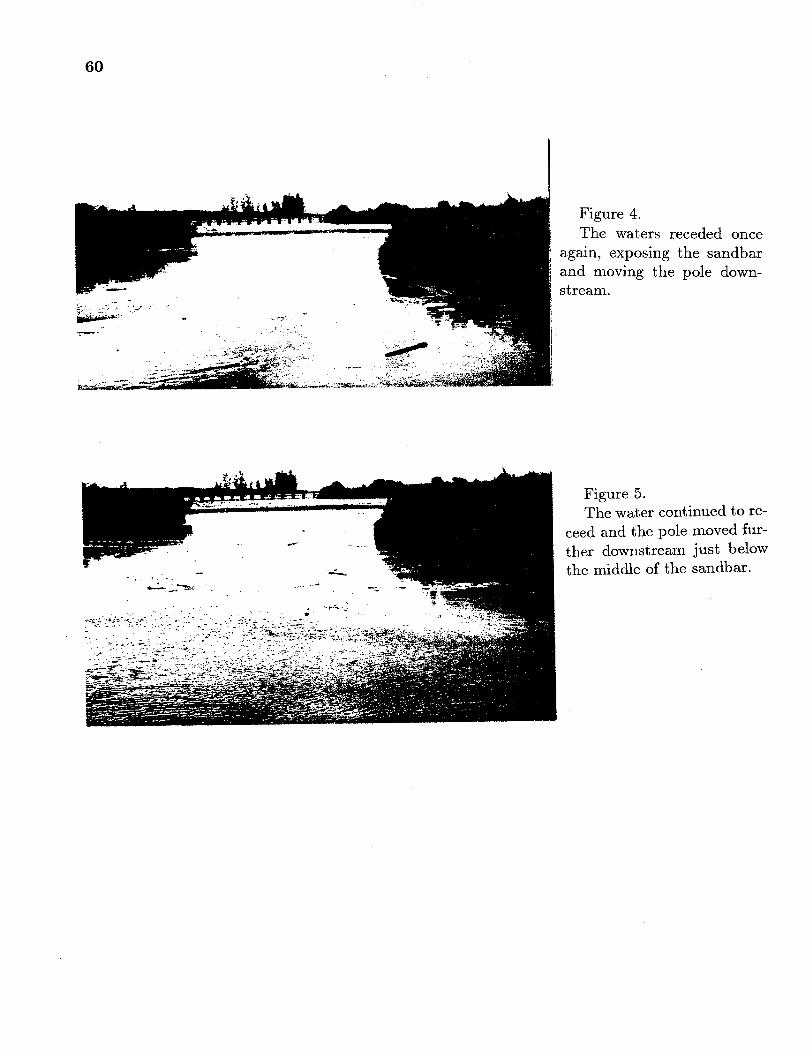
Transcript
ISSN 0736-5306
SCIENCE OF
TSUNAMI HAZARDSThe International Journal of The Tsunami SocietyVolume 16 Number 1 1998
TSUNAMI FROM ASTEROID AND COMET IMPACTS:THE VULNERABILITY OF EUROPEJack C. Hills and Partick Goda
Los Alamos National Laboratory, Los Alamos, NM USA
ASTEROID TSUNAMI INUNDATION OF JAPANCharles L. Mader
Mader Consulting Co., Honolulu, Hi USA
MODELING THE ELTANIN ASTEROID T’SUNAM1Charles L. Mader
Mader Consulting Co., Honolulu, Hi USA
MODELING ASTEROlD IMPACT AND TSUNAMIDavid A. Crawford
Sandia National Laboratories, Albuquerque, NM USA
Charles L. Mader
Mader Consulting Co., Honolulu, HI USA
POTENTIAL FOR LANDSLIDE-GENERATED TSUNAMIS IN HAWAllPatricia A. Lockridge
National Geophysical Data Center, Boulder, CO USA
THE NEW TSUNAMI WARNING SYSTEMOF THE JAPAN METEOROLOGICAL SOCIETYHidee Tatehata
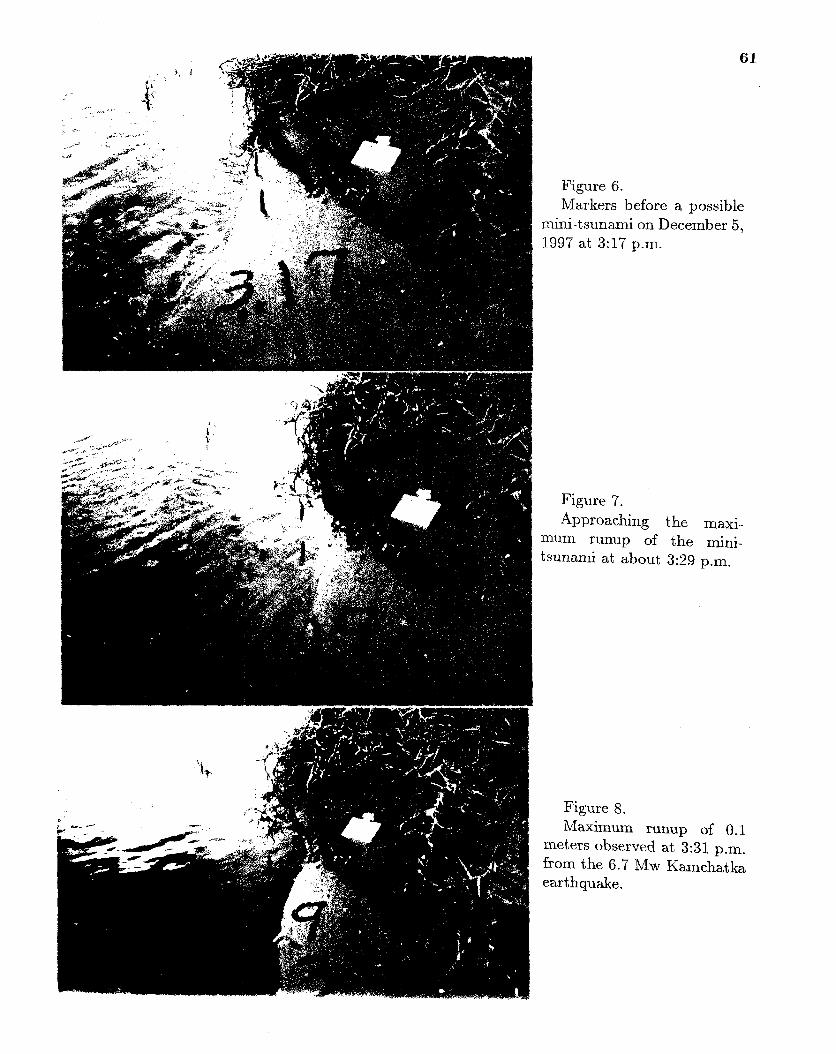
THE JULY ]9!)8 NEW GUINEA TSUNAMICARRIES BAD NEWS FOR HAWAIIREAL-TIME VISUAL OBSERVATIONS OFSMALL TSUNAMIS IN HAWAII-GENERATED BY THEDECEMBER 5, 1997 KAMCHATKA EARTHQUAKESDaniel A. Walker
Honolulu, Hawaii
The Tsunami Society Award to James F. Lander. copyright (6J1998
THE TSUNAMI SOCIETYP. O. Box 25218,
Honolulu, HI 96825, USA
3
11
17
21
31
39
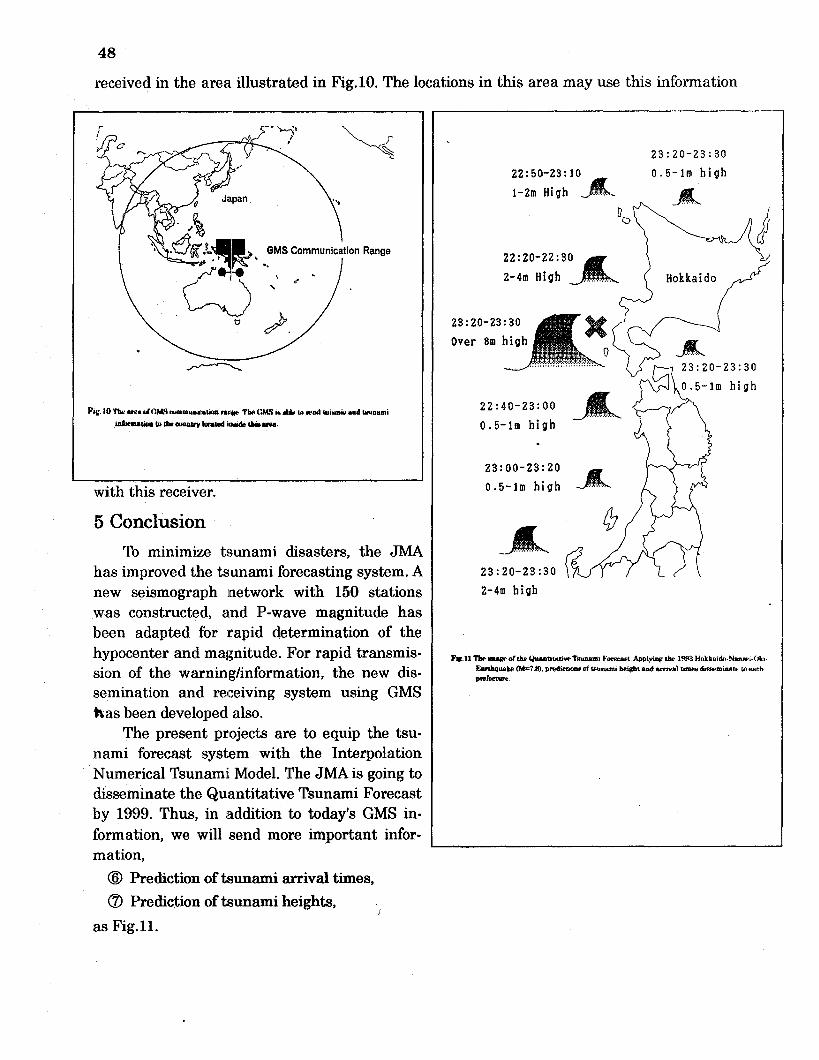
51
55
57
62
andOBJECTIVE: The Tsunami Society publishes this journal to increasedisseminate knowledge about tsunamis and their hazards.DISCLAIMER: Although these articles have been technically reviewed by
peers, The Tsunami Society is not responsible for the veracity of any state-ment, opinion or (consequences.
EDITORIAL STAFF
Dr. Charles Mader, Editor
Mader (Consulting Co.1049 Kimehame Dr., Honolulu, HI. 96825-2860, USA
Dr. Augustine Furumoto, Publisher
EDITORIAL BOARD
Dr. Antonio Baptista, Oregon Graduate Institute of Science and Technology
Professor George Carrier, Harvard University
Mr. George Curtis, University of Hawaii - IiiloDr. Zygmunt Kowalik, University of Alaska
Dr. T. S. Murty, Baird and Associates - Ottawa
Dr. Shigehisa Nakamura, Kyoto Um”versity
Dr. Yimii Slmkin, Novosibirsk
Mr. Thomas Sokolowski, AIaska Tsunam” Warning Center
Dr. Costas Synolakis, University of Caliform”a
Professor Stefano Tinti, University of Bologna
TSUNAMI SOCIETY OFFICERS
Mr. George Curtis, President
Professor Stefano Tinti, Vice President
Dr. Charles McCreery, Secretary
Dr. Augustine Furumoto, !Ikeasurer
Submit manuscripts of articles, notes or letters to the Editor. If an article isaccepted for publication the author(s) must submit a camera ready manuscriptin the journal format. A voluntary $30.00 page charge for Tsunami Societymembers, $50.00 for non-members will include 50 reprints.
SUBSCRIPTION INFORMATION: Price per copy $20.00 USA
Permission to use figures, tables and brief excerpts from this journal inscientific and educational works is hereby “granted provided that the source isacknowledged.
ISSN 0736-5306 http://www.ccalmr.ogi.edu/STti
Published by The Tsunami Society k Honolulu, Hawaii, USA
3
TSUNAMI FROM ASTEROID AND COMET IMPACTS:THE VULNERABILITY OF EUROPE
Jack G. Hills, M. Patrick Goda,Mail Stop B288
Theoretical DivisionLos Alamos National LaboratoryLos Alamos, N.M. 87545, U.S.A.
ABSTRACT
Tsunami is probably the most serious form of damage caused by stony as-teroids with diameters between about 200 meters and 2 km. Smaller ones dis-sipate most of their energy in the atmosphere while larger ones eject enoughdust above the atmosphere to produce darkness that lasts for months, whichmay cause more deaths than a tsunami. Asteroids larger than 200 meters indiameter hit Earth about every 3000 to 5000 years, so the probability of oneimpacting in a given human lifetime is about 2-3Y0. In the absence of wavedispersion, even an asteroid 200 meters in diameter impacting in mid Atlanticwould produce tsunami several meters high on either side of the ocean. Usinga tsunami propagation and runup code, we find that an asteroid 5 kilometersin diameter falling in the mid Atlantic produces tsunami that inundate theupper two-thirds of the Eastern United States to the foothills of the Ap-palachians. In Europe, the damage is less dramatic: The most vulnerablearea is the Spain-Portugal peninsula. It is being thrust into the Atlantic byplate tectonics, so it has little continental shelf, which is ideal for producinglarge tsunami runups. The same impactor that causes runups in the EasternUnited States to the Appalachians causes runups to the mountains of thispeninsula. The situation in Northern Europe is more favorable. The exten-sive, shallow continental shelf around the British Isles reflects much of thetsunami energy back into the Atlantic. The UK and the continent facing itare relatively protected from tsunami.
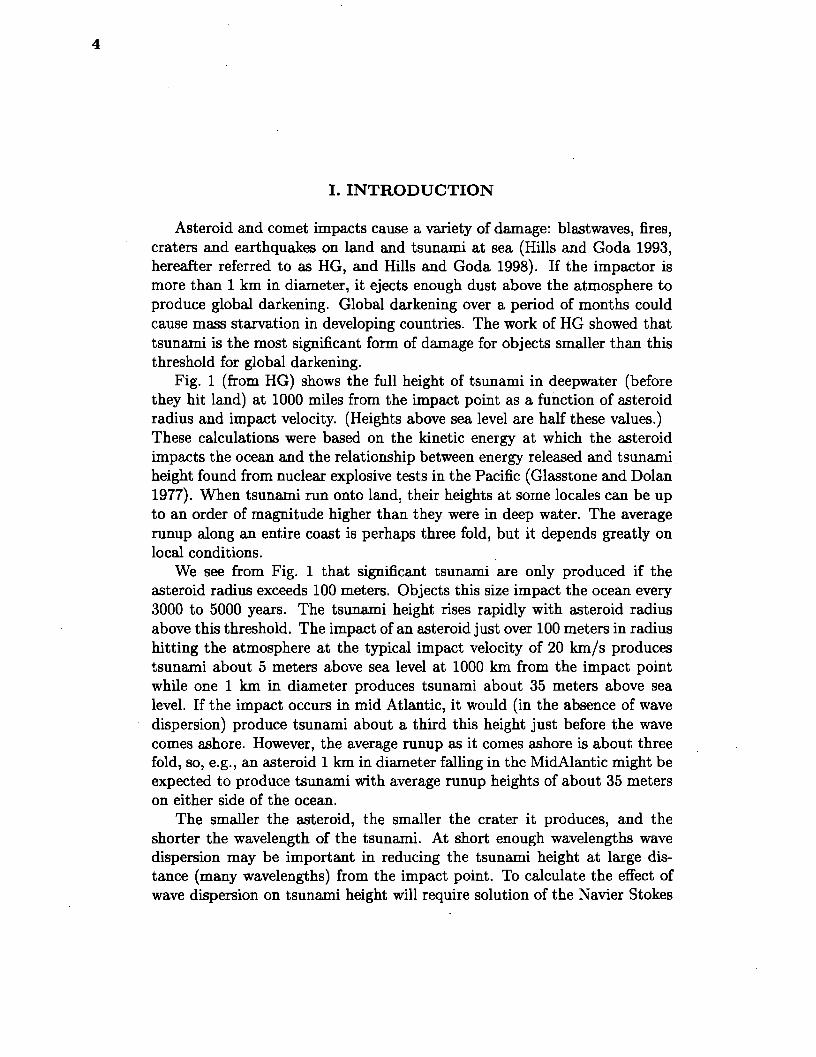
I. INTRODUCTION
Asteroid and comet impacts cause a variety of damage: blastwaves, fires,craters and earthquakes on land and tsunami at sea (Hills and Goda 1993,hereafter referred to as HG, and Hills and Goda 1998). If the impactor ismore than 1 km in diameter, it ejects enough dust above the atmosphere toproduce global darkening. Global darkening over a period of months couldcause mass starvation in developing countries. The work of HG showed thattsunami is the most significant form of damage for objects smaller thm thisthreshold for global darkening.
Fig. 1 (from HG) shows the full height of tsunami in deepwater (beforethey hit land) at 1000 miles from the impact point as a function of asteroidradius and impact velocity. (Heights above sea level are half these values.)These calculations were bzwcl on the kinetic energy at which the asteroidimpacts the ocean and the relationship between energy released and tsunamiheight found from nuclear explosive tests in the Pacific (Glasstone and Dolan1977). When tsunami run onto land, their heights at some locaJes can be upto an order of magnitude higher than they were in deep water. The averagerunup along MI entire coast is perhaps three fold, but it depends greatly onlocal conditions.
We see from Fig. 1 that significant tsunami are only produced if theasteroid radius exceeds 100 meters, Objects this size impact the ocean every3000 to 5000 years. The tsunami height rises rapidly with asteroid radiusabove this threshold. The impact of an asteroid just over 100 meters in radiushitting the atmosphere at the typical impact velocity of 20 km/s producestsunami about 5 meters above sea level at 1000 km from the impact pointwhile one 1 km in diameter produces tsunami about 35 meters above sealevel, If the impact occurs in mid Atlantic, it would (in the absence of wavedispersion) produce tsunami about a third this height just before the wavecomes ashore. However, the average runup as it comes ashore is about threefold, so, e.g., an asteroid 1 km in diameter falling in the MidAlantic might beexpected to produce tsunami with average runup heights of about 35 meterson either side of the ocean.
The smaller the asteroid, the smaller the crater it produces, and theshorter the wavelength of the tsunami. At short enough wavelengths wavedispersion may be important in reducing the tsunami height at large dis-tance (many wavelengths) from the impact point. To calculate the effect ofwave dispersion on tsunami height will require solution oft he Navier Stokes
Figure 1: Full height of tsunami in deep water at 1000 km from impact site.(Wave height above mean sea level is half this value). This was obtained fromthe energy of impact of the asteroid allowing for atmospheric dissipation andscaled from the results of experiments with nuclear explosives.
equation in modeling the propagation from the impact point to the shore.Dispersion is only important if the wave propagation distance is several thou-sand kilometers.
H. RUNUPS FROM LARGE IMPACTORS
The wavelengths of tsunami produced by larger mteroids are long enoughthat wave dispersion is not a problem. We can model these tsunami ac-curately using the shallow water (or long-wavelength) approximation. Weinitially used the SWAN code (Mader 1988) for these calculations. This for-
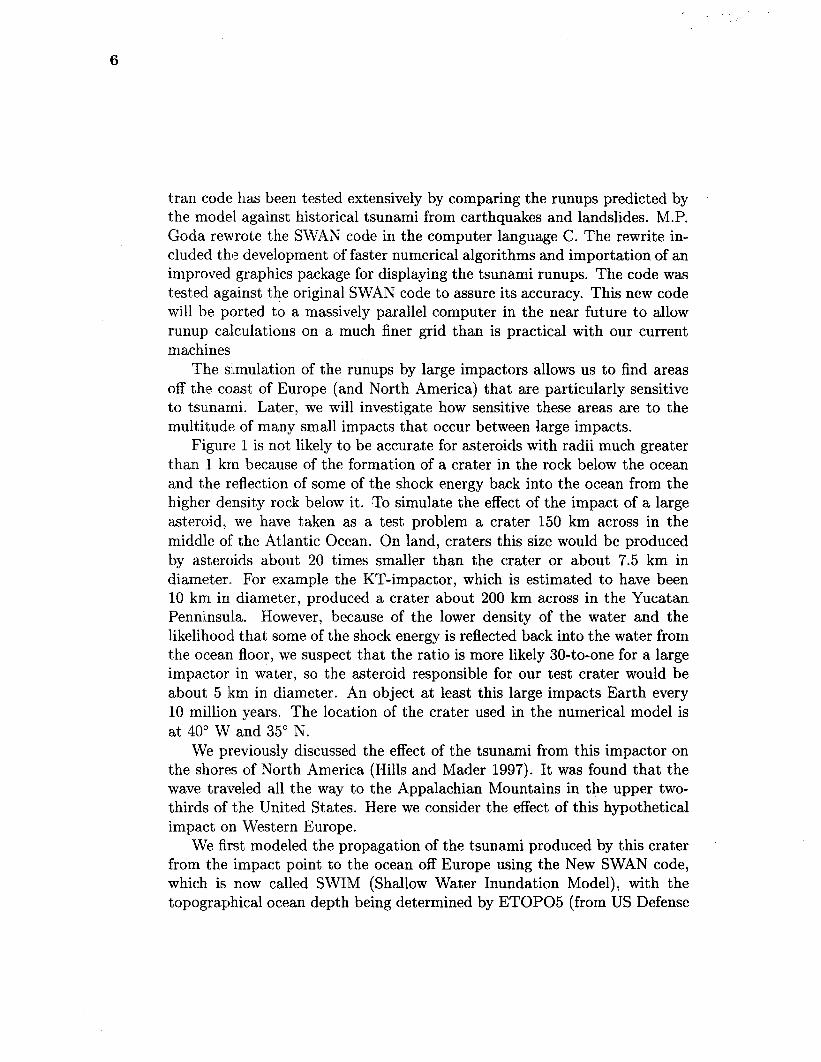
tran code has been tested extensively by comparing the runups predicted bythe model against historical tsunami from earthquakes and landslides. M.P.Goda rewrote the SWAN code in the computer language C. The rewrite in-cluded the development of faster numerical algorithms and importation of animproved graphics package for displaying the tsunami runups. The code wastested against the original SWAN code to assure its accuracy. This new codewill be ported to a massively parallel computer in the near future to allowrunup calculations on a much finer grid than is practical with our currentmachines.
The simulation of the runups by large impactors allows us to find areasoff the coast of Europe (and North America) that are particularly sensitiveto tsunami. Later, we will investigate how sensitive these areas are to themultitude of many small impacts that occur between large impacts.
Figure 1 is not likely to be accurate for asteroids with radii much greaterthan 1 krn because of the formation of a crater in the rock below the oceanand the reflection of some of the shock energy back into the ocean from thehigher density rock below it. To simulate the effect of the impact of a largeasteroid, we have taken as a test problem a crater 150 km across in themiddle of the Atlantic Ocean. On land, craters this size would be producedby astercjids about 20 times smaller than the crater or about 7.5 km indiameter, For example the KT-impactor, which is estimated to have been10 km in diameter, produced a crater about 200 km across in the YucatanPeninsula. However, because of the lower density of the water and thelikelihood that some of the shock energy is reflected back into the water fromthe ocean floor, we suspect that the ratio is more likely 30-to-one for a largeimpactor in water, so the asteroid responsible for our test crater would beabout 5 lkmin diameter. An object at least this large impacts Earth every10 million years. The location of the crater used in the numerical model isat 40° W and 35° N.
We previously discussed the effect of the tsunami from this impactor onthe shores of North America (Hills and Mader 1997). It was found that thewave traveled all the way to the Appalachian Mountains in the upper two-thirds of the United States. Here we consider the effect of this hypotheticalimpact on Western Europe.
We first modeled the propagation of the tsunami produced by this craterfrom the impact point to the ocean off Europe using the New SWAN code,which is now called SWIM (Shallow Water Inundation Model), with thetopographical ocean depth being determined by ETOP05 (from US Defense
Coastal Inundation, North-East Atlontic (m)
200
270
240
210
WO
150
120
90
*60
- 20
0
Figure 2: Regions of Western Europe that had been inundated by the timethe calculations had to be terminated. The grey scale shows the maximumdepth of inundation above mean sea level reached at each location.
Mapping Agency). This gave a grid with a topographical resolution of 5 arcminutes. We found the height and wavelength of this wave before it cameashore in Europe. We then restarted the calculation on the part of Europeshown in Fig. 2. We used a piston on the western boundary of this gridthat approximated the wavelength and amplitude of the wave found in thepreviouscalculation. This handoverreducedthe tendencytowardsnumericalinstabilitiesat the free ocean surfacesat the corners of the numericalgrid.The westernboundary at 18 degrees longitude used a sinusoidal piston withan initial amplitude of 150 meters, a period of 903.51 seconds, a wavelengthof 200 kilometers which corresponds to a deep water gravity wave speed of221.35 m/s. After three strokes the piston decayed exponentially with an ‘e-folding time of about one period. The remaining boundaries (where wateris located) are linear continuous. No friction is used in the current runs. Thecode ran for 24000 model seconds (6.67 hours), which is sufficient time forall initial waves to interact with the coastlines. The code was then stoppeddue to numerical problems with waves at the continuous boundaries withinthe water.
Figures 3–6 show the extent of the flooding by the time the computa-tions were stopped. The gray scale in the figures shows the maximum flood
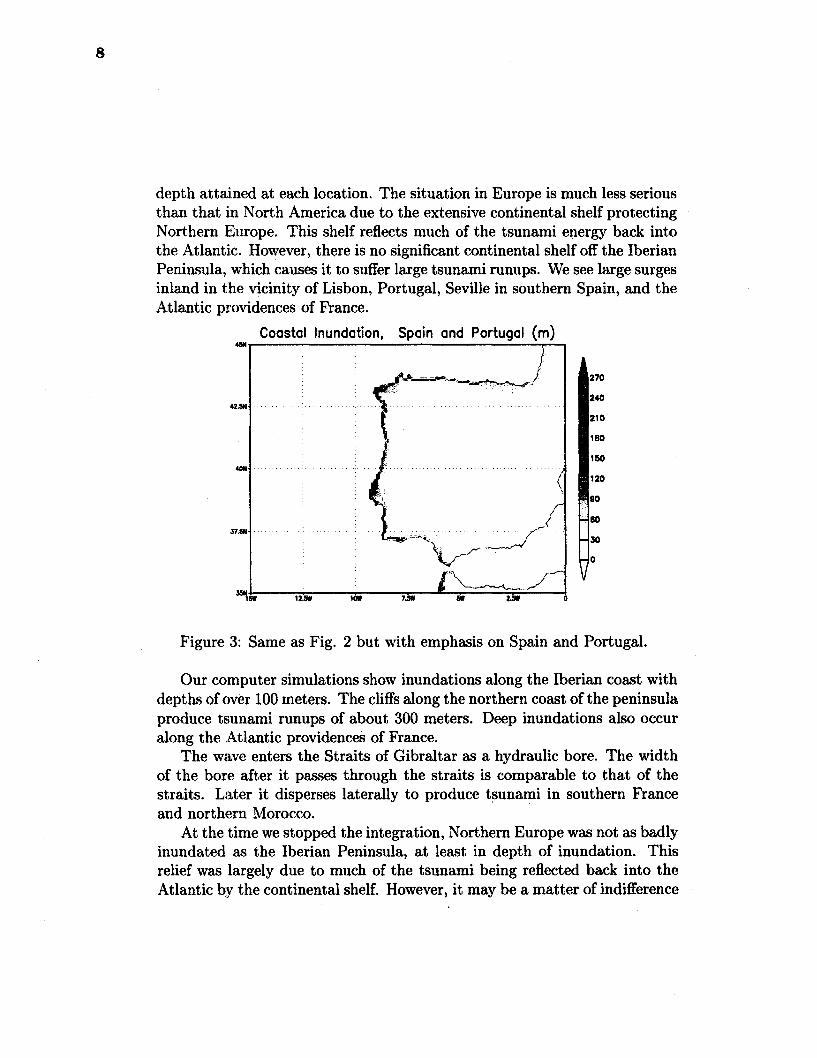
depth attaimed at each location. The situation in Europe is much less seriousthan that in North America due to the extensive continental shelf protectingNorthern Europe. This shelf reflects much of the tsunami energy back intothe Atlantic. However, there is no significant continental shelf off the IberianPeninsula, which causes it to suffer large tsunami runups. We see large surgesinland in t!hevicinity of Lisbon, Portugal, Seville in southern Spain, and theAtlantic providence of France.
Coastal Inundation, Spain and Portugal (m)w
1 I
If-~
—. -*. . j,,:.
.,. ... ,.
sw. ~~
.’(/(.
/f-3?.sn- ~~ ““%’
i/-i, ;L_.J-’
-Ww
l“u----.l12.5m 124 7.5W w 2.W o
270
MO
Ho
120
1s0
120
ao
50
30
D
Figure 3: Same as Fig. 2 but with emphasis on Spain and Portugal.
Our computer simulations show inundations along the Iberian coast withdepths of cwer 100 meters. The cliffs along the northern coast of the peninsulaproduce tsunami runups of about 300 meters. Deep inundations also occuralong the .Atlantic providence of France.
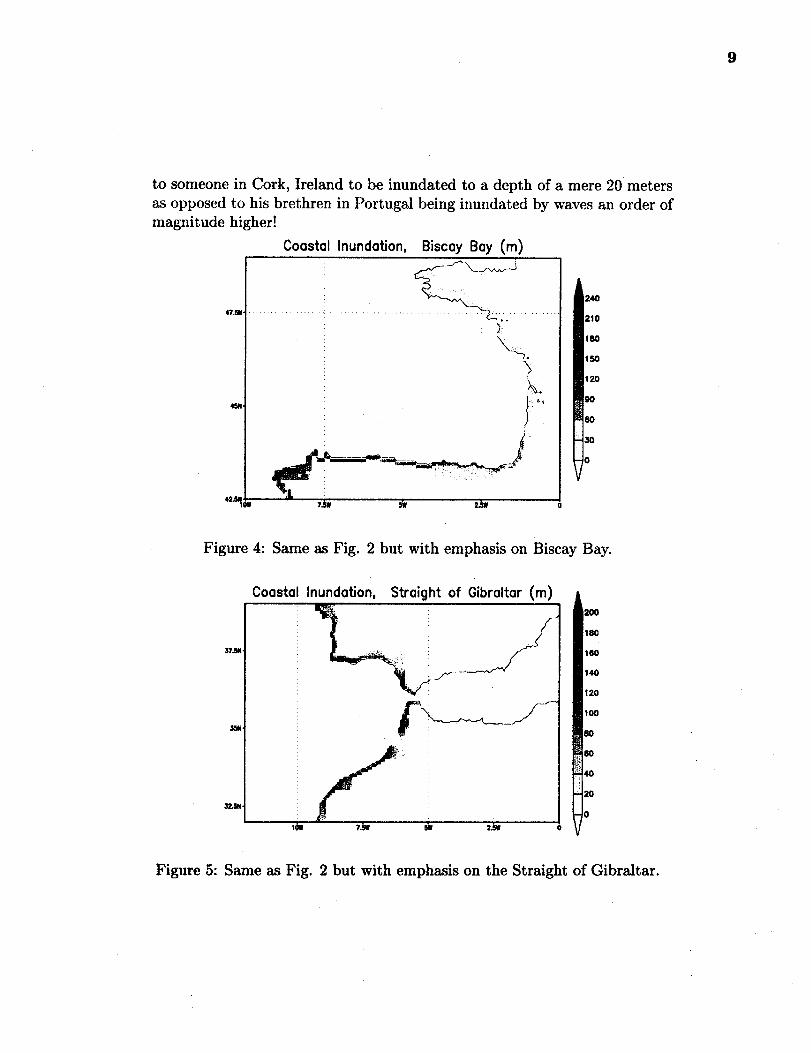
The wave enters the Straits of Gibraltar as a hydraulic bore. The widthof the bore after it passes through the straits is comparable to that of thestraits. Later it disperses laterally to produce tsunami in southern Franceand northern Morocco.
At the time we stopped the integration, Northern Europe was not as badlyinundated as the Iberian Peninsula, at least in depth of inundation. Thisrelief was largely due to much of the tsunami being reflected back into theAtlantic by the continental shelf. However, it maybe a matter of indifference
9
to someone in Cork, Ireland to be inundated to a depth of a mere 20 metersas opposed to his brethren in Portugal being inundated by waves an order ofmagnitude higher!
47.5N
45W
4=!
Coastal Inundation, Biscay Bay (m)--’-\.J#
, ~,. .->L..
\
9.l.?m *
I2.5W o
Figure 4: Same as Fig. 2 but with emphasis on Biscay Bay.
3UU
Coastal Inundation, Straight of Gibraltar (m)
/“
--.’--rS
Figure 5: Same as Fig, 2 but with emphasis on the Straight of Gibraltar.
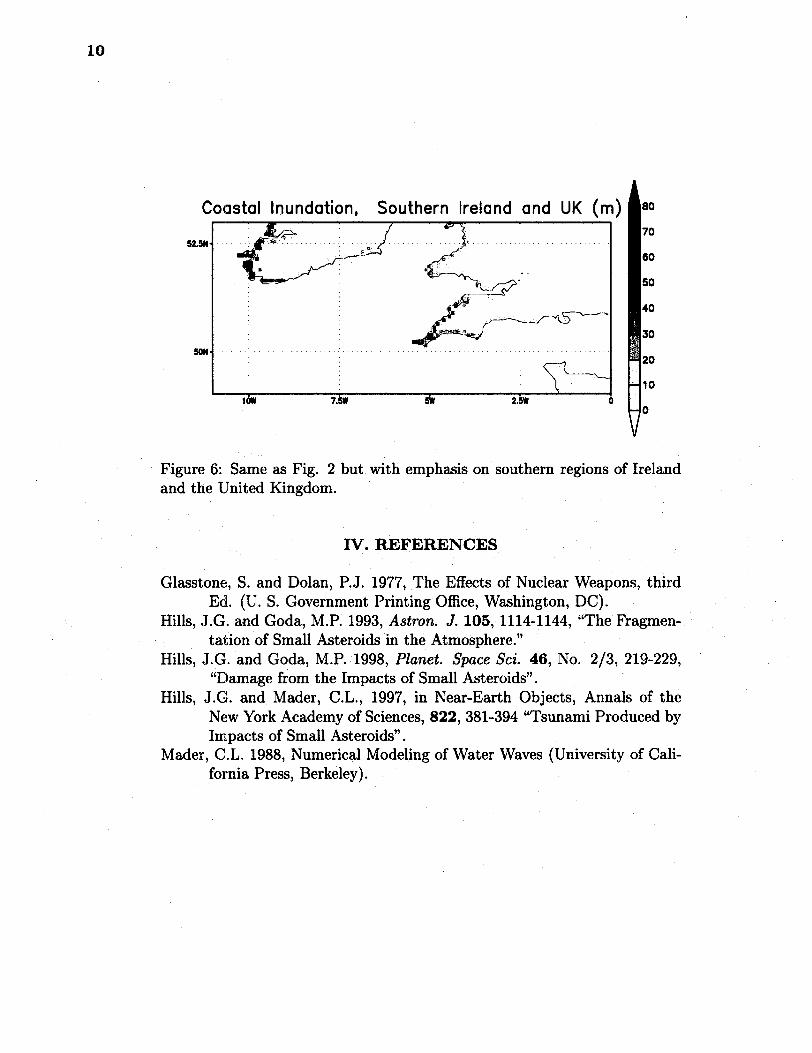
Figure 6: Same as Fig. 2 but with emphasis on southern regions of Irelandand the LJnitedKingdom.
IV. REFERENCES
Glasstone, S. and Dolan, P.J. 1977, The Effects of Nuclear Weapons, thirdEdL (U. S. Government Printing Office, Washington, DC).
Hills, J.G. and Goda, M.P. 1993, Astron. J. 105, 1114-1144, “The Fragmen-tation of Small Asteroids in the Atmosphere.”
Hills, J.G. and Goda, M.P. 1998, Planet. Space Sci 46, No. 2/3, 219-229,“Damage from the Impacts of Small Asteroids”.
Hills, J.Gr. and Mader, C.L., 1997, in Near-Earth Objects, Annals of theNew York Academy of Sciences, 822, 381-394 “Tsunami Produced byImpacts of Small Asteroids”.
Mader, C.L. 1988, Numerical Modeling of Water Waves (University of Cali-fornia Press, Berkeley).
11
ASTEROID TSUNAMI INUNDATION OF JAPAN
Charles L. Mader
Mader Consulting Co.
Honolulu, HI., U.S.A.
ABSTRACT
A study of the tsunami wave inundation to be expected from an asteroid impact withthe ocean is in progress. The recent Shoemaker-Levy-9 asteroid impact with Jupiter orthe Eltanin asteroid that impacted the Southern Pacific ocean 2.16 million years ago aretypical of the type of event being studied.
The asteroid generated cavity modeled was 120 kilometers in diameter and 5 kilometersdeep which approximates the cavity that was generated by the Eltanin asteroid or wouldhave been generated by the Shoemaker-Levy-9 asteroid.
The modeling was performed using the SWAIV code which solves the nonlinear longwave equations. The tsunami generation, propagation, and inundation was modeled usinga 2.0 minute Mercator grid of 600 by 579 cells.
The asteroid tsunami wave inundated Tokyo to 70 meters and parts of the Japan coastto 300 meters.
12
INTRODUCTION
The impact site of the Eltanin asteroid in the Southern Pacific Ocean at 57.78 S, 90.79Whasbeen described by Gersonde, Kyte, Bleil, Diekmann, Flores, Gohl, Grahl, Hagen,Kuhn, Sierro, Volker, Abermann and Bostwick in Referencel. The event took place about2.16 million years ago and could have been caused by an asteroid about 4 kilometers insize moving 20 kilometers/second.
If such an asteroid struck the ocean near Japan it would generate a tsunami wave over100 meters h~ghand with a period of over 1000 seconds in the deep ocean outside the coastof Japan. A Shoemaker-Levy-9 asteroid would generate a similar tsunami wave.
MODELING
The asteroid was assumed to interact with the ocean about 360 kilometers east of Tokyoat 35.3N and 143.3 E. The cavity generated by the asteroid was 120 kilometers in diameterand 5 kilometers deep or to the ocean floor which ever was smaller.
The modeling was performed using the SWAiV non-linear shallow water code whichincludes Coriolis and frictional effects. The S HL4N code is described in Reference 2. Thecalculations were performed on 233 Mhz Pentium personal computers with 48 megabytesof memory.
The asteroid tsunami inundation of Hawaii was modeled using the SWAN code asdescribed in Reference 3. The code was also used to study an asteroid generated tsunamibetween Hawaii and Australia as described in Reference 4.
The Japan topography was generated from the 2 minute Mercator Global Marine
Gravity topography of the earth of Sandwell and Smith of the Scripps Institute ofOceanography amd described in Reference 5. The grid was 600, by 579 cells with theleft hand corner at 31 N, 131 E, The grid extended from 31 N to 46 N and from 131 E to151 E. The time step was 3 seconds.
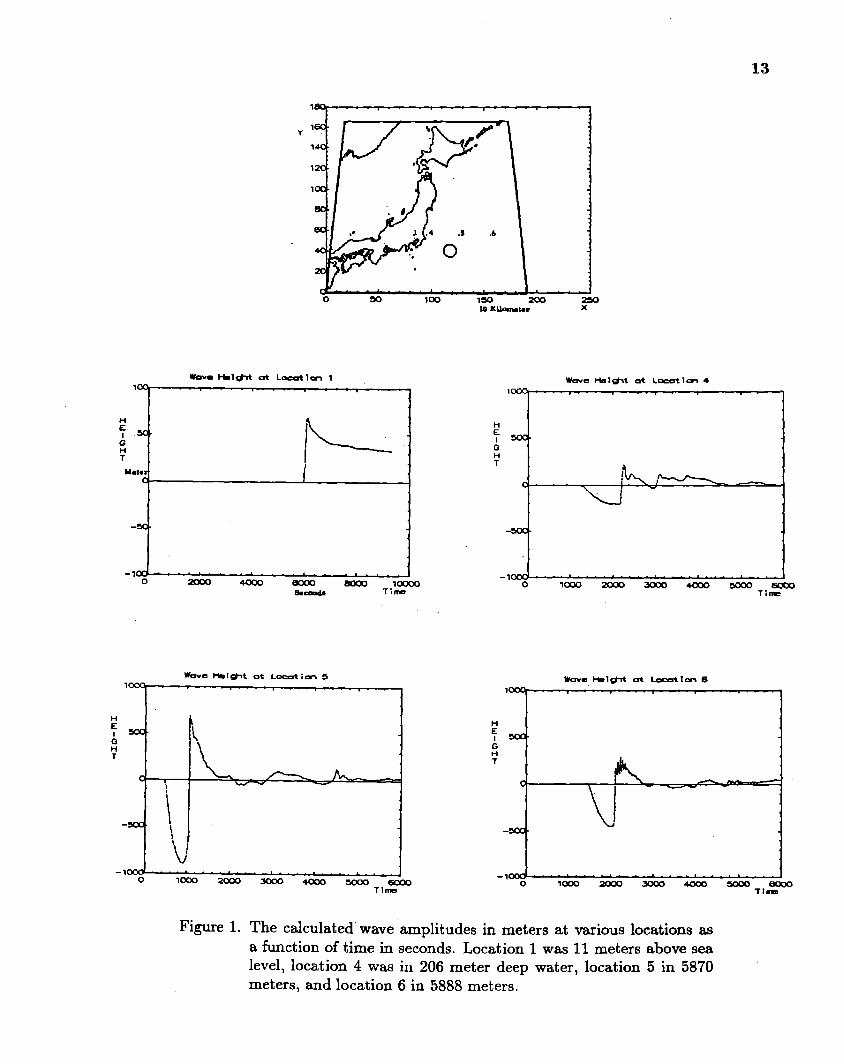
The calculated wave amplitudes at various locations as a function of time are shownin Figure 1. The axis units are time in seconds and height in meters. Location 1 was 11meters above sea level, location 4 was in 206 meter deep water, location 5 in 5870 meters,and location 6 in 5888 meters.
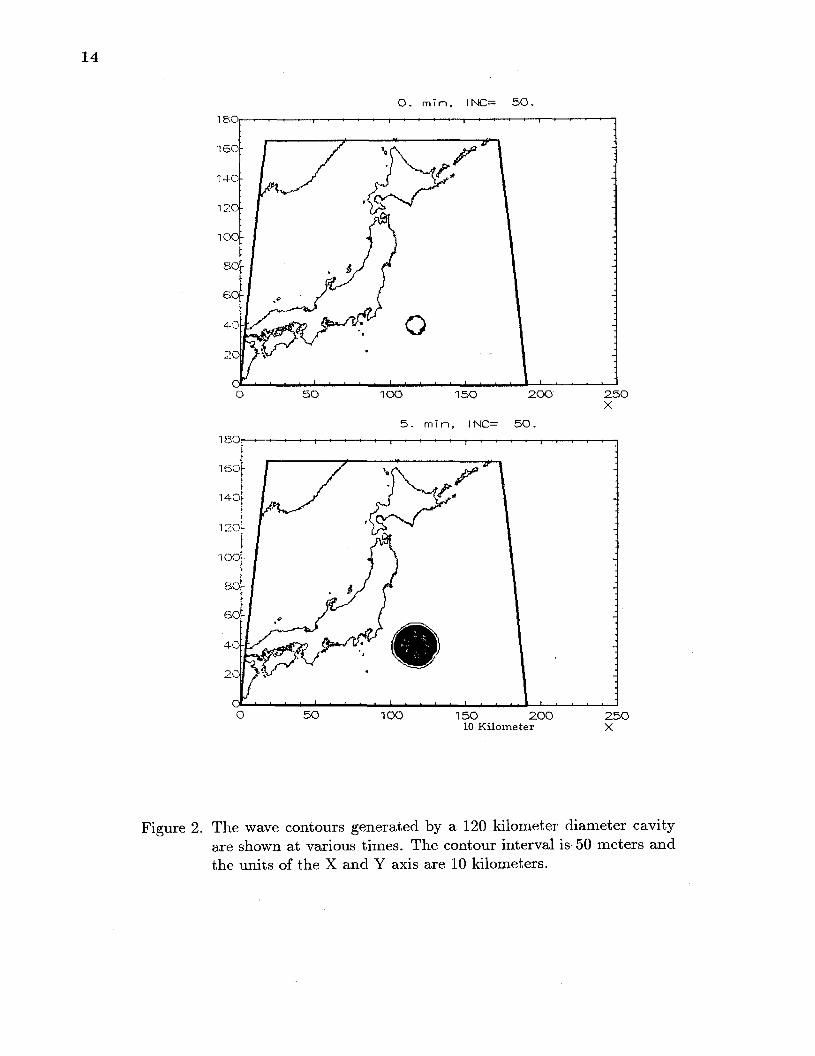
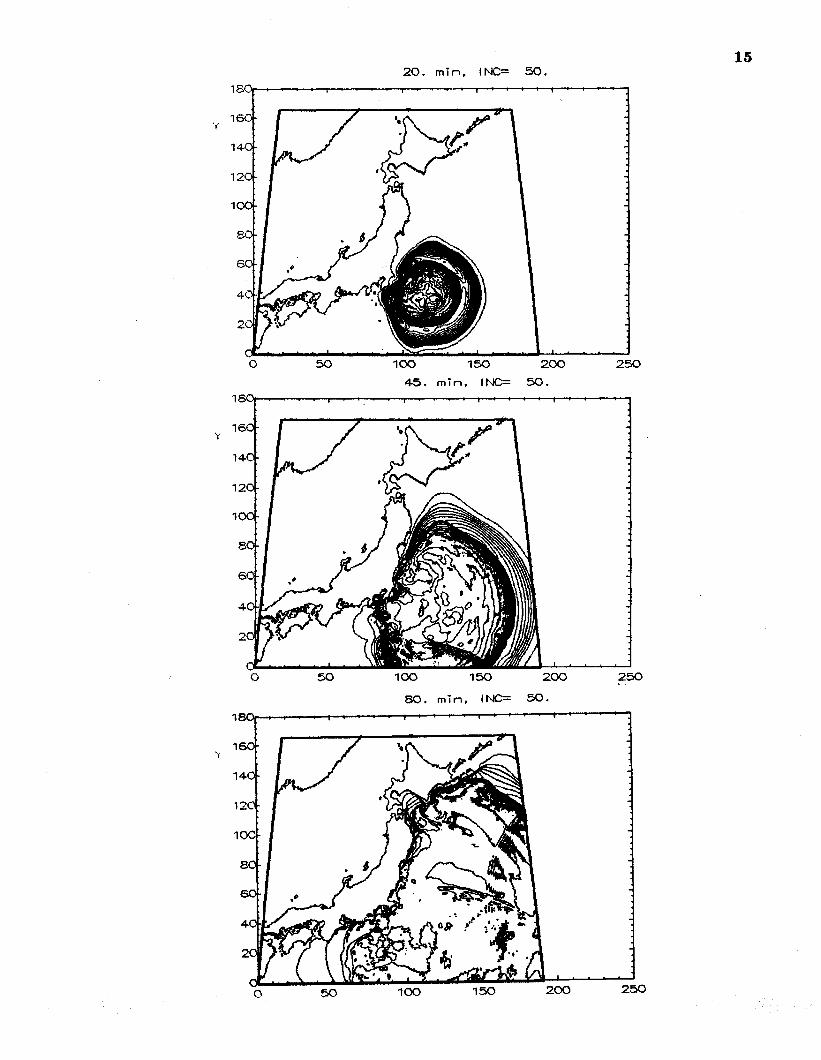
The wave cent ours are shown in Figure 2 at various times. The cent our interval is 50meters and the units of the X and Y axis are 10 kilometers.
As shown in References 2, 3, and 4 the run-up amplification is from 2 to 3 times thedeep water wave amplitude.
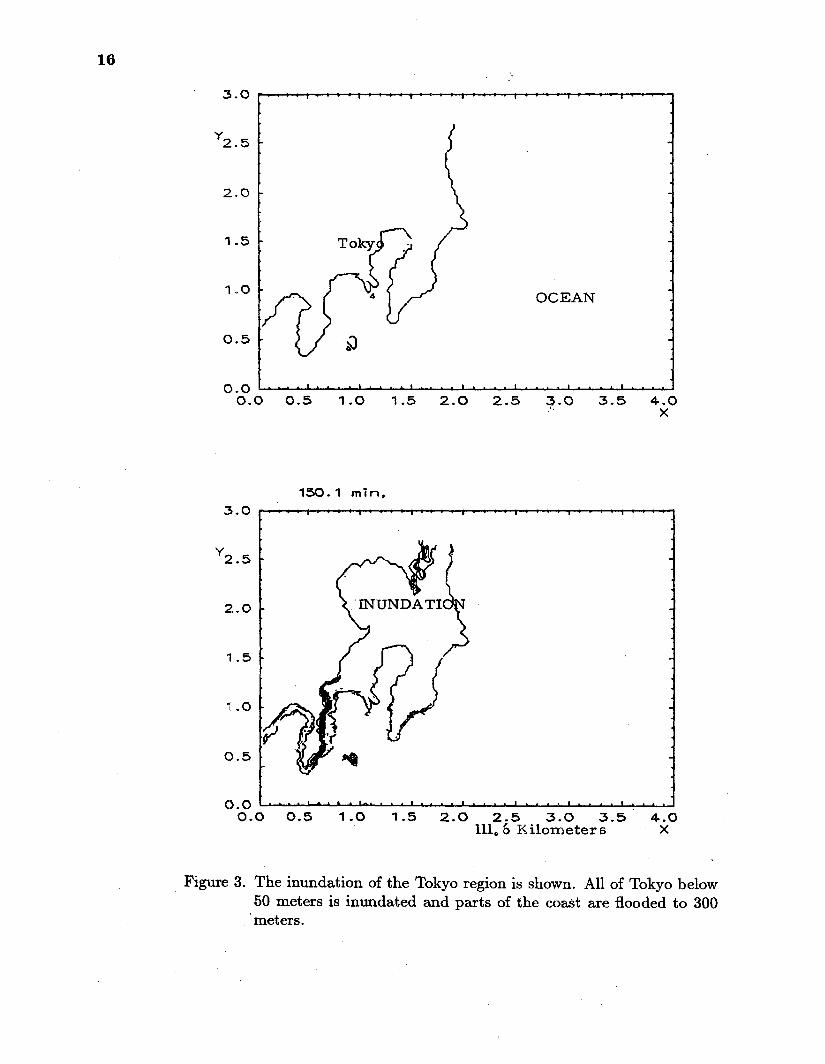
The inundation oft he Tokyo region is shown in Figure 3. All of Tokyo below 50 meters
is inundated and parts of the coast are flooded to 300 meters.Computer generated animations of these calculations are available from the author.
REFERENCES
1.
2.
3.4.
5,.
R. Gersonde, F. T. Kyte, U. Bleil, B. Diekmann, J. A. Flores, K. Gohl, G. Grahl, It. Hagen, G. Kuhn,F. J. Sierro, D. Volker, A. Abelmann, and J. A. Bostwick Geological Record and Reconstruction of theLate Pliocene Impact of the EUanin Asteroid in the Southern Ocean, Nature, 390, 357-363, November 27,
1997.
Charles L. Macler Numerical Modeling of Water Waves, University of California Press, Berkeley, California(1988).Charles L. Mader Asteroid Tsunami Inundation of Hawaiij Science of Tsunami Hazards, 14,85-88 (1996).Anthony T. Jones and Charles L. Mader Modeling of Tsunami Propagation Directed at Wave Erosion on
Southeastern Australian Coast 104,000 Years ago, Science of Tsunami Hazards, 13, 45-52 (1995).W. H. F. Smith and D. T. Sandwell, Global Seafloor Topography from Satellite Altimetry and Ship DepthpJvndzn,gs, Science, April 7, 1997.
13
HE
AHT
0
Wava I_hl+t at Ltilm 4
I Irra
Figure 1. The calculated” wave amplitudes in meters at various locations asa function of time in seconds. Location I was 11 meters above sealevel, location 4 was in 206 meter deep water, location 5 in 5870meters, and location 6 in 5888 meters.
14
0. rein, ItNC= 50.
1’501
0 50 100 150 200 250x
5. rein, IN(2= 50.
169
qLgo:
120 -r
100 -
/30 -
60 -
.
Io 50 100 150 200 250
10 Kilometer x
Figure 2. The wave contours generated by a 120 kilometer diameter cavityare shown at various times. The contour interval is 50 meters andthe units of the X and Y axis are 10 kilometers.
20. rein, INC= 50.
,.f
Y
. .I
5?
6
4
2
-o 50 100 150 200 250
45. min. IF-C= 50.
1L3c+ , , Y
i
16
14
12
1
8
6
4
2
0 50 100 150 200 250.
80. rein, I* 50.
‘~
“W--’” ZLI
100 150----Zw
3.0
‘2.5
2.0
1.5
1.!0
0.5
I t , r , 1 *
, I I I 1 I I t b0.00.0 0.5 1.0 1.5 2.0 2.5 ~.O 3.5 4.0
x
3.0
‘2.5
2..0
1.5
1.0
C).5
150.1 rein,
, , , , , , ,
I t ● 1-. 1 I 1 1 8 tC).o0.0 0.5 1.0 1.5 2.0 2.5 3.0 3.5’ 4.0
111.6 Kilometers x
The inundation ofthe Tokyo region is shown. All of Tokyo below50 meters is inundated and parts of the coast are flooded to300meters.
MODELING ‘THE ELTANIN ASTEROID TSUNAMI
Charles L. Mader
Mader Consulting Co.
Honolulu, III., U.S.A.
ABSTRACT’
The generation and propagation of a tsunami off the coast of Chile by the Eltaninasteroid about 2.16 million years ago was modeled. The tsunami wave was generated froman ocean cavity 80 kilometers wide, 150 kilometers long and 5 kilometers deep locatedat 57.78 S, 90.79 W which approximates the cavity that the Elt anin asteroid could havegenerated.
The modeling was performed using the SWAN code which solves the nonlinear longwave equations.
The tsunami generation and propagation was modeled using a 20.0 minute ETOPO gridfor the Pacific ocean.
The tsunami wave had a period of 1000 to 2000 seconds and maximum amplitudes indeep water of 80 meters off the South Coast of Chile, 65 meters in the Drake Passage, 40meters off New Zealand, 28 meters off Hawaii, 20 meters off the California coast, 30 metersin the Gulf of Alaska, and 8 meters off Japan.
If a larger asteroid similar to the KT event 65 million year ago struck at the Eltaninimpact site, the wave heights would be 130 meters off Hawaii, 40 meters off the Californiacoast, and 60 meters off Japan.
Sierro, Volker, Aberrnann and Bostwick in Reference 1. The event took place about 2.16million years ago and could have been caused by an asteroid about 4 kilometers in sizemoving 20 kilometers /seccmd. The asteroid did not make a cavity in the ocean floor nordid it result in any extinctions Such an asteroid would be expected to generate a cavityin the ocean of ZL~~rO~il~ate]~ 100 to 150 kilometer diameter. Since it did not generate acavity in the ocean floor its impact angle was proba”bly 45 degrees or less.
MODELING
The generation and propagation of the tsunami wave generated by the Eltanin Asteriodwas modeled using a 20.0 minute grid of’ the Pacific basin topography. The modeling was
performed using the SWAN non-linear shallow water code which includes Coriolis andfrictional effects. The SWAN code is described in Reference 2. The calculations wereperformed on 160 Mhz Pentium personal computers with 16 megabytes of memory. The5 minute topography from the NOAA ETOl?O 5 minute grid of the earth was used togenerate the 20 minute grid. The grid was 600 by 450 cells and the time step was 30seconds. The eastern boundary of the calculation had a small diurnal tide to keep theeastern boundary numerically stable.
The asteroid tsunami inundation of Hawaii was modeled using the $ WAN code asdescribed in Reference 3. The code was also used to ,study an asteroid generated tsunamibetween Hawaii and Australia as described in Reference 4.
The initial cavity was 4 by 4 cells or 150 by 80 kilometers which has the volume of a120 kilometer diameter cavity. The depth of the cavity was to the ocean floor which variedfrom 4951 to 5048 meters.
The calculated maximum wave amplitudes at various locations shown in Figure 1 aregiven in Table 1,.
With decreasing periods and wavelengths, the discrepancy between shallow water andNavier Stokes waves formed from initial sea displacement increases as shown in Reference5. The amplitudes in Table 1 are upper limit values and as much. as tvrice too large at longdistances of run.. As shown in References 2, 3, and 4 the run-up amplification is from 2 to3 times the deep water wave amplitude. So the calculated amplitudes in the l.Vorth Pacific.are close to the expected inundation limits.
If a large asteroid similar to the KT asteroid struck the Eltanin impact site, the cavitywould have been about 500 kilometers wide and would generate waves with the amplitudesshown in Table 2. The travel time chart for such a wave is shown in Figure 2.
In reference 6, page 163, Duncan Steel states that the comet impacts on Jupiter similarto the one t,hat occured in .July 1994 were observed in 1883, 1928, 1939 and 1948 or fivecollision events per century. Jupiter is likely to be struck about 1000 times as often asthe earth which implies that the earth will be hit every 20,000 years by an asteroid thatcould generate ii tsunami that was a hazard throughout the entire Atlantic or Pacific basin.However, as discussed in references 6 and 7 wh& large asteroids next impact the planet,tsunamis will probably be the least of the problems for life cm our earth.
19
REFERENCES
1.
2.
3.
4.
5.
6.
7.
R. Gersonde, F. T. Kyte, U. Bleil, B. Diekmann, J. A. Flores, K. Gohl, G. G&hl, R.Hagen, G. Kuhn, F. J. Sierro, D. Volker, A. Abelmann, and J. A. Bostwick GeologicalRecord and Reconstruction of the Late Pliocene Impact of the Eltanin Asteroid in theSouthern Ocean, Nature, 390,357-363, November 27, 1997.Charles L. Mader Numerical Modeling of Water Waves, Universityof &lifornia Press,Berkeley,California (1988).CharlesL. Mader Asteroid Tsunami Inundation of Hawaii, Science of Tsunami Hazards,14,85-88 (1996).Anthony T. Jones and Charles L. Mader Modeling of Tsunami Propagation Directed atWave Erosion on Southeastern Australian Coast 104,000Years ago, Science of TsunamiHazards, 13,45-52 (1995).Charles L. Mader Numerical Tsunami Propagation Study III, Science of TsunamiHazards, 11,93-108 (1993).Gerrit L. Verschurr,Impact-The Threat of Comets and Asteroids, Oxford UniversityPress (1996).Duncan Steele, Eogtie Asteroids iznd Doomsday Comets, John Wiley and Sons (1995).
/7r
--- 20
.0 I .7
%) o !30 100 130 200
yo
.. * Figure 2. The tsunami travel time hourly profiles4
.~w
u 50 700 ‘lSo 20C
Figure 1. The locations in Table 1.
TABLE 1CALCULATED DEEP WATER WAVE HEIGHTS
FOR ELTANIN TSUNAMI
Maximum MinimumNo Depth Location Amplitude Amplitude
Meters Meters Meters1234567
1A2A3A4A5A6A7A
2921405731154787506643213556
3703598930014685486945924283
Drake PassageSan Paulo, BrazilSouth ChileLima, PeruEast of New ZealandHawaiiCalifornia
Gulf of AlaskaJapanNew ZealandAustraliaNear SourceNear SourceNear Sou.nx
Meters Meters Meters1 2921 Drake Passage +220 -2401A 3703 Gulf of Alaska +60 -2602A 5989 Japan +60 -454 4787 Lima, Peru +100 -4003A 3001 New Zeahnd +200 -1606 4321 Hawaii +130 -1507 3556 California “ +40 -170
MODELING ASTERIOD IMPACT AND TSUNAMI
David A. Crawford
Sandia National LaboratoriesAlbuquerque, NM 87185-0820, U.S.A.
Charles L. Mader
Mader Consulting Co.
Honolulu, HI 96825-2860, U.S.A.
ABSTRACT
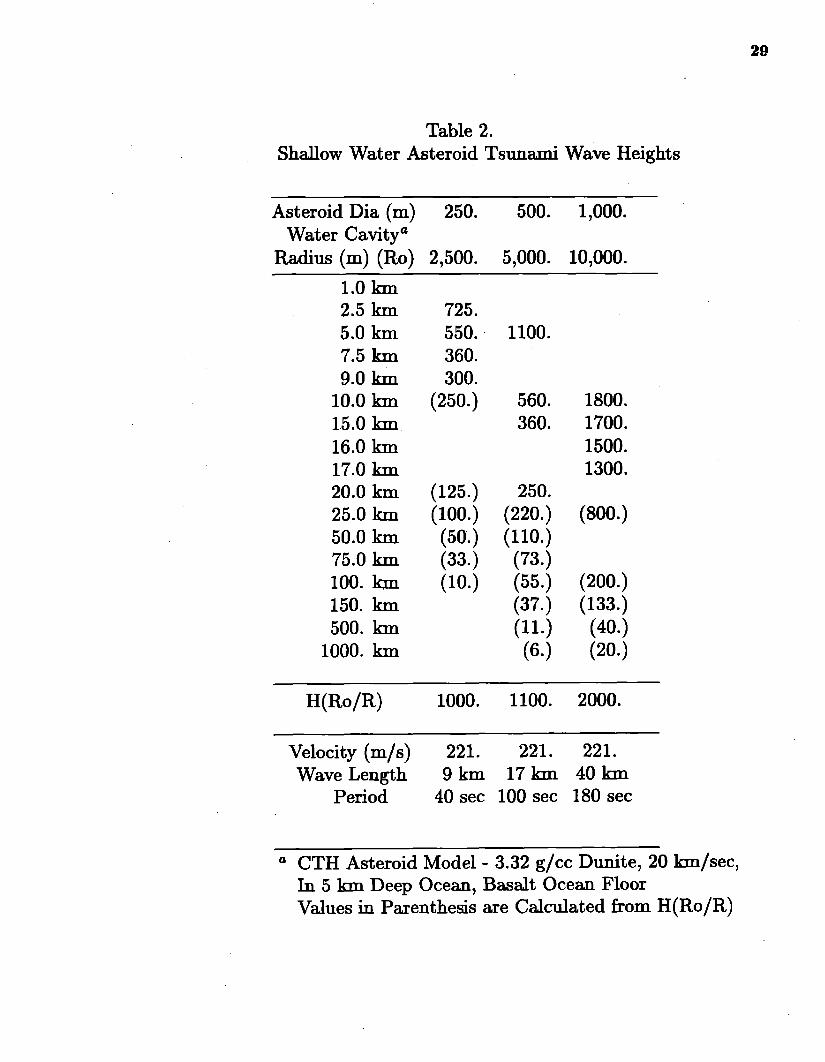
A study of the interaction of a typical stony asteroid (density of 3.32 g/cc and velocityof 20 km/see) with the atmosphere, and a 5 km deep ocean with a basalt bottom hasbeen modeled using the CTH computer code for multidimensional, multi-material, largedeformation, strong shock wave physics. Two dimensional axial symmetric calculationswere performed for up one minute of real time. This was adequate to follow the ocean cavityformation until maximum cavity size for 250, 500, and 1000 meter diameter asteroids. Themaximum hemispherical cavity size was 2500, and 5000 in radius for the 250 and 500 meterasteroid. The maximum cavity size was a 5 km deep, 10 km radius cylinder for the 1 kmdiameter asteroid.
The collapse of the cavities, the resulting tsunami waves and the propagation for upto 150 km was modeled using the the ZUNI code which solves the incompressible Navier-Stokes equations.
A 250 meter asteroid would result in less than a a 10 meter high tsunami after 60 kmof travel, a 500 meter asteroid would result in a 100 meter high wave after 30 km of traveland in a 10 meter high tsunami after 200 km of travel. The tsunami generated by a 1 kmdiameter asteroid would run 80 km before the tsunami wave amplitude was less than 100meters and 500 km before it was less than 10 meters. The tsunami period, wavelengthand velocity increases with run distante while the amplitude decreases. The tsunami waveamplitudes and velocities are less than the shallow water wave values.
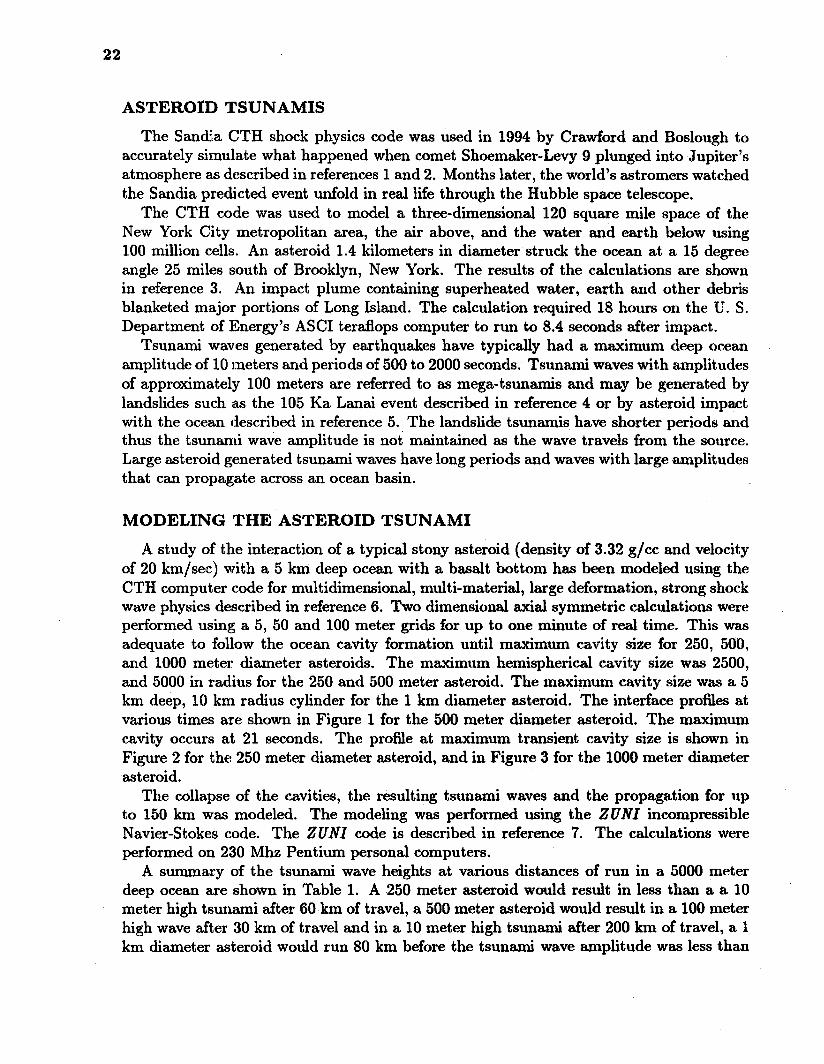
ASTEROID TSUNAMIS
The Sandia C!TH shock physics code was usedin 1994 by Crawford and Bosloughtoaccurately simulate what happened when comet Shoemaker-Levy 9 plunged into Jupiter’satmosphere as described in references 1 and 2. Months later, the world’s astromers watchedthe San&la predicted event unfold in real life through the Hubble space telescope.
The CTH code was used to model a three-dimensional 120 square mile space of theNew York City metropolitan area, the air above, and the water and earth below using100 million cells. An asteroid 1.4 kilometers in diameter struck the ocean at a 15 degreeangle 25 miles south of Brooklyn, New York. The results of the calculations are shownin reference 3. An impact plume containing superheated water, earth and other debrisblanketed major portions of Long Island. The calculation required 18 hours on the U. S.Department of Energy’s ASCI teraflops computer to run to 8.4 seconds after impact.
Tsunami waves generated by earthquakes have typically had a maximum deep oceanamplitude of 10 meters and periods of 500 to 2000 seconds. Tsunami waves with amplitudesof approximately 100 meters are referred to as mega-tsunamis and may be generated bylandslides such i~ the 105 Ka Lanai event described in reference 4 or by asteroid impactwith the ocean described in reference 5. The landslide tsunamis have shorter periods andthus the tsunami wave amplitude is not maintained as the wave travels from the source.Large asteroid generated tsunami waves have long periods and waves with large amplitudesthat can propagate across an ocean basin.
MODELING THE ASTEROID TSUNAMI
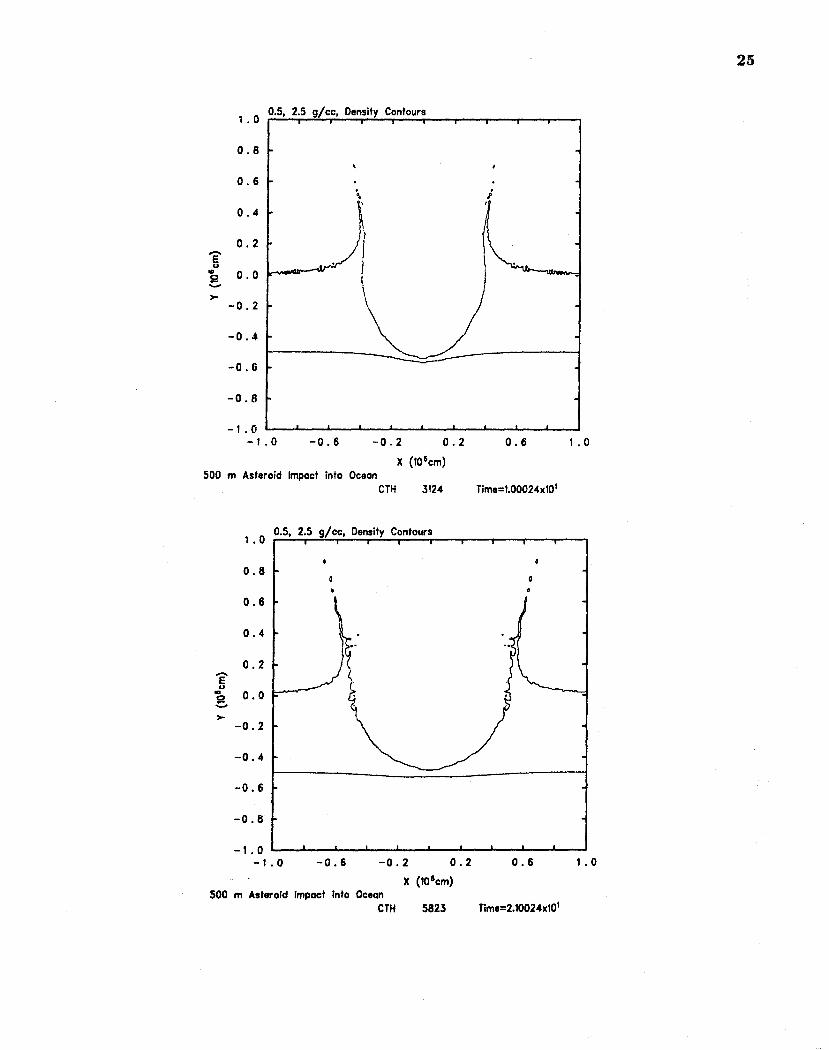
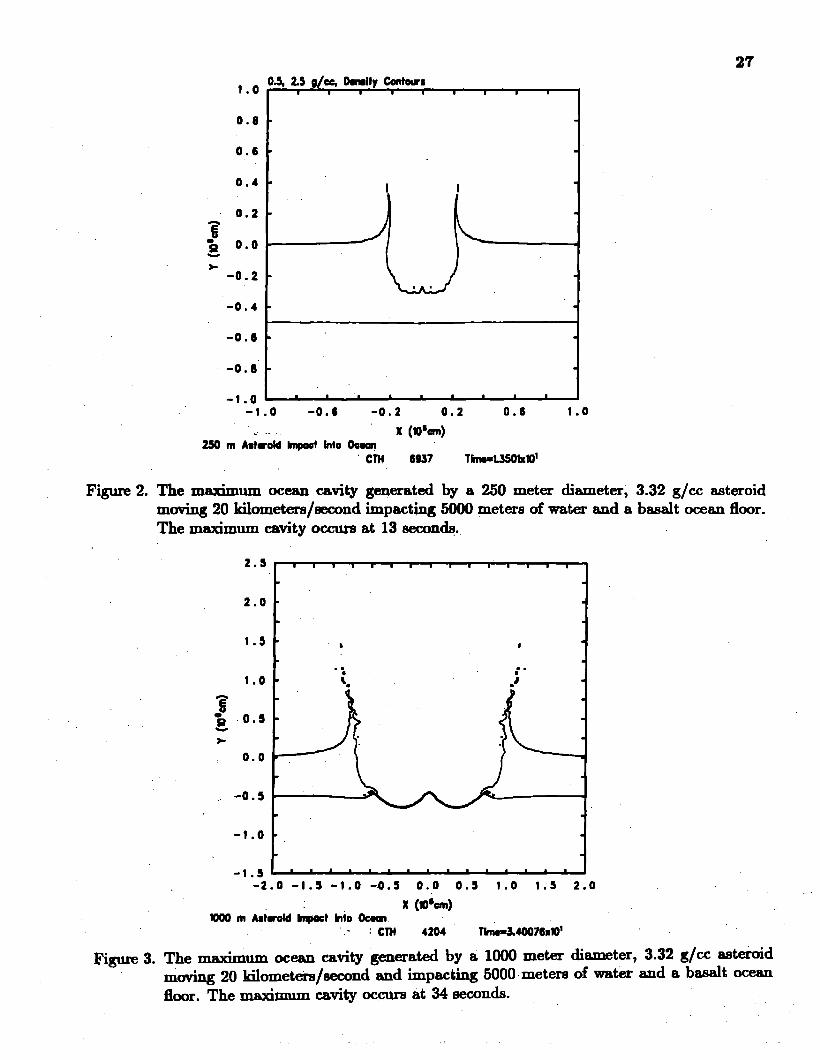
A study of the interaction of a typical stony asteroid (density of 3.32 g/cc and velocityof 20 km/see) with a 5 km deep ocean with a basalt bottom has been modeled using theCTH computer code for multidimensional, multi-material, large deformation, strong shockwave physics described in reference 6. Two dimensional axial symmetric calculations wereperformed using a 5, 50 and 100 meter grids for up to one minute of real time. This wasadequate to follow the ocean cavity formation until maximum cavity size for 250, 500,and 1000 meter diameter asteroids. The maximum hemispherical cavity size was 2500,and 5000 in radius for the 250 and 500 meter asteroid. The maximum cavity. size was a 5km deep, 10 km radius cylinder for the 1 km dki.meter asteroid. The interface profiles atvarious times are shown in Figure 1 for the 500 meter diameter asteroid. The maximumcavity occurs at 21 seconds. The proiile at maximum transient cavity size is shown inFigure 2 for the 250 meter diameter asteroid, and in Figure 3 for the 1000 meter diameterasteroid.
The collapse of the cavities, the resulting tsunami waves and the propagation for upto 150 km was modeled. The modeling was performed using the ZUM incompressibleNavier-Stokes code. The ZUAU code is described in reference 7. The calculations wereperformed on 230 Mhz Pentium personal computers.
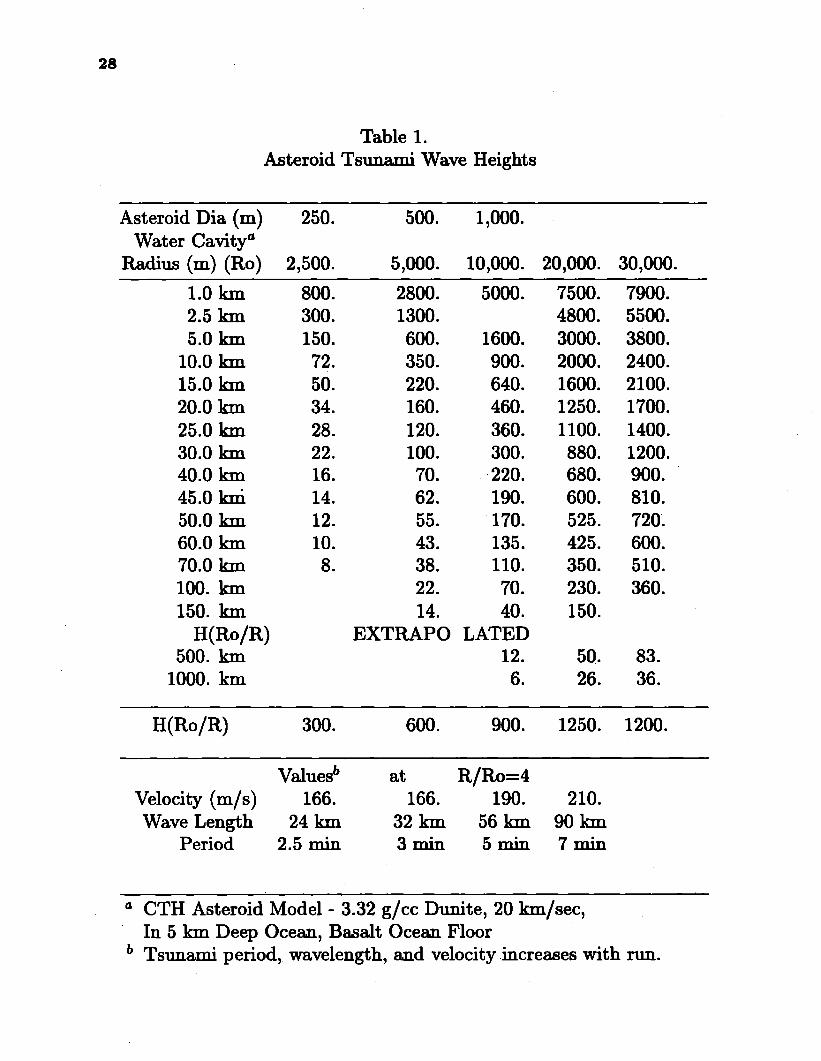
A summary of the tsunami wave heights at various distances of run in a 5000 meterdeep ocean are shown in Table 1. A 250 meter asteroid would result in less than a a 10meter high tsunami after 60 km of travel, a 500 meter asteroid would result in a 100 meterhigh wave after 30 km of travel and in a 10 meter high tsunami after 200 km of travel, a 1km diameter asteroid would run 80 km before the tsunami wave amplitude was less than
23
100 meters and 500 km before it was less than 10 meters. The tsunami period, wavelengthand velocity increases with run distance while the amplitude decreases. The tsunami waveamplitudes and velocities are less than the shallow water wave values shown in Table 2.As described in reference 7, the shallow water cavity collapses from the side while theNavier-Stokes cavity collapses primarily from the bottom. The resulting wave amplitudeafter collapse at the initial cavity radius for the Navier-Stokes cavity is less than half ofthat for the shallow water cavity.
DISCUSSION
Some of the estimates in the technical literature of tsunami wave heights generatedby asteroids are described by Verschuur in reference 8, Steel in reference 9, and Lewis inreference 10. A one kilometer stony asteroid traveling 20 kilometers/see has been estimatedto generate a 200 meter high tsunami after 1000 kilometers of run. As shown in Table 1,the tsunami wave amplitude would be about 6 meters.
A 500 meter stony asteroid has been estimated to generate a 50 to 100 meter hightsunami after 1000 kilometers of run. The wave amplitude from Table 1 would be lessthan 2 meters. If one assumes that the tsunami wave travels 1000 kilometers as a shallowwater wave, the geometrical aspect alone would lower the wave amplitude to about 5meters. The tsunami wave period after the wave has run 10 kilometers is about 3 minutesand the wave length is about 30 kilometers. In a 5 kilometer ocean this wave is not ashallow water wave.
Most tsunami waves that have been observed after traveling across the ocean haveperiods longer than 10 minutes. As shown in reference 11, this is because short wavelength tsunamis are so dispersive that as they propagate long distances, their amplitudedecreases by an order of magnitude.
The 500 meter diameter stony’ asteroid generated tsunami has been attributed in thepress and technical literature as presenting a hazard throughout the entire Atlantic orPacific basin regardless of where it impacts the ocean. It would actually require an asteroidwith a diameter greater than 2 kilometers.
The modeling of the cavity generated by the asteroid impact and the use of the maximumcavity size to calculate tsunami wave amplitudes furnishes wave amplitudes as a function ofdistance of run that are uncertain by at least a factor of two. Future modeling of asteroidgenerated tsunami waves need to be performed using numerical models that will follow thecompressible to incompressible fluid dynamics as a single continuous problem. The effectof asteroid velocity, density, composition and the state properties of the ocean floor needto be evaluated.
Acknowledgments
The authors acknowledge the encouragement and contributions of Dr. Mark Bosloughof Sandia National Laboratory, and Dr. Jack Hills, Mr. Patrick Goda, and Dr. JohndaleSolem of the Los Alamos National Laboratory. Sandia National Laboratories is amultiprogram laboratory operated by Sandia Corporation, a Lockheed Martin Company,for the United States Department of Energy under Contract DE-AC0494-AL85000.
1.0
0.8
0.6
0.4
0.2
-?#o 0.0=a-
-0.2
-0’4
-0,,6
-0,8
-1,0-i
0.5, 2.5 gicc, I)ensity Contours, 1 , r ,
n
WATER
BASALT
1 1 , 1 , : , 1 1,.
-0.6 -0.2 0.2 0.6 1.0
1 X (106cm)500 m Asteroid Impact into Ocean
CTH o Time=O.
1.0
CI.6
CI.4
*-0.2
-0.4
-().6
-0.8
-1.0-1
0.5, 2.5 gjcc, Density Contours1. , m , , , , , 1
I 1 I & , 1 1 I ,
.0 -0.6 -0.2 0.2 0.6 1.0
X (lOscm)500 m Asteroid Impact into Ocean
CTH 78S , Time=l.00054
Figurel. A 500 meter diameter, dunite asteroid moving 20 kilometers/second impacting 5000meters of water and a basalt ocean floor. The maximum cavity occurs at 21 seconds.
25
1,0
0.8
0.6
0.4
0.2
-i?muo 0.0G*
-0.2
-0,4
-0.6
-0.8
-1.0-1
,5, 2.5 g/cc, Oensity Contours1 I , , , * I I 1
.0 -0.6 -0.2 0.2 0.6 1.0
X (t05cm)500 m Asteroid Impact into Ocean
CTH 3124 Time= l.00024x10’
0.8
0.6
0.4
-0.4
-0.6
-0.8
-1.0
$ b
o 00 0
-1.0 -0.6 -0.2 0.2 0.6 1.0
X (lOscm)500 m Asteroid impact into Ocean
CTH 5823 lime= 2.10024x10’
1.0
0.0
0.6
0.4
0.2
z
-g 0“0
-0.4
-0,6
-0.8
-1.0-1
0.5, 2.5 g/a, Osndty Cwhurs1. m 1 I , 1 1 1 T
o 0.
s a
—
, , t n m 1
.0 -0.6 -0,2” 0.2 0.6 1.0
. x (Io%m)500 m Asteroid Impoct Into Ocsm
CTH 6601 Tlms=2.50025x10’
0.5, 25 g/cc, Denslly Contours1,0 ,, , , 1 u 1 1 1 ‘1 I
0.6
0.4
0.2
*-0.2
-0.4
-0.6
-0.8t
-1.0 I , , , , , 1 , , m I
---1.0 -0.6 -0.2 0.2 0.6 1.0
x (mm)S00 m AstaroId hpoct Into Ocem
., - CTH 0024. Tkns=3.00015x10’
1.0
O.a
0.6
0.4
-0.4
-0.6
-0.8
-1.0-1
1
m , 1 , I , , m I,0 -0.6 -0.2 0.2 0.6 1.0.. x (m%lll)
250m Afiddmlnto Oaaan ‘ -cm 6957 ThodSOWO’
Figure2. The maximum ocean cavity generated by a 250 meter diameter, 3.32 g/cc asteroidmoving 20 kilometers/=cond impacting 5000 meters of water and a basalt ocean floor.The maximum cavity ocm.ra at 13 seconds.
2.5
2.0
1.5
1.0
*
0.0
-0.5
-1.0
-1.5-2
, , , . u m 1 , , 1 m n m m 1
b I
. .
{. j “
a , , , , ,
.0 -1. s -1.0 -.0. s 0.0 0.5 1.0 1.5 2.0
Figure3.
x (Mkm)1000 m Aoiudd &et MO &oaI
: cm 4204 T~40076nm’
The maximum ocean cavity generated by a 1000 meter diameter, 3.32 g/cc asteroidmoving 20 kilometers/second and impacting S000 metem of water and a baaalt oceanfloor. The maximum cavi~ occurs at 34 seconds.
1.0 km 800. 2800. 5000.2.5 km 300. 1300.5.0 km 150. 600. 1600.
10.0 km 72. 350. 900.15.0 km 50. 220. 640.20.0 km 34. 160. 460.25.0 h 28. 1200 360.30.0 km 22. 100. 300.40.0 h 16. 70. 220.45.0 hi 14. 62. 190.50.0 km 12. 55. 170.60.0 km 10. 43. 135.70.0 km 8. 38. 110.100. km 22. 70.150. km 14. 40.
a CTH Asteroid Model -3.32 g/cc Dunite, 20 km/see,In 5 km Deep Ocean, Basalt Ocean FloorValues in Parenthesis are Calculated from H(Ro/R)
30
REFERENCES
1,
2.
3.4.
5.
6.
7.
8.
9.
10.11.
D.A. Crawford, M. B. Boslough, T. C. Trucano and A. C. Robinson, “The Impact ofComet Shoemaker-Levy 9 on Jupiter; Shock Waves, Vol 4, pages 47-50 (1994).-M. B. Boslough, D. A. Crawford, A. C. Robinmn, and T. G. Trucano, “Watchhg forFireballs on Jupiter,” EOS, Transactions, American Geophysical Union, Vol 75, pages305-307 (1994).Gerrit L. Vershurr Impact Hazards, Sky and Telescope, June 1998, pages 27-34.Carl Johnson and Charles L. Mader, “Modeling the 105 Ka Lanai Tsunami”, Scienmof Tsunami Hazards, Vol 11, pages 33-38 (1994).Anthony T. Jones and Charles L. Mader, “Modeling of Tsunami Propagation Directedat Wave Erosion on Southeastern Australkm Coast 104,000 Years Ago,” Science ofTsunami Hazarcls, Vol 13, pages 45-52 (1995).J. M. McGlaun and S. L. Thompson, “CTH: A Three-Dimensional Shock Wave PhysicsCode,” International Journal of Impact Engineering, Vol 10, pages 351-360 (1990).Charles L. Mader Numerica2 Mode2ing of Water Waves, University of California Press,Berkeley, California (1988).Gerrit L. Verschurr, Impact-The Threat of Comets and Asteroids, Oxford UniversityPress, page 153 (1996).Duncan Steele, Rogue AstA-oids and Doomsday C’ometi, John Wiley and Sons, page 40(1995).John S. Lewis, Bain of Iron and Ice, Addison-Wesley Publishing Co., page 150 (1996).Charles L. Madler, Dennis W. Moore, and George F. Carrier, “Numerical TsunamiPropagation Study - III”, Journal of Tsunami Hazards, pages 93-106 (1993).
31
POTENTIAL FOR LANDSLI,DE-GENERATE”D TSUNAMIS
IN HAWAII
Patricia A. Lockridge
National Geophysical Data Center
325 Broadway, Boulder, CO 80303-3328 U.S.A.
,,
,ABSTR~CT
Very large landslides off the shores of Hawaii have probably generated gigantic tsuntiin the past. Additional landslides of this type may again generate immense tsunamis thatwill inundate large portions of the islands. The mechanism(s) for tsunami generation bornlandslides is discussed. Several historical landslide-generated tsunami events are cited.The special case of landslides horn volcanic edifices is examined and historical evidencecited.
The mechanisms of iskmd building and erosion in Hawaii are reviewed. Evidenceof immense landslides that have occurred on the various islamds is presented. Knownhistorical landslide-generated tsunamis in Hawaii me described. Geological evidence oflmge prehistorical tsunamis generated by landslides are described from the literature. Theresemch using a modeling approach to recreate the generation of tsunamis from mega slidesin Hawaii is presented, and compared with the historical evidence.
L Landslide Generating TsunamisSubaerial and submarinelandslide-generatedtsunamisconstituteaclassof tsunamiswhich,
Tsunamisaremostoftengeneratedbyanimpulsiveverticaldisplacementof thewatercolumn.Our knowledge of tsunami generation is incomplete. Studies of tsunami data suggest that the size of atsunami is directly related to the size and shape of the disrupted area under water, the rate ofdisplacement, the aunount of displacement and the depth of the water in the area of generation. (6-2)Ingeneral,alandslidegeneratesatsunamiwhenthevolumeof solidmaterialentersthewaterandbulgesupat the toe of the slide displacing the water in an upward direction above the toe of the slide. As a generalrule historic landslicle-generated tsunamis, while they can be locally devastating, lack the energy to travellarge distances. However, the volume of material involved in these slides is relatively small and the amountof ocean displacement is correspondingly small. (7-191)
The basic cause of landslide tsunamis is the failure of over-steepened deposits or slopes above orbelow the water surface. Once unstable conditions exist the failure can be triggered by any of severalagents such as earthquakes, volcanic activity, rain (which increases the mass and reduces the friction), andcontinued deposition or progressive failure from creep. Once the slide material has been released, theresulting wave depends on the kinetic energy in the slide, the volume and geometry of the affected body ofwater, and other factors such as the depth of water in the slide area. When subaerial landslides impact abody of water, both a surge or splash and a tsunami are generated. The surge is not part of the tsunami asdefined here since its velocity is kinetically-generated rather than gravitational in nature. Its velocity doesnot depend on the depth of the body of water. However, the displacement of the water does create a truetsunami in addition to the splash. (7-188)
For example, on July 10, 1958, a M, magnitude 7.9 earthquake set in motion a 30 million m3 sl;dethat was released from 200-1000 m above Gilbert Inlet, Lituya Bay, southern Alaska, and sped down slopesof about 40° on the east side of the inlet. The impact of the slide on the water sent a surge (splash) acrossthe inlet to the opposite point of land, clearing the forest to a height of 524 m. The resulting tsunami was 30to 50 meters high near the middle of Lituya Bay. (7-189) The tsunami overtopped Cenotaph Island and LaChausse Spit at the mouth of the bay clearing trees as it passed over. The wave collapsed when it reachedthe open Pacific. It was barely recorded in Hilo, Hawaii, with a peak-to-trough height of 0.1 m (6-101).
Collapses of volcanic edifices have also generated documented tsunamis. In fact, of elevenvolcanic events that generated large tsunamis, eight of these were connected with some type of majordeformation of the volcano itself. (9-4) In 1792, a 535 million m3portion of Unzen Volcano, Japan,collapsed. The collapsed area was located some 4 km from the vents which had been active a month or twoearlier. The “col& collapse and resulting landslide were probably caused by an earthquake “swarm” thatacomprmied the withdrawal of magma from the magma chamber within the volcano. The landslide-generated waves reached a height of about 10 m and caused devastation for a distance of 77 km along theShimabara peninsula on north Kyushu Island. Fifteen thousand people were killed or disappeared without atrace, and 6,200 hcuses were destroyed. (7-190)
.-”_. .
An explosion on October 6, 1883, of the summit of the St. Augustine volcano in Alaska generateda debris avalanche which, in turn produced a tsunami wave of 7.6 to 9.1 m. It reached English Bay (85 kmto the east) about 1!5minutes later and nearly destroyed the community. (7-190)
II. Documented Landslide-related Tsunami Events in HawaiiThere have been a number of tsunami events in Hawaii in historical times that have landslides as
their generating mechanism. On October 2, 1919, an eruption of Mauna Loa produced a stream of lava
33 “’
which reached the sea near Alti creating a <a The submarine extension of the flow became unstable intheretie environmentandcollapsedbeneaththeseasurface,creadnga4.3mwavewhichcausedminordamageandsweptseveralpeopleouttosea ‘I13eywerelaterreseued.(7-190)
Subsidence and prhapa an offkhore landslide played a part in a tsunami rhat occurrd on the Islandof Hawaii on April Z 1868. Subsidenm on the entire southeastern sham of the island was accompanied by ●
ao earthquake. This earthquake was apparently related to the incremental movement of a giant slump (14-259) The tsunami associated with the event rose to a height of 20 m and depited mbbish and timberinland a distance of 0.4 km. This tsunami resulted in 47 deaths in Hawaii. The waves were measured onthe west coast of the United States about five houra later but wem only about 10 cm in height (San Diego).(3-102)
Mom than one hundred years later on November 29, 1975, a sudden movement of the seafloor offthe southeast coast of Hawaii mampanied a w 7.2 magnitude emdqmke. Coincident with theearthquake, a 60 km length of Kilauca’s soud3 shoreline subsided more than a meter. The wave height inthis area was 7.6 m and may have ken augmented by rhe subsidence. Of 32 campem in this areaj 19 wereinjured md 2 were killed. (3-107) Lilm the 1868 eventi the 1975 event may have been related to movementon a slump that was deeply rooted in rhe volcanic edifice and may have extendd back to b volcanic riftzone reaching a thickness of 10 km. A 60 km length of Kilauea’s south coast subsided 3.5 m and movedseawtud 8 m. The material involved in these slumps may have abruptly surged forward resulting in theearthquakes and the tsunamis. (12127)
m PraMatorieal Lm&tkk on Volcadc IaiamhRecent sonar imagery reveals that this type of movement of large portions of the volcanic edifices
has occurred not once but qe.at.dy in Hawaii. Abut 70 major landslides over 20 Ian in length weredetected by Gloria sidescan somu studies done in the 1980s. Some of these slides attain lengths of almost250 km along the seaflcmr of the Hawaiian Wep, and volumes exceed 5,CKXlkm3. They are among thelargest slides on the planeL (1346). AU are uaceable back to the steep slopes of the volcanoes from whichthey slid. ‘he larger deposits are estimated to have volumes of about 5,000 hn3. For atypical volcano, thisimplies thatthe equivalent ofab10ck20kmby 20 bnormore inareaand the ftdldepthof theticehasbeen removed. (2-195)
A. Mechadsm ofPreMatorical Iadali& FonuaUonHow did such large movements of material on the pdmetms of the volcanic edifices come about?
-hoftievola- intie~wtictin mtimti~flm. Aitheqreddtheopening in the neck of the volcano, it was spewed mt on the floor of the ocean. This quick-coding of themagmaresultedintheformadonof crumbly pillow lava ‘Ibis pnxeas continueduntilthevolcanoreachedthesurfaceof the sea l%en the extruded lava formed a ~ heavy cap over abuild-upof thousands ofmeters of crumbly, StE4UIFdUlttCd, vokanic &bris that WSS erupted beneath the * of tk sea. As thevolcano grew it also@ out ad sank in response to the @of gravity. llie lava continued to build thevolcano adding weight to the top. When the preasum of the weight of matdal on top exceeded the slrengthof the crumbly material below, a portion of lhe ed&e failed. Renewed volqnic activity may resultwhen
tie~ofti~ovm mofvoltictiti~ bmtieti. One failure model argues Ihatthepressure Ofmagma in dikes pushes the edifice outwmd! causing the Ovemeepeniug of the Volciino’sslopesthat in turn results in slumping and Iandsliding. Another model suggmts that the height of the volcaao is thefundamental variable in determining the sliding potential. An hwrease in height_ a similar increasein the steepkss of the slope and in the weight of material mating on the volcano’s crumbly titericw. (2-195,1%) ‘he largest landslides apparently occur late in the period of active shieldgrowthwlm the.volaitwesare close to their maximum size, but are stiU active with growth and with seismic tivity. (12-125) ~
volcarloes, particularly those with steep slopes and those that have bases below ~ ICV61,am~..
likely to have internal features that reflect numerous surf- of slip and large regions of intesnal instability. ~ “’Molten rock aud fhctures also produoe”areas of weakms. A volcano contains many natural breakpointsupon which several types of landslides or debris flows can Hun
On a smaller, more localized level, debris avrdanches, like those that occurred at the Mount St.Helens eruption may tumble down the submerged flanks of the volcanic islands generating local tsunamis.These medium sized landslides having volumes measuring tens of cubic kilometers are common inshallower water. (12-125) Debris avalanches aiTectmore limited areas on the surface of island flanks thando the giantslumps. These avalanches are longer, thimer, and not as steep. Hummocky terrain containinglarger unbroken blocks of the slides is found in the outermost part of the slide area The distal end oftenmoves up the slope of the Hawaiian Arch for distances as much as tens of kilometers. These debrisavalanches resemble the volcanic landslides produced in 1980 at Mount St. Helens, and must have movedmpidly as did the material in the Mount St. Helens avalanche. (12-131) This type of rapid movement ofmaterial into and beneath the surface of the sea would undoubtedly have produced a tsunami.
Rapidly moving avalanches that move blocks up to 10 km in size for distances of up to ten meterswould produce major disturbances in the water column which could generate giant tsunamis (13-46). Someslides have been known to plunge into the sea with enough momentum to spread material more than 166.7km across the mean floor (4-33,34) or even down into tbe Hawaiian Trough and up the flank of theHawaiian Arch.
On a much larger (and also more infrequent) scale a third or more of an entire island can sink (andhas) beneath the waves in a single slide. Such island blocks may reach 2030 km in dimension and two tothree km in thickness. (1- 287) This greater threat is posed by the vertical movement of large segments ofthe volcano itself near its base that can generate earthquakes far more powerful than those “volcanic”earthquakes that accompany movement of the magma within the edifices. In cases where a large section ofthe undemmter portion of the volcano is displaced, the potential for the generation of very large tsunarni-Iike waves that may pose a serious threat to ccmstal areas far from the islands themselves. (2-196). Thelargest of these landslides take place when a volcano grows to maximum size. They occur with inter-eventtimes of around 300,000 or 400,000 years. (4-33,34)
B. Specific example of PreWtoricalLargeLandslides1. h Hawaii
a BigIalaml‘AlikaSlidel%is,most=nt of the huge Hawaiian slides, probably slipped off the west
flank of Mauna Loa Volcano 105,000 years ago. lle huge cliff to the north in Pu’uhonua OHonaunau National Historical Park is probably the scarp of this enormous landslide. The landslidemay have generated the giant tsunami that scrubbed the soil off the island of Kaho’olaw to theheight of 242 meters aad washed blocks of coral even higher up the side of the island of Lana’i.(4-105)
The Ninole Hills maybe eroded remnants of an older version of Mauna Loa thatcollapsed thousands of years ago. A giant landslide may have tom away the southern flanks ofthese hills. (4-99)
Big slices of Kilauea’s south flank are slumping into the ocean along a series of faults.Some of the scarps are as much as a 300 meters high. tiasional swarms of earthquakes confirmthe continuing collapse. Submarine surveys show the area measure-s83 km long and 67 km wide.(4-53)
b. Lma’iClark Slide. A landslide may have completely removed the former summit of Lana’i,
and the pnxwnt island appears to k the northeastern flank of a once much larger volcano. Sonarmapa of the ocean floor reveal a large rock mass stretching nearly 116.7 km from the southwestcoast of Lana’i spreading into two huge lobes where it enters the Hawaib Deep. This greatdistance suggesta that the material must have been moving very fast. (4-176) A steep face of a136,4 meter-high bench along the eastern edge of Palawai Basin is thought to be one of the
35
headwall scarps of the Clark Slide. If so, a big piece of the western side of Lana’i also dropped asmuch as 41 meters,but not into the ocean. (4-177)
c. Moioka’iWailau Slide. As volcanic activity came to an end, the northern half of the caldera on
East Moloka’i disappeared into the ocean in the Wailau Slide. That the slide was moving rapidlyis evidenced by the fact that it scattered fragments nearly 166.7 km north across the HawaiianDeep, in a strip 41.7 km wide. (4-192, 193) The s&r it left behind is the towering sea cliff alongthe island’s north shore, the highest and quite possibly the most spectacular shoreline cliff in theworld (Kalauupapa Overlook). It rises almost vertically 1,121 meters out of the sea. Islets and seastacks along the base show that waves have eroded the cliff at least a short distance inland. Largestream valleys have cut across the cliff face to a depth of nearly 1,818 meters below present daysea level. They were eroded when the island stood much higher, and became submerged as it sank.Obviously, the great cliff was then 1,818 meters higher, too. Adding the distance the scarp extendsabove sea level (1, 121 m) to the depth of the stream valley would put the height of the greatlandslide scarp at over 2,727 meters! The Wailau Slide is the third largest slide identified inHawaiian waters, after the North Kaua’i and Nu’uanu slides. According to James Moore (U.S.Geological Survey) the volume of the slide corresponds to the amount of lava the Hawaiian hotspot would erupt in 10,000 years at its current rate. (4-192)
d. (yakKa’ena Slide. The north flank of Wai’anae on the leeward coast of Oahu was also
unstable. The Ka’ena Slide moved nearly 116.7 km across the deep ocean floor and formed anunderwater escarpment parallel to the North Shore between Ka’ena Point and Waialua. Thedismnce traveled by this slide indicated that it must have been traveling extremely fast. This slidemay have been a catastrophic event, the kind that generates enormous tsunamis. (4-210)
Nu’uanu Slide. The unsupported eastern flank of Ko’olau Volcano sloped steeply intothe deep ocean. This steep eastern flank on Ko’olau must have swelled as magma rose into thevolcano, then deflated as it erupted. Those movements may have helped destabilize the easternflank enough to cause the Nu’uanu Slide, one of the largest known slides on Earth. It amputated alarge area of eastern O’ahu and sped across the sea floor, laying down a bed of rubble 3.3 m wideand extending for 200 km and up the slope of the Hawaiian Arch. A single block in this slidedebris is 30 km long and 1.7 km wide. The size of the fragments and the distance that they traveledindicate great momentum and speed—both conditions needed for tsunami generation. (4-212)
e. Kaua’iSonar seems to show large pieces that broke off the eastern part of the island and slid into
the ocean. One mass moved north, the other south. Debris from them swept up the slope of theHawaiian Arch, as far as 100 km from Kaua’i. Rapid movement appears to offer the bestexplanation for the sonar features. (4-255, 256)
f. Ni’ihauNi’ihau was once a much larger island, as is evidenced by the towering cliff on the eastern
flank of the island. The cliff is the headwall of a slide that detached a large section of the island,anddumped it into the ocean hundreds of thousands of years ago. Only a small remnant of theoriginal western flank remains above sea level. (4-285)
2. Onother Marine Volcanic IslandsHawaii is not the only place where such giant earth movements may have taken place. Multi-beam
bathymetric maps reveal evidence of numerous large scale landslides on the Emperor and Michelson
,
#
36
Ridges, on the Map Makersand Marcus-Wake sea mounts. Re-examination of Gloria images has shownthe presence of landslides on the submarine slopes of the Canary Islands and Tristan de Chuna. TheMarquesas volcanoes also appear to have undergone major collapses. These landslides have occurred onthe flanks of ocear~icvolcanoes regardless of island size, geologic age, and climate. (12-141)
C. Modeling of Prehistorical Landslides in HawaiiCaution must be exercised, however, in concluding that these huge landslides will, when they
occur, generate very large tsunamis. Using modeling techniques Jones and Mader found that “for theassumed landslide model to obtain the necessary run-up, a volume of 1,600 km3 greater than twice thelikely volume of the Alika 2 debris avalanche is required.” (5-46) LeBlond and Jones further concludethat an error is introduced when calculations of the size of tsunami waves generated assume that thelandsliding mass behaved like a rigid body. (8-25)
IV. Giant Slide Generated TsunamisA. In Hawaii
Is there evidence that such giant tsunamis or waves have been generated by landslides in Hawaii?In 1984, Moore and Moore identified tsunami-like deposits almost 400 m above sea level on the Hawaiianisland of Lana’ i. The Hulope Gravel is a deposit of boulders, coral fragments, and calcareous beach rockslabs. Near the top of the deposit are sand and shell fragments. Remains of this deposit can be found at 375m on the Island of Lanai. (11-1312) The Hulope Gravel consists of three beds each two to four metersthick which may have been laid down by successive waves. (10-101)
B. In Areas Remote to HawaiiYoung and Bryant proposed that erosive features found along the sea shore of southeastern
Australia, 7,000 km away were produced by the same giant wave that deposited the Hulope Gravel. (15-199) They state: “Sand barriers along the coast of southern New South Wales, dating from the lastinterglacial period, have been almost completely destroyed, most probably by a catastrophic tsunami.Evidence for catastrophic wave erosion can also be traced to heights of at least 15 m above present sea levelon coastal abrasicm ramps. These erosional features lie above the range of effective erosion by
.
contemporary storm waves and cannot be attributed to [fluctuations in sea level.] Chronological evidencefor the timing of the destruction of the last interglacial barriers suggests that tsunamis generated by thesubmarine slide off Lanai in the Hawaiian Islands 105 ka traveled across the Pacific and eroded this coast.”(15-199)
V. Potential for Slides of the Future to Generate large TsunamisThe volume of the slide into Lituya Bay that generated a 50 m tsunami locally was 30 million m3
while the slides off the shores of Hawaii are up to (125 billion m3) 5,000 km3 in size. The size of the debrisavalanches (landslides) that have occurred in Hawaii are one hundred thousand times the volume thatoccurred in this slide. The slide at Unzen Volcano that generated a tsunami that, in turn, killed 15,000people at Shimalmra, Japan, is dwarfed by these volcanic slides and slumps. ( 535 million m3 as opposed to[125 billion m3] 5,000 km3) It is true that the slide into Lituya Bay hardly generated a ripple outside thatbay, but what if the slide had been a [a thousand] hundred thousand times bigger? And what if it hadoccurred in the open ocean instead of an enclosed bay? It is difficult to believe that coastal areas on theperimeter of the ocean basin would not have been effected. The speed with which the ocean floor ischanged is also certainly an important factor in tsunami generation. Many of these slides appear to havetraveled at great speeds. Obviously these events are very rare. However, when one takes into considerationthe number of vclcanic islands in the oceans of Earth and the massive potential size of the slides, thetsunami threat becomes one that cannot be ignored. Clearly one must exercise caution when concluding thathuge tsunamis have been generated in Hawaii by landslides and slumps. However, taking into considerationthe historical evidence alone certainly brings one to the conclusion that such tsunamis would, at least, belocally devastating. Recall that the work of Young and Bryant suggests that they have found evidence on thesoutheastern coast of Australia that giant waves generated in the Hawaiian Islands may have traveled toshores more than 7,000 km away.
37
References
1. Borgia, A. &B. Treves, 1992. Volcanic plates overriding the ocean crust; structure and dynamics ofHawaiian volcanoes, Ophiolites and their Modem Oceanic Analogues, Geological Socieq SpecialPublication No. 60, The Geological Society, London, 60:277-299.
2. Delaney, Paul T., May 1992. You can pile it only so high, Nature, Vol. 357:194,195.
3. Dudley, Walter C. and Min Lee, 1988. Tsunami/, University of Hawaii Press, Honolulu, Hawaii,.
4. Hazlett, Richard W. and Donald W. Hyndman, 1996. Roadside Geology ofklawaii, Mountain PressPublishing Company, Missoula, Montana.
5. Jones, Anthony T. and Charles L. Mader, 1995. Modeling of tsunami propagation directed at waveerosion on southeastern Australia coast 105,000 years ago, Science of Tsunami Hazards, The TsunamiSociety, 13:45-53.
6. Lander, James F. and Patricia A. Lockridge, August 1989. United States Tsunamis (Including UnitedStates Possessions), 1690-1988, National Geophysical Data Center.
7. Lander, James F., Patricia A. Lockridge, and Herbert Meyers, 1988. Subaerial and Submarine LandslideGenerated Tsunamis, Panel of Wind and Seismic Effects, US-Japan, U.S. Department of Commerce,National Bureau of Standards NGISR- 88-37703, Gaithersburg, MD, p. 187-199.
8. LeBlond, Paul H. and Anthony T. Jones, 1995. Underwater landslides ineffective at tsunami generation.Science of Tsunami Hazards, The Tsunami Society 13:25-26.
9. Lockridge, Patricia A., Non-Seismic Phenomena in the Generation and Augmentation of Tsunamis,Unpublished Manuscript.
10. Moore, George W. and James G. Moore, 1988. Large-scale bedforms in boulder gravel produced bygiant waves in Hawaii.. Geological Society of America, Special Paper 229:101-110.
11. Moore, James G., and George W. Moore, 1984. Deposit from a Giant Wave on the Island of Lanai,Hawaii, Science, 226:1312-1315.
12. Moore, James G., William R. Normark, and Robin T. Holcomb, 1994. Giant Hawaiian Landslides,Annual Review of Earth and Planetary Science, 22:119-144.
13. Moore, James G., William R. Normark, and Robin T. Holcomb, April 1994. Giant HawaiianUnderwater Landslides, Science, 264:46,47.
14. Moore, J.G. and R. K. Mark, 1992. Morphology of the Island of Hawaii, GSA To&y, 2:257-59.
15. Young, R.W. and E.A. Bryant, March, 1992. Catastrophic wave erosion on the southeastern coast ofAustralia Impact of the Lanai tsunamis ca. 105 ka? Geology, 20:199-202.
39
THE NEW TSUNAMI WARNING SYSTEM OF
THE JAPAN METEROLOGICAL AGENCY
Hidee Tatehata
Earthquake and Tsunami Observation Division
Seismological and Volcanological Department
Japan Meteorological Agency
1-3-4 Ote-machi, Chiyoda-ku, Tokyo 100 Japan
ABSTRACT
Since 1941, the Japan Meteorological Agency (JMA) has conducted tsunami forecastingfor our country, which frequently has suffered considerable losses from tsunamis. However,huge tsunamis still cause damage and kill many people; for example, the Japan SeaEarthquake Tsunami (May 26, 1983, M=7.7) and the Hoktildo Nanseioki Tsunami (July12, 1993, M=7.8). These experiences caused the development of more prompt and accuratetsunami forecasting for the purpose of survival, as in Darwin’s Theory of Evolution. Thenew system has the following three sections:
● New seismograph network and P-wave magnitude determination.● Rapid interpolation numerical tsunami model.● Satellite based system for dissemination of information.
The establishment of the new seismograph network and the satellite-based disseminationsystem were completed in 1994. The fast numerical tsunami model is scheduled to becompleted within a few years. In this paper, the new system and procedures are described,especially the fast numerical tsunami model in detail, because it should be the first real-time application of a numerical tsunami forcast in the world. Recently, the fast calculationand accuracy of tsunami forcast by this numerical model has been confirmed through theanalysis of historical tsunami records.
40
1 Introduction
In the case of Hokkaido-Nansei-Oki-Earthquake (July, 12,1993, M=7.8), the Okushiri is-land was severely attacked by the huge tsunami waves with 230 dead or missed persons,within about three minutes after the occurrence of the earthquake. Unfortunately, due to thelimitation of the ability of the existing system, the issuance of tsunami warnings was impossi-ble. The project to establish new system and procedures for the more quick issuance of warn-ings aiming at the dissemination within 3 minutes after the occurrence of the big earthquakehas been conducted since April 1994 by the Japan Meteorological Agency (JMA). This systemand procedure have been completed in 1995. And at the final stage of the project, the numeri-cal tsunami model will be added and operated.
2 New Seismograph Network and P-wave NIagnitude
For the purpose of shortening the time to locate an earthquake and to estimate its magni-tude, the JM.A has deployed the seismological network composed of 150 high sensitivity seis-mographs and 20 STS-2 models throughout Japan in March 1994 (Fig.1). The system for tsu-nami forecast continuously receives real-time seismic data at stations, and automaticallydetermines the magnitude and the location of an earthquake using arrival time and wave-forms of P-waves respectively.
Fig. 1 Nation-wide soimnograph nct,work. which i~ compowd of 150 short. pcrimi type aeisrno~raphs
and 10 long period types (STS-2).
41
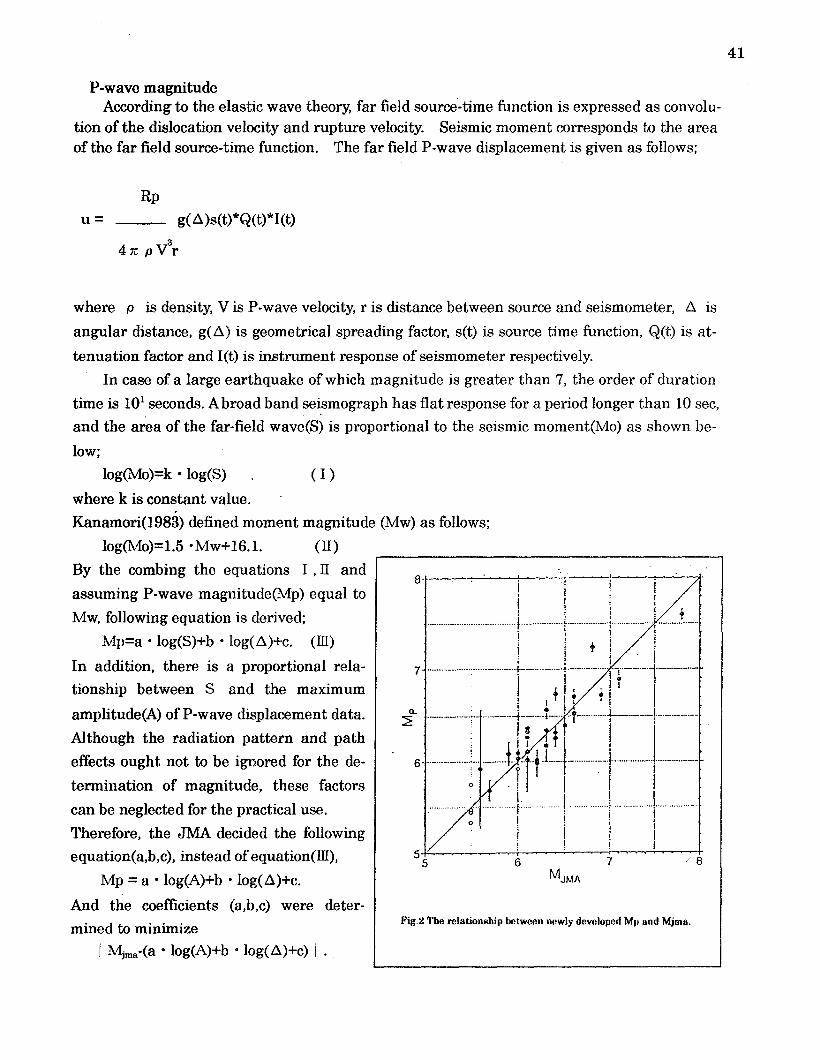
P-wave magnitudeAccordingto the elastic wave theory,far field sourw’-timefunction is expressedas convolu-
tion of the dislocationvelocity and rupturevelocity. Seismic moment correspondsto the areaof the far field source-time function. The far field P-wave displacement is given as follows;
Rp
u—= g(A)s(t)*Q(t)*I(t)
4xp V3r
where p is density, V is P-wave velocity, r is distance between source and seismometer, A is
angular distance, g(A) is geometrical spreading factor, s(t) is source time function, Q(t) is at-
tenuation factor and I(t) is instrument response of seismometer respectively.
In case of a large earthquake of which magnitude is greater than 7, the order of duration
time is 101seconds. Abroad band seismograph has flat response for a period longer than 10 see,
and the area of the far-field wave(S) is proportional to the seismic moment(Mo) as shown be-
low;
log(Mo)=k ● log(S) . (I)
where k is constant value.
Kanamori(1983) defined moment magnitude (Mw) as follows;
Open andclosed circles denote Mpdetermined with only one station andmulti stations re-
spectively, Error bar of one sigma is also shown. Overall these two magnitudes fit quite well.
After the establishment of the new seismograph network and the operation of the algo-
rithm for automated determination of Mp, the Hokkaido-Toho-Oki Earthquake occurred on
October 4,1994. This event was a good example to examine the abilities of this system. The
JMA could issue Tsunami warning in 5 minutes after the occurrence, in spite of this event
occurred outside the network; it took several tries to get the final epicenter location.
Its Mp was automatically calculated by using P-waves with 40 sec period, the final Mp ob-
tained to be 8.2. Thk value is well consistent with Mj~*(8.1)and with Mw(8.3) determined by
Harvard University Group. It can be concluded that the adoption of Mp, the JMA can quickly
evaluate whether a tsunami maybe generated by the earthquake.
3 Rapid Numerical Tsunami Model
The JMA is developing the new tsunami forecast methods using the database for the vari-ous kinds of results calculated by the new numerical tsunami model. With these accuratetsunami forecast procedures, the dissemination of accurate height and arrival time of tsunamiin the respective areas are planned for all Japanese prefectures. In order to take refuge fromtsunami, this information will be very important for the people affected by tsunami disasters.However, it needs alhigh-speed processing numerical model to issue a tsunami warning priorto arrival time of the tsunami. The abilities required are as follows:
.
Elapse Time : Within 1 second after the determination of the hypocenter and magnitude,
Forecast Range : In 2000km compass from the tsunami source
Region size : About 100~200km. (approximately equivalent to the size of each prefec-
tures in Japan).
3-1 Methods.
The JMA installed a computation system for tsunami forecast in 1981, but the system hasbeen equipped with neither a high-speed computer nor a numerical tsunami model.JMA originated a unique numericaltsunamimodelbased on basic mathematics.
There is a general approximationformulaabout a nonlinearfunction as follows:
f(x) %f(~) X (1-k)+f(x,) X k,
So, the
where x is in the range [xO, xl] and is divided the XOand xl with a ratio of k:(l-k), respectively.This form~a means that the approximate values of f(x) can be quickly obtained by using f(xO)and f(xl), instead of calculating f(x). This formula is a first-degree linear approximation for-mula. Thiq meaning can be expressed as follows: If there are two results of the tsunami com-putation for two earthquakes of same magnitude but different hypocenters (xO, xl), and the
43
distance is close to make this approximationfor-mula applicable, then the wave heights can berepresented as f(x(l) and f(xl). When anothertsunami occurs at the hypocenter (x) where di-vided with k:(l-k), tsunami height f(x) will beestimated easily with this approximation for-mula. It is easy to expand this approximationtheory into the X-Y coordinates as is clear fromthe Fig.3. In the same way, the wave heights ortsunami arrival times of any tsunamisgeneratedimthe four hypocenterscan be estimatedwith thenext approximationformula:
f(x,y)=(l-l){(l-k)f(~,yO)+k f(x,,y~}+l{(l-k)
f(~,yl)+k f(xl,yl)).
As an expansion of this theory the approxima-tion formula does not include only any hypocen-
Coast Line.
IMwcenters and
Tsunami sources
~ig.s ‘J’b COOC@ of tJJPinterpolation theory on !2 dimf!rrsioaal COOt’dhMes
@rs but also magnitude,fault depth and etc. Butit is needless to say that a great number of the tsunami simulationsare required to make pre-cise forecast for all of the earthquakesand generatedtsunamisaroundJapan like as shown inschematic Fig.4.A white circle denotes a hypocenter for the tsunami simulation.
Specifically, many tsunami simulation output files are fulfilled as in Fig.5. A white circlemeans a data file related to the tsunami heights for the entire coast in Japan.
I ,=7. 1 /~--$#ti1
w-HH- gl:
Fig.4 The structure of the data baae for the tsunamiforecast that are campoaod of many reaulti ofnumerical simulations about various sourcsparameters
pig.5 Illustration of the interpolation method preaentadwith a gasometrical diagram and an algebraicequation. Without any complicated numericalsimulation, we can obtain a senvenient approxi-mation when an earthquake or a tsunami occurs.
44
When an earthquake large enough to generate a tsunami occurs, the tsunami forecast sys-tem searches the eight data i51eawhich have results of numerical simulations for the earth-quakes at closest hypocentar and having similar magnitude. Then, by use of linear approxirna-tiodinterpolation among them as shown in Fig.5, the system detmmines the tsunami estima-tion. But the estimation of displacement of seabed or tsmnami heights needs considerationepicenter’s depth. Themfom, Fig.4 has to be expressed in four-dimensional coordinates. Forthe practical operations, the system uses 16 data files. However, the accumulation of thesedata flea containing about 100,000 numerical simulations takes very long CPU time. ‘Ib con-struct the data flea for all events near Japan, the JMA decided to use the super-computerHITAC-S81O-2OK which has 630 MFLOPS power and has been mainly used for numericalweather forecasting projects. The JMA can now pefiorm these many simulations automati-cally.
The second problem is on the fimlt parameters. It is because that the calculation about thedislocation and swelling sea surface needs the fault parameters about the earthquake. AroundJapu however, major earthquakes occur approximately with the fault parallel to the trenchaxes, as presented in Fig.6.In addition, there is the fact that tm.nami height is mainly controlled by the quake’s magni-
*.6 The fkmlt planes mromndthe ooe.st of Japan, whioh had generatad taunemie in hictaricel agee. The di.stributiomef ~ fmult planes are ohuaoterized by ● tanden~ ta be parallel width the coaet line. It in noticedtht many of them are the reveree typo faolts.
.
,
45tude. The relationship between the sizes of fault and magnitude is given as follows:
log L(km)=O.5M-l.9, W%LJ2log U(cm)=O.5M-l.4
where, L; length of the fault plane, w width of the faultplane and U; length of the slip vector.
For the reliable disaster mitigationlprevention, the computation based on these equations
between magnitudesand statisticfault parametersshouldbe accurate.
When all computation has been completed, all of the results obtained are used to constructthe database. The structure of this database is similar to that of a crystal. An atom corre-sponds to one set of computation results. If these atoms are very near, the resulting interpola-tion among them becomes more accurate. However, the severe problem of this computation isto be expensive. In this computation, the results obtained are the most efficient, when thedistance between two hypocenters is nearly equal to the tsunami source area. Therefore,these atomshe~ are spaced every 50kmz 100km on the N-E coordinate plane due to the dis-tribution tendency of the faulta around Japan(Fig.6).
It is a very remarkable feature that this interpolation algorithm can promptly carry out theanalysis of tsunami generation. It” is concluded that this numerical tsunami model canprovide quickly the tsunami forecast information horn the occurrence of large earthquakewithout the use of a super computer.
3-2 Applicationto PriorEventsThis interpolationnumerical model was appliedto the tsunami of the 1933Showa Sanri-
ku earthquake (March, 3,1933,M8.1, 3,064 deaths) as shown in Fig.7. The output of the in-terpolation numerical model is overlapped with 16 simulations that formed iiom tsunami’sdit%erentwurce (location, Magnitude, fault depth). In order to evaluate the precision of thenew model, we used not only this interpolation numerical model, but also ordinary numericalcomputation. Each result of two computations agreed well with the observation data for therun-up tsunami heights.
The another example is the 1993 Hokkaido-Nansei-oki Earthquake (July 12, 1993 M7.8),and the results are presented in Fig.8, After the occurrence of this tsunami, huge waves verysoon attacked the west coast area of Hokkaido, especially at Okushri Island with over 20 mheight waves, and 237 people killed. The observational results and the values computed by thetwo models are shown in Fig.8 in the same arrangement as those in Fig.7. Fig.8-@ shows thatthe Interpolation Numerical Model has some tendency to overestimate tsunami height aroundthe source which is close to the coastline. These results can be used for the actual tsunamiwarning operations to minimize disasters, but it is possible to correct the overestimation byimprovement of the database.
These computation tests of the Interpolation Numerical Model are carried out with a per-sonal computer, and computing to obtain output is very fast. Although this computation algo-rithm requires considerable time to make the database, it was confirmed that this tsunaminumerical model, using the data base method can promptly obtain the tsunami heights ex-pected for tsunami warning or advisory. In case of the 1993 Hokkaido-Nansei-oki earthquaketsunami, the arrival time of tmmami waves was about 3-5 minutes in Okushiri Islmid &r
YEz___l@ Observational results
/ “ Jkj-=--d=3=-
@ Numerical Model output @ Interpolation Numerical Model
@“@=rvational results of the tsunami run-up heights by the 1933 Shows-Sanriku-Oki-Earthquake(M=8. 1).@ Distribution of the tsunami height obtained by the ordinary numerical model. The fault parameters:
L=180km,W=100kmL, U=330cm, Slip =-90” ,Dip=415” and Normal fatdt type.After Kanamori(197 la, 1972c)
@ The tsunami heights obtained by Interpolation Numerical Model. Each member of the database is based on the gridpoints surrounding the hypocenter at distance of50km. The fault parameter: L= 148km,W=74km,U=447cm,Slip=90” ,Dip=45” and reverse fault type.
Strik9=lS6”< .%p angb=sll” and [lip nugla=:16” M fauh olann mwmn Ikdt tyw
l=7tim,W*hU#~m,Sti&-.lffi “,Slq,tm@s lfifi” und lhp aagle=.%”.
Mm% JMA Jkwawb Sum “{1SS4)
47
occurrence of the quake. Even in such a case, the Interpolation Numerical Model can issuetsunami forecast, and the tsunami warning can be broadcast before the arrival of tsunamiwaves at the island.
4 Satellite-Based System fbr Disseminaticm of Emergency Information
The P-wave magnitude and Interpolation Numerical Model are the new methods to realize
the more rapid issuance of tsunami warnings with higher accuracy of the arrival time andwave height. In addition these new methods, it is also important to shorten the transmission
time of the tsunami warnings and information from Tsunami Forecasting Centers from the
public. The JMA has developed the Satellite-Based Emergency Information Multi-
destination Dissemination System and the receiving equipment to be cleployed at the prefec-tural and municipal offices, mass media stations, meteorologicalobservatoriesLstations,andothers as shown in Fig.9. Through this satellite-based transmission system, tsunami warn-
ings and related earthquake information can be directly sent to the receivers immediately
after the issuance. The following is
@ Tsunami forecast message,
@ Seismic intensity,
@ Epicenter and magnitude,
the contents of the information contained:
@ Observationsof tsunami arrivalsand its height,
@ cancel of the tsunami warnings.This information is broadcast via the Gestational Meteorological Satellite (GMS), and can be
Geostallonary Meteorological Satellile (GMS)
@‘, ‘\
d ‘ \ “L=%Satellite-based Emergency Information Multi-destination Dissemination System
To minimize tsunami disasters, the JIWhas improved the tsunami forecasting system. Jnew seismograph network with 150 station~was constructed, and P-wave magnitude hasbeen adaptid for rapid determination of th[hypocenter and magnitude. For rapid transmission of the warninglinformation, the new dissemination and re~ceiving system using GMfhas been developed also.
The present projects are to equip the tsunami forecast system with the InterpolationNumerical Tsunami, Model, The JMA is going kdisseminate the Quantitative Tsunami Forecaslby 1999. Thus, in i~ddition to today’s GMS information, we will send more important infermation,
23:20-23:30
22:50-23:10
K
0.5-lm high
l-2m High .!,...
DO
22:20-22:30
23:20-23
Over 810
23:20-23:30
22:40-23:00
0.5-lm high.
23:00-23:20
0.5-im high A ... ..
A
b
. . .... .
23:20-23:30
2-4n high
Fw1l TtIPimw of the Quanatariw lkuMmI F’ort?cwtAPP1.@kgthe 193$ Hokkai&,.Nsna.L(Jk,.
~b @4=7.@t DAiCUCMF d ~nami M@t end amwal tnmw cbw.minm.- WW.11Pmbcwm
@ Predictionof tsunami arrival times,Cl Prediction of tsunami heights, ,
as Fig. 11.
496 Acknowledgments
I w .ish tithtink M.E.f31ackfijrli (PacificTsunami W:lrl]illg P~?x]l.er)fiJralol. oft’llt:f~l~rago-
ment this study and his constant attention, and Yoshihim %wwla (Japan Meteorological
Isamu Aids, 1978,Roliai~ilit.y of a tsunami .soutw model (Iwivwl from fault paramdnrs,
J. Phys.Earth, 26, 57-73.
Jsamu Aida, 1979, A sourw Model of the Tsunami mmrnpanying tho Tonankai Earthquake of
1944, Bull. Eartq.Res.lnst., 54,367-390.
Isamu Aids, 1981b, Numerical Expmiments of Historical Tsunami Gmmrated off the (!oast of
the ‘Jbkaido District, Bull.Earthq.Res.Inst., 56,367-390.
Tsamu Aida, 1984,A Source Model of the Tsunami accompanying the (%ntral ,Japan SWIEarth-
quake of 1983, BulLllarthq.R.es. Inst., 59,93-104.
Ando,M., 1975, Source mechanisms and ti+ctonicsignificance of historical oarthquako along
the Nankai trough, ,Japan, ‘lkctonophysim, 27,119-140.
Kajiura, 1970,Tsunami source, energy and the directivity of wave radiation,
BulLEarthq.Res. Tnst., 56,415-440.
H.Kanamori, 1977, The energy release in groat earthquakes, J.tleophs.Res., 82, 2!381-2987.
H.Kanamori and JMnderson, 1975, Theoretical basis of some empiriwd relations in
seismology, J3uUSeismol.Soc.Am., 65, 1073-1095.
Mansinha,J,.and D.Smylie, 1971, The displacement fields of inclined faults,
BulLSeismoLSoc.Am., 61, 1433-1440.
Matsuda.,T.,Ota,M.Ando and N.Yonekura, 1978, Fault mechanism and recurrence time of
major earthquake in southern Kanto district, ,Japan, as deduced from coastal terraco
data, Geolog.Soc.Am.B.dL, 89, 1610-1618.
Matsu~M.,T.lwasaki and Y.suzuki, 1980, Staitical and dynamical study on faulting
mechanism of the 1923 Kanto earthquake, ,T.Phys.Earth, 28, 1W-143.
50
51
ELEVATION CHANGES ASSOCIATED WITH
A TSUNAMIGENIC EARTHQUAKE
Shigehisa Nakamura
Famine Ville-A104, Tanabe 646-0031, Japan
ABSTRACT
The 1995 South Hyogo earthquake generated a small tsunami. Post earthquake geodeticsurveys along the coast close to the epicenter showed elevation changes that apparentlycontradict a conventional notion of source mechanism, that the hypocenter is a point ona line formed by the intersection of two nodal planes. Research into earthquake sourcemechanism and tsunami source with emphasis on field data is recommended.
52
INTRODUCTION
Geodetic data from post-earthquakesurveysof the 1995 South Hyogo Earthquakewere studied to examinethe actualprocess of a tsunamigenicearthquake. The shock waslocated in the (Circum-Pacificseismiczone in the northwesternPacific. The epicenter wasseveral hundredkilometerswest of the tectonic boundarybetween the EurasianandPhilippineSea Plates. Severalnew faultsappearedduringthe earthquaketo produceelevation changes across the faultsnearthe epicenter.
In thispaper elevation changes found afterthe seismic event are studied in relationto the tsunamigenicearthquake. The data suggest thatthere is need to conduct tsunamiresearchnot on the basis of artificialmodels but investigationsin terms of reasonabledynamics based on observed data.
PREVIOUS WORKS.
Envircmmental changes of the 1995 earthquake were studied (Nakamura, 1995;1996a); the study was extended to include sea level changes brought about by theearthquake (Nakamura 1996b). Furtherstudiesmonitored the local annualmean sealevels and the rising of the datumplaneby comparing presentchanges with previous datasets (Nakamura 1990; 1993; 1994).
It should be noted thatthe epicenterof the 1995 SouthHyogo Earthquakewaslocated in a seismicallyactive zone adjacentto one of the subduction zones (Bebout et al.,1996)..
EARTHQUAKE FAULTS FORMED BY THE EARTHQUAKE
For this study seismic records were obtained from seismic stations maintained bythe Japan Meteorological Agency, but the author was not able to get hold of records oftsunamis and seiches generated by the earthquake. Figure 1 shows the epicenter “E’ andthe faults caused by the earthquake. Tlick lines “F 1“ and “F2” are the faults newlyformed in the earthquake. The faults were mapped by post-earthquake survey teams andwere reported in a rapid publication from the Maritime Safety Agency. Several of thenewly found faults (thin iines) are located out at sea under fine stratified sediments. It isdifficlt to consider that these faults were formed at the time of the main shock andcontributed to tsunami generation.
After the earthquake the National Geographic Research Institute surveyedelevation changes along a line crossing the faults “F 1” and “F2”. The survey line H-K-Sin Figure 1 started from Himeji (H), passed through Kobe (K), and ended at Osaka (S)along the coastline, veering close to the epicenter (E).
The elevation changes along line H-K-S are shown in Figure 2. The horizontaldistance is net drawn according to scale. The diagram shows that significant upheavaloccurrred between the two newly formed seismic faults “F 1” and “FZ”. Sourcemechanism analyses, on the other hand, show that the epicenter and the tsunami sourceare located at the node of force distributions. The author wants to know what was the
53
process at the seismic source and questions the prevailingnotions of earthquakesourcemechanism.
GEODETIC VARIATIONS AROUND THE EPICENTER.
The subdumion process of the Pacific Plate and the Philippine Sea Plate beneaththe Eurasian Plate is considered to be well known. Nevertheless, we have no informationon the internal forces in the plates.
In the two years before the earthquake and the two years after the earthquake, thevariations in annual mean sea level at tide stations located in the southern area of thetsunami source were synchronous. The variations at Kobe for 1995 were out of step fromthe other nearby tide stations.. Why such variations occurred should be investigated.
AsNakamura(1994) has pointed out, the annual mean sea level variations in theinterested area are strongly influenced by Kuroshlo known as the western boundaryintensified currect in the northwestern Pacific. Further, only the author has paid attentionto the submarine thermal variations that occurred fifteen minutes before the main shock ofthe 1995 South Hyogo Earthquake.
As there seems to be a correlation of mean sea level changes and tectonicprocesses, the author proposes that the pattern obsswed in the 1995 event can beunderstood not only in terms of seismic signals but also as a geodetic problem in platetectonics. This might contribute to better understanding of tsunamigenic earthquakes inseismically active zones adjacent to tectonic plate boundaries.
CONCLUSIONS
Using the data of the 1995 South Hyogo Earthquake, geodetic changes associatedwith a tsunamigenic earthquake were studied in relation to seismic fault formation. Theelevation changes across the newly formed faults should be included in investigation oftsunamigenic earthquake process.
Bebout, C.E. , D. W. Sccjll, .S.ll. Kirby ~nd .T. P. Plat. t(eds. ) 1996
Nakamura, S. 1995 Oceanic SUhSll~fiiCf? t.hf?rrnal V~riati nns
durinq the Ilyoqo SolJth i?arthqu, ake, Sci .Tsunami Hazards
(Int..J.~sunami Snc.) , VO1. 13, pp.53-56.
Nakamura, S. 1996a Possibl r? environmental variations durinq
an earthqlJake, Oceanology International 96 ( 0196 ) ,Briqhton UK, Vol. 1. pp. 333- 340.
N.~k.amura ,S. 1996h An extent of sea surfi~ce layer affected
by an earthquake, Marine Geodesy, Vol .19, pp.281-289.
Nakamura ,S. 1997 Interannual sea level variations neigh-hour the plates boundary, Conference Proc. of OT.97
PA CR TM, Si. nqaore, Vol .1, pp. 31-39.
54
T It 1
13SE 20’
34-4s’N
.
Figure ‘1.LOCations of the epicenter of the 1995 I-fY090
South Earthquake and of the seismic faults.
Ha K-P
UPHEAVAL
- [ / .x
‘%”” “s10 CM R
R:Kairtan=lS69 12
M
‘, /‘*T,k!
?
H K sFigure 2!.Remanent geodetic variations (upheavals) caused
by the 1995 Hyogo South Earthquake along a
survey line crossing the seismic faults just
around the epicenter.
55
THE JULY 1998 NEW GUINEA TSUNAMICARRIES BAD NEWS FOR HAWAII
Daniel A. Walker
Oahu Civil Defense Tsunami Advisor
59-530 Pupukea Road, Honolulu, HI 96712 USA
A recent article appearing in Science News [R. Monastersky, “Waves of Death: Whythe New Guinea Tsunami Carries Bad News for North America,” Science News, Vol 154-14,pages 221-223 (1998)] stated that the runup from the July 17, 1998 New Guinea tsunamireached 14 meters and more than 2,500 people were killed. The bad news suggested in thearticle is that locally generated tsunrunis have struck, and will strike, portions of the WestCoast of North America.
Tsunami researchers in Hawaii have individually over many years expressed concernsabout locally generated tsunamis. The state of Hawaii has experienced a number ofsignificant, locally generated tsunamis on the sparcely populated island of Hawaii. Two ofthese, in 1868 and 1975 had runups of about 14 meters, identical to that observed for theNew Guinea tsunami.
Such earthquakes as the 1868 and 1975 events should not be viewed as only beingpossible along the Ka’u and Puna Coasts. Similar large events could occur along the KonaCoast (of the.island of Hawaii). Modeling of a hypothetical Kalapana type earthquake offthe Kona Coast suggests that tsunamis in excess of 10 feet, and perhaps comparable tothe New Guinea values, could strike Oahu’s south shore.
On the other hand with the current local warning threshold of 6.8 and an error of+ 0.5units of magnitude, state-wide warnings may be called for earthquakes with magnitudes aslow as 6.3. There have been about 9 local earthquakes with magnitudes of 6.3 or greater inthis century (about 1 every 10 years). None of these have produced destructive tsunamison islands other than the island of Hawaii.
In 1997 and 1998, meetings of all available tsunami researchers in Hawaii were heldto provide consensus, rather than individual, advice to the State’s Civil Defense Agency.These conclusions and recommendations are contained in two reports: Recent Discussions
Related to Tsunami Issues” dated October 2, 1997 and Conclusions and Recommendations
Related to Local Twnami Issues by Independent Tsunami Experts dated May 21, 1998.The following is a summary of the recommendations sent to the Hawaii Civil Defense
based on the May 21, 1998 meeting.The scientists and Civil Defense personnel attending this meeting recommended an
1. The installation of additional coastal wave recorders on the Big Island (island ofHawaii) capable of providing real-time detection and warning of an impending tsunami.
2. The modeling of a suite of earthquakes around the Big Island with which future BigIsland tsunamis can be matched.
3. Installation of open ocean wave gauges off the western coast of the Big Island. Withmodeling studies, such data would confirm that either a significant tsunami was on its wayto other islands or no significant tsunami was about to strike other islands.
*
56
4. Coordinate and conduct a state wide public information/education campaign to
better prepare island residents to cope with the local tsunami hazard.
ln conclusion, it was agreed that without more instrumentation and modeling stuclies,
there will continue to be unacceptably high risks of false local warnings, local warnings
not issued in a timely manner, or missed local tsunamis. All of these possibilities would
have serious consequences in terms of : (a) immediate or future injuries or fatalities, (b)
the loss of credibility y in Civil Defense agencies and the warning system, and (c) tourism.The Hawaii tsunami scientists attending the meetings and contributing to the reports
were Dr. Doak Cox, State Civil Defense Tsunami Advisor (Emeritus), Mr. George Curtis,Hawaii Civil Defense Tsunami Advisor, Dr. Augustine Furumoto, State Civil DefenseTsunami Advisor, Dr. Daniel Walker, Oahu Civil Defence Tsunami Advisor, Dr. GerardFryer, Dr. Donald Swanson, Dr. Charles McCreery, Mr. Michael Blackford, and Dr.Charles Mader.
57
REAL-TIME VISUAL OBSERVATIONS OFSMALL TSUNAMIS IN HAWAII GENERATED BY THE
DECEMBER 5, 1997 KAMCHATKA EARTHQUAKES
Daniel A. Walker
Oahu Civil Defense Tsunami Advisor
59-530 Pupukea Road, Honolulu, HI 96712 USA
INTRODUCTION
Historically some of the largest runups reported in Hawaii for Pacific-wide tsunamishave been along Oahu’s north shore. The largest statewide values were 4.9 meters atWaimea Bay from the Alaska earthquake of 1964 and 9.1 meters at Kaena Point from theKamchatka earthquake of 1952. Largest Oahu values were 3.7 meters at Haleiwa in 1923(Kamchatka), 7.0 meters at Kahuku in 1957 (Aleutians) and 4 meters near Mokuleia in 1960(Chile). In addition, small tsunamis from the May 7, 1986 Aleutian and October 4, 1994Kuril earthquakes, estimated to be less than 0.3 meters, were videotaped approximatelyone mile from the ocean as they traveled as a bore up Paukauila stream in the Waialuaand Haleiwa area.
This history of strong responses to Pacific-wide tsunamis and the early morningcancellation <ofa December 5, 1997 tsunami watch for the 7.9 Mw Kamchatka earthquake,well in advance of its expected arrival time, suggested a unique opportunity for the safeobservation of a small tsunami on Oahu’s north shore.
OBSERVATIONS
Figure 1 is a photo taken from a bridge over Paukauila stream at about 7:30 a.m.Hawaiian time on December 5, 1997. The dark band across the stream is a sand barproduced by the opposing forces of the mountain stream emptying into Kaiaka Bay andsmall ocean waves moving upstream. The bridge seen in the picture is used to haul sugarcane. In some of the photos a large tractor can be seen at the eastern (right) edge of thebridge, The photo was taken because a small ripple emerged from the righthand side of thesand bar at a time corresponding to the expected arrival time of the first tsunami wave.The ripple can not be easily identified in the reproduction.
Figure 2 is a photo taken at about 8:00 a.m. as the sand bar became covered with waterand small breaking waves. Powerful rapids began to move diagonally from right to left,from one bank of the stream to the other. This action generated the counter-clockwisewhirpool about 30 meters in diameter shown in the lefthand central portion of the picture.
A corresponding clockwise whirpool then began to form further upstream. It grew toabout 20 meters in &meter and is shown in Figure 3. The approximate 3 meter section oftelephone pole shown in Figure 3 eventuaUy moved upstream under the bridge from whichthe photos were taken and then headed back toward the ocean as the tsunami receded andthe sand bar was once again exposed (Figures 4 and 5). Note the similarity of the surfacesmoothness of the stream in Figures 1, 4 and 5 as contrasted to the surface turbulence ofFigures 2 and 3.
At about 8:20 another tsunami wave was observed and photographed. It was slightlysmaller but had the same general characteristics of the 8:00 wave. The maximum runup
,
58
of the 8:00 wave was about 0.6 meters along the eastern (right) bank of the stream nearthe sandbar.
Returning home, the internet indicated that a 6.7 Mw aftershock occurred 7 hoursand 21 minutes after the main shock. The question then arose as to whether it wouldbe possible to see a tsunami from that earthquake in the quiet backwaters of Paukauilastream. The wave of the aftershock corresponding to the earlier 8:00 wave would arrive at3:21 p.m. Two sticks were placed as markers into the mud near the water line along thebank of the stream, the time (3:17) was written in the mud, a 2 by 3 inch Civil Defenceidentification card was laid on the bank for scale and the picture shown in Figure 6 wastaken. The water line slowly began to rise past the sticks and the number “3”. The “17”was changed to a “29” to indicate the time, and the picture shown in Figure 7 was taken.The water line continued to rise, covering the number “2”, and reached a maximum at3:31. Once again the time was written in the mud and the photo shown in Figure 8 wastaken. The estimated runup of this tsunami was 0.1 meter.
CONCLUSIONS
Extremely small tsunamis can be visually observed in quiet backwater areas which arealong coastlines historically responsive to large Pacific-wide @unamis.
I wish to thank Joe Reed for providing timely information on the watch cancellation,Francine Walker for assistance with the observations, and Napono Walker for help withthe runup-survey.
59
Figure 1.The quiet Paukauila strewn
sandbar, bridge and ocean at
about 7:3o a.m. HawaiianStandard Time on December5, 1997.
Figure 2.At 8:00 a.m. the sand-
bar is covered by a tsunamiand small breaking waves.
Powerful rapids across thestream from the right banknear the sandbar to the leftbank generated a 30 meterdiameter, count er- clockwisewhirlpool in the left centerof the picture. The 7.9 MwKamchat ka cart hquake gen-erated this tsunami.
Figure 3.
A clockwise whirlpool de-veloped further upstreamnear the bridge from whichthe photos were taken. A3 meter section of telephonepole moved upstream.
60
P ...*..-.,,..‘-. >-.- . . ..-.
w’- -.-.
.’. . .:
i..lizii
Figure 4.
The waters receded once
again, exposing the sandbarand moving the pole down-stream.
Figure 5.The water continued tore-
ceed and the pole moved fur-ther downstream just below
the middle of the sandbar.
61
Figure6.Markers before a possible
mini-tsunami on December 5,1997 at 3:17 p.m.
Figure 7.
Approaching the maxi.mum runup of the mini-tsunami at about 3:29 p.m.
Figure 8.Maximum runup of 0.1
meters observed at 3:31 p.m.from the 6.7 Mw Kamchatka
cart hquake.
62
The
FOR LONG TERM CONTRIBUTIONS TO
TSUNAMI SCIENCE
Presented to:
JAMES LANDER
At the 7th International Conference
on Natural and Man-Made Hazards,
Chania, Greece, May 1998
A~/4e &George Curtis, President, the Tsunami Society
%
THE TSUNAHISOCIETYAWARD
FORLONG-TERMCONTRIBUTIONSTO TSUNAMISCIENCE
Awarded to: ~ ~ _ 1998
It is difficult to describe the many activities, tasks,
Iositions, conferences, and publications that Jim Lander haseen part of since his earthquake work evolved into tsunamiresearch around 1980. In fact, he was the first Director of theNational Earthquake Information Center, serving from 1966 to1973; then he became Director of the World Oata Center forSolid Earth Geophysics until “retirin “ in 1988. During this
i!latter assignment, he began to apply is geophysical backgroundto tsunamis around 1984.
Upon retiring, he really went to work on tsunamis, as a memberof the Coo erative Institute for Research in Environmental
1!Sciences a the University of Colorado. His major work hasap eared in a series of definitive books, catalogs, andtpu lications such asynitecistatu~ M1.ll@lw
SMMmMM&MM!2wQ.&SL ?MfQ.GkMetc, etc. He has become an unusually e fective
Secretary of the IUGGTsunami Commission. And, all this is inaddition to the papers and presentations at the numerousconferences he attended or organized, often accompanied by hishelpful wife, Corrine.
Jim has the most comprehensive knowledge of the science andeffects of tsunamis of any of us and has done a better job ofsharing thatdocument theproud of hisworld.
As Presidentthis special
than anyone else. He is continuing his work tohazards-of tsunamis in new areascontributionsto public safety in
of the Tsunami Society I am veryaward to Jim Lander.
and we can all bethe oceanic
pleased to make
b~’x= &-~George D. Curtis
President
,..—
APPLICATION FOR MEMBERSHIP
THE TSUNAMI SOCIETYP. O. BOX 25218
Honolulu, Hawaii 96825, USA
I desire admission into the Tsunami Society as: (Check appropriate box.)
0 Student 0 Member 0 Institutional Member
Name Signature
Address ~hone No..
Zip Code Country
Employed by_
Address
Title of your position .
FEE: Student $5.00 Member $25.00 Institution $100.00Fee includes a subscription to the society jourrd SCIENCE OF TSUNAMI HAZARDS.
Send dues for one year within which the applicarlt joins.begin with 1 January of theapplied to that year.
application. Membership shall date from 1 January of the yearMembership of an applicant applying on or after October 1 willsucceeding calendar year and his first dues payment will be