Corporate Social Responsibility and Environmental Management Corp. Soc. Responsib. Environ. Mgmt 9, 215–233 (2002) Published online in Wiley InterScience (www.interscience.wiley.com). DOI: 10.1002/csr.26 SCORING CORPORATE ENVIRONMENTAL AND SUSTAINABILITY REPORTS USING GRI 2000, ISO 14031 AND OTHER CRITERIA J. Emil Morhardt,* Sarah Baird and Kelly Freeman Roberts Environmental Center, Claremont McKenna College, USA The purpose of this paper is to evaluate the extent to which current voluntary corporate environmental reports meet the requirements of two new sets of guidelines: (i) the Global Reporting Initiative GRI 2000 sustainability reporting guidelines and (ii) the ISO 14031 environmental performance evaluation standard. We converted them to comprehensiveness scoring systems then used them along with three existing comprehensiveness scoring systems to evaluate the 1999 reports of 40 of the largest global industrial companies. Many of the reports scored highly with the existing systems, but the GRI and ISO guidelines are much more detailed and comprehensive, and resulted in much lower scores. In particular, the economic and social topics that make up 42% of the potential GRI score and the environmental condition indicators that make up 22% of the ISO 14031 score were minimally * Correspondence to: Prof. J. Emil Morhardt, Roberts Environ- mental Center, Claremont McKenna College, 925 N. Mills Avenue, Claremont, CA 91711-5916, USA. E-mail: [email protected]Copyright 2002 John Wiley & Sons, Ltd and ERP Environment. addressed in all of the companies’ environmental reports. Current reporting practices of the companies whose reports we examined here are well below the standards reflected in the GRI and ISO 14031 guidelines, even when the reports scored well with existing report scoring systems. Copyright 2002 John Wiley & Sons, Ltd and ERP Environment. Received 15 February 2001 Revised 9 May 2002 Accepted 26 June 2002 INTRODUCTION R ecently there has been a substantial increase in corporate awareness of envi- ronmental and social performance, and a concomitant desire to report such perfor- mance publicly. This has occurred for a variety of reasons, including to comply with regula- tions and to reduce the cost of future com- pliance (Dechant et al., 1994; Ghobadian et al., 1995; Porter and van der Linde, 1995; Shri- vastava, 1995; Hart and Ahuja, 1996; Ghoba- dian et al., 1998; Dias-Sardinha and Reijnders, 2001; Rivera-Camino, 2001), to comply with industry environmental codes (Howard et al.,
Transcript
Corporate Social Responsibility and Environmental ManagementCorp. Soc. Responsib. Environ. Mgmt 9, 215–233 (2002)Published online in Wiley InterScience (www.interscience.wiley.com). DOI: 10.1002/csr.26
SCORING CORPORATEENVIRONMENTAL ANDSUSTAINABILITY REPORTSUSING GRI 2000, ISO 14031AND OTHER CRITERIA
J. Emil Morhardt,* Sarah Baird and Kelly Freeman
Roberts Environmental Center, Claremont McKenna College, USA
The purpose of this paper is to evaluatethe extent to which current voluntarycorporate environmental reports meet therequirements of two new sets ofguidelines: (i) the Global ReportingInitiative GRI 2000 sustainability reportingguidelines and (ii) the ISO 14031environmental performance evaluationstandard. We converted them tocomprehensiveness scoring systems thenused them along with three existingcomprehensiveness scoring systems toevaluate the 1999 reports of 40 of thelargest global industrial companies. Manyof the reports scored highly with theexisting systems, but the GRI and ISOguidelines are much more detailed andcomprehensive, and resulted in muchlower scores. In particular, the economicand social topics that make up 42% of thepotential GRI score and the environmentalcondition indicators that make up 22% ofthe ISO 14031 score were minimally
* Correspondence to: Prof. J. Emil Morhardt, Roberts Environ-mental Center, Claremont McKenna College, 925 N. MillsAvenue, Claremont, CA 91711-5916, USA.E-mail: [email protected]
Copyright 2002 John Wiley & Sons, Ltd and ERP Environment.
addressed in all of the companies’environmental reports. Current reportingpractices of the companies whose reportswe examined here are well below thestandards reflected in the GRI and ISO14031 guidelines, even when the reportsscored well with existing reportscoring systems. Copyright 2002 JohnWiley & Sons, Ltd and ERP Environment.
Received 15 February 2001Revised 9 May 2002Accepted 26 June 2002
INTRODUCTION
Recently there has been a substantialincrease in corporate awareness of envi-ronmental and social performance, and
a concomitant desire to report such perfor-mance publicly. This has occurred for a varietyof reasons, including to comply with regula-tions and to reduce the cost of future com-pliance (Dechant et al., 1994; Ghobadian et al.,1995; Porter and van der Linde, 1995; Shri-vastava, 1995; Hart and Ahuja, 1996; Ghoba-dian et al., 1998; Dias-Sardinha and Reijnders,2001; Rivera-Camino, 2001), to comply withindustry environmental codes (Howard et al.,
J. E. MORHARDT, S. BAIRD AND K. FREEMAN
1999), particularly when sanctions for non-compliance are invoked (King and Lenox,2000), to decrease operating costs (Shrivastava,1995; Russo and Fouts, 1997; Esty and Porter,1998; Reinhardt, 1999) and to improve stake-holder relations (Stafford, 1996; Berman et al.,1999; Cormier and Magnan, 1999; Henriquesand Sadorsky, 1999; Reinhardt, 1999; Waddockand Graves, 2000; Rivera-Camino, 2001). Otherincentives include the perceived environmen-tal visibility of the firm (Bowen, 2000), a sensethat such improvements will result in com-petitive advantage (Hart, 1995; Shrivastava,1995; Reinhardt, 1999; Bansal and Roth, 2000), asense that without active environmental man-agement the firm’s legitimacy is in question(Bansal and Roth, 2000; Sharma, 2000) anda sense of social responsibility and desire toadhere to societal norms (Hussain, 1999; Bansaland Roth, 2000; Cordano and Frieze, 2000; Flan-nery and May, 2000).
The degree to which such measures aretaken is related to the individual environ-mental initiative of managers (Andersson andBateman, 2000), directors and owners (Rivera-Camino, 2001), the perception of environ-mental issues as opportunities (Sharma, 2000)and management attitudes about pollutionprevention (Cordano and Frieze, 2000). It isalso related to the general strategic proac-tivity of the firm (Aragon-Correa, 1998), thecosts of obtaining the information to report(Cormier and Magnan, 1999), the size of thefirm (Tilley, 1999a, 1999b) and its general per-formance (Russo and Fouts, 1997; Waddockand Graves, 1997a, 1997b; Ransom and Lober,1999; Reinhardt, 1999; Sharma, 2000; Stanwickand Stanwick, 2000). The adoption of an envi-ronmental policy is associated with firm size(Roy et al., 2001), high stock price (Thomas,2001) and good financial performance (Stan-wick and Stanwick, 2000), as is the adoption offormal environmental commitments (Stanwickand Stanwick, 2000).
The business effects of undertaking environ-mental and social improvements (and report-ing on them) is not as clear as it might be,
largely because it is difficult to test causality:are environmental and social improvementsthe cause or the result of good or bad perfor-mance in other managerial and financial areas?Analysis of the correlation between environ-mental or social performance and financialperformance or reputation can only shed lighton this question if one of the two clearly pre-ceded the other, which is seldom the case.Hart and Ahuja (1996) looked at return onsales, return on assets and return on equityof 127 large firms in the four years followinginitiation of required toxic release inventory(TRI) reporting in the US, when many com-panies were actively seeking to decrease theirtoxic effluents. They found that in 1991 and1992 all three financial variables were signifi-cantly correlated with emissions reductions in1989, and tentatively inferred causality whilenoting its uncertainty. Waddock and Graves(1997a) used the same three accounting vari-ables and found a positive correlation betweenthem and one-year prior and one-year subse-quent social performance, suggesting that priorgood financial performance provided the flex-ibility to improve social performance. Halmeand Niskanen (2001) looked at average cumu-lative abnormal returns in the ten tradingdays before and after newspaper publicationsof Finnish forest industry firms’ environmen-tal investments and found that there was alarge instantaneous negative market reactionfollowed by a rapid price recovery.
One correlational approach not based ontime lags has been to compare the priceperformance of stocks or of mutual funds madeup of stocks that have been environmentallyor socially screened with the performance ofa wider universe of stocks. Several studieshave found no important differences relatedto social or ethical screening (Hamilton et al.,1993; Diltz, 1995; Waddock and Graves, 2000).The Dow Jones Sustainability Group Index(DJSGI) of stocks that are presumably fromcompanies in some way environmentally orsocially superior to the more general DowJones Global Index (DJGI) did outperform the
Copyright 2002 John Wiley & Sons, Ltd and ERP Environment Corp. Soc. Responsib. Environ. Mgmt 9, 215–233 (2002)
216
SCORING ENVIRONMENTAL AND SUSTAINABILITY REPORTS
DJGI from 1993 to 2000 (Cerin and Dobers,2001) but contained a higher percentage oftechnology firms, and its firms averaged two-and-a-half times the market capitalizationvalue of the DJGI firms. Whether it is themarket capitalization and technology or thesocial and environmental qualities that drivethis performance is not known (Cerin andDobers, 2001).
Another approach is to look for correla-tions between third party management qual-ity ratings and aspects of environmental orsocial management. Waddock and Graves(1997b) discovered that strong performancewith respect to stockholders, employee rela-tions and product–customer relations was cor-related with high evaluations in the Fortunemagazine management surveys, but perfor-mance with respect to environmental stake-holders was not. A similar study (Turban andGreening, 1997) used 75 business students torate the general reputations and attractivenessas employers of 160 companies, then correlatedthese scores with an independently derivedmeasure of environmental and social perfor-mance. They found both reputation and attrac-tiveness as an employer to be correlated withcommunity relations, employee relations andproduct quality, but only reputation was corre-lated with environmental performance. Goodsocial and environmental performance mayjust be a byproduct of good management: CEOcompensation is positively correlated with firmenvironmental reputation, but also with sizeand financial performance (Stanwick and Stan-wick, 2001); return on assets is weakly cor-related with environmental rating but muchmore strongly correlated with firm and indus-try growth rates (Russo and Fouts, 1997); costadvantage of pollution prevention investmentsis primarily achieved by companies that areinnovative relative to their major competitorsand act early (Christmann, 2000).
Where reporting of environmental and socialperformance is not mandatory, companiesappear to be doing it because of peer pres-sure (KPMG, 1999) and to improve employees’
and other stakeholders’ perceptions of the com-pany’s environmental performance (Cormierand Magnan, 1999; Herremans et al., 1999).Reporting is also correlated with financial con-dition and size and industrial sector of the firmas well as the regulatory environment (Cormierand Magnan, 1999). If companies have alreadycollected data as a part of improved envi-ronmental and social management, they mayfeel that they might as well report it (Ballet al., 2000).
Such voluntary corporate environmentalreporting has been increasing over the lastdecade. In 1998, 35% of the largest 250 compa-nies of the Fortune Global 500 were producingenvironmental reports, and an additional 32%were producing environmental brochures, orhad environmental sections in their annualreports (Kolk et al., 2001). Many of those notproducing full environmental reports were inservice sectors, which, although they may havesignificant environmental impacts, are morelikely to have them from resource flows andwaste transfers than from emissions and finaldisposition of waste, on which governmentoversight, and hence reporting, has concen-trated (Graedel, 1998). The percentage of envi-ronmental reporting by the top 100 companiesin 11 countries increased from 17% in 1996 to24% in 1999, with increases in every countryexamined except the US (KPMG, 1999). A sur-vey of 227 companies of various sizes in the UKfrom six industrial sectors found that 34% werepresently disclosing at least some environmen-tal information and 22% intended to do so inthe future (Stray and Ballantine, 2000).
These reports offer a previously unavail-able window into corporate environmental andsocial strategy and performance, and make itpossible to evaluate this performance as anadjunct to more familiar financial performancemetrics. Depending on what companies chooseto include in environmental and social perfor-mance reports, the reader can evaluate degreeof compliance with regulations, and compareperformance with peer companies and across
Copyright 2002 John Wiley & Sons, Ltd and ERP Environment Corp. Soc. Responsib. Environ. Mgmt 9, 215–233 (2002)
217
J. E. MORHARDT, S. BAIRD AND K. FREEMAN
industries. Lober et al. (1997) reported the per-centage of 108 reports from the Fortune 500 andthe S&P 500 devoted to 16 topics selected froma variety of reporting guidelines and academicpapers. They also reported the percentage ofreports having an additional 16 environmentalcharacteristics, such as having an environmen-tal policy statement, a letter from the companychairman and quantitative goals. KPMG per-formed a similar analysis on the top 100 com-panies in each of 11 countries in 1996 and 1999(KPMG, 1999). Two hundred and sixty-sevenof these companies produced an environmen-tal report, 252 of which were analyzed for thepresence or absence of environmental policystatements and the inclusion of seven environ-mental topics within the policy statement, thestatus of environmental management systemsand the presence or absence of quantitativeinformation about waste disposal, air emis-sions, effluent discharges, energy conservation,environmental costs and accidents and inci-dents. The KPMG analysis also identified thepresence or absence of 12 environmental topicsincluded in future plans and targets.
All of these studies analyzed coverage of asmall number of topics relative to what couldreasonably have been included in a corpo-rate environmental report, and characterizedthe reports collectively by country or indus-trial sector, rather than by individual company,but there is a small body of literature analyz-ing environmental reports by company, oftenaddressing more topics. Davis-Walling andBatterman (1997) analyzed the 25 environmen-tal reports produced in 1996 by Fortune 50 UScompanies by extracting from them 29 topicsthat were found in at least four of them. Theydeveloped a scoring system that awarded 20 ofthe topics one point if addressed at all – withno additional credit for more detail – andawarded nine of the topics up to two pointsdepending on level of detail. More than half ofthe potential total score is based on quantita-tive measures of environmental performance,which include air emissions, reduction in use of
ozone depleting chemicals (ODCs), wastewa-ter treatment, energy conservation, reductionsin packaging and waste, recycling and reuseof recycled materials. The main shortcomingsof this system are that its few topics are basedon what was being reported rather than whatought to have been reported, and they are notvery consistent internally.
A joint effort of the UK consultancy Sus-tainAbility and the United Nations Environ-ment Programme (UNEP) developed a scor-ing system based on 50 topics and applied itto the reports of 40 companies in 1996 (Sus-tainAbility–UNEP, 1996), 100 companies in1997 (SustainAbility–UNEP, 1997) and, withslightly revised scoring criteria, 50 companiesin 2000 (SustainAbility–UNEP, 2000). The Sus-tainAbility–UNEP system uses 48 topics worthup to four points each depending on com-prehensiveness of coverage, and two topics(awards received and charitable contributionsmade) worth one point each. Its assignmentof up to four possible points is quite subjec-tive, the only guidance given in 1997 beingthat ‘. . .‘‘0’’ means that the area covered by thecriterion is not discussed at all and ‘‘4’’ meansthat the reporting is comprehensive’ (Sustain-Ability–UNEP, 1997). In the 2000 report thescoring was modified slightly so that to achievea score of 4 the topic must be ‘. . .fully discussedin a comprehensive, integrated and particularlyinnovative manner’ [emphasis ours].
The Deloitte Touche Tohmatsu (1999) scor-ing system is derived from the SustainAbil-ity–UNEP system and is largely a subset ofit. As an independent scoring system, this oneis preferable to the Davis-Walling–Battermanand SustainAbility–UNEP systems bothbecause it treats its topics more genericallyand comprehensively, and is therefore applica-ble to more kinds of company, and because itsscoring scheme is less subjective. The decreasein subjectivity over the SustainAbility–UNEPsystem is achieved by much more explicit rulesfor scoring each topic. The Deloitte ToucheTohmatsu generic treatment has the short-coming that to score a report effectively the
Copyright 2002 John Wiley & Sons, Ltd and ERP Environment Corp. Soc. Responsib. Environ. Mgmt 9, 215–233 (2002)
218
SCORING ENVIRONMENTAL AND SUSTAINABILITY REPORTS
scorer must know what kinds of environmen-tal aspect the company is likely to have. If acompany reports on consumption of water indetail it might seem appropriate to award itfour points under the consumption topic evenif the main consumption issue that the com-pany should have been addressing was energyconsumption.
The SustainAbility–UNEP system was usedby Morhardt (2001), along with the DeloitteTouche Tohmatsu (1999) and the Davis-Walling–Batterman (1997) scoring systems toscore the 1996 and 1998 reports of 28 US firmsscored in 1996 by either Davis-Walling andBatterman or SustainAbility–UNEP or both.Morhardt showed that the scores for the 1998reports from all three systems were highlysignificantly correlated with each other butwith a much stronger correlation between theSustainAbility–UNEP system and the DeloitteTouche Tohmatsu system than between eitherof them and the Davis-Walling–Batterman sys-tem. The average normalized scores in both1996 and 1998 were higher in the Davis-Walling–Batterman system than in the Sus-tainAbility–UNEP system with no differencebetween years in either system, indicating noimprovement in average scores between thetwo years. The lack of a change in averagescores between the two years did not, how-ever, reflect a lack of change of scores in thereports of individual companies. Some scoreswent up, some went down, and there was nosignificant correlation between the scores in1996 and 1998.
In this paper we use these three scoringsystems to analyze environmental reports, butthere are other scoring systems extant as well.One (Krut and Munis, 1998) was used toevaluate the environmental reports of eightfirms in the electronics sector, scoring each ofthem for 19 issues using typographical sym-bols in the same way that others have usednumbers – to represent (i) no discussion of theissue, (ii) that the issue was identified/raisedfor consideration, (iii) that there was partialcommitment to the issue, (iv) that there was
full commitment to the issue and (v) that thecommitment exceeded their benchmark crite-rion. This approach differs from the othersdiscussed above in three ways: first, it doesnot evaluate what a firm is actually doing,but only what it is committed to do in policy;second, the issues, rather than being simplytopics discussed in the report, are instead pre-scribed activities intended to be benchmarkscharacteristic of a ‘sustainable firm’; third, thetypographical symbols are intended to pre-vent readers from creating averages and rank-ings which the authors reject as inappropriatebecause the ‘. . .19 categories may not haveequivalent value. . .’ and because ‘. . .it wouldbe unfair. . .’ since different companies havedifferent activities associated with differentenvironmental impacts.
In addition to these scoring systems, whichare designed to evaluate environmental reportsafter the fact, there is also a series ofguidelines intended to influence the con-tent of environmental reports before the fact.The earliest of these, published in 1989,were from the Coalition for EnvironmentallyResponsible Economies (CERES), a group ofAmerica’s largest socially responsible insti-tutional investors – state pension funds andreligious groups – and 15 major US environ-mental groups. These guidelines continue tobe revised (CERES, 1999a, 1999b, 2000a, 2000b)but were being used by just 50 companies atthe end of 2000 (CERES, 2000c). The next majoreffort was the Public Environmental Report-ing Initiative (PERI) Guidelines (PERI, 1993),which were formulated in 1992 and 1993 byten large manufacturing companies. Other fre-quently cited guidelines are those from theFederation des Experts Comptables Europeens(FEE, 1998) and Fondazione Eni Enrico Mat-tei (FEEM, 2000). In addition to these thereis a large number of less well known ini-tiatives suggesting environmental, social andsustainability performance metrics that couldbe used in reporting (see the appendix of Ran-ganathan, 1999).
Copyright 2002 John Wiley & Sons, Ltd and ERP Environment Corp. Soc. Responsib. Environ. Mgmt 9, 215–233 (2002)
219
J. E. MORHARDT, S. BAIRD AND K. FREEMAN
The most prominent current reportingguidelines are the Global Reporting Initia-tive (GRI) Sustainability Reporting Guidelines onEconomic, Environmental and Social Performance(GRI, 2000), promulgated in June 2000. Theyare actively promoted by GRI itself and byCERES and the United Nations EnvironmentProgramme (UNEP), which jointly convenedthe GRI in 1998 (GRI, 2000). The GRI guide-lines go well beyond any previous ones intheir inclusion of financial and social criteria.It is the addition of these criteria that distin-guish ‘sustainability’ reporting from straightenvironmental reporting.
While all of these guidelines explicitlyaddress contents of environmental reports,there are many additional sources of guid-ance that focus on the selection of environ-mental metrics rather than on report writing.These include the ISO 14031 environmentalperformance evaluation guidelines (ISO, 1999),a book from the US National Academy ofEngineering (National Academy of Engineer-ing, 1999), a report from the World BusinessCouncil on Sustainable Development (Vervail-lie and Bidwell, 2000) and many technicalpapers (Wells et al., 1992; Wolfe and Howes,1993; Azzone and Manzini, 1994; Azzone et al.,1996; White and Zinkl, 1997; Bennett andJames, 1998; Reijnders, 1998; White and Zinkl,1998; Wright et al., 1998; Cleveland and Ruth,1999; Dobers and Wolff, 1999; Miakisz, 1999;Murayama, 1999; Rauberger and Wagner, 1999;Rikhardsson, 1999; van der Werf, 1999; Whiteand Zinkl, 1999; Dias-Sardinha and Reijnders,2001; Johnston and Smith, 2001).
The ISO 14031 standard, part of the ISO14000 family of voluntary international envi-ronmental standards, is entirely informationaland makes no recommendations about report-ing or about which metrics a company shouldutilize for management, but it does include, inAnnex A, a list of 197 topics from which com-panies could select metrics for environmentalmanagement and that can be viewed as a fairlycomprehensive collection of metrics on whicha company could base an environmental or
sustainability report. This list goes far beyondany existing reporting guidelines in its inclu-sion of measurements of existing environmen-tal conditions. Whereas most reporting guide-lines are concerned with reporting company-specific natural resource usage, waste gen-eration and emissions–things directly underthe control of individual companies–the ISOguidelines extend to the ecological commonsand to environmental conditions that may havebeen the result of multiple influences not underthe reporting company’s control.
Reporting guidelines are incipient scoringsystems and we took advantage of this toproduce two new comprehensiveness scoringsystems. The first is based on the GRI 2000guidelines (GRI, 2000). The second is basedon the ISO 14031 guidelines (ISO, 1999).Most of the topics in these guidelines arecapable of being treated at various levelsof comprehensiveness, ranging from beingmentioned briefly to being fully documentedquantitatively. Thus, when incorporated into ascoring system, they can be assigned a rangeof points indicating how thoroughly the topicswere discussed.
Our contribution to the environmental com-munication literature is twofold. First, we mea-sure how well current corporate environmentalreports from large companies in four industrialsectors do under the existing scoring systemsand under two scoring systems based on morecomplex new guidelines, and we identify amajor gap between what the newer guidelinespropose and what companies are currentlyreporting. Second, we demonstrate significantdifferences in environmental report compre-hensiveness between consumer product sec-tors (electronics, motor vehicles and parts) andcommodity sectors (petroleum refining, gasand electric utilities).
METHODS
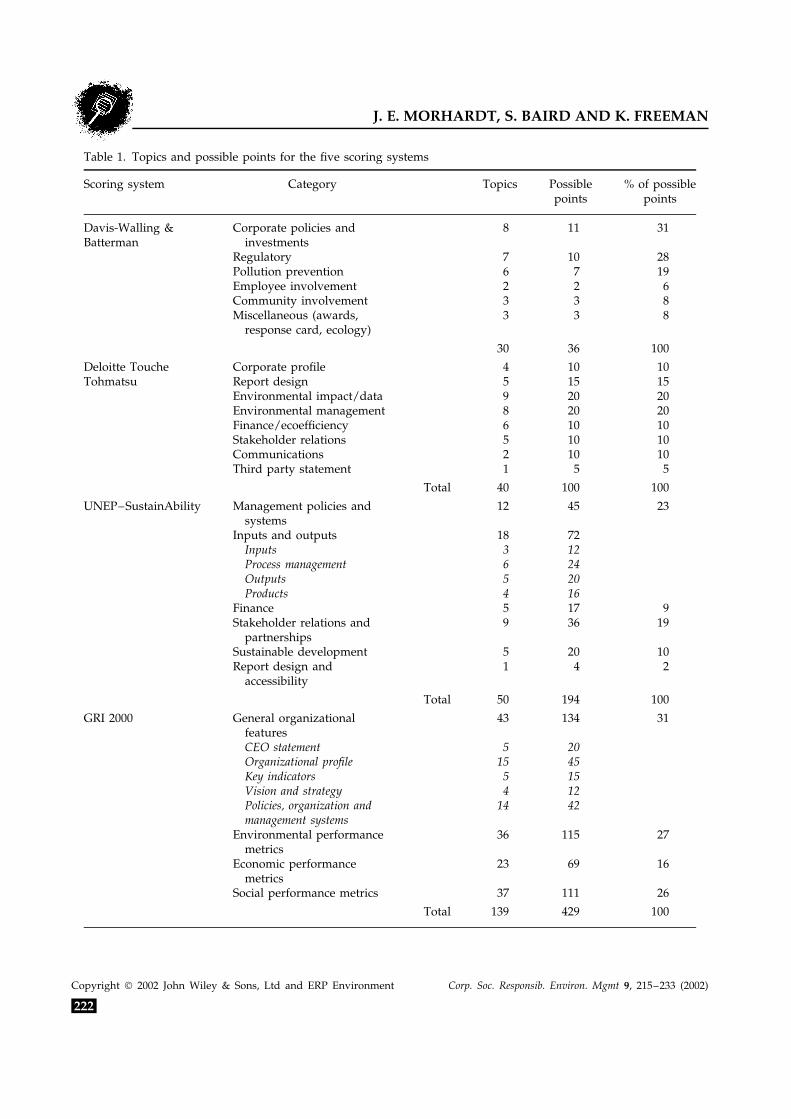
In the GRI 2000 reporting guidelines, the topicscan be arranged into eight categories, the first
Copyright 2002 John Wiley & Sons, Ltd and ERP Environment Corp. Soc. Responsib. Environ. Mgmt 9, 215–233 (2002)
220
SCORING ENVIRONMENTAL AND SUSTAINABILITY REPORTS
five of which deal with various managementand policy considerations, and the last threewith performance (Table 1). To construct ascoring system from these guidelines, wesystematically identified every item called forin Part C of the GRI documentation (thereport content section) – 139 by our count – fora possible 429 points (Table 1). Our generalstrategy for assigning points to each topicwas as follows: 0, not mentioned; 1, anecdotalor briefly mentioned; 2, more detail, butcharacterizing only selected facilities or usingonly self-comparison metrics; 3, company-wide absolute or relative metrics that could becompared with other companies. The natureof the GRI topic list made it seem reasonableto assign more points to some topics than toothers, so in several cases we allowed a topicto be worth four points, and in a few others(such as mentioning the date of the most recentreport) only one point.
The ISO 14031 topics are grouped into fourcategories, which include general informationand three classes of performance indicators:management performance, operational perfor-mance and environmental conditions (Table 1).In creating a scoring system, we approachedAnnex A of the ISO 14031 standard as we hadapproached the GRI guidelines. We identifiedeach separate topic – 197 in all – and assigneda maximum of three points to each using thesame criteria we used for the GRI scoring.The result was a possible total of 591 points(Table 1).
To identify environmental reports to score,we selected four industrial sectors that weknew from previous work had relatively highlevels of environmental reporting (KPMG,1999) and that we felt were sufficiently dif-ferent in their activities that differences in theirenvironmental reports would be detected bythe scoring systems. These included the motorvehicles and parts sector, the electronics sec-tor, the petroleum-refining sector and the gasand electric utilities sector. We used the For-tune Global 500 list (as of 30 January 2000)to identify the largest companies in each of
these sectors, and we searched their Englishlanguage websites for environmental reports.In each sector, we selected the ten largestcompanies that had an environmental reportposted on their websites. These 40 reports arethe basis of our analysis.
We scored them using the scoring sys-tems we created from the GRI 2000 andISO 14031 guidelines and using the Davis-Walling–Batterman (1997), Deloitte ToucheTohmatsu (1999) and SustainAbility–UNEP(1997) systems. The latter three systems hadbeen published well before the 1999 environ-mental reports and could have influenced theirwriters. The GRI 2000 and ISO 14031 guide-lines had not been published prior to the timethe environmental reports were written. Oneof us (JEM) used both the GRI 2000 and ISO14031 guidelines to score all 40 reports. Usingthe Davis-Walling–Batterman, Deloitte ToucheTohmatsu and SustainAbility–UNEP systemsanother of us (SB) scored the 20 electronicsand motor vehicles reports and the third (KF)scored the 20 petroleum and utilities reports.Each report was scored only once.
RESULTS
Table 2 lists the scores for all 40 companiesindividually by industrial sector. The principalresult is that the GRI and ISO scores are muchlower than the scores from the other threesystems. The motor vehicles and parts andelectronics sectors had higher average scoresthan the petroleum refining and utilities sectorsin all but one instance.
Because of the scatter in the scores, mostof the average sector scores within scoringsystems were not statistically significantly dif-ferent from one another based on t-tests ofthe means. The exceptions were electronicsbeing higher (p < 0.05) than the other sectors inthe Davis-Walling–Batterman system, motorvehicles being higher (p < 0.01) in the GRI sys-tem, and both motor vehicles and electronicsbeing higher than petroleum (p < 0.01) and
Copyright 2002 John Wiley & Sons, Ltd and ERP Environment Corp. Soc. Responsib. Environ. Mgmt 9, 215–233 (2002)
221
J. E. MORHARDT, S. BAIRD AND K. FREEMAN
Table 1. Topics and possible points for the five scoring systems
Scoring system Category Topics Possiblepoints
% of possiblepoints
Davis-Walling & Corporate policies and 8 11 31Batterman investments
utilities (p < 0.01 for motor vehicles, p < 0.05for electronics) in the ISO system. For the com-bined average scores of all scoring systems, thepetroleum sector was significantly lower thanvehicles (p < 0.01) and electronics (p < 0.05).
For the Davis-Walling–Batterman system,much of the higher score by the electronics
sector was made up of more emphasis onenvironmental performance. The petroleumsector was lowest in the SustainAbility–UNEPsystem largely because of less attention to envi-ronmental performance and stakeholders, butwas lower in the Deloitte Touche Tohmatsusystem because of generally lower scores in all
Copyright 2002 John Wiley & Sons, Ltd and ERP Environment Corp. Soc. Responsib. Environ. Mgmt 9, 215–233 (2002)
223
J. E. MORHARDT, S. BAIRD AND K. FREEMAN
Table 2. Environmental report scores, normalized to a maximum score of 100 points
Copyright 2002 John Wiley & Sons, Ltd and ERP Environment Corp. Soc. Responsib. Environ. Mgmt 9, 215–233 (2002)
224
SCORING ENVIRONMENTAL AND SUSTAINABILITY REPORTS
categories except discussion of environmentalaspects. Motor vehicles fared best in the GRIsystem because of more attention to environ-mental performance and company profile, andin the ISO system both the electronics andmotor vehicles sectors paid much more atten-tion to environmental performance than didthe petroleum and utilities sectors.
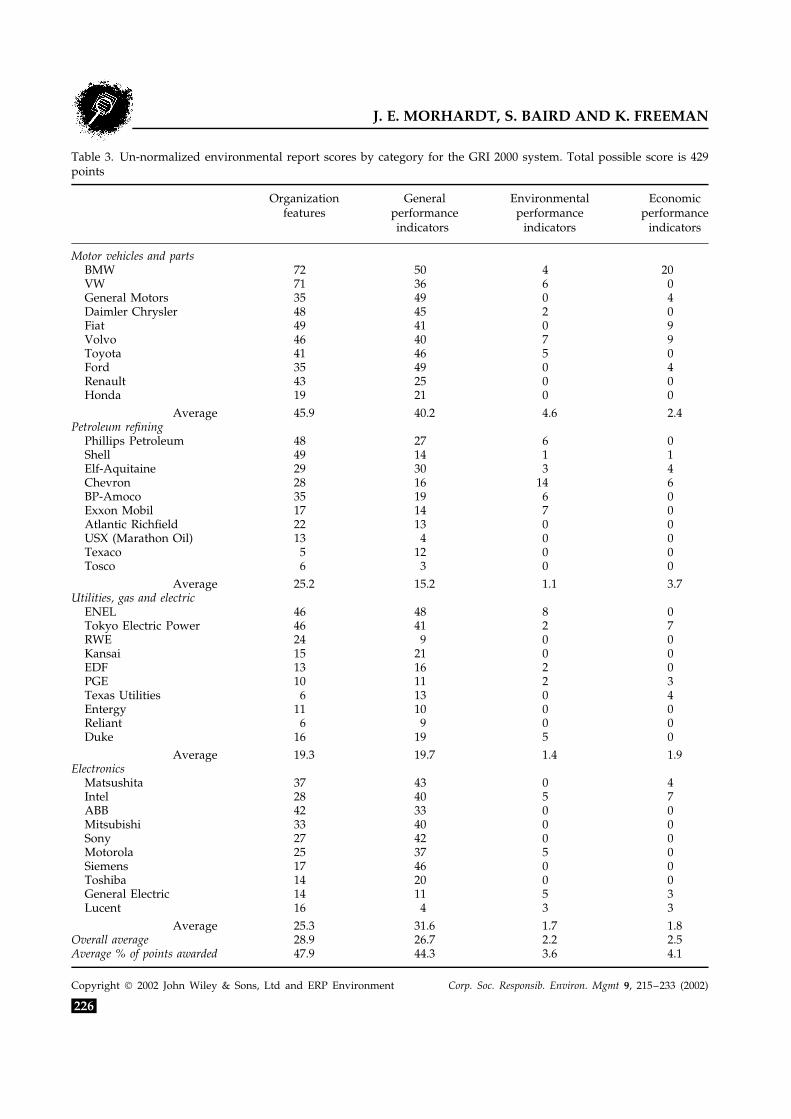
Almost all the points awarded using theGRI system were for general organization top-ics and environmental performance (Table 3).These two categories, comprising the realm oftraditional environmental reporting, represent58% of the total possible points in the GRIscoring system, but they accounted for 93% ofthe actual points with little difference amongsectors. There was, however, considerable vari-ation among companies on the distribution ofpoints between these two categories. For exam-ple, the Volkswagen report had nearly twiceas many points in the general organizationalfeatures category as in the environmental per-formance indicators category, while GeneralMotors, which ranked just below Volkswa-gen in the GRI system, had 40% more pointsin the environmental performance indicatorscategory than in general organizational fea-tures. Not only were the features that dis-tinguish sustainability reports from environ-mental reports – economic and social perfor-mance indicators – underrepresented, half ofthe reports did not include them at all (Table 3).
Within the ISO 14031 scoring system gen-eral issues received an average of 38% of thetotal points awarded and had the most pointsof all four sectors (Table 4), although theyrepresented only 23% of the possible points.The management performance indicators alsoreceived more than their share of points (28%of the awarded points versus 22% of the possi-ble points), while the operational performanceindicators had 30% of the awarded points ver-sus 32% of the possible points. Environmentalcondition indicators, generally not under thedirect control of the company, were stronglyunderrepresented, receiving only 4% of the
awarded points but having 22% of the possi-ble points. The petroleum-refining sector stoodout by having, by far, the lowest number oftotal points (fewer than 40% of the points accu-mulated by the motor vehicle sector), and byhaving those that it did obtain heavily repre-sented in the general issues category.
DISCUSSION
The most striking result is the fact that thecurrent environmental reports of 40 of theworld’s largest companies achieve fewer than20% of the total possible points in the GRI2000 scoring system. There is a tremendous gapbetween what large companies think is appro-priate to report and what is hoped for by theGlobal Reporting Initiative. Much of the gap,however, is occasioned by the fact that mostcompanies are content to leave their finan-cial reporting to their annual financial reports,and much of the remainder to the fact thatsocial reporting is either not perceived to beappropriate for an environmental report, oris simply not being reported at all. The ideaof generally accepted sustainability account-ing principles envisioned by GRI appears tobe barely on the radar of most companies. Theeven lower scores resulting from application ofthe ISO 14031 Annex A guidelines are surpris-ing because the guidelines primarily addressenvironmental performance – the thing mostcompanies are already reporting on. They arefairly comprehensive and not internally redun-dant, and most of the topics are applicableto any company, but, as revealed in Table 4,most companies have not embraced the idea ofreporting on environmental condition indica-tors. What the low scores reveal for the othertopics is the uncomprehensiveness of most cur-rent environmental reporting when comparedwith the ISO 14031 Annex A list of topics.
The three existing scoring systems used inthis paper have been characterized by Kolk(1999) and their numerical comparability has
Copyright 2002 John Wiley & Sons, Ltd and ERP Environment Corp. Soc. Responsib. Environ. Mgmt 9, 215–233 (2002)
225
J. E. MORHARDT, S. BAIRD AND K. FREEMAN
Table 3. Un-normalized environmental report scores by category for the GRI 2000 system. Total possible score is 429points
Average 21.5 18.7 21.0 1.9Overall average 20.2 14.5 15.7 2.2Average % of points awarded 38.4 27.6 29.8 4.0
Copyright 2002 John Wiley & Sons, Ltd and ERP Environment Corp. Soc. Responsib. Environ. Mgmt 9, 215–233 (2002)
227
J. E. MORHARDT, S. BAIRD AND K. FREEMAN
been analyzed by Morhardt (2001). The sys-tems have been criticized on the grounds ofunfairness because different kinds of companyhave different types and intensities of envi-ronmental impact (Krut and Munis, 1998) andbecause the variables on which companies arescored are categorical rather than continuousand hence are inherently inappropriate forarithmetic addition and parametric statisticalanalysis (Jones and Alabaster, 1999). Never-theless, the systems and their scores continueto be used, often highlighting the top andbottom scorers (Elkington et al., 1998; Jonesand Alabaster, 1999; SustainAbility–UNEP,2000; Morhardt, 2001), with some companiesquick to publicize their high scores (Jones andAlabaster, 1999).
The Davis-Walling–Batterman scoring sys-tem is based on topics that were included inat least four of the 25 reports it was originallyused to score (Davis-Walling and Batterman,1997). Thus it uses the most comprehensivereports as the standard by which to judgeall reports but does not go beyond estab-lished practice. The Deloitte Touche Tohmatsuand SustainAbility–UNEP scoring systems aremore aggressive, including topics that may nothave been as widely reported on but that theirauthors felt should have been. In effect, thesescoring systems are judging reports by adher-ence to guidelines that do not exist. However,scoring systems that are independent of writ-ing guidelines tend to become writing guide-lines themselves: after the first round, compa-nies that wish to improve their scores in thesesystems will adjust their reporting accord-ingly. The subset of companies examined byMorhardt (2001) failed to do so, but of the19 reports compared by SustainAbility–UNEPbetween 1997 and 2000 (using 1997 Sustain-Ability–UNEP criteria) 16 showed improve-ment (SustainAbility–UNEP, 2000). In their2000 report, however, SustainAbility–UNEPchanged their scoring system rules, and mostcompanies’ scores declined under the new sys-tem. Thus SustainAbility–UNEP is continuingto play the role of an independent arbiter
after the fact rather than as a source of spe-cific guidelines.
The GRI 2000 reporting guidelines take asimilarly aggressive posture, redefining envi-ronmental reporting as sustainability reportingand including many topics that are barely men-tioned in current environmental reports. TheGRI guidelines were published later than thereports we analyzed, however, so our use ofthem is comparable to SustainAbility–UNEP’suse of its new scoring system on currentreports, written before the guidelines werepublished (SustainAbility–UNEP, 2000), ratherthan our use of its 1997 system on 1999 reports.
The ISO 14031 guidelines fall into neitherof these categories. They were intended as anon-comprehensive list of environmental con-siderations companies might want to considermanaging. Is it legitimate to convert them to ascoring system? We think so, with the caveatthat, unlike the other scoring systems, thereshould be no expectation that any companywould achieve a perfect score. A realistic useof this system might be to compare companiesin the same industrial sector and normalize thescores to the highest achieved in that sector.The ISO 14031 list is the most comprehensiveset we have seen of environmental issues fac-ing companies, and well worth considerationby environmental report writers.
One of the main problems in trying to assessthe scores of corporate environmental reportsis that a particular score can be achieved invery different ways. In the GRI system, forexample, Shell and Elf-Aquitaine have similartotal scores, but Shell’s general organizationalscore is much higher than Elf-Aquitaine’s(Table 3). Even though the overall scores arenearly the same, the components that wentinto them are quite different, so the score,without amplification, is ambiguous. This is ageneral problem any time scores are applied tocategorical variables – depending on how thescales are constructed it may be inappropriateto sum or average them, or to apply parametricstatistical analyses to them, as we have donein this paper. Jones and Alabaster (1999) have
Copyright 2002 John Wiley & Sons, Ltd and ERP Environment Corp. Soc. Responsib. Environ. Mgmt 9, 215–233 (2002)
228
SCORING ENVIRONMENTAL AND SUSTAINABILITY REPORTS
discussed this issue in some detail with respectto corporate environmental report scoringsystems and conclude, correctly we think, that‘Further work must be conducted to createmore rigorous, fully justifiable and calibratedscales. . ..’ On the other hand, even thoughsimilar scores may not mean the same thing,high scores do represent more open reporting,if not necessarily in exactly the same topics.Moreover, very high scores that are near themaximum possible scores are automaticallycomparable within a particular scoring system.The more difficult problem may be sorting outthe differences between scoring systems andreaching conclusions about which system ismost appropriate.
Is scoring for comprehensiveness fair andadequate?
All of the scoring systems used here evaluatecorporate environmental reports based on therange of items discussed and the intensityof discussion, rather than on the qualityof environmental performance. Two of theconsequences are that (i) environmentallybenign companies, with no substantive reasonto discuss many of the topics, will have lowscores if they restrict themselves to topicsrelevant to them and (ii) any company wishingto improve its score can do so simply by addingtopics, irrespective of performance.
The first consequence means that if a singleguideline or scoring system is applied to allcompanies in all sectors, benign companieswishing to score well will have to havereports as detailed as those with the mostcomplex operations and the greatest potentialimpacts. This seems inherently wrong, and hasbeen addressed by CERES with sector-specificguidelines (CERES, 2000a, 2000b). Companieshave addressed this issue by putting details infacility-specific (Daimler Chrysler) or product-specific (ABB, Volvo) reports but have notnecessarily found ways to translate their logicinto good report scores.
Another approach is to simplify report scor-ing systems, even to the point of substi-tuting icons for numerical scores (Krut andMunis, 1998) to frustrate attempts at compar-ing scores. This does not seem to us the bestsolution. Environmental performance is clearlyamenable to scientific analysis, which, if it is tomean anything, must be reducible to numbers,which can be subjected to statistical analysis.
The second consequence means that compa-nies have the potential to manipulate scoreswithout increasing their environmental per-formance (Morhardt, 2001). By simply addingtopics and discussing them, irrespective of per-formance or improvement, scores in each ofthese systems can be improved. Since there isno penalty in any of the systems for includ-ing topics that are not scored, it is feasible toachieve high – possibly perfect – scores in allof the systems. Clearly it is not the intent ofany of the guidelines or scoring systems toencourage such behavior, but linking scoringto content rather than performance assures thatthis option is available to be explored.
The amount of detail contained in theGRI 2000 and ISO 14031 guidelines shouldbe very helpful to writers of environmentaland sustainability reports. The two guidelinescover somewhat different material but incombination provide much more guidancethan could be obtained from any of theexisting guidelines or scoring systems. A reportthat scored well under both the GRI andISO systems would be far more informativethan any of the reports we examined forthis paper. Short of implementing systematicsector-wide quantitative metrics, following acombination of the GRI 2000 and ISO 14031guidelines would go a long way towardcreating the transparency that most reportreaders would like.
The low scores from the GRI 2000 andISO 14031 scoring systems compared withthe scores from the existing scoring systemsmake it clear that there is considerable roomfor improvement both in environmental andsustainability reporting and in scoring.
Copyright 2002 John Wiley & Sons, Ltd and ERP Environment Corp. Soc. Responsib. Environ. Mgmt 9, 215–233 (2002)
229
J. E. MORHARDT, S. BAIRD AND K. FREEMAN
REFERENCES
Andersson LM, Bateman TS. 2000. Individual environ-mental initiative: championing natural environmentalissues in U.S. business organizations. Academy of Man-agement Journal 43(4): 548–570.
Aragon-Correa JA. 1998. Strategic proactivity and firmapproach to the natural environment. Academy ofManagement Journal 41(5): 556–567.
Azzone G, Manzini R. 1994. Measuring strategicenvironmental performance. Business Strategy and theEnvironment 3(1): 1–14.
Azzone G, Noci G, Manzini R, Welford RJ. 1996.Defining environmental performance indicators: anintegrated framework. Business Strategy and theEnvironment 5: 69–80.
Ball A, Owen DL, Gray R. 2000. External transparencyor internal capture: the role of third-party statementsin adding value to corporate environmental reports.Business Strategy and the Environment 9(1): 1–23.
Bansal P, Roth K. 2000. Why companies go green:a model of ecological responsiveness. Academy ofManagement Journal 43(4): 717–736.
Bennett M, James P. 1998. Environment under theSpotlight: Current Practices and Future Trendsin Environment-Related Performance Measurementfor Business. Association of Chartered CertifiedAccountants: London.
Berman SL, Wicks AC, Kotha S, Jones TM. 1999. Doesstakeholder orientation matter? The relationshipbetween stakeholder management models and firmfinancial performance. Academy of Management Journal42(5): 488–506.
Bowen FE. 2000. Environmental visibility: a trigger ofgreen organizational response? Business Strategy andthe Environment 9: 92–107.
Cerin P, Dobers P. 2001. What does the performanceof the Dow Jones Sustainability Group tell us? Eco-Management and Auditing 8: 123–133.
Christmann P. 2000. Effects of ‘best practices’ ofenvironmental management on cost advantage: therole of complementary assets. Academy of ManagementJournal 43(4): 663–680.
Cleveland CJ, Ruth M. 1999. Indicators of dematerial-ization and the materials intensity of use. Journal ofIndustrial Ecology 2(3): 15–50.
Coalition for Environmentally Responsible Economies(CERES). 1999a. 1998 CERES Report Short Form. CERES:Boston.
Coalition for Environmentally Responsible Economies(CERES). 1999b. 1998 CERES Report Standard Form.CERES: Boston.
Coalition for Environmentally Responsible Economies(CERES). 2000a. 1999 CERES Report Electric and GasIndustries Form. CERES: Boston.
Coalition for Environmentally Responsible Economies(CERES). 2000c. www.ceres.org [5 December 1999].
Cordano M, Frieze IH. 2000. Pollution reductionpreferences of U.S. environmental managers: applyingAjzen’s theory of planned behavior. Academy ofManagement Journal 43(4): 627.
Cormier D, Magnan M. 1999. Corporate environmentaldisclosure strategies: determinants, costs and benefits.Journal of Accounting Auditing and Finance 14(4):429–451.
Davis-Walling P, Batterman SA. 1997. Environmentalreporting by the Fortune 50 firms. EnvironmentalManagement 21(6): 865–875.
Dechant K, Altman B, Downing RM, Keeney T. 1994.Environmental leadership: from compliance tocompetitive advantage. Academy of ManagementExecutive 8(3): 7–28.
Dias-Sardinha I, Reijnders L. 2001. Environmental per-formance evaluation and sustainability performanceevaluation of organizations: an evolutionary frame-work. Eco-Management and Auditing 8: 71–79.
Diltz D. 1995. The private cost of socially responsibleinvesting. Applied Financial Economics 5(2): 69–77.
Dobers P, Wolff R. 1999. Eco-efficiency and demate-rialization: scenarios for new industrial logics inrecycling industries, automobile and household appli-ances. Business Strategy and the Environment 8: 31–45.
Elkington J, Kreander N, Stibbard H. 1998. The thirdinternational survey on company environmentalreporting: the 1997 benchmark survey. GreenerManagement International 21: 99–111.
Esty DC, Porter ME. 1998. Industrial ecology andcompetitiveness: strategic implications for the firm.Journal of Industrial Ecology 2(1): 35–43.
Federation des Experts Comptables Europeens (FEE).1998. Towards a Generally Accepted Framework forEnvironmental Reporting. FEE: Bruxelles.
Flannery BL, May DR. 2000. Environmental ethicaldecision making in the U.S. metal-finishing industry.Academy of Management Journal 43(4): 642–662.
Fondazione Eni Enrico Mattei (FEEM). 2000. CompanyEnvironmental Reports: Guidelines for Preparation.http://www.feem.it [24 February 2000].
Ghobadian A, Viney H, James P, Liu J. 1995. Theinfluence of environmental issues in strategic analysisand choice. Management Decision 33(10): 46–58.
Ghobadian A, Viney H, Liu J, James P. 1998.Extended linear approaches to mapping corporateenvironmental behavior. Business Strategy and theEnvironment 7: 13–23.
Copyright 2002 John Wiley & Sons, Ltd and ERP Environment Corp. Soc. Responsib. Environ. Mgmt 9, 215–233 (2002)
230
SCORING ENVIRONMENTAL AND SUSTAINABILITY REPORTS
Global Reporting Initiative (GRI). 2000. SustainabilityReporting Guidelines on Economic, Environmental, andSocial Performance. GRI: Boston.
Graedel TE. 1998. Life-cycle assessment in the serviceindustries. Journal of Industrial Ecology 1(4): 57–70.
Halme M, Niskanen J. 2001. Does corporate environ-mental protection increase or decrease shareholdervalue? The case of environmental investments. Busi-ness Strategy and the Environment 10: 200–214.
Hamilton S, Jo H, Statman M. 1993. Doing well whiledoing good? The investment performance of sociallyresponsible mutual funds. Financial Analysts JournalNovember/December: 62–66.
Hart SL. 1995. A natural-resource-based view of the firm.Academy of Management Review 20(4): 986–1014.
Hart SL, Ahuja G. 1996. Does it pay to be green? Anempirical examination of the relationship betweenemission reduction and firm performance. BusinessStrategy and the Environment 5: 30–37.
Henriques I, Sadorsky P. 1999. The relationshipbetween environmental commitment and managerialperceptions of stakeholder importance. Academy ofManagement Journal 42(1): 87–99.
Herremans IM, Welsh C, Kane D, Bott R. 1999. How anenvironmental report can help a company ’learn’ aboutits own environmental performance. Eco-Managementand Auditing 6: 158–169.
Howard J, Nash J, Ehrenfeld J. 1999. Industry codesas agents of change: Responsible Care adoption byUS chemical companies. Business Strategy and theEnvironment 8: 281–295.
Hussain SS. 1999. The ethics of ’going green’: thecorporate social responsibility debate. Business Strategyand the Environment 8: 203–210.
International Organisation for Standardization (ISO).1999. ISO 14031 Environmental Management – Environ-mental Performance Evaluation – Standards and Guide-lines. ISO: Geneva.
Johnston A, Smith A. 2001. The characteristics andfeatures of corporate environmental performanceindicators – a case study of the water industry ofEngland and Wales. Eco-Management and Auditing 8:1–11.
Jones K, Alabaster T. 1999. Critical analysis of corporateenvironmental reporting. Journal of EnvironmentalAssessment Policy and Management 1: 27–60.
King AA, Lenox MJ. 2000. Industry self-regulationwithout sanctions: the chemical industry’s ResponsibleCare Program. Academy of Management Journal 43(4):698–716.
Kolk A. 1999. Evaluating corporate environmentalreporting. Business Strategy and the Environment 8:225–237.
Kolk A, Walhain S, van de Wateringen S. 2001.Environmental reporting by the Fortune Global 250:
exploring the influence of nationality and sector.Business Strategy and the Environment 10: 15–28.
KPMG. 1999. KPMG International Survey of EnvironmentalReporting 1999. KPMG Environmental Consulting: DeMeern, The Netherlands.
Krut R, Munis K. 1998. Sustainable industrialdevelopment: benchmarking environmental policiesand reports. Greener Management International 21:87–98.
Lober DJ, Bynum D, Campbell E, Jaques M. 1997. The100 plus corporate environmental report study: asurvey of an evolving environmental managementtool. Business Strategy and the Environment 6:57–73.
Miakisz JA. 1999. Measuring and benchmarkingenvironmental performance in the electric util-ity sector: the experience of Niagara Mohawk.In Sustainable Measures: Evaluation and Report-ing of Environmental and Social Performance,Bennett M, James P (eds). Sheffield: Greenleaf;221–245.
Morhardt JE. 2001. Scoring corporate environmentalreports for comprehensiveness: a comparison of threesystems. Environmental Management 26(6): 881–892.
Murayama T. 1999. Environmental reporting in Japan:current status and implications of ISO 14001 and apollutant release inventory. In Sustainable Measures:Evaluation and Reporting of Environmental and SocialPerformance, Bennett M, James P (eds). Sheffield:Greenleaf; 365–376.
National Academy of Engineering. 1999. IndustrialEnvironmental Performance Metrics: Challenges andOpportunities. Committee on Industrial PerformanceMetrics, National Academy of Engineering, NationalResearch Council. National Academy Press:Washington, DC.
Porter ME, van der Linde C. 1995. Toward anew conception of the environment–competitivenessrelationship. Journal of Economic Perspectives 9(4):97–118.
Public Environmental Reporting Initiative (PERI). 1993.PERI Guidelines. http://www.ibm.com/ibm/environ-ment/initiatives/peri.phtr [24 December 2000].
Ranganathan J. 1999. Signs of sustainability: measuringcorporate environmental and social performance.In Sustainable Measures: Evaluation and Reportingof Environmental and Social Performance, Bennett M,James P (eds). Sheffield: Greenleaf; 475–495.
Ransom P, Lober DJ. 1999. Why do firms setenvironmental performance goals?: some evidencefrom organizational theory. Business Strategy and theEnvironment 8: 1–13.
Rauberger R, Wagner B. 1999. Ecobalance analysis asa managerial tool at Kunert AG. In SustainableMeasures: Evaluation and Reporting of Environmental and
Copyright 2002 John Wiley & Sons, Ltd and ERP Environment Corp. Soc. Responsib. Environ. Mgmt 9, 215–233 (2002)
231
J. E. MORHARDT, S. BAIRD AND K. FREEMAN
Social Performance, Bennett M, James P (eds). Sheffield:Greenleaf; 170–183.
Reijnders L. 1998. The factor X debate: setting targetsfor eco-efficiency. Journal of Industrial Ecology 2(1):13–22.
Reinhardt F. 1999. Market failure and the environmentalpolicies of firms: economic rationales for ‘beyondcompliance’ behavior. Journal of Industrial Ecology 3(1):9–21.
Rikhardsson PM. 1999. Statutory environmentalreporting in Denmark. In Sustainable Measures:Evaluation and Reporting of Environmental and SocialPerformance, Bennett M, James P (eds). Sheffield:Greenleaf; 344–352.
Rivera-Camino J. 2001. What motivates European firmsto adopt environmental management systems? Eco-Management and Auditing 8: 134–143.
Roy M-J, Boiral O, Legace D. 2001. Environmentalcommitment and manufacturing excellence: acomparative study within Canadian industry. BusinessStrategy and the Environment 10: 257–268.
Russo MV, Fouts PA. 1997. A resource-basedperspective on corporate environmental performanceand profitability. Academy of Management Journal 40(3):534–559.
Sharma S. 2000. Managerial interpretations andorganizational context as predictors of corporatechoice of environmental strategy. Academy ofManagement Journal 43(4): 681–697.
Shrivastava P. 1995. The role of corporations in achievingecological sustainability. Academy of ManagementReview 20(4): 936–960.
Stafford ER. 1996. Green alliances: strategic relationsbetween business and environmental groups. BusinessHorizons 39(2): 50–59.
Stanwick PA, Stanwick SD. 2001. CEO compensation:does it pay to be green. Business Strategy and theEnvironment 10: 176–182.
Stanwick SD, Stanwick PA. 2000. The relationshipbetween environmental disclosures and financialperformance: an empirical study of US firms. Eco-Management and Auditing 7: 155–164.
Stray S, Ballantine J. 2000. A sectoral comparison ofcorporate environmental reporting and disclosure.Eco-Management and Auditing 7: 165–177.
SustainAbility–UNEP. 1996. Engaging Stakeholders:Volume 1: the Benchmark Survey. London.
SustainAbility–UNEP. 1997. The 1997 Benchmark Survey:the Third International Progress Report on CompanyEnvironmental Reporting. London.
SustainAbility–UNEP. 2000. The Global Reporters: the 2000Benchmark Survey. London.
Thomas A. 2001. Corporate environmental policyand abnormal stock price returns: an empiricalinvestigation. Business Strategy and the Environment10: 125–134.
Tilley F. 1999a. The gap between the environmentalattitudes and the environmental behavior of smallfirms. Business Strategy and the Environment 8:238–248.
Tilley F. 1999b. Small-firm environmental strategy: theUK experience. Greener Management International 25:1–14.
Turban DB, Greening DW. 1997. Corporate socialperformance and organizational attractiveness toprospective employees. Academy of Management Journal40(3): 658–672.
van der Werf WN. 1999. A weighted environmentalindicator at Unox: an advance towards sustainabledevelopment? In Sustainable Measures: Evaluation andReporting of Environmental and Social Performance,Bennett M, James P (eds). Sheffield: Greenleaf;246–252.
Vervaillie HA, Bidwell R. 2000. Measuring Eco-Efficiency:a Guide to Reporting Company Performance. WorldBusiness Council for Sustainable Development:London.
Waddock SA, Graves SB. 1997a. The corporate socialperformance–financial performance link. StrategicManagement Journal 18(4): 303–319.
Waddock SA, Graves SB. 1997b. Quality of managementand quality of stakeholder relations: are theysynonymous? Business and Society 36(3): 250–279.
Waddock SA, Graves SB. 2000. Performance character-istics of social and traditional investments. Journal ofInvesting 9(2): 27–41.
White A, Zinkl D. 1997. Corporate EnvironmentalPerformance Indicators: a Benchmark Survey of BusinessDecision Makers. Tellus Institute: Boston.
White AL, Zinkl D. 1998. Green Metrics: a GlobalStatus Report on Standardized Corporate EnvironmentalReporting. Tellus Institute: Boston.
White AL, Zinkl D. 1999. Standardisation: the nextchapter in corporate environmental performanceevaluation and reporting. In Sustainable Measures:Evaluation and Reporting of Environmental and SocialPerformance, Bennett M, James P (eds). Sheffield:Greenleaf; 117–131.
Wolfe A, Howes HA. 1993. Measuring environmentalperformance: theory and practice at OntarioHydro. Total Quality Environmental Management 2(4):355–366.
Wright M, Allen D, Clift R, Sas H. 1998. Measuringcorporate environmental performance: the ICIenvironmental burden system. Journal of IndustrialEcology 1(4): 117–127.
Copyright 2002 John Wiley & Sons, Ltd and ERP Environment Corp. Soc. Responsib. Environ. Mgmt 9, 215–233 (2002)
232
SCORING ENVIRONMENTAL AND SUSTAINABILITY REPORTS
BIOGRAPHY
J. Emil Morhardt is Roberts Professor of Envi-ronmental Biology, and Sarah Baird1 and Kelly
1 Present address: Department of Agricultural and ResourceEconomics, 207 Giannini Hall, University of California, Berkeley,CA 94720-3310, USA.
Freeman are research associates at the RobertsEnvironmental Center, Claremont McKennaCollege, 925 N. Mills Avenue, Claremont, CA91711-5916, USA.Tel.: +1 (909) 621–8190Fax: +1 (909) 621–8588E-mail: [email protected]
Copyright 2002 John Wiley & Sons, Ltd and ERP Environment Corp. Soc. Responsib. Environ. Mgmt 9, 215–233 (2002)