SCOTLAND’S POPULATION 2011 The Registrar General’s Annual Review of Demographic Trends 157 th Edition A National Statistics publication for Scotland. National Statistics are produced to high professional standards set out in the Code of Practice for Official Statistics. They undergo regular quality assurance reviews to ensure that they meet customer needs. They are produced free from any political interference. (Laid before the Scottish Parliament pursuant to Section 1(4) of the Registration of Births, Deaths and Marriages (Scotland) Act 1965) SG/2012/113 Published 2 August 2012
Transcript
SCOTLAND’S POPULATION 2011 The Registrar General’s Annual Review of Demographic Trends 157th Edition
A National Statistics publication for Scotland. National Statistics are produced to high professional standards set out in the Code of Practice for Official Statistics. They undergo regular quality assurance reviews to ensure that they meet customer needs. They are produced free from any political interference.
(Laid before the Scottish Parliament pursuant to Section 1(4) of the Registration of Births,
Deaths and Marriages (Scotland) Act 1965) SG/2012/113 Published 2 August 2012
157th Edition To Scottish Ministers I am pleased to let you have my Annual Report for the year 2011, which will be laid before the Scottish Parliament pursuant to Section 1(4) of the Registration of Births, Deaths and Marriages (Scotland) Act 1965. George MacKenzie Registrar General for Scotland 2 August 2012
It is a great pleasure to introduce my first annual report as Registrar General. Following the merger that formed the National Records of Scotland, it was logical to combine the roles of Registrar General and Keeper of the Records. This is not the first time this has happened. When statutory registration was introduced in 1855 the then Deputy Clerk Register also became the first Registrar General.
Scotland’s population has reached an all-time high. We estimate that on 30 June 2011 it was 5,254,800 (based on the 2001 census), an increase of 0.6% on the previous year. This continues the trend of recent years and is partly because there were more births than deaths, but mainly because more people moved to Scotland than left.
But the picture is more complex than simply a continuing upward trend. First, the increase was felt in different ways across the country. Areas like Perth & Kinross and Edinburgh saw increases of 10% or more over the last 10 years, while others saw their population reducing. Second, the population continued to age so that the number of people aged 65 and over is now the same as the number of those under 16. The number of households is also increasing, partly as a result of the ageing population and also because more people are living alone or in smaller family groups.
We expect the population to go on rising to 5.76 million by 2035, and to age significantly, with the number of people aged 65 or over rising by 63% in the same period. We also expect the number of households to rise from 2.37 million today, to 2.89 million by 2035. This represents a major change over the coming years, which is deeply significant for policy makers.
In 2011 there was a slight drop in the number of births, to 58,590, which is 0.3% fewer than in 2010. The average age of parents increased again, and is now 29.7 for mothers and 32.4 for fathers. Just over a half of babies were born to unmarried parents, but the majority of those were registered in the name of both parents. Among mothers giving birth here, 86% of those mothers were born in the UK, including 76% born in Scotland.
The number of deaths dropped by 0.6% to reach 53,661, the lowest annual total since registration began in 1855. The four main causes of death were cancer (29% of deaths), coronary heart disease (14% of deaths), diseases of the respiratory system (13% of deaths) and strokes (9% of deaths). Death rates in Scotland from cancer, coronary heart disease and stroke are well above those for the rest of the UK. Life expectancy in Scotland has improved significantly in the past 25 years. People born today can expect to live to 80.6 for women and 76.1 for men. However, these figures are still well below most of the other EU countries.
Migration (people moving to and from Scotland) accounted for the biggest part of Scotland’s population increase, with 28,300 more people coming here than leaving. In 2011, 43,700 people came to Scotland from the rest of the UK and 42,300 came from overseas. In the same period, 40,800 people left Scotland for other parts of the UK and 16,900 went abroad. Most of the people moving to and from Scotland were in the 16 to 34 age group.
The highest proportion of people moving to Scotland moved to the east, to Perth & Kinross, Edinburgh and East Lothian. The highest proportion of people leaving was from the west, from West Dunbartonshire, East Dunbartonshire and Inverclyde.
There were 29,135 marriages registered in Scotland last year. Tourist marriages, where neither bride nor groom lived in Scotland, remain popular, accounting for nearly a quarter of these (23%). Gretna remained the most popular location for tourist marriages. Over half of marriages in Scotland last year were civil ceremonies by a registrar, compared with less than a third in 1971. There were 554 civil partnerships last year. Of the couples registering civil partnerships, rather more were female than male, with 327 female couples and 227 male couples.
We continue to process the results of the 2011 census and we will start to publish these towards the end of the year. Our timetable is different from England and Wales because we used a different methodology. We relied heavily on our 6,000 enumerators to hand-deliver and collect forms and to make follow-up visits to households. We are also, for the first time, carrying out the statistical processing ourselves, while working closely with colleagues in the Office of National Statistics to make sure our results are compatible. This approach was based on a careful assessment of Scottish conditions and needs, in consultation with our users. It means that we will have very high-quality statistics which are valuable for policy makers and researchers.
The census provides the most accurate view of the population at a fixed time, and is the base for our annual estimates. However, it is an expensive and lengthy process and we are actively looking at alternatives in the light of work at UK and international level. This report includes a chapter from an expert in this area, David Martin from the University of Southampton, who sets out some of the alternatives.
This report also includes, for the first time, a report on the registration system which has been used since 1855. Today a network of around 700 local-authority registrars across the country record births, marriages, civil partnerships and deaths, and provide around 150,000 records each year to the central databases in Edinburgh. These records are one of the main sources of our annual calculations and underlie all the statistics in this report.
As well as being my first report as Registrar General, this will also be my last as I intend to retire in the autumn of 2012. I would like to thank all the staff of the National Records of Scotland for their exceptional expertise, energy and effort in the past year, all of which is reflected in this report.
Population The estimated population of Scotland on 30 June 2011 was 5,254,800 (based on the 2001 census), the highest ever. The population of Scotland grew by around 32,700 in the 12 months between 1 July 2010 and 30 June 2011, an increase of 0.6%. The increase in the population in the 12 months between 1 July 2010 and 30 June 2011 was mainly due to:
• 27,000 more people coming to Scotland than leaving; and • 4,809 more births than deaths.
The age of the population of Scotland was as follows:
• 17% of people were aged under 16 • 66% of people were aged 16 to 64 • 17% of people were aged 65 and over.
Scotland’s population has been fairly stable over the past 50 years. It peaked at 5.24 million in 1974 before falling to 5.05 million in 2002. It then increased each year to reach 5.25 million in 2011. That increase has mainly been the result of more people moving to Scotland than leaving. Changes in the population vary across Scotland. In the 10 years from 2001 to 2011, the council areas which had the highest population increases and reductions were as follows:
• Perth & Kinross – up 11% • Edinburgh – up 10% • Inverclyde – down 6%.
Current projections (estimates for future years largely based on past trends) suggest that the population of Scotland will rise to 5.76 million by 2035 and that the population will age significantly, with the number of people aged 65 and over increasing by 63%, from 0.88 million to 1.43 million. Births There were 58,590 births registered in Scotland in 2011. There were 201 (0.3%) fewer births in 2011 than in 2010. This is the third year the number of births has fallen (following increases in each of the previous six years). The average age of mothers has increased from 27.4 in 1991 to 29.7 in 2011. Similarly, the average age of fathers has increased from 30.0 in 1991 to 32.4 in 2011. The percentage of babies born to unmarried couples rose steadily from the 1970s until 2008. In 2010 it was slightly more than 50% for Scotland as a whole, the same level as in
the previous two years. Most births are registered by both parents. In 2010 and 2011, 5.3% of births were registered in just the mother’s name – the lowest percentage since 1981. 86% of mothers who gave birth in Scotland in 2011 were born in the UK, including 76% who were born in Scotland. 6% of mothers had been born elsewhere in the European Union (EU), including 4% from the countries which joined the EU in 2004 (such as Poland). For 15% of births in 2011 neither parent was born in Scotland (compared with 9% in 2003) and for 9% of births neither parent was born in the UK (compared with 3% in 2003). Deaths
There were 53,661 deaths registered in Scotland in 2011. This was 306 (0.6%) less than in 2010 and was the lowest number of deaths recorded since 1855 (when civil registration was introduced). The main causes of deaths were:
• cancer, which caused 15,457 deaths (29% of all deaths); • ischaemic (coronary) heart disease, which caused 7,636 deaths (14% of all
deaths); • respiratory system diseases (such as pneumonia), which caused 6,791 deaths
(13% of all deaths); and • cerebrovascular disease (stroke), which caused 4,594 deaths (9% of all deaths).
The percentage of deaths caused by coronary heart disease has fallen from 29% in 1980-1982 to 14% in 2011, but the percentage of deaths caused by cancer has risen from 22% to 29%. Death rates from cancer, coronary heart disease and stroke in Scotland are well above the rates for the other countries in the UK. There were 299 stillbirths and 238 infant deaths in 2011. Death rates for both have improved significantly. The rate of stillbirths has dropped from 13.1 for every 1,000 births (live births and stillbirths) in 1971 to 5.1 in 2011. The infant death rate fell from 19.9 for every 1,000 live births in 1971 to 4.1 in 2011. Life expectancy Life expectancy in Scotland has improved greatly over the last 25 years, increasing from 69.1 years for men and 75.3 years for women born around 1981 to 76.1 years for men and 80.6 years for women born around 2010. Despite recent improvements, Scottish men and women have poor life expectancy compared with most of the EU – 3.6 years lower for men and 4.7 years lower for women compared with the countries where life expectancy is highest.
Migration (people moving into and out of the country) In the last half of the 20th century, more people tended to leave Scotland than move here. However, since 2002, this has changed. In the year to 30 June 2011, the number of people moving to Scotland from other parts of the UK, and the number moving out of Scotland to other parts of the UK were as follows:
• 43,700 people came to Scotland from the rest of the UK; and • 40,800 people left Scotland for other parts of the UK.
This movement of people increased the population by around 2,900 people, lower than the increase in the two previous years. In the year to 30 June 2011, the number of people moving to Scotland from overseas and the number moving out of Scotland to go overseas were as follows:
• 42,300 people came to Scotland from overseas; and • 16,900 people left Scotland to go overseas.
This movement of people increased the population by around 25,400 – the highest since current records began in 1991-92. Most people moving to and from Scotland are young – between 16 and 34, with smaller peaks for children under 5 moving to and from Scotland. Marriages and civil partnerships There were 29,135 marriages in Scotland in 2011. This includes 6,829 marriages (23%) where neither the bride nor groom lived in Scotland, but does not include people living in Scotland who marry elsewhere. The average age at which people marry for the first time has increased by around two years in the last 10 years, to 32.6 years for men and 30.9 years for women. Just over half of all marriages (52%) were civil ceremonies, carried out by a registrar – compared with just under one-third (31%) in 1971. Just over half of these civil ceremonies took place in registration offices, with the rest taking place in approved places. Most religious marriages were carried out by Church of Scotland ministers (5,557), with clergy from the Roman Catholic Church carrying out 1,729 marriages. Celebrants from the Humanist Society of Scotland, authorised to carry out marriages since 2005, officiated at 2,486 marriages compared with 2,092 in 2010. In 2011 there were 554 civil partnerships – 227 male couples and 327 female couples. In 2011, there were 9,862 divorces and 44 civil partnerships were dissolved (legally ended) in Scotland.
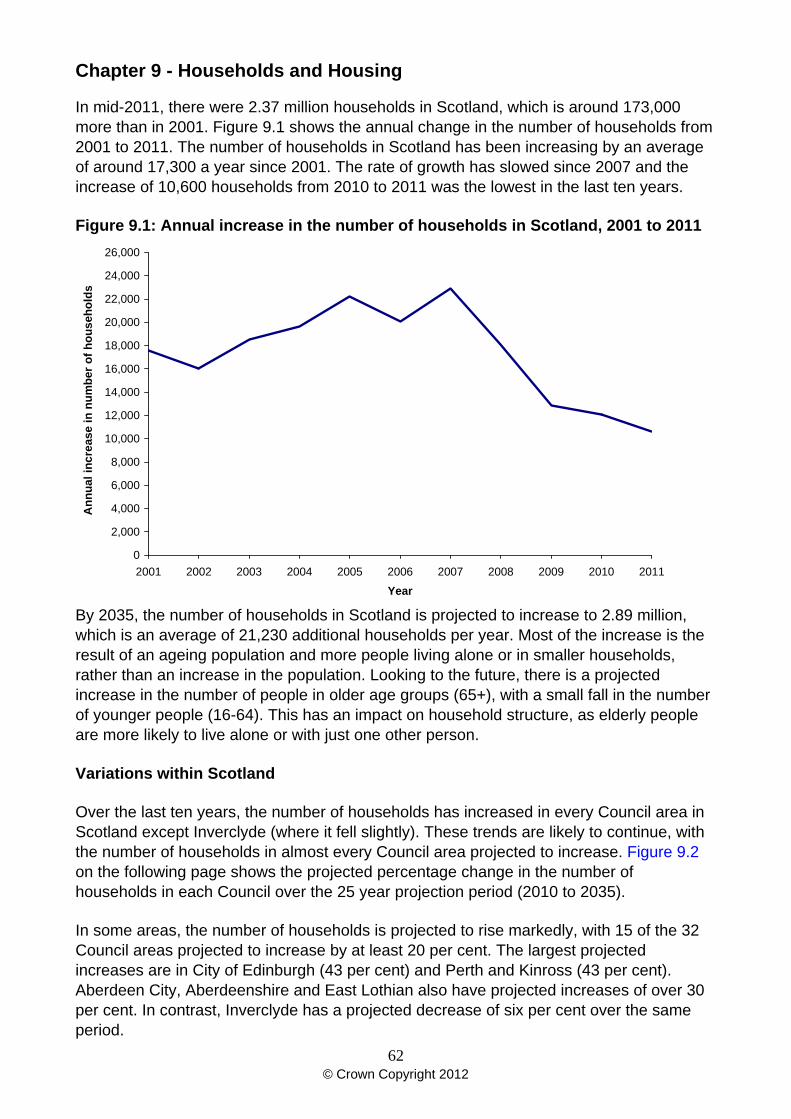
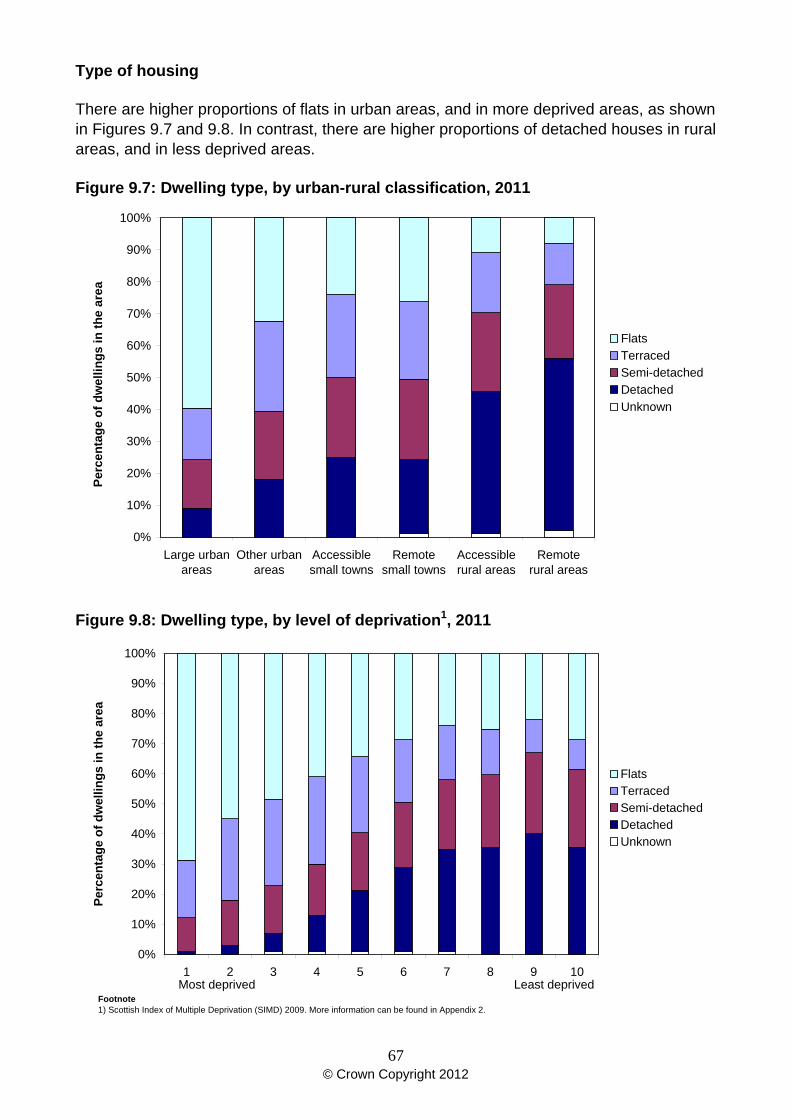
Adoptions In 2011, there were 496 adoptions recorded in Scotland, 30 more than in 2010. The number of adoptions each year is around a quarter of what it used to be in the early 1970s. Households and housing In the middle of 2011, there were 2.37 million households in Scotland – around 173,000 more than in 2001. The number of households has been increasing steadily, but this growth has slowed over the last four years. Between 2010 and 2011, the increase in the number of households (10,600) was lower than in the last 10 years. Projections suggest that by 2035 the number of households in Scotland will increase to 2.89 million, which is an average of 21,230 extra households each year. Most of that expected increase in the number of households is the result of an ageing population, and more people living alone or in smaller households, rather than an increase in the population. Across Scotland in 2010, 2.8% of homes were empty and 1.5% were second homes, though there are wide differences across the country. There are more empty homes in more deprived areas, and more second homes in the remote rural areas. Statutory registration Since 1855, by law all births, deaths and marriages (and now civil partnerships) must be registered. The local authorities are responsible for providing the registration service under the supervision of the Registrar General. There are currently three district examiners who are responsible for checking the accuracy of all the 150,000 records created each year. Every year since 2007, registrars in the 32 councils have achieved a high rate of accuracy, with an average of over 97% of the records they create having no mistakes in them. Beyond 2011: future options for collecting information about the population Following on from the census carried out in 2011, options for gathering information about the population in 2021 are being considered. It is becoming increasingly difficult to carry out a successful census. As the census is a basis for other statistics, the 10-year cycle means that the information statistics are based on can be up to 12 years old before new results become available. Alternatives being examined include making better use of administrative data, surveys, a rolling census or, as some countries are doing, just carrying on with the census.
Chapter 1 - Population The latest estimate of Scotland’s population (on 30 June 2011) is 5,254,8001 – the highest ever and an increase of 32,700 people on the previous year. There are around 200,000 more people in Scotland than in 2002, when the population was at its lowest level in recent times.
The current increase in Scotland’s population has been driven mostly by net in-migration although, recently, there have also been more births than deaths. In the twelve months to 30 June 2011, in-migration exceeded out-migration by 27,000. This included a net gain of around 2,900 from the rest of the UK and a net gain of around 25,400 from overseas (including asylum seekers). People joining and leaving the armed forces resulted in a net loss of around 1,400. In the same period, there were 4,809 more births than deaths (58,766 births and 53,957 deaths), the second highest increase since 1991-92. Other minor changes resulted in a gain of 900 people.
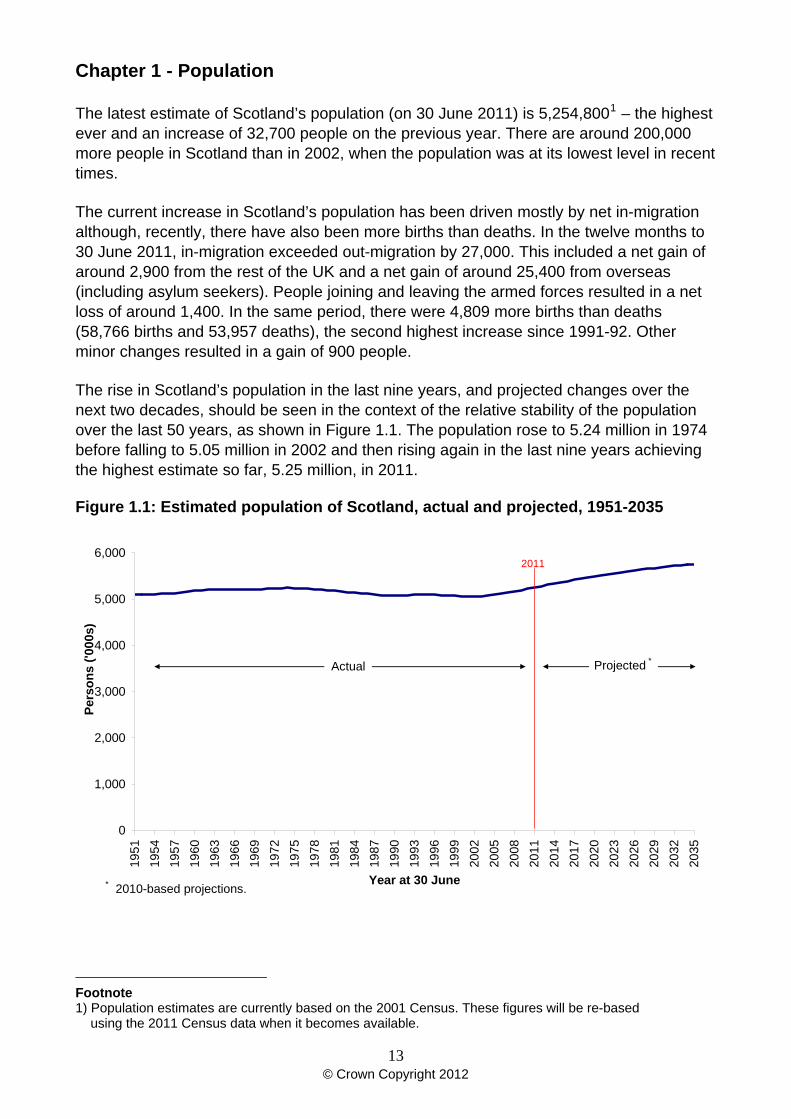
The rise in Scotland’s population in the last nine years, and projected changes over the next two decades, should be seen in the context of the relative stability of the population over the last 50 years, as shown in Figure 1.1. The population rose to 5.24 million in 1974 before falling to 5.05 million in 2002 and then rising again in the last nine years achieving the highest estimate so far, 5.25 million, in 2011.
Figure 1.1: Estimated population of Scotland, actual and projected, 1951-2035
1) Population estimates are currently based on the 2001 Census. These figures will be re-based using the 2011 Census data when it becomes available.
Figure 1.2 shows the trends in natural change (births minus deaths) and migration. Between the mid-1960s and mid-1970s, both natural change and net out-migration fell dramatically, although the natural increase generally remained greater than net out-migration. This resulted in a growth in population up to 1974. From that point on, through the late 1970s and the 1980s, net out-migration was higher than the natural increase, causing the population to decline. In recent years the trend in natural change has reversed and Scotland has experienced record levels of net in-migration resulting in small increases in the population over each of the last nine years.
Figure 1.2: Natural change and net migration, 1951-2011
Composition by age and sex is one of the most important aspects of the population, as changes in the number of men and women in different age groups will have different social and economic impacts. For example, increases in the elderly population are likely to place a greater demand on health and social services.
Figure 1.3 shows the age structure of the population in 2011. Seventeen per cent of the population was aged under 16, 66 per cent was aged 16 to 64 and 17 per cent was aged 65 and over. Amongst older people, particularly those aged over 75, the higher number of females reflects the longer expectation of life for women, partly as a result of male mortality rates during the Second World War. The sharp peak at age 64, and the bigger bulge between the ages of around 40 and 50, are the result of the two baby booms of 1947 and the 1960s. The smaller bulge between 20 and 30, which is known as the echo effect, is the children of the baby boomers.
Figure 1.3: Estimated population by age and sex, 30 June 2011
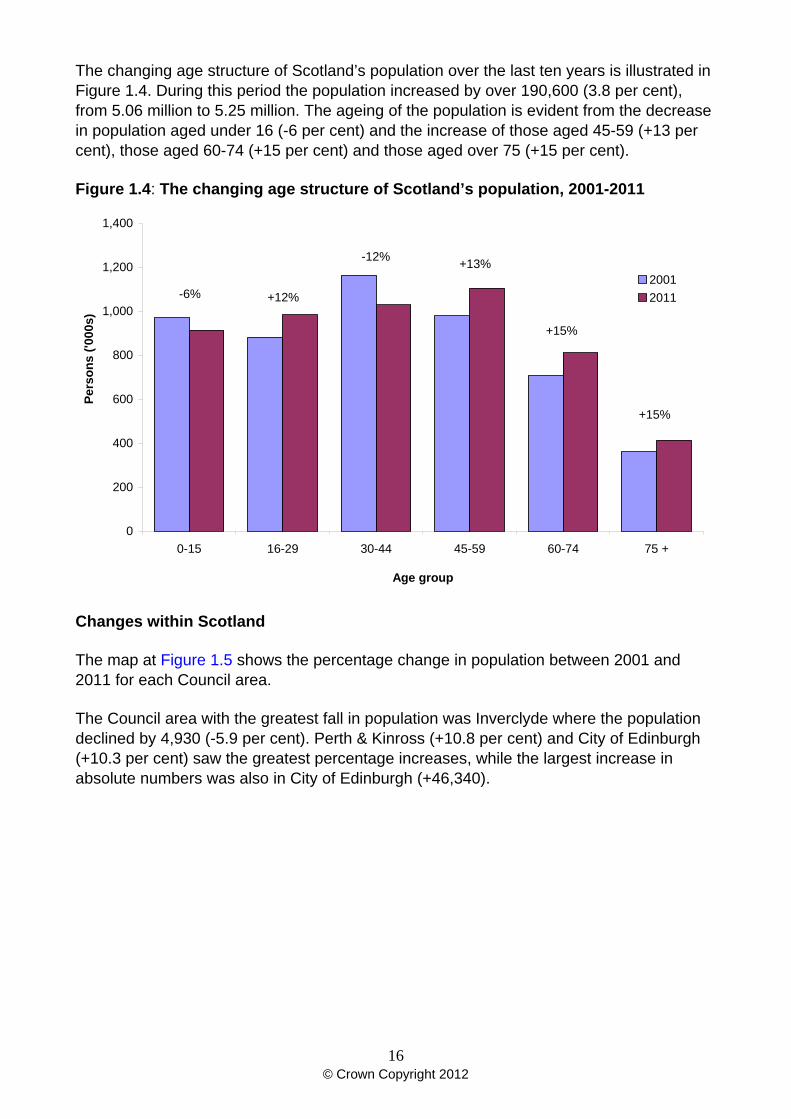
The changing age structure of Scotland’s population over the last ten years is illustrated in Figure 1.4. During this period the population increased by over 190,600 (3.8 per cent), from 5.06 million to 5.25 million. The ageing of the population is evident from the decrease in population aged under 16 (-6 per cent) and the increase of those aged 45-59 (+13 per cent), those aged 60-74 (+15 per cent) and those aged over 75 (+15 per cent).
Figure 1.4: The changing age structure of Scotland’s population, 2001-2011
0
200
400
600
800
1,000
1,200
1,400
0-15 16-29 30-44 45-59 60-74 75 +
Age group
Pers
ons
('000
s)
20012011-6% +12%
-12% +13%
+15%
+15%
Changes within Scotland
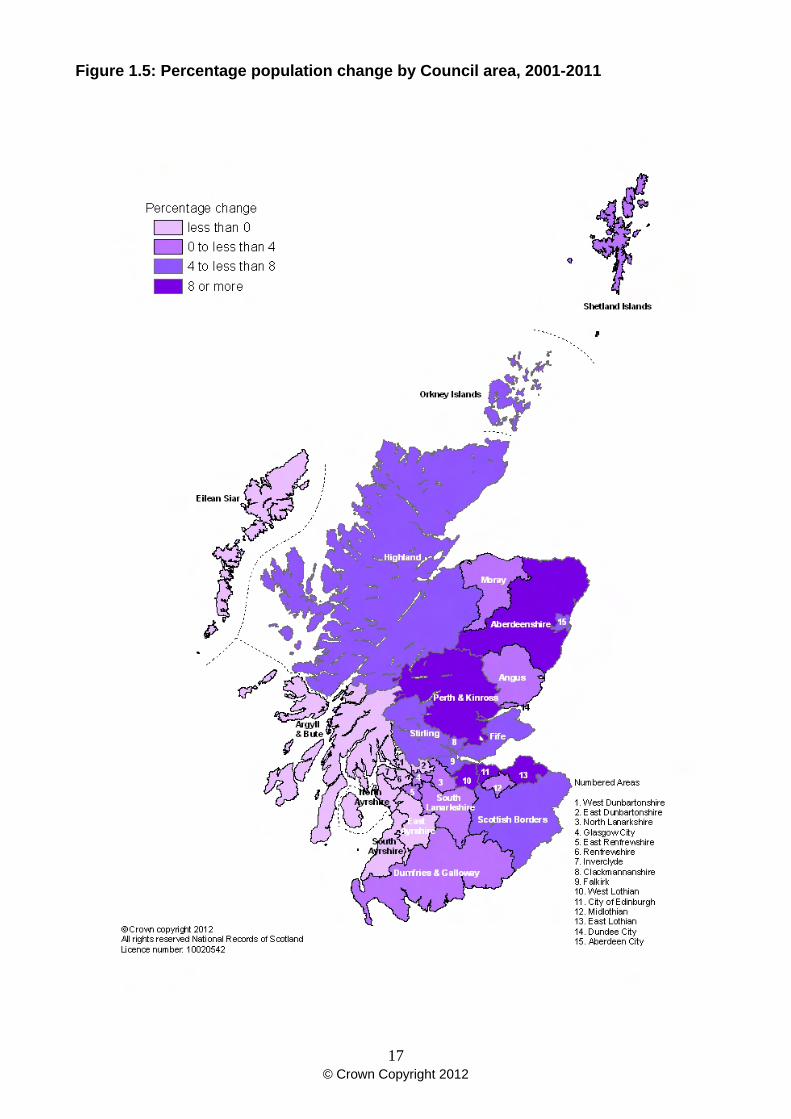
The map at Figure 1.5 shows the percentage change in population between 2001 and 2011 for each Council area.
The Council area with the greatest fall in population was Inverclyde where the population declined by 4,930 (-5.9 per cent). Perth & Kinross (+10.8 per cent) and City of Edinburgh (+10.3 per cent) saw the greatest percentage increases, while the largest increase in absolute numbers was also in City of Edinburgh (+46,340).
The relative importance of migration and natural change differs between areas. In some areas of population increase, such as City of Edinburgh, West Lothian and Aberdeenshire, the gain is attributable both to migration and to natural increase. East Lothian, South Lanarkshire and Stirling experienced a population increase because of in-migration combined with a very low natural change. In other areas, the population increase is due to in-migration, despite the number of deaths exceeding the number of births. These included Perth & Kinross, Scottish Borders and Orkney Islands.
Similarly, some areas of population decline, such as Inverclyde, West Dunbartonshire and East Dunbartonshire have experienced population decreases both from migration and natural change. In other areas such as Eilean Siar, South Ayrshire and North Ayrshire the population decline was mainly attributable to more deaths than births. This analysis is shown in Table 1.1, which compares percentage change in population due to natural change and migration across the Council areas.
Table 1.1: Components of population change for Council areas: 2001-2011
1) Change per 100 population at mid-2001. The underlying data used to produce these figures can be found in Table 6 of the 'Mid-2011 Population Estimates Scotland' publication, available in the Population section of the National Records of Scotland website.
Natural change 1Net civilian migration and
other changes 1Percentage population
change
Projected population
The latest projections of Scotland’s future population are based on the estimate of Scotland’s population in June 2010. The projections, based on existing trends and making no allowance for the future impact of government policies and other factors, show the total population of Scotland rising from 5.22 million in 2010 to 5.76 million in 2035 (Figure 1.1). Longer term projections show the population continuing to rise, reaching around 6.20 million by 2085.
Until 2028, natural change and migration both act to increase the size of the population as the number of births exceeds the number of deaths and there is net in-migration. After that point, the number of deaths exceeds the number of births, a consequence of the ageing of the population, whilst the net migration into Scotland continues. Figure 1.6 shows the historical and projected future trends of births and deaths in Scotland.
Figure 1.6: Births and deaths, actual and projected, Scotland, 1951-2035
0
20
40
60
80
100
120
1951
1954
1957
1960
1963
1966
1969
1972
1975
1978
1981
1984
1987
1990
1993
1996
1999
2002
2005
2008
2011
2014
-15
2017
-18
2020
-21
2023
-24
2026
-27
2029
-30
2032
-33
2034
-35
Year
Pers
ons
('000
s) BirthsDeaths
Footnotes1) Calendar year.2) 2010 based projections, data shown for mid-year.
Between 2010 and 2035, Scotland’s population is projected to age significantly. As shown in Figure 1.7, the number of children aged under 16 is projected to rise only by 3 per cent, from 0.91 million to 0.94 million. The number of people aged 65 and over is projected to rise by 63 per cent, from 0.88 million to 1.43 million.
Figure 1.7: The projected percentage change in age structure of Scotland’s population, 2010-20351
‘Dependency ratios’ are the number of dependants, meaning children aged under 16 and people of pensionable age, per 1,000 working age population. Figure 1.8, which takes account of the increase in the pensionable age for both men and women*, shows little change in these ratios over the next 15-20 years, but a fairly rapid increase in the pension age population relative to the working age population in subsequent years. This starts to slow down in 2035 due to changes in state pension age.
Figure 1.8: Dependency ratios1 (per thousand working population), 2010-2035
0
100
200
300
400
500
600
700
2010 2015 2020 2025 2030 2035Year at 30 June
Dep
ende
ncy
ratio
(per
thou
sand
wor
king
age
pop
ulat
ion)
All Dependants
Pensionable Age
Children
Footnote1) 2010-based projections
As demographic behaviour is uncertain, a number of variant projections of the future population have been calculated, based on alternative assumptions of future fertility, mortality and migration, in addition to the ‘principal projection’ on which the previous paragraphs are based. The variant projections give users an indication of this uncertainty. They illustrate plausible alternative scenarios, rather than representing upper or lower limits of future demographic behaviour. These variant projections, and the assumptions used, can be found on the Office for National Statistics website.
* Pensionable age is 65 for men, 60 for women until 2010; between 2010 and 2020 pensionable age for women rises to 65. Between 2024 and 2026 the pensionable age for both men and women increases to 66 and changes again, in two further steps, to 68 by 2046.
The population of most of the countries in Europe is projected to increase over the next few years. Scotland’s population is projected to rise by 10 per cent between 2010 and 2035. The population of Europe (EU-27*) is projected to increase by 4.7 per cent while the rest of the UK, and certain countries such as Ireland, are projected to have much bigger increases. However Germany as well as a number of Central and Eastern European Countries (CEECs*), are projecting a population decline as Figure 1.9 shows.
Figure 1.9: Projected percentage population change in selected European countries 2010-2035
-20%
-15%
-10%
-5%
0%
5%
10%
15%
20%
25%
30%
35%
Bul
garia
Latv
ia
Lith
uani
a
Rom
ania
Ger
man
y
Esto
nia
Hun
gary
Pol
and
Mal
ta
Por
tuga
l
Slov
akia
Cze
ch R
epub
lic
Gre
ece
EU27
Slov
enia
Net
herla
nds
Aust
ria
Finl
and
Den
mar
k
Italy
SCO
TLAN
D
Fran
ce
Spa
in
Nor
ther
n Ire
land
Liec
hten
stei
n
Wal
es
Sw
eden
Belg
ium
Icel
and
Sw
itzer
land UK
Eng
land
Nor
way
Irela
nd
Cyp
rus
Luxe
mbo
urg
Perc
enta
ge c
hang
e
Source: Office for National Statistics (ONS) (UK and constituent countries) and Eurostat.
Scotland is not alone in having an ageing population. The pattern of change over the last twenty years, and the projected change in the age distribution, is similar to that of other countries in the UK and Europe, although the rate of change varies.
More information about population statistics
More detailed information about Scotland’s population, including estimates, projections at national and sub-Scotland level, as well as estimates of specific population groups, can be found in the Population section of the National Records of Scotland website.
There is progressively more uncertainty associated with the population and migration estimates as the number of years since the previous census increases. The estimates for mid-2002 to mid-2011 will be re-based using the 2011 Census data when it becomes available. * Further information in ‘Appendix 2 – Notes, definitions and quality of statistics’ for definition of EU-15,
EU- 27 and CEECs. The Eurostat projections of population in selected European countries are not directly comparable to the Office for National Statistics (ONS) projections of population in the countries of the UK. The Eurostat projections are based on estimates of the population at 1 January while the ONS projections are based on estimates of the population at 30 June. The methodologies in determining the underlying fertility, mortality and migration assumptions also differ.
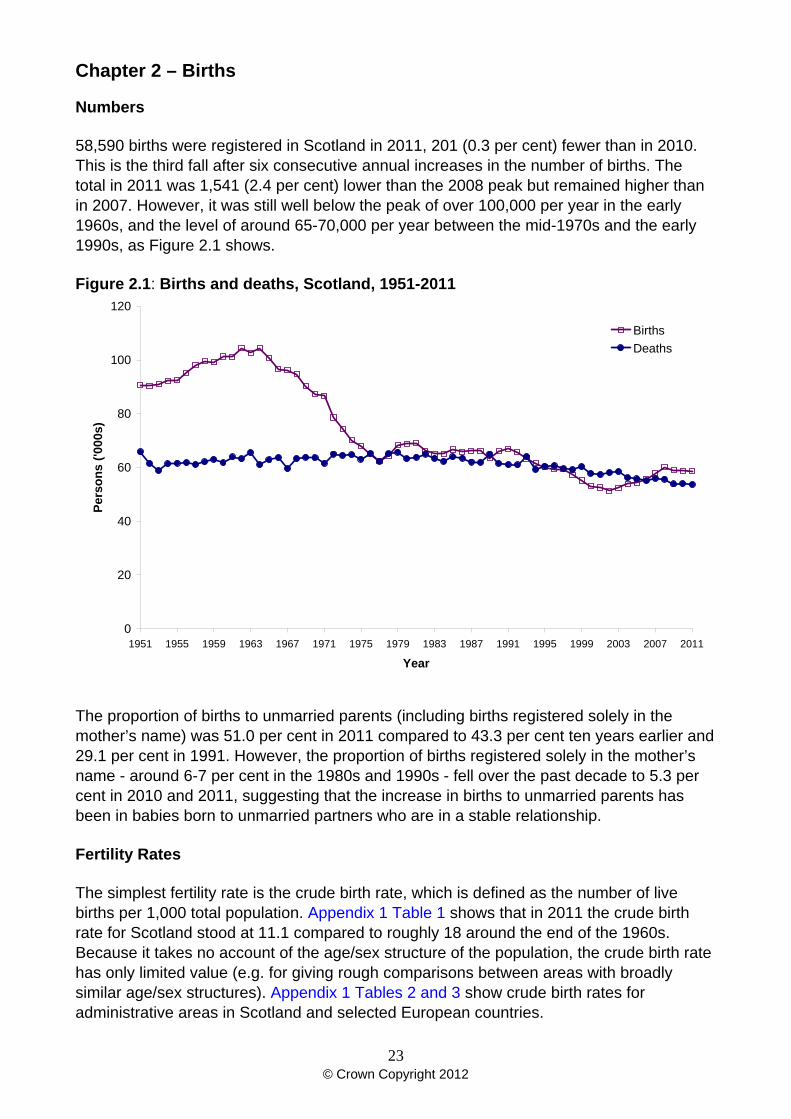
58,590 births were registered in Scotland in 2011, 201 (0.3 per cent) fewer than in 2010. This is the third fall after six consecutive annual increases in the number of births. The total in 2011 was 1,541 (2.4 per cent) lower than the 2008 peak but remained higher than in 2007. However, it was still well below the peak of over 100,000 per year in the early 1960s, and the level of around 65-70,000 per year between the mid-1970s and the early 1990s, as Figure 2.1 shows.
Figure 2.1: Births and deaths, Scotland, 1951-2011
The proportion of births to unmarried parents (including births registered solely in the mother’s name) was 51.0 per cent in 2011 compared to 43.3 per cent ten years earlier and 29.1 per cent in 1991. However, the proportion of births registered solely in the mother’s name - around 6-7 per cent in the 1980s and 1990s - fell over the past decade to 5.3 per cent in 2010 and 2011, suggesting that the increase in births to unmarried parents has been in babies born to unmarried partners who are in a stable relationship.
Fertility Rates
The simplest fertility rate is the crude birth rate, which is defined as the number of live births per 1,000 total population. Appendix 1 Table 1 shows that in 2011 the crude birth rate for Scotland stood at 11.1 compared to roughly 18 around the end of the 1960s. Because it takes no account of the age/sex structure of the population, the crude birth rate has only limited value (e.g. for giving rough comparisons between areas with broadly similar age/sex structures). Appendix 1 Tables 2 and 3 show crude birth rates for administrative areas in Scotland and selected European countries.
Appendix 1 Table 2 also gives standardised birth rates for the administrative areas of Scotland: these adjusted birth rates take account of the population structures in the different areas.
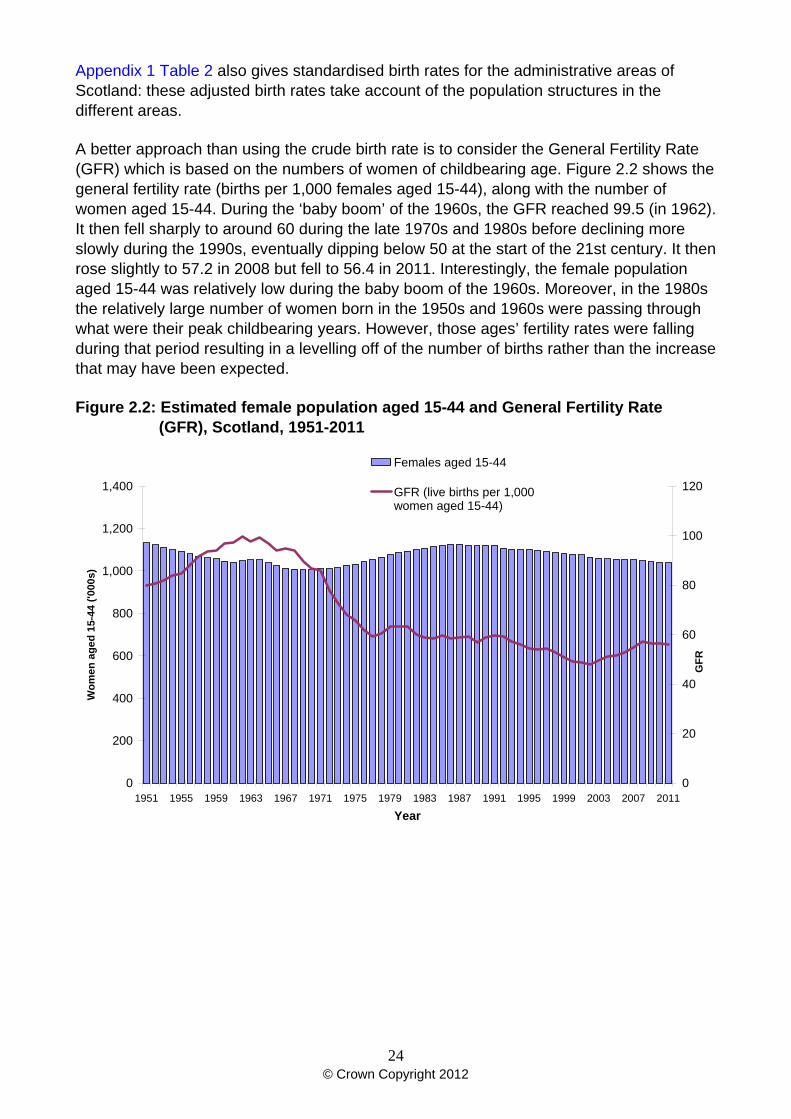
A better approach than using the crude birth rate is to consider the General Fertility Rate (GFR) which is based on the numbers of women of childbearing age. Figure 2.2 shows the general fertility rate (births per 1,000 females aged 15-44), along with the number of women aged 15-44. During the ‘baby boom’ of the 1960s, the GFR reached 99.5 (in 1962). It then fell sharply to around 60 during the late 1970s and 1980s before declining more slowly during the 1990s, eventually dipping below 50 at the start of the 21st century. It then rose slightly to 57.2 in 2008 but fell to 56.4 in 2011. Interestingly, the female population aged 15-44 was relatively low during the baby boom of the 1960s. Moreover, in the 1980s the relatively large number of women born in the 1950s and 1960s were passing through what were their peak childbearing years. However, those ages’ fertility rates were falling during that period resulting in a levelling off of the number of births rather than the increase that may have been expected.
Figure 2.2: Estimated female population aged 15-44 and General Fertility Rate (GFR), Scotland, 1951-2011
A more detailed picture is given by the Age Specific Fertility Rates (ASFRs) by mother’s age, in five-year age groups, in Figure 2.3. This shows many significant age-related features of the pattern of childbearing over the last fifty years. The key point is that, as well as choosing to have fewer babies, women are also choosing to have them later in life. Other points of interest are:
• The ‘baby boom’ of the 1960s was mostly due to increased birth rates of women in their twenties.
• Since the early 1960s, women in their twenties have experienced a dramatic fall in fertility. For women aged 20-24 the fertility rate has fallen by around two-thirds, and for those aged 25-29 it fell by about half.
• The rate for 15-19 year olds fell by around one-third during the 1970s and remained around 30 births per 1,000 women for the following twenty years, before falling to under 22 births per 1,000 women over the past decade.
• Fertility rates for women aged 30 and above have gradually increased over the last thirty years. In particular, the rate for 30-34 year olds overtook that of 25-29 year olds in 2002 and now stands at 106 births per 1,000 women.
• Despite the recent increases, rates for women in each of the age groups over 30 are still slightly lower than they were in the first half of the 1960s.
• The reductions in the numbers of births between 2008 and 2010 are mainly the result of women aged 24 and under having fewer babies.
Figure 2.3: Live births per 1,000 women, by age of mother, Scotland, 1951-2011
Since the mid-1970s, there has been a trend towards having children at older ages. The percentage of births to mothers aged under 20 fell from an average of about 11 per cent between 1976 and 1980 to around 6 per cent in 2011. Mothers aged 20-24 accounted for roughly a third of all births in 1976-1980 and 18 per cent in 2011. The percentage of births to mothers aged 25-29 has also fallen, from around 35 per cent in 1976-80 to 27 per cent
in 2011. As a result, women aged over 30 accounted for nearly half of all births in 2011; 29 per cent were to mothers aged 30-34, 16 per cent were to 35-39 year olds and 4 per cent were to women aged 40 and over.
Figure 2.4 further illustrates the ageing pattern of fertility by showing detailed ASFRs for selected years: 1951, 1964 (peak number of births), 1977 (end of steep decline), 1991 recent peak) and 2011. Though the levels differed considerably, the age patterns of fertility for 1951, 1964 and 1977 were roughly the same. However, the age distributions for 1991 onwards show distinctly older peaks and that for 2011 reveals a further reduction in fertility of women in their twenties, mirrored by an increase for women in their thirties, compared with 1977 and 1991.
The trend towards later childbearing is underlined by changes in the average age of all women giving birth. This was 29.7 in 2011, compared to 27.4 in 1991, 26.1 in 1977, and 27.4 in 1964. Similarly, the average age of fathers (excluding births registered in the mother’s name only, where the father’s details were not provided) was 32.4 in 2011 compared to 30.0 in 1991 and 28.6 in 1977.
Figure 2.4: Live births per 1,000 women, by age1, selected years
The Total Fertility Rate (TFR) is a commonly used summary measure of fertility levels calculated by summing the age specific rates for a single year. It gives the average number of children that a group of women would expect to have if they experienced the observed ASFRs in each of their childbearing years. For a population to replace itself, the TFR needs to be around 2.1.
The TFR for Scotland since 1951 is plotted in Figure 2.5. Not surprisingly, it follows the same general pattern as the GFR described above. It rose to 3.09 in 1964 before dropping sharply to 1.70 in 1977. Since then, with a few minor fluctuations, it fell more slowly to the 2002 rate of 1.48 before increasing to 1.62 in 2005 and 1.80 in 2008 – its highest level for 26 years. In 2011 the TFR was 1.73.
Figure 2.5: Total fertility rate, Scotland, 1951-2011
Though widely used, in part because it is relatively easy to calculate, the TFR has serious deficiencies as it is based on only one year’s observations. For example, when women are delaying childbearing, as they have been in Scotland, the TFR is likely to underestimate the number of children women will eventually have.
A more satisfactory measure is average completed family size. Figure 2.6 shows the completed family size (or cumulative cohort fertility) by age for women born in selected years. Those born in 1951 had attained an average completed family size of 2.03 by the time they reached 45, whereas for those born in 1956 and 1961 the figures were 1.93 and 1.87 respectively. The figure also permits the comparison of family size at selected ages for the various cohorts as they pass through the childbearing ages. Of crucial importance is the extent to which the later cohorts are falling behind in family building. For example, by age 30 the cumulative childbearing of women born in 1976 was about 0.5 lower than that of the 1956 cohort. The 1981 cohort is the first in decades to show a higher fertility rate than the previous cohort. Whilst the increasing fertility rates of those aged over 30 may lead to further catching-up, it is unlikely that this will increase the average completed family size to the levels attained as recently as the cohorts of women born in the 1960s.
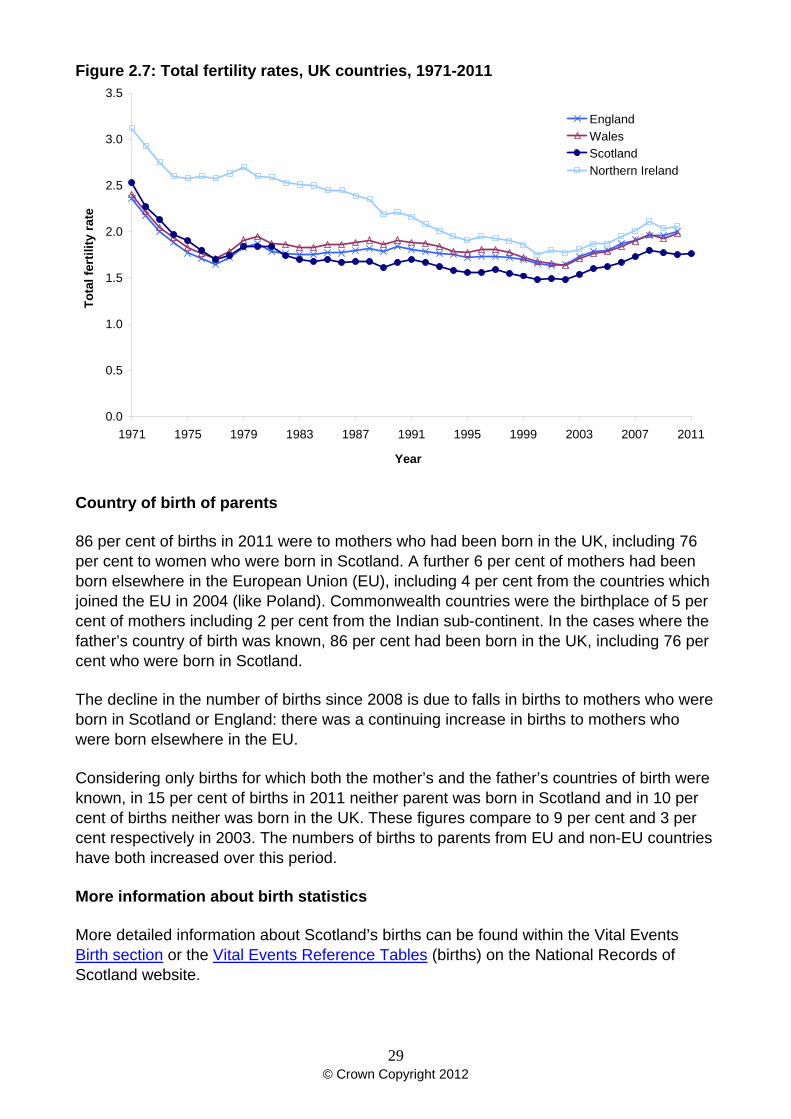
Since the early 1980s, Scotland’s fertility has been lower than fertility in the other parts of the United Kingdom. Figure 2.7 compares the TFRs for England, Wales and Northern Ireland since 1971 with those for Scotland. Until the late 1970s, Scotland’s TFR was slightly higher than that for England and Wales. However, since the early 1980s, Scotland’s TFR has dropped steadily below the levels for England and Wales. In 1971, the TFR for Northern Ireland was markedly higher than for the other three countries but since then the differential has been significantly reduced. The recent rise in fertility levels in Scotland has been paralleled elsewhere in the UK as was the downturn in 2009, except in England where the TFR remained at the 2008 level. TFRs for other parts of the UK rose in 2010, while Scotland saw a further drop, followed by a rise in 2011. TFRs for other parts of the UK for 2011 were not available at the time of writing.
86 per cent of births in 2011 were to mothers who had been born in the UK, including 76 per cent to women who were born in Scotland. A further 6 per cent of mothers had been born elsewhere in the European Union (EU), including 4 per cent from the countries which joined the EU in 2004 (like Poland). Commonwealth countries were the birthplace of 5 per cent of mothers including 2 per cent from the Indian sub-continent. In the cases where the father’s country of birth was known, 86 per cent had been born in the UK, including 76 per cent who were born in Scotland.
The decline in the number of births since 2008 is due to falls in births to mothers who were born in Scotland or England: there was a continuing increase in births to mothers who were born elsewhere in the EU.
Considering only births for which both the mother’s and the father’s countries of birth were known, in 15 per cent of births in 2011 neither parent was born in Scotland and in 10 per cent of births neither was born in the UK. These figures compare to 9 per cent and 3 per cent respectively in 2003. The numbers of births to parents from EU and non-EU countries have both increased over this period.
More information about birth statistics
More detailed information about Scotland’s births can be found within the Vital Events Birth section or the Vital Events Reference Tables (births) on the National Records of Scotland website.
53,661 deaths were registered in Scotland in 2011. This was 306 (0.6 per cent) fewer than in 2010, and was the lowest total recorded since the introduction of civil registration in 1855.
Figure 2.1 shows that from 1951 up to the early 1990s the annual number of deaths remained relatively stable at about 60,000-65,000 a year. The total then declined slowly to just under 55,100 in 2006 which, until 2009, was the lowest annual total recorded. The overall ‘crude’ death rate (10.2 per 1,000 population) was also at its lowest recorded level. The fall in the death rate is proportionately greater for the age-standardised death rate (which takes account of the change in the age distribution of the population).
Causes of death
In 2011 more than half of all deaths were due to the so-called ‘three big killers’. There were 15,457 deaths from cancer (29 per cent of all deaths), 7,636 deaths from ischaemic (coronary) heart disease (14 per cent of all deaths) and 4,594 deaths from strokes (9 per cent of all deaths).
Since 1980, the total number of deaths from these causes has reduced, as shown in Table 3.1, falling from 65 per cent of all deaths during 1980-82 and 1990-92, to 58 per cent during 2000-02 and to 52 per cent in 2011. The proportion of deaths caused by coronary heart disease has fallen from 29 per cent in 1980-82 to 14 per cent in 2011, and by strokes from 14 per cent to 9 per cent. However, the number of deaths from cancer has increased, and as a proportion of all deaths has risen from 22 per cent to 29 per cent.
Death rates, by sex, for some of the most common causes of death are shown in Tables 3.2a and 3.2b.
Cancer
Of the 15,457 deaths from cancer in 2011, cancer of the trachea, bronchus and lung was the most common type, with 4,178 deaths (2,200 males and 1,978 females), accounting for over a quarter (27 per cent) of all cancer deaths.
The next most frequent type of cancer death was prostate for men (900 deaths) and breast for women (1,036 deaths). Bowel cancer caused 1,555 deaths (832 males and 723 females) and cancers of the lymphoid, haematopoietic and related tissue caused 1,055 deaths (558 males and 497 females).
Over the last 25 years or so, male death rates from lung cancer have fallen by 28 per cent (from 119 per 100,000 population in 1980-82 to 86 in 2011). By contrast, the rates for women, though still lower than those for men, have increased by 78 per cent (from 41 per 100,000 population in 1980-82 to 73 in 2011).
Although overall death rates from cancer have risen since the start of the 1980s, from 291 (per 100,000 population) in 1980-82 to 314 for males and from 247 (per 100,000) in 1980-82 to 275 for females, they have actually fallen for those aged under 75. For men the rate fell from 214 (per 100,000 population) in 1980-82 to 173 in 2011, and for women it fell from 170 (per 100,000 population) in 1980-82 to 150 in 2011.
Heart disease and stroke
Table 3.2a shows that, in contrast to the rises for cancer, death rates for coronary heart disease (ischaemic heart disease) and stroke (cerebrovascular disease) have significantly declined. Between 1980-82 and 2011, rates for males fell by 58 per cent for coronary heart disease and 50 per cent for stroke, compared with reductions of 60 and 50 per cent respectively for females. Table 3.2b shows that the improvement was proportionately greater for people aged under 75, with the coronary heart disease and stroke death rates falling by about 70 per cent for males. For females the improvement was greater at 79 per cent for coronary heart disease and 75 per cent for strokes.
Table 3.1: Number of deaths from selected causes, by sex, 1980-2011
Females aged under 75 - rates per 100,000 populationCancer Coronary
(Ischaemic) heart disease
Stroke (Cerebrovascular
disease)
Males aged under 75 - rates per 100,000 populationCancer Coronary
(Ischaemic) heart disease
Some other major causes of deaths
Other major causes of deaths registered in 2011 included:
• respiratory system diseases (e.g. pneumonia) 6,791 deaths, or 13 per cent of all deaths;
• diseases of the circulatory system other than coronary heart disease and stroke (e.g. other forms of heart disease) 3,683 deaths, or 7 per cent;
• mental and behavioural disorders (e.g. due to alcohol or drugs) 3,339 deaths, or 6 per cent;
• diseases of the digestive system (e.g. chronic liver disease) 2,936 deaths, or 5 per cent;
• diseases of the nervous system (e.g. Alzheimer's disease) 2,058 deaths, or 4 per cent;
• accidents (e.g. falls, transport accidents) 1,657 deaths, or 3 per cent; • diseases of the genitourinary system (e.g. renal failure) 1,082 deaths, or 2 per cent; • endocrine, nutritional and metabolic diseases (e.g. diabetes) 979 deaths, or 2 per
cent; and • certain infectious and parasitic diseases (e.g. septicaemia) 812 deaths, or 2 per
National Records of Scotland (NRS) publishes a wide range of other statistics on causes of death. They are available from the relevant parts of our website (which include some background information on the basis of the statistics):
The average age at death has increased steadily over the past thirty years. Figure 3.1 shows that the average ages at death for cancer, heart disease and stroke have generally increased in line with the average for all deaths.
Figure 3.1: Average age at death, selected causes, Scotland, 1978-2011
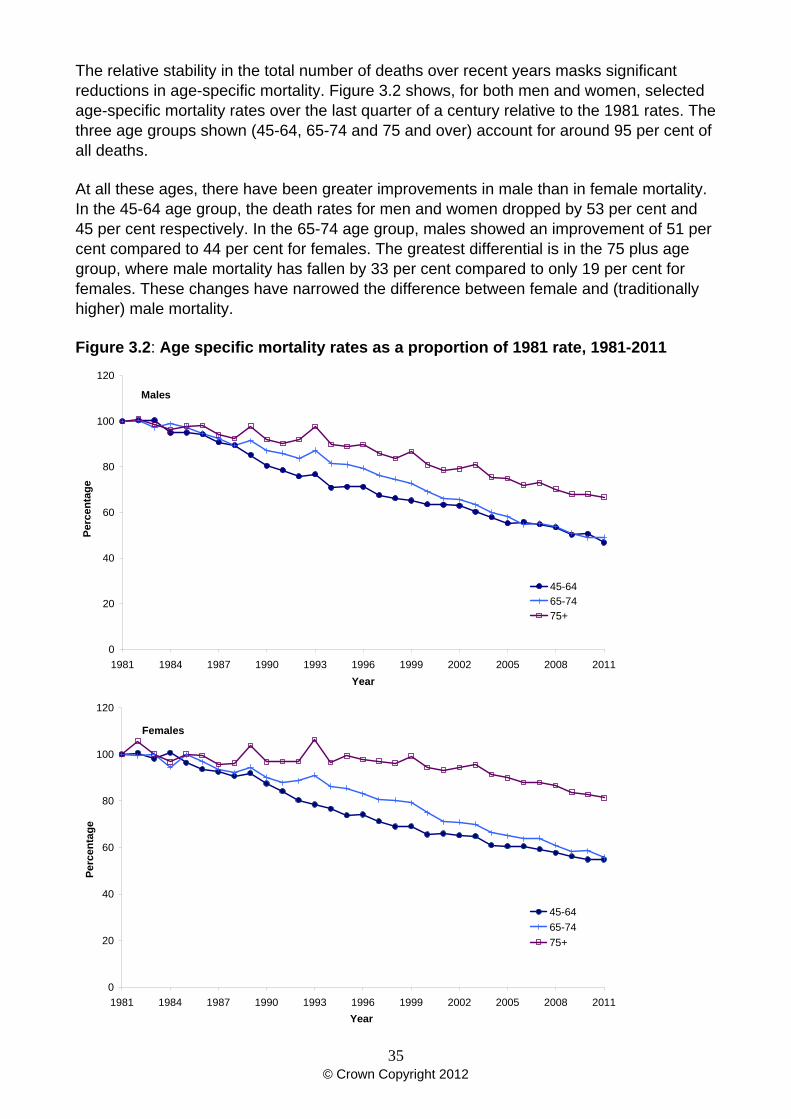
The relative stability in the total number of deaths over recent years masks significant reductions in age-specific mortality. Figure 3.2 shows, for both men and women, selected age-specific mortality rates over the last quarter of a century relative to the 1981 rates. The three age groups shown (45-64, 65-74 and 75 and over) account for around 95 per cent of all deaths.
At all these ages, there have been greater improvements in male than in female mortality. In the 45-64 age group, the death rates for men and women dropped by 53 per cent and 45 per cent respectively. In the 65-74 age group, males showed an improvement of 51 per cent compared to 44 per cent for females. The greatest differential is in the 75 plus age group, where male mortality has fallen by 33 per cent compared to only 19 per cent for females. These changes have narrowed the difference between female and (traditionally higher) male mortality.
Figure 3.2: Age specific mortality rates as a proportion of 1981 rate, 1981-2011
Using 2010 data, the latest available, Figure 3.3 compares the death rates for the constituent countries of the UK for selected causes after adjusting for differences in age structure, by applying the European Standard Population age structure. The Scottish rates for cancer, ischaemic heart disease, and cerebrovascular disease (stroke) are well above the rates for the other countries of the United Kingdom, for both men and women.
Figure 3.3: Age-adjusted mortality rates, by selected cause and sex, 2010
Males
0
50
100
150
200
250
Cancer Ischaemic heart disease Cerebrovascular disease
Rate per 100,000 population (using European Standard)
Scotland Wales England Northern Ireland
Females
0
50
100
150
200
250
Cancer Ischaemic heart disease Cerebrovascular disease
Rate per 100,000 population (using European Standard)
Appendix 1, Table 3 shows the death rate for each of the European Union member states, and for some other countries in Europe. These are so-called 'crude' death rates. They are calculated by expressing the number of deaths per thousand population. As a result, they do not take account of differences in the sex and age structures of the countries' populations. All else being equal, a country with an unusually high proportion of its population in the younger age groups could have an unusually low ‘crude’ death rate. So, though the figure for Scotland is higher than those for most of the countries that are shown, this could to some extent be due to the structure of the Scottish population. A better way to compare Scotland's mortality with other countries' is to use the estimates of life expectancy for each country (Chapter 4).
Stillbirths, perinatal deaths and infant deaths
There were 299 stillbirths registered in Scotland in 2011. Stillbirths (where a child born after the 24th week of pregnancy does not breathe or show any other sign of life) are registered separately from live births and from deaths, and so are not included in either of those figures.
Perinatal deaths consist of stillbirths plus deaths in the first week of life (the latter are registered as live births and as deaths). There were 110 deaths of children who were aged under one week old, so there was a total of 409 perinatal deaths.
Infant deaths are deaths in the first year of life, all of which are registered as live births and as deaths. In total, 238 infant deaths were registered in Scotland in 2011 (including those who died in the first week of life).
Appendix 1, Table 1 shows that in 2011 the stillbirth rate (5.1 per 1,000 live and still births) and the infant death rate (4.1 per 1,000 live births) were slightly higher than in 2010, when the lowest levels ever were recorded. Both rates have fallen greatly since the Second World War. The stillbirth rate has not fallen much in the past thirty years but the infant death rate has continued to decline over the same period.
Appendix 1, Table 3 shows that the stillbirth rate for Scotland was slightly lower in 2010 (4.9) than that for the UK as a whole (5.1) but higher than those of all but two of the European Union (EU) countries for which figures are available. The infant death rate for Scotland in 2010 (3.7) was below the UK rate (4.3) but higher than those of 14 of the 27 EU countries.
More information about death statistics
More detailed information about Scotland’s deaths can be found within the Vital Events Deaths section or the Vital Events Reference Tables (Deaths) on the National Records of Scotland website.
Although mortality rates in Scotland have generally fallen more slowly than in the rest of the UK and elsewhere in Europe, the improvements are still considerable and the impact is reflected in the steadily rising expectation of life.
The expectation of life at birth is a commonly used measure of mortality which is particularly helpful in comparing the ‘health’ of a nation through time and for making comparisons with other countries as well as for areas within Scotland. Figure 4.1 shows that the expectation of life at birth in Scotland has improved greatly over the last 25 years or so, increasing from 69.1 years for men and 75.3 years for women born around 1981 to 76.1 years and 80.6 years respectively for those born around 2010. Figure 4.1 also illustrates that improvements in life expectancy at birth are projected to continue, rising to 80.9 years for men and 85.1 years for women by 2035.
Figure 4.1: Expectation of life at birth, Scotland, 1981-20351
Footnote 1) Figures to 2010 are based on 3 years of data. For example 2010 figure uses data for 2009-2011. Source: Figures to 2010 from provisional Interim Life Tables produced by the Office for National Statistics (ONS). Figures after 2010 are projected single year life expectancies, ONS.
In addition, Figure 4.1 shows that the gap between male and female life expectancy at birth has decreased from 6.2 years in 1980-1982 to 4.5 years in 2008-2010 and has been closing in each period since 2000-2002.
The improvement in life expectancy at birth for males and females in Scotland since 1997-1999 can also be seen in Figure 4.2a (males) and Figure 4.2b (females). Comparisons are given with life expectancy in the United Kingdom (UK), countries within the UK and the countries that typically have the highest and lowest life expectancy in the European Union (EU) (Sweden and Lithuania for males and France and Romania for females).
However, Figures 4.2a and 4.2b show that Scottish men and women have relatively low expectation of life at birth compared with much of the European Union and with the UK.
The UK average is 78.1 years for males and 82.1 years for females and the gap between UK and Scottish life expectancy is now wider than in 1997-1999, by 0.2 years for males and by 0.3 years for females. Figure 4.2a: Life expectancy at birth in selected countries, 1997-1999 to 2008-2010 Males
Nevertheless Scottish male life expectancy has improved since 1997-1999, reducing the gap (currently 3.6 years) with Sweden, the country with the highest life expectancy, and increasing the gap with Lithuania, the country with the lowest life expectancy in the EU. For females however, the gap (currently 4.7 years) between Scotland and France, the country with the highest female life expectancy in the EU, has become wider since 1997-1999. For the same period, the gap between Scotland and Romania, the country with the lowest female life expectancy, has narrowed. Within Scotland, there are considerable differences in life expectancy at birth between different Council areas as illustrated in Figure 4.3. For men, the Council area with the lowest life expectancy was Glasgow City (71.6 years), and the Council area with the highest life expectancy was East Dunbartonshire (79.4 years), 7.8 years more than Glasgow City. For women, East Dunbartonshire also had the highest life expectancy (82.7 years), 4.7 years more than Glasgow City, the area with the lowest figure (78.0 years).
Figure 4.3: Life expectancy at birth, 95 per cent confidence intervals1 for Council areas, 2008-2010 (Males and Females)
1) Life expectancy at birth is an estimate which is subject to a margin of error. The accuracy of results can be indicated by calculating a confidence interval which provides a range within which the true value of underlying life expectancy would lie (with 95 per cent probability).
Note: The Scotland-level life expectancy estimates shown in this chart are for use only as a comparator for the corresponding sub- Scotland-level figures. The definitive Scotland-level life expectancy estimate (based on interim life tables) is published by the Office for National Statistics.
There are also differences between urban and rural areas as shown in Figure 4.4. Men in rural areas – remote and accessible – can expect to live just over 3.5 years longer (78.0 and 78.3 years respectively) than men in large urban areas (74.5 years). Women in rural areas – remote and accessible – can expect to live around 2 years longer (82.2 and 81.8 years respectively) than women in large urban areas (79.8 years).
Footnotes 1) Life expectancy at birth is an estimate which is subject to a margin of error. The accuracy of results can be indicated by calculating a
confidence interval which provides a range within which the true value of underlying life expectancy would lie (with 95 per cent probability).
2) Scottish Government’s 6-fold Urban Rural Classification version 2009-2010. More details can be found in Appendix 2.
Note: The Scotland-level life expectancy estimates shown in this chart are for use only as a comparator for the corresponding sub-Scotland-level figures. The definitive Scotland-level life expectancy estimate (based on interim life tables) is published by the Office for National Statistics.
A more detailed picture of the large geographical variations in life expectancy can be seen in the 36 Scottish Community Health Partnership (CHP) areas*. The principal aim of the CHPs, which link NHS and Council services, is to improve the long-term health and wellbeing of communities and enhance the quality of health and social care services. Life expectancy at birth in the 36 CHP areas is shown in Figure 4.5. Men in East Dunbartonshire CHP area can expect to live nearly 8 years longer than men in Glasgow City area (79.4 years compared with 71.7 years respectively). Women in East Dunbartonshire CHP area can expect to live around 5 years longer than women in Glasgow City CHP area (82.7 years compared with 78.0 years respectively).
South East Highland ClackmannanshireSouth Lanarkshire
Dunfermline & West Fife*West Lothian
Aberdeen CitySouth Ayrshire
Falkirk Midlothian
Dumfries & Galloway^Moray
Argyll & Bute North Highland
Mid Highland Edinburgh
Shetland East Lothian
Orkney Glenrothes & North East Fife
*Scottish Borders Angus Stirling
Aberdeenshire*East Renfrewshire
Perth & Kinross East Dunbartonshire
Age
SCOTLAND
MALES FEMALES
Footnotes *Known as a Community Health and Care Partnership ^Known as a Community Health and Social Care Partnership +Glasgow CHPs are based on five Community Health and Care Partnerships which existed before the new single CHP was set up on
22 March 2011
1) Life expectancy at birth is an estimate which is subject to a margin of error. The accuracy of results can be indicated by calculating a confidence interval which provides a range within which the true value of underlying life expectancy would lie (with 95 per cent probability).
Note: The Scotland-level life expectancy estimate shown in this chart is for use only as a comparator for the corresponding sub- Scotland-level figures. The definitive Scotland-level life expectancy estimate (based on interim life tables) is published by the Office for National Statistics.
The percentage change in life expectancy at birth in CHP areas over the 10 year period 1998-2000 to 2008-2010 is illustrated in Figures 4.6a and 4.6b (ordered from left to right by lowest to highest life expectancy in 1998-2000). The improvement at the national level over the 10 year period was 4.1 per cent for men (or 3.0 years) and 2.6 per cent for females (or 2.1 years) and is shown by the heavy horizontal lines across the charts.
In the 10 years since 1998-2000, life expectancy at birth has increased in almost all CHP areas, although in some cases the increase or decrease was by a margin so small that it may be a consequence of the volatile nature of life expectancy estimates in small areas. For men, the largest increase in life expectancy at birth was in Mid Highland with 7.0 per cent (an improvement of 5.0 years) and for women in Edinburgh with 3.6 per cent (an improvement of 2.9 years). The gap between the area with the highest male life expectancy at birth and the area with the lowest has increased by 0.1 years over the 10 year period from 7.6 years to 7.7 years; for females it has decreased from 5.7 years in 1998-2000 to 4.7 years in 2008-2010. The gap between male and female life expectancy narrowed in all but four of the CHP areas. The gap decreased most in Orkney (4.1 years in 2008-2010 compared with 7.4 years in 1998-2000).
Figure 4.6a: Percentage change in life expectancy, 1998-2000 to 2008-2010, in Scotland and for each individual Community Health Partnership (CHP) area, Males
0%
1%
2%
3%
4%
5%
6%
7%
8%+G
lasg
ow C
ity
*Inve
rcly
de
*Wes
t Dun
barto
nshi
re
Ren
frew
shire
Dun
dee
^Wes
tern
Isle
s
Nor
th L
anar
kshi
re
Nor
th A
yrsh
ire
Kirk
cald
y &
Leve
nmou
th
East
Ayr
shire
Sout
h Ea
st H
ighl
and
Cla
ckm
anna
nshi
re
Sou
th L
anar
kshi
re
Dun
ferm
line
& W
est F
ife
*Wes
t Lot
hian
Abe
rdee
n C
ity
Sou
th A
yrsh
ire
Falk
irk
Mid
loth
ian
Dum
fries
& G
allo
way
^Mor
ay
Arg
yll &
But
e
Nor
th H
ighl
and
Mid
Hig
hlan
d
Edin
burg
h
She
tland
East
Lot
hian
Ork
ney
Gle
nrot
hes
& N
orth
Eas
t Fife
*Sco
ttish
Bor
ders
Angu
s
Stirl
ing
Aber
deen
shire
*Eas
t Ren
frew
shire
Per
th &
Kin
ross
Eas
t Dun
barto
nshi
re
Ordered left to right by lowest to highest life expectancy in 2008-2010
Perc
enta
ge c
hang
e
SCOTLAND
*Known as a Community Health and Care Partnership ^Known as a Community Health and Social Care Partnership +Glasgow CHPs are based on five Community Health and Care Partnerships which existed before the new single CHP was set up on 22 March 2011 Figure 4.6b: Percentage change in life expectancy, 1998-2000 to 2008-2010, in Scotland and for each individual Community Health Partnership (CHP) area, Females
-1%
0%
1%
2%
3%
4%
5%
6%
*+N
orth
Eas
t Gla
sgow
*+N
orth
Wes
t Gla
sgow
*+G
lasg
ow C
ity
*Wes
t Dun
barto
nshi
re
*+S
outh
Gla
sgow
Nor
th L
anar
kshi
re
*Inv
ercl
yde
Dun
dee
Kirk
cald
y &
Lev
enm
outh
Ren
frew
shire
Nor
th A
yrsh
ire
Eas
t Ayr
shire
*Wes
t Lot
hian
Sout
h La
nark
shire
Angu
s
Falk
irk
Cla
ckm
anna
nshi
re
She
tland
Dun
ferm
line
& W
est F
ife
Abe
rdee
n C
ity
Arg
yll &
But
e
Nor
th H
ighl
and
Sou
th A
yrsh
ire
Eas
t Lot
hian
*Sco
ttish
Bor
ders
^Mor
ay
Ork
ney
Mid
loth
ian
Dum
fries
& G
allo
way
Mid
Hig
hlan
d
Abe
rdee
nshi
re
Sou
th E
ast H
ighl
and
Gle
nrot
hes
& N
orth
Eas
t Fife
Edi
nbur
gh
Stir
ling
^Wes
tern
Isle
s
*Eas
t Ren
frew
shire
Per
th &
Kin
ross
Eas
t Dun
barto
nshi
re
Ordered left to right by lowest to highest life expectancy in 2008-2010
Perc
enta
ge c
hang
e
SCOTLAND
*Known as a Community Health and Care Partnership ^Known as a Community Health and Social Care Partnership +Glasgow CHPs are based on five Community Health and Care Partnerships which existed before the new single CHP was set up on 22 March 2011
In Glasgow City CHP area (which had the lowest life expectancy at birth in 1998-2000), male life expectancy has improved by 4.7 per cent (or 3.2 years) over the last 10 years which is 0.6 percentage points more than the average improvement experienced by Scotland. By contrast, life expectancy at birth for men in East Renfrewshire CHP (the area ranked highest in 1998-2000) improved but at the rate of 3.1 per cent, one percentage point below the average rate of improvement in Scotland.
Female life expectancy in Glasgow City CHP, where it was lowest in 1998-2000, has improved by 2.9 per cent in the 10 years since then. Although it is still the lowest in Scotland, its rate of improvement is 0.3 percentage points above the average improvement for Scotland.
Life expectancy decreases as deprivation increases, as illustrated by Figure 4.7. Men in the 10 per cent least deprived areas of Scotland can expect to live around 13.2 years longer than those in the 10 per cent most deprived areas (81.4 years compared with 68.2 years). Women in the 10 per cent least deprived areas of Scotland can expect to live around 8.9 years longer than those in the 10 per cent most deprived areas (84.6 years compared with 75.7 years).
Figure 4.7: Life expectancy at birth, 95 per cent confidence intervals1 by level of deprivation2, 2008-2010 (Males and Females)
Footnote 1) Life expectancy at birth is an estimate which is subject to a margin of error. The accuracy of results can be indicated by calculating a
confidence interval which provides a range within which the true value of underlying life expectancy would lie (with 95 per cent probability).
2) Scottish Index of Multiple Deprivation (SIMD) 2009. More details can be found in Appendix 2.
Note: The Scotland-level life expectancy estimates shown in this chart are for use only as a comparator for the corresponding sub-Scotland-level figures. The definitive Scotland-level life expectancy estimate (based on interim life tables) is published by the Office for National Statistics.
A useful extension of life expectancy estimates is information on Healthy Life Expectancy (HLE) which is published by the Information and Statistics Division of the NHS. HLE is defined as the number of years people can expect to live in good health. The difference between HLE and life expectancy indicates the length of time people can expect to spend in poor health. More information on HLE in Scotland is available on the Scottish Public Health Observatory (ScotPHO) website.
More information about life expectancy statistics
More detailed information about Scotland’s life expectancy can be found within the Life Expectancy section on the National Records of Scotland website.
Unlike some countries, the UK does not have a comprehensive system of recording migrants, particularly those leaving the country, nor any legal requirement to notify change of address. So migration is the most difficult component of population change to measure and predict. Migration and the reasons for migrating are also much more susceptible to short-term changes in social and economic circumstances than births and deaths. More detailed information on the methodology for estimating migration is available within the Migration section of the National Records of Scotland website. Trends in migration since 1951
Historically, Scotland has been a country of net out-migration, with more people leaving to live elsewhere than moving to live in Scotland. However, since the 1960s, net out-migration has greatly reduced and, in some years during the late 1980s and early 1990s, Scotland experienced net migration gains. As Figure 5.1 shows, Scotland has now entered a period of net in-migration. Over the last eight years, there have been net gains of at least 19,000 per year. In 2010-11 the net migration gain was 27,000, the highest since these estimates started in 1951.
Figure 5.1: Estimated net migration, Scotland, 1951-2011
-50
-40
-30
-20
-10
0
10
20
30
40
1951
-195
2
1954
-195
5
1957
-195
8
1960
-196
1
1963
-196
4
1966
-196
7
1969
-197
0
1972
-197
3
1975
-197
6
1978
-197
9
1981
-198
2
1984
-198
5
1987
-198
8
1990
-199
1
1993
-199
4
1996
-199
7
1999
-200
0
2002
-200
3
2005
-200
6
2008
-200
9
2010
-201
1
Year to 30 June
Pers
ons
('000
s)
Net migration is the difference between much larger flows of migrants into and out of Scotland. The level of net migration can be significantly affected by relatively small changes in these gross flows from year to year, particularly if one flow rises while the other falls. In the last eight years, migration to Scotland has typically been about 90,000 per year whilst migration from Scotland has been around 70,000.
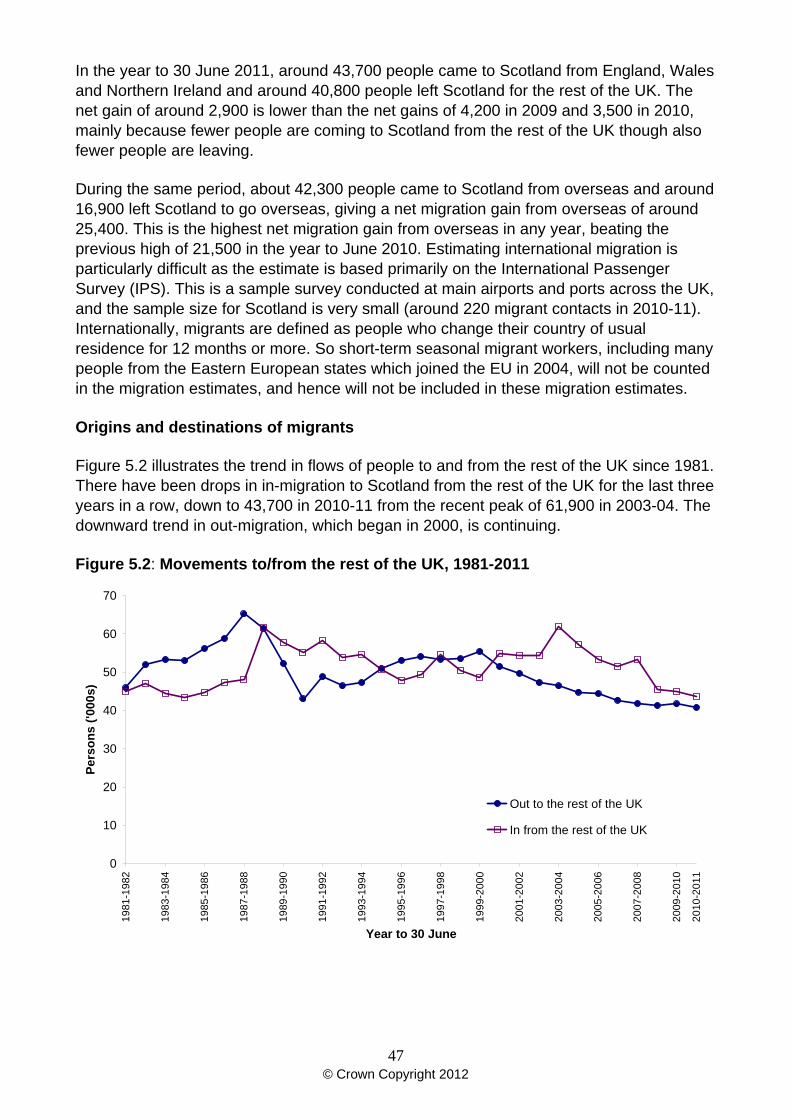
In the year to 30 June 2011, around 43,700 people came to Scotland from England, Wales and Northern Ireland and around 40,800 people left Scotland for the rest of the UK. The net gain of around 2,900 is lower than the net gains of 4,200 in 2009 and 3,500 in 2010, mainly because fewer people are coming to Scotland from the rest of the UK though also fewer people are leaving.
During the same period, about 42,300 people came to Scotland from overseas and around 16,900 left Scotland to go overseas, giving a net migration gain from overseas of around 25,400. This is the highest net migration gain from overseas in any year, beating the previous high of 21,500 in the year to June 2010. Estimating international migration is particularly difficult as the estimate is based primarily on the International Passenger Survey (IPS). This is a sample survey conducted at main airports and ports across the UK, and the sample size for Scotland is very small (around 220 migrant contacts in 2010-11). Internationally, migrants are defined as people who change their country of usual residence for 12 months or more. So short-term seasonal migrant workers, including many people from the Eastern European states which joined the EU in 2004, will not be counted in the migration estimates, and hence will not be included in these migration estimates.
Origins and destinations of migrants
Figure 5.2 illustrates the trend in flows of people to and from the rest of the UK since 1981. There have been drops in in-migration to Scotland from the rest of the UK for the last three years in a row, down to 43,700 in 2010-11 from the recent peak of 61,900 in 2003-04. The downward trend in out-migration, which began in 2000, is continuing.
Figure 5.2: Movements to/from the rest of the UK, 1981-2011
Figure 5.3 shows the trends in flows of people to and from overseas since 1991. In-migration from overseas has been increasing since 2003 but dropped slightly in2010-11. Out-migration to overseas has dropped three years in a row following a large rise in 2007-08. The figures shown here are from the Long-Term International Migration (LTIM) series produced by the Office of National Statistics (ONS).
Figure 5.3: Movements to/from overseas, 1991-2011
0
5
10
15
20
25
30
35
40
45
50
1991
-199
2
1992
-199
3
1993
-199
4
1994
-199
5
1995
-199
6
1996
-199
7
1997
-199
8
1998
-199
9
1999
-200
0
2000
-200
1
2001
-200
2
2002
-200
3
2003
-200
4
2004
-200
5
2005
-200
6
2006
-200
7
2007
-200
8
2008
-200
9
2009
-201
0
2010
-201
1
Year to 30 June
Pers
ons
('000
s)
Out to overseas
In from overseas
Source: Office for National Statistics Long-Term International Migration.
Table 5.1 summarises the migration flows between Scotland and the rest of UK and Scotland and overseas between mid-2010 and mid-2011. The in-flows of migrants from the rest of UK and overseas are similar. However, the out-flows to overseas are much lower than the outflows to the rest of the UK. As a result, the largest component of the total net migration is net in-migration from overseas.
Table 5.1: Migration between Scotland and Rest of UK/Overseas: 2010-2011
Footnote 1) Movements between Scotland and the rest of the UK and overseas will not sum to total net migration as they exclude movements to and from the armed forces and rounding adjustments.
In Out NetRest of UK 43,700 40,800 2,900Overseas 42,300 16,900 25,400Total 1 86,000 57,700 28,300
Figure 5.4 illustrates the ages of people moving between Scotland and the rest of the UK between mid-2010 and mid-2011. The peak age for migration into Scotland is 19, at which age there is a marked migration gain. The peak ages for migrating out of Scotland are 23 and 24 and this results in a migration loss at these ages. These large in and out flows result from an influx of students from outside Scotland starting higher education, followed by a move out of Scotland after graduation.
Figure 5.4: Movements between Scotland and the rest of the UK, by age, mid-2010 to mid-2011
Figure 5.5 shows the age distribution of people moving between Scotland and overseas between mid-2010 and mid-2011. In contrast to moves to Scotland from the rest of the UK, the peak ages for migration into Scotland are 22 and 23. There are also high numbers of migrants from age 19 to 31. This results in a net migration gain through to age 55.
Migrants to and from the UK and overseas alike tend to be much younger than the general population: 48 per cent of in-migrants from the rest of the UK and 71 per cent of those from overseas are aged 16-34, compared with 25 per cent of the resident population. There also tend to be smaller peaks for moves of the very young, under the age of 5, as their parents move home before their children have started school. Later in life, there is no significant ‘retirement migration’ in either direction. The pattern of migration is very similar for men and women.
Migration and the distribution of people in Scotland
In many parts of Scotland, migration is the most important component of population change. Net migration rates (here, the amount of net migration between 2001 and 2011 as a proportion of the 2001 population) are a useful indicator when comparing migration between areas of different sizes. Information on net rates for Council areas, which includes migration between Council areas, the rest of the UK and overseas, is shown in Figure 5.6.
The patterns of migration over the period 2001 to 2011 indicate that the highest net out-migration rates were in West Dunbartonshire, East Dunbartonshire and Inverclyde. The highest net in-migration rates were in Perth & Kinross, City of Edinburgh and East Lothian.
Migration between Scotland and the rest of UK and overseas shows a slightly different pattern. Migration in the period mid-2010 to mid-2011 to and from areas outside Scotland, as a proportion of the resident population, is shown in Figure 5.7. The highest net in-migration rates were in the city council areas of Aberdeen, Edinburgh and Stirling. The highest net out-migration rates were in East Ayrshire and Inverclyde.
Figure 5.7: Net migration with areas outside Scotland as percentage of population by Council area, mid-2010 to mid-2011
Since the early 2000s, and especially since Eastern European Countries joined the EU in May 2004, migration has played a larger part in Scotland’s demographic change than in the previous decade. So it has become more important to have high quality statistics on migration and the population, for policy development and for planning and providing public services. NRS was part of an inter-departmental effort, led by the Office for National Statistics (ONS), to improve the estimates of migration and migrant populations in the United Kingdom, both nationally and at a local level. The ONS website has more information on the Migration Statistics Improvement programme including the programme’s final report.
Although the programme has now finished, work to improve migration statistics is continuing. In Scotland the key focus will be reconciling the mid-year estimates with the 2011 Census results and rebasing historical estimates. As part of this work we will review our methods for estimating migration.
More information about migration statistics
More detailed information about Scotland’s migration can be found within the Migration section on the National Records of Scotland Website
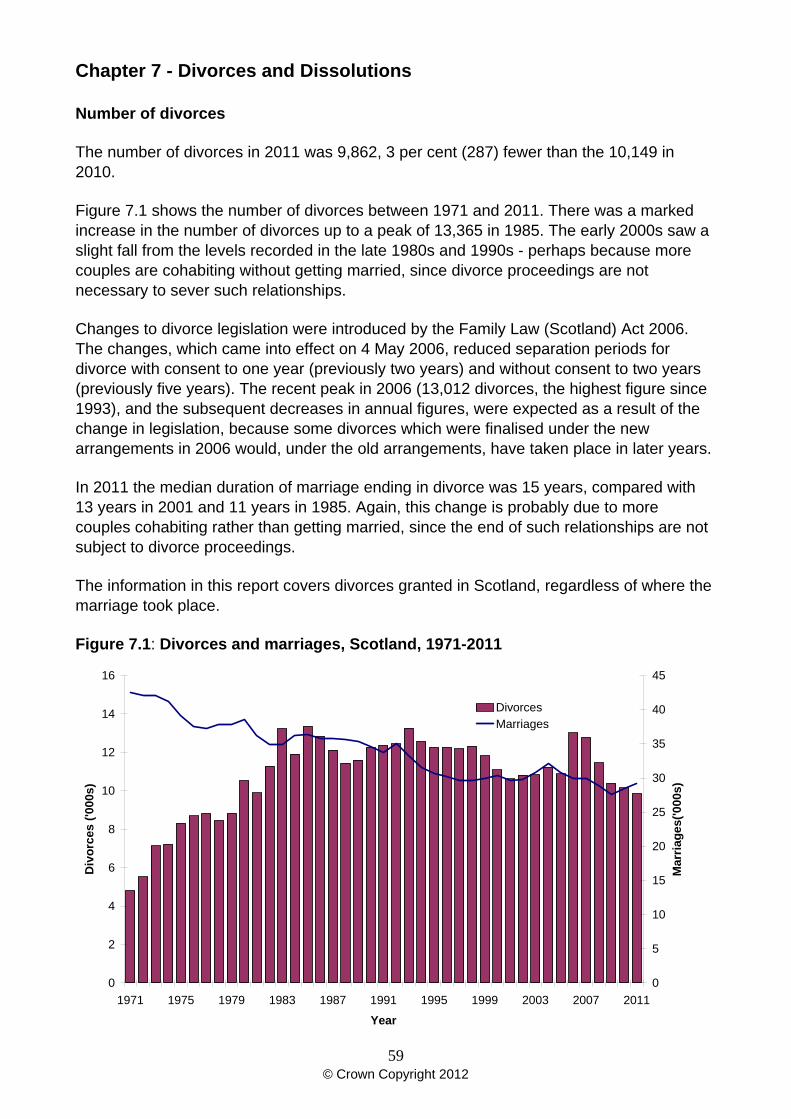
There were 29,135 marriages in Scotland in 2011, 655 (2.3 per cent) more than in 2010. Figure 6.1 shows that, following a decline from over 40,000 marriages a year in the early 1970s, the annual total levelled out at around 30,000 in the mid-1990s, but fell each year from 2005 to 2009. The highest total recorded in recent years was 32,154 in 2004 (the highest total since 1993), whilst the highest ever recorded was 53,522 in 1940. The 2009 total (27,524) was the lowest since Victorian times, and the lowest ever recorded was 19,655 in 1858.
The information in this section covers all marriages registered in Scotland, regardless of where the bride and groom lived. In 2011, there were 6,829 ‘tourism’ marriages (23 per cent of all marriages) where neither the bride nor groom was resident in Scotland. This represents little change from 6,799 (24 per cent) in 2010. Almost half (48%) of the ‘tourism’ marriages in 2011 were at Gretna.
Gretna continues to be a popular venue for marriages, and the 3,842 registered in 2011 (13% of all marriages) were 4 per cent up on 2010 but nearly a third down on the record total of 5,555 in 2004 (17% of all marriages in Scotland in 2004). Over the longer term, the number of marriages at Gretna increased from only 226 in 1981 through 1,876 in 1991 and 5,033 in 2001. In 2011, 85 per cent (3,282) of the marriages at Gretna did not involve a Scots resident.
Of course, many couples who live in Scotland go abroad to be married. These marriages are not included, and only some come to the attention of the Registrar General through notification to British consular authorities.
Figure 6.2 shows the percentage of marriages by marital status at the time of marriage between 1971 and 2011. The percentage of people marrying who had been divorced rose from just under 6 per cent in 1971, to over a quarter in 2001 (28 per cent for grooms and 26 per cent for brides). The majority of this shift reflects a reduction in the proportion of marriages where one of the partners had never been married. The proportion of those marrying who were divorced was 24 per cent in 2011 (25 per cent for grooms and 23 per cent for brides). The proportion of those marrying who were widowed (2 per cent in 2011) has hardly changed since 2001.
Figure 6.2: Marriages, by marital status and sex of persons marrying, 1971-2011
The average age at marriage has risen for both males and females. For first marriages, the average age of grooms who were bachelors has risen from 30.7 in 2001 to 32.6 in 2011; the comparable figures for brides who were spinsters are 28.8 in 2001 and 30.9 in 2011.
Civil marriages are conducted by registrars, and they have wide discretion over the form of the ceremony, to meet couples' wishes, as long as there are no religious references. There were 15,092 civil marriages in 2011, when they accounted for just over half (52 per cent) of all marriages compared to just under one-third (31 per cent) in 1971 (Figure 6.3).
The trend in civil marriages mainly reflects a decline in the number of religious ceremonies during the past thirty to forty years. The small increase in religious marriages during the period 1997-2002 was largely associated with the increase of ‘tourism’ marriages, of which a significant proportion were carried out at Gretna. Since then, there has been a decrease in the number of religious and other belief marriages, from 16,890 in 2003 to 13,285 in 2009 followed by increases to 14,030 in 2010 and 14,043 in 2011.
Religious marriages are conducted by a wide range of celebrants. The largest number of religious marriages were carried out by ministers of the Church of Scotland, who conducted 5,557 marriages in 2011. The other religious bodies conducting more than 500 marriages in 2011 were the Roman Catholic Church (1,729), Assemblies of God (865) and the Scottish Episcopal Church and other churches of the Anglican Communion (694). Humanist celebrants have been authorised to conduct marriages in Scotland since 2005. In 2011 they officiated at 2,486 marriages, compared with 2,092 in 2010, 1,544 in 2009, 1,026 in 2008, 710 in 2007 and 434 in 2006.
Figure 6.3: Marriages, by type of ceremony, 1971-2011
Until 2002, civil marriages could only be held in registration offices. The Marriage (Scotland) Act 2002 allowed registrars to conduct ceremonies in other approved places, from June 2002. In 2003, the first full year of these arrangements, 3,465 ceremonies were carried out at these approved places. In May 2012, there were almost 900 approved venues in Scotland, including castles, hotels, clubs and a small number of outdoor venues
in gardens or the countryside. During 2011, 7,523 civil ceremonies (26 per cent of all marriages and 50 per cent of civil marriages) were conducted at these ‘approved places’. These proportions were similar to those in 2010.
In 2011, around 48 per cent of religious marriages were celebrated in places of worship while 50 per cent of civil marriages took place in registration offices.
Civil Partnerships
The Civil Partnership Act 2004, which applies throughout the UK and came into force on 5 December 2005, allows same-sex couples to register their partnership.
During 2006, the first full year of operation, 1,047 partnerships were registered in Scotland. In 2007, 688 partnerships were registered. This decrease was expected, because many long-standing relationships would have been registered as civil partnerships in the first full year of registration. The number of partnerships formed continued to fall to 465 in 2010. In 2011 there were 554 registrations – 227 male couples and 327 female couples. This was the first year to show an increase (Figure 6.4).
Figure 6.4: Civil partnerships, 2006-2011
0
200
400
600
800
1,000
1,200
2006 2007 2008 2009 2010 2011Year
Num
ber o
f par
tner
ship
s
Female partnerships
Male partnerships
(2005 not shown as the Act only came into force on 5 December 2005)
More information about marriage and civil partnership statistics
More detailed information about Scotland’s marriages and civil partnerships can be found within the Vital Events Marriages and Civil Partnership section or the Vital Events Reference Tables (Marriages and Civil partnerships) on the National Records of Scotland website.
Chapter 7 - Divorces and Dissolutions Number of divorces
The number of divorces in 2011 was 9,862, 3 per cent (287) fewer than the 10,149 in 2010.
Figure 7.1 shows the number of divorces between 1971 and 2011. There was a marked increase in the number of divorces up to a peak of 13,365 in 1985. The early 2000s saw a slight fall from the levels recorded in the late 1980s and 1990s - perhaps because more couples are cohabiting without getting married, since divorce proceedings are not necessary to sever such relationships.
Changes to divorce legislation were introduced by the Family Law (Scotland) Act 2006. The changes, which came into effect on 4 May 2006, reduced separation periods for divorce with consent to one year (previously two years) and without consent to two years (previously five years). The recent peak in 2006 (13,012 divorces, the highest figure since 1993), and the subsequent decreases in annual figures, were expected as a result of the change in legislation, because some divorces which were finalised under the new arrangements in 2006 would, under the old arrangements, have taken place in later years.
In 2011 the median duration of marriage ending in divorce was 15 years, compared with 13 years in 2001 and 11 years in 1985. Again, this change is probably due to more couples cohabiting rather than getting married, since the end of such relationships are not subject to divorce proceedings.
The information in this report covers divorces granted in Scotland, regardless of where the marriage took place.
Figure 7.1: Divorces and marriages, Scotland, 1971-2011
The Civil Partnership Act 2004, which came into force on 5 December 2005, allows same-sex partnerships to be dissolved in the same way that marriages can be ended by divorce. The first dissolution in Scotland was finalised in 2007. In 2011, 44 partnerships (17 male couples and 27 female couples) were dissolved – an increase from the 34 dissolutions finalised in 2010. More detailed statistics on divorces and dissolutions
Statistics on divorces and dissolutions in Scotland from April 2009 are now published by the Scottish Government. More detailed statistics are available from the Civil Justice section of the Scottish Government Crime and Justice Statistics website. There are also some statistics available in the Divorces and dissolutions section of the Vital Events Reference Tables on the National Records of Scotland website.
Adoptions of children have been registered by law in Scotland since 1930. Today the Registrar General for Scotland registers them under the Adoption and Children (Scotland) Act 2007.
Adoptions include cases of step-parents adopting their spouse’s or partner’s children, and relatives adopting children of other family members, as well as people adopting children who are not related in any way to them. The figures include small numbers of foreign adoptions registered in Scotland, and parental orders granted following a birth by a surrogate mother. Following a steady rise to a post-war peak of 2,292 in 1946, the total number of adoptions fell back to 1,236 in 1959 before peaking again at 2,268 in 1969. Since then, the annual number of adoptions declined fairly steadily to around 400 in 2000 and fluctuated around the level of 400 to 450 in the following decade. The Registrar General recorded 496 adoptions during 2011. This is 30 more than in 2010, but around half the number recorded per year in the early 1980s, and around a quarter of the number recorded per year in the late 1960s to early 1970s.
Of the children adopted in 2011, 24 per cent were adopted by a step-parent and 71 per cent were adopted by non-relatives of the child. Figure 8.1 shows the children’s ages. Only 14 per cent of children adopted in 2011 were aged under 2, 16 per cent were aged 2, 25 per cent were 3-4, 30 per cent were 5-9, 9 per cent were 10-14 and 5 per cent were aged 15 or over. Of the children aged under 2, 69 per cent were adopted by non-relatives. In contrast, only 18 per cent of the 74 children aged 10 or over were adopted by non-relatives.
Figure 8.1: Age at adoption, Scotland, 2011
0
10
20
30
40
50
60
70
80
90
0 1 2 3 4 5 6 7 8 9 10 11 12 13 14 15+
Age
Ado
ptio
ns
More information about adoptions
More detailed information about Scotland’s adoptions can be found within the Vital Events Adoptions section or the Vital Events Reference Tables (Adoptions) on the National Records of Scotland website.
In mid-2011, there were 2.37 million households in Scotland, which is around 173,000 more than in 2001. Figure 9.1 shows the annual change in the number of households from 2001 to 2011. The number of households in Scotland has been increasing by an average of around 17,300 a year since 2001. The rate of growth has slowed since 2007 and the increase of 10,600 households from 2010 to 2011 was the lowest in the last ten years.
Figure 9.1: Annual increase in the number of households in Scotland, 2001 to 2011
By 2035, the number of households in Scotland is projected to increase to 2.89 million, which is an average of 21,230 additional households per year. Most of the increase is the result of an ageing population and more people living alone or in smaller households, rather than an increase in the population. Looking to the future, there is a projected increase in the number of people in older age groups (65+), with a small fall in the number of younger people (16-64). This has an impact on household structure, as elderly people are more likely to live alone or with just one other person.
Variations within Scotland
Over the last ten years, the number of households has increased in every Council area in Scotland except Inverclyde (where it fell slightly). These trends are likely to continue, with the number of households in almost every Council area projected to increase. Figure 9.2 on the following page shows the projected percentage change in the number of households in each Council over the 25 year projection period (2010 to 2035).
In some areas, the number of households is projected to rise markedly, with 15 of the 32 Council areas projected to increase by at least 20 per cent. The largest projected increases are in City of Edinburgh (43 per cent) and Perth and Kinross (43 per cent). Aberdeen City, Aberdeenshire and East Lothian also have projected increases of over 30 per cent. In contrast, Inverclyde has a projected decrease of six per cent over the same period.
Figure 9.3 shows the number of households of each type in 1981 and the projected numbers for 20102 and 2035. There is a substantial increase in households containing just one adult (a projected increase of 49 per cent between 2010 and 2035). There are also increases in households with two adults (a projected increase of 23 per cent) and households with one adult with children (a projected increase of 51 per cent).
In contrast, the number of larger households is falling, with households containing two or more adults with children, or three or more adults, projected to decrease by around 25 per cent between 2010 and 2035.
Figure 9.3: Households in Scotland by household type: 1981, 2010 and 2035
2) 2010 is the first year of the latest household projections. The total number of households in this year is based on household estimates using Council Tax data for 2010, however the number of households in each household type are based on projections of 1991 and 2001 census data.
Age group
Figure 9.4 shows the number of households in 1981 and the projected numbers in 20103 and 2035, by the age of the head of household. The ‘head of household’ is the first person included on the census form, unless that person was aged under 16 or was not usually resident in the household.
Scotland’s population is ageing, with a projected increase in the number of people in the older age groups. This trend is reflected in the projected number of households, with the largest increases in households headed by people aged 65 or over (an increase of almost 60 per cent, from 603,000 to 954,000 between 2010 and 2035). In contrast, households headed by someone aged under 65 are projected to increase by just 10 per cent, to around 1.93 million. The number of households headed by someone aged 85 or over is projected to more than double over the same period, from 76,000 to 198,000.
Figure 9.4: Households in Scotland by age of head of household: 1981, 2010 and 2035
3) 2010 is the first year of the latest household projections. The total number of households in this year are based on household estimates using Council Tax data for 2010, however the number of households in each age group are based on projections of 1991 and 2001 census data.
Single-adult households
Thirty eight per cent of dwellings in Scotland are entitled to a Council Tax discount because there is only one adult living there (alone, with children or with those ‘disregarded’ for Council Tax purposes). The proportion of dwellings entitled to a single-adult discount is higher in urban areas (42 per cent in large urban areas, compared to 29 per cent in rural areas) and in deprived areas (52 per cent in the most deprived areas, compared to 28 per cent in the least deprived areas), as illustrated in Figures 9.5 and 9.6.
Figure 9.5: Single-adult households1, by urban-rural classification, 2011
0%
5%
10%
15%
20%
25%
30%
35%
40%
45%
Large urbanareas
Other urbanareas
Accessiblesmall towns
Remote smalltowns
Accessible ruralareas
Remote ruralareas
Perc
enta
ge o
f dw
ellin
gs in
the
are
a
Footnote1) Dwellings entitled to a Council Tax discount, as there is only one adult living there (either alone, with children, or with those ‘disregarded’ for Council Tax purposes).
Figure 9.6: Single-adult households1, by level of deprivation2, 2011
0%
5%
10%
15%
20%
25%
30%
35%
40%
45%
50%
55%
1 2 3 4 5 6 7 8 9 10
Perc
enta
ge o
f dw
ellin
gs in
the
area
Most deprived Least deprivedFootnotes1) Dwellings entitled to a Council Tax discount, as there is only one adult living there (either alone, with children, or with those ‘disregarded’ for Council Tax purposes).2) Scottish Index of Multiple Deprivation (SIMD) 2009. More information can be found in Appendix 2.
There are higher proportions of flats in urban areas, and in more deprived areas, as shown in Figures 9.7 and 9.8. In contrast, there are higher proportions of detached houses in rural areas, and in less deprived areas.
Figure 9.7: Dwelling type, by urban-rural classification, 2011
0%
10%
20%
30%
40%
50%
60%
70%
80%
90%
100%
Large urbanareas
Other urbanareas
Accessiblesmall towns
Remotesmall towns
Accessiblerural areas
Remoterural areas
Perc
enta
ge o
f dw
ellin
gs in
the
area
FlatsTerracedSemi-detachedDetachedUnknown
Figure 9.8: Dwelling type, by level of deprivation1, 2011
0%
10%
20%
30%
40%
50%
60%
70%
80%
90%
100%
1 2 3 4 5 6 7 8 9 10
Perc
enta
ge o
f dw
ellin
gs in
the
area
FlatsTerracedSemi-detachedDetachedUnknown
Most deprived Least deprivedFootnote1) Scottish Index of Multiple Deprivation (SIMD) 2009. More information can be found in Appendix 2.
In Scotland 2.8 per cent of dwellings are vacant and 1.5 per cent are second homes, though there is wide variation across the country. Remote rural areas have the lowest percentage of dwellings which are occupied (88 per cent), with higher percentages of vacant dwellings (4.8 per cent of all dwellings in these areas) and second homes (7.3 per cent), as shown in Figure 9.9. The most deprived areas have the highest percentage of dwellings which are vacant (4.6 per cent), as shown in Figure 9.10.
Figure 9.9: Vacant dwellings and second homes, by urban-rural classification, 2011
0%
1%
2%
3%
4%
5%
6%
7%
8%
Large urbanareas
Other urbanareas
Accessiblesmall towns
Remote smalltowns
Accessible ruralareas
Remote ruralareas
Perc
enta
ge o
f dw
ellin
gs in
the
area
% Vacant% Second homes
Figure 9.10: Vacant dwellings and second homes, by level of deprivation1, 2011
0%
1%
2%
3%
4%
5%
1 2 3 4 5 6 7 8 9 10
Perc
enta
ge o
f dw
ellin
gs in
the
area
% Vacant% Second homes
Most deprived Least deprivedFootnote1) Scottish Index of Multiple Deprivation (SIMD) 2009. More information can be found in Appendix 2.
Figure 9.11 shows the percentage of dwellings which are second homes in each ‘data zone’ in Scotland. A data zone is a standard geography which, at the time they were created in 2004, contained around 750 people. Certain remote rural areas have the highest proportions of second homes, particularly parts of the west coast and some of the islands, Highland Perthshire, and the area around the Cairngorms National Park. This also illustrates the variation within Council areas.
Figure 9.11: Percentage of dwellings which are second homes, in each data zone in Scotland, 2011
More information about households and housing statistics
More detailed information about Scotland’s households and housing, including estimates and projections can be found within the Households section on the National Records of Scotland website.
Since the introduction of statutory registration in Scotland in 1855, accuracy in the registers of births, deaths and marriages has always been of vital importance. By 1856, it was deemed necessary to create the post of examiners to inspect the registers in order to guarantee their accuracy, and today there are still three district examiners responsible for examining all of the 150,000 records created annually. The utility of the registers themselves as an archive and the variety of uses to which the information contained in them is put depends on their accuracy and probity. Extracts from the statutory registers (commonly called certificates) are legal documents admissible as evidence in the courts.
Today, statutory responsibility for delivering the registration service in Scotland rests with the 32 councils. The service is relatively small, but extremely professional. Registrars are expected to have an expert knowledge in the law and practice of registration and to possess particular skills to help them deal with sometimes difficult human circumstances such as bereavement. To support them in that work and to ensure sufficiently high standards of service are met, registrars are usually expected to study for, and attain, the Certificate of Proficiency in the Law and Practice of Registration (the numbers of certificate holders in each local authority are shown in Table 10.1).
The Certificate of Proficiency in the Law and Practice of Registration in Scotland is recognised by the Association of Registrars of Scotland (ARoS), the Convention of Scottish Local Authorities (CoSLA) and National Records of Scotland (NRS), as the professional qualification for registration staff. The certificate is awarded and administered by an Examination Board consisting of representatives of ARoS, CoSLA and NRS. The Examination Board was inaugurated in 1937 and the first examination was held in 1938.
The statutory landscape in which registrars are expected to operate is increasingly complex. In the last 10 years there have been 10 Acts of Parliament which have had a significant effect on registration law and practice -
The Marriage (Scotland) Act 2002 (the 2002 Act) – provided for civil marriage at approved places.
The Human Fertilisation and Embryology (Deceased Fathers) Act 2003 – enabled deceased fathers to be recorded in birth entry.
The Immigration and Asylum (Treatment of Claimants) Act 2004 – new and complex rules affecting the legal preliminaries for foreign nationals who want to marry or enter into civil partnerships in the UK.
The Gender Recognition Act 2004 – new provisions to allow individuals to change gender legally and new registration procedures flowing from that.
The Civil Partnership Act 2004 – new provisions to allow civil partnerships to be entered into and registered.
The Family Law (Scotland) Act 2006 – acquisition of parental rights and responsibilities for unmarried fathers who register the birth jointly with the mother.
The Local Electoral Administration and Registration Services (Scotland) Act 2006 – first major overhaul of principal registration statute for over 40 years.
The Adoption (Scotland) Act 2007 – new provisions to enable adoption by same sex couples.
The Human Fertilisation and Embryology Act 2008 – new provisions to allow same-sex couples to have fertility treatment (assisted conception) and to register as parents of a child.
The Certification of Death (Scotland) Act 2011 – new death registration provisions to enable checks to be made on causes of death.
Against that backdrop, and in the face of large scale structural changes affecting how services are delivered, registrars have achieved excellent accuracy. Every year since 2007, registrars in the 32 councils have achieved an average of over 97 per cent of the records they create error free – an impressive performance which underpins the quality and reliability of our records and the statistical data published in this Annual Review. The Performance Indicators in Table 10.1, compiled from the district examiners’ reports, provide a council by council breakdown of performance in 2011.
Table 10.1: Registration Service – Performance Indicators 2011 (by Council)1 Council Births Deaths Religious
Chapter 11 - Beyond 2011: future options for population data collection
An invited chapter from David Martin, Professor of Geography at the University of Southampton and Director of the Economic and Social Research Council’s Census Programme.
Introduction
This year’s Registrar General’s annual review comes at a unique moment in the production of Scottish population statistics. The decennial census, the most important instrument for measuring the characteristics of Scotland’s population, was conducted on 27 March 2011 and we are now waiting for census results to be generated and quality assured. In the meantime, National Records of Scotland (NRS) has commenced a programme of research and consultation entitled ‘Beyond 2011’, examining possible alternatives to a 2021 census, addressing a very similar agenda to the similarly-named research programme of the Office for National Statistics in England and Wales. It is quite normal for national statistical organisations to follow each census with a period of evaluation and reflection on lessons learned, but at first glance it may seem somewhat premature to be considering options for gathering population data in 2021, especially as these include a variety of radical alternatives to a conventional census. However, the process of planning and implementing either a census or, particularly, a non-census alternative approach would be a very long one and international experience suggests that such a major change to the statistical system may indeed take several decades. This article briefly reviews why timely population data are so important and why alternatives to the census are currently receiving so much attention. It then considers in outline the range of alternatives being implemented internationally and reflects on possible futures for the statistical system. Being written from an academic (and English) perspective the writer enjoys the luxury of being able to present and comment on the principal options without any danger of pre-empting Scottish policy decisions which will be taken after thorough evaluation of the options in the period following publication of 2011 census results.
Census strengths and weaknesses
The population census is a unique and enormously rich data source which combines the key strengths of breadth and depth: extensive socio-economic detail is combined with small area geographical detail allowing an integrated series of data products to be generated. To take just one example, the census allows us to discover the numbers of elderly people living alone in privately owned properties – an item of information which at national and regional level is relevant to debates about the nature and funding of care in older age but which at the small area level can provide vital insights into the planning and delivery of health and care services. The census is a source of myriad such statistical counts which inform particular policy and business decisions as well as building up into a rich evidence base from which to develop a broader understanding of changing social and economic circumstances. Data products include counts of persons in places (e.g. elderly persons living alone, cited above), flows of persons between places (e.g. mode of journey to school) and anonymised microdata (i.e. complete records for households and individuals whose identity and location are unknown to the researcher). A chapter by Graham et al. (2011) in last year’s Registrar General’s annual report ably demonstrates the value of the census as a research resource. This power is achieved through the very high population
coverage rates which we expect from a census which permit the production of statistical tables for small areas while still protecting the identity of individual respondents.
Despite these great advantages, the census results are in some respects becoming less fit for purpose, while at the same time it is becoming increasingly difficult to conduct a successful census. We have already seen that one of the strengths of the census is its broad applicability, yet many users of census data are finding that the decadal timescale of data production does not meet their needs. By the time new census results are published, the best available data will be approaching twelve years old. This means that the most recent census data at the time of writing in June 2012 pre-date (for example) the accession of the A8 member states to the European Union in 2004, the global financial crisis of 2007 and changes of government – with all the consequent policy changes – in both Holyrood and Westminster. In those areas of greatest social change and redevelopment, our small area population characteristics may be very out of date. The structure of society itself is also changing, with more complex household structures and multiple places of residence of individuals (Baker, 2004) increasingly defying standard census definitions such as ‘household’ and ‘usual place of residence’. From international experience, we know that a variety of household characteristics are associated with census non-response (Carter, 2009). All this means that conducting a census is a complex, expensive and fundamentally risky venture which may be upset either by external factors such as the 2001 foot and mouth epidemic and 1991 protests over the poll tax, or by operational difficulties such as address listing and fieldwork failures in 2001 (Statistics Commission, 2007). Undertaking and evaluating the results of a modern census rely on use of administrative data sources to aid enumeration and to validate population counts. Examples include the use of an address register to plan the delivery of census forms and alternative sources such as the health service register and council tax lists as comparators for the counts of persons and households found by the census. There is understandably a growing demand for approaches which might deliver more timely data with lower cost and risk and which draw on the wide range of data already continuously collected about members of the population. In this context, the House of Commons Treasury Committee (2008) recommended that the 2011 census should be ‘the last census in the UK where the population is counted through the collection of census forms’.
Potential alternatives
Disquiet over the conventional census is not by any means limited to the UK. Internationally, it is possible to see a variety of alternatives being developed, with Valente (2010) describing the mixture of approaches employed within Europe in the 2010-11 round of population data collection. There is wide diversity of approaches being employed, but a helpful three-fold division is between: (a) continuation with a conventional census, (b) replacement of the census with an alternative system based primarily on administrative records or (c) hybrid models which involve some form of census enumeration coupled with increased use of non-census sources. We shall briefly consider these in turn, recognising that each country adopts a unique mixture of approaches and that in many countries long-term strategy is not firmly set, but is currently the subject of intense debate. The different national positions reflect remarkable differences in the public acceptability of alternative data collection models and ways in which these are reflected in national statistics legislation.
Certainly there are numerous countries that are continuing with conventional census programmes. Australia and Ireland are already well-advanced in their plans for censuses in 2016, following a five-yearly cycle. The reviews undertaken by these countries suggest that many of the pressures already identified, such as the challenge of achieving full coverage and need for a comprehensive address list, are certainly present but the five-yearly cycle improves data currency. The Irish Central Statistics Office (2012) set out a strategy which includes developing the future role of administrative data sources and making greater use of internet-based enumeration. Internet enumeration also features strongly in Australia’s plans for 2016, recognising high census costs and coverage challenges as key issues. The planning of even a conventional census on a five-yearly cycle in the Australian system is an operation spread over seven years (Hillermann, 2011). Despite the challenges involved, these countries are pursuing a clear path to the continued use of a census as the principal tool for the next major round of population data collection.
The Scandinavian countries have adopted a very different strategy whereby the primary population data sources are administrative and therefore collected continuously (United Nations Economic Commission for Europe (UNECE), 2007). Essentially, the linkage of person, address and business registers provides a foundation for linkage of data about individuals, dwellings and workplaces allowing many of the key census-type variables to be reproduced. To return to our earlier example, it is possible to see how information about elderly persons living alone in privately owned property might be extracted by some combination of a health service register which recorded ages and a property tax register which recorded discounts for single person occupancy. The practical implementation of such a system is dependent on the presence of key linking fields such as a citizen number, health service number etc. and is most readily achieved in those countries where the same citizen number is used across all public services, ideally where there is a requirement for citizens to register their place of residence. Once established, a variety of alternatives exist as to whether the data sources are linked once only for the purpose of producing statistics or are routinely integrated. Population statistics may be extracted from these systems as required, for example the production of annual data. These approaches do not provide all the socio-economic detail provided by a full conventional census, nor do they resolve the many definitional issues, particularly concerning the composition of households and families. Greater socio-economic detail is typically provided by additional social surveys, albeit providing data at coarser geographical scales. International experience suggests that the use of linked administrative registers offers a viable route to cheaper and more frequent population statistics but is also not without risks – particularly those associated with lack of control of the source data by the national statistical organisation. Those countries using a register-based approach have had very long lead-in times to ensure that the available registers are compiled and made available in ways which make them fit for statistical purposes. Ralphs and Tutton (2011) note that the production of a reliable dwelling and housing unit register was a significant step required in Sweden’s move to wholly register-based data collection in 2005 from its five-yearly census last held in 1990. They also observe that other countries have begun to adopt comparable register-based systems, including Austria, where a register-based census was implemented for the first time in 2011. Two decades does not seem an unreasonable estimate for a successful full transition from a census to an administrative solution.
France, the USA and Canada each offer various hybrids of the census and alternative methods. These countries have each taken unique steps away from conventional census
enumeration by combination of adapted census designs and ancillary data collection. Of these, the most radical has been France’s transition to a rolling census model (Ralphs and Tutton, 2011) whereby a continuous programme of census enumeration has been initiated since the last conventional census in 1999. French communes are stratified and sampled each year on a rolling five-yearly cycle offering complete geographical coverage of small communes and around 40% coverage of large communes (population over 10,000) within each cycle. A composite statistical dataset can be produced which is based on data from the last five years – essentially a series of rolling averaged values. Another alternative design with a complex temporal component has been the move to a short form census and American Community Survey (ACS) in the United States (US Census Bureau, 2009). Until 2000, a short census form covering basic demographic and residence details was delivered to all households and a long form, covering many of the more detailed social and economic topics found in UK census questionnaires, was delivered only to 1/6th of households. From 2005 the ACS began to survey a stratified sample of addresses at the rate of 2.5% per year. The 2010 census employed a short form only, the ACS providing the equivalent to the traditional long-form information. As with the French model, the ACS permits data for different years to be pooled, allowing estimates to be produced for smaller geographical areas by combining multiple years of survey data. These continuous designs place new conceptual demands on users, who must have a sufficient understanding of the survey structure to be able to make appropriate use of the data in their own analyses. There are also considerable challenges in obtaining comparable data from the traditional census system and its successor. In France and the US, the first decade of the 2000s has thus been spent in undertaking a planned transition from a traditional census to new hybrid systems. Canada offers a rather different trajectory, whereby a conventional census using short and long forms was planned for 2011 but the long form content was redesigned in 2010 as a new voluntary National Household Survey (Statistics Canada, 2012). It is still too soon to assess the full implications, but with anticipated response rates of 50% compared to 94% for the compulsory long form, the experience serves witness to the very long timescales required for significant redesign of a national population statistics system without the potential for disruption to data availability and quality. Interested readers will readily find online extensive reporting and ongoing public discussion about the future of the ACS and decision to adopt the Canadian National Household Survey. These debates bring to the fore diverse and deeply-held positions regarding the social acceptability of supplying personal data to government and the rights and responsibilities of citizens.
Ways forward
It is tempting to read into the above account an inevitable transition from conventional censuses to alternative means of population data collection, albeit one that is operating at different speeds in different countries. The unique nature of each national context has been stressed and it is essential that each country determine its own solution, appropriate to its own particular circumstances but with regard to international practice. It does seem increasingly unlikely that unmodified census models will continue to simultaneously meet national information needs alongside political and social expectations of quality, cost and acceptability. Given the very long timescales required for well-managed change, we should now be seeking to foster the best possible informed public debate. In this context the reader will do well not only to reflect on the enormous value of the information contained in this Registrar General’s annual review but also to eagerly await the 2011 census results and contribute to Scotland’s developing Beyond 2011 agenda.
Baker, L. (2004) Covering All Bases: early thoughts for population bases for the 2011 Census Population Trends 116, 6-10
Carter, M. (2009) Explaining the census: investigating reasons for non-response to the ABS census of population and housing Institute for Social Research, Swinburne University of Technology www.sisr.net
Central Statistics Office (2012) Statement of strategy 2012-14 www.cso.ie
Graham, E., Findlay A., Manley, D., McCollum, D., Popham F. and van Ham. M. (2011) Scotland’s Census as a research resource. Scotland’s Population 2010 The Registrar General’s Annual Review of Demographic Trends, 156th Edition: Edinburgh, 73-85
Hillermann, J. (2011) Planning for Australia’s 2016 Census. Presentation to the 25th Population Census Conference: Seoul Korea http://ancsdaap.org
House of Commons Treasury Committee (2008) Counting the population. The Stationery Office: London, HC 183-I.
Ralphs, M. and Tutton, P. (2011) Beyond 2011: international models for census taking: current processes and future developments. Office for National Statistics www.ons.gov.uk
Statistics Canada (2012) National Household Survey. www.statcan.gc.ca
Statistics Commission (2007) Counting on Success: The 2011 Census – Managing the Risks. Statistics Commission Report No. 36 Statistics Commission: London
UNECE (2007) Register-based statistics in the Nordic countries: review of best practices with focus on population and social statistics. United Nations: Geneva http://unstats.un.org
US Census Bureau (2009) Design and methodology: American Community Survey. www.census.gov
Valente, P. (2010) Census taking in Europe: how are populations counted in 2010? Population and Societies 467, 1-4. www.unece.org
1) Live births only, prior to 1939.2) More information can be found in Notes, definitions and quality of statistics.3) The Civil Partnership Act 2004 came into effect in December 2005.4) Rate per 1,000 population.
1) The definition of a stillbirth varies from country to country and over time. The position in the UK is described in Appendix 2 - Notes, definitions and quality of statistcs.
5) Excludes Isle of Man and Channel Islands.
Stillbirths1
Country
6) Rate for 2009 (latest available)
Sources: Eurostat, World Health Organisation (WHO)/Europe
3) Rate per 1,000 live and still births.2) Rate per 1,000 population.
Appendix 2 – Notes, definitions and quality of statistics
This appendix gives general notes on some of the information and conventions used in this report, and defines some of the terms.
General
Conventions for tables
Where a range of years is listed in a table (for example, ‘1980-82’), the information we have given will be an average for that length of time.
In all tables ‘year’ means ‘calendar year’ unless we tell you otherwise. Many of the ranges of years start in a census year (for example, 1991).
The date events happen and the date of registration
The statistics about births and deaths in the Population chapter are for mid-year periods (from 1 July of one year to 30 June of the next) and relate to the date the event happened and not to the date the event was registered. For example, a birth on 30 June 2011 which was registered on 4 July 2011 would be included in the mid-2011 figures, which relate to the period from 1 July 2010 to 30 June 2011.
All the other statistics about births and deaths, as well as the statistics about stillbirths, marriages and civil partnerships, are for calendar years and relate to the date the event was registered, not the date the event actually happened. For example, a birth on 31 December 2009 which was registered on 4 January 2010 would be included in the 2010 figures. By law, births and stillbirths should be registered within 21 days, marriages and civil partnerships should be registered within three days, and deaths should be registered within eight days. Almost all births, stillbirths, marriages, civil partnerships and deaths are registered on time.
The place the relevant person usually lives and the place the event happens
Births, stillbirths, and deaths are generally allocated to the area in Scotland where the relevant person (the mother for births and stillbirths, and the person who has died for deaths) usually lives. If the relevant person does not usually live in Scotland, the event is allocated to the area in which it happened. However, a death may be allocated to the area where the person used to live if the area is in Scotland and the person had lived away from that area for less than 12 months.
Marriage and civil partnership figures relate to the area where the event took place.
Age
Ages relate to the person’s age on their last birthday.
When working out average ages (such as the average age at death and the average age of mothers at childbirth) we have added half a year to people’s age at their last birthday. For example, to work out the overall average age at death, we
have assumed that the average age of 77-year-olds who died was 77 years and 6 months.
Age standardisation
A straight comparison of rates between areas may give a misleading picture because of differences in sex and age between the different populations. For example, it would be unreasonable to expect a high birth rate in an area with a high proportion of elderly people. Because of this, we have standardised information in certain tables and charts. Standardisation allows areas with different age and sex structures to be easily compared, comparing the actual number of events that happen in an area with the total number of events that would be expected if the area had the rates of the standard population. In this report, the standard population refers to the overall Scottish population for the year or years in question.
Lists of groups of countries
EU-15 refers to the countries that were member states of the European Union before 1 May 2004, which were Austria, Belgium, Denmark, Finland, France, Germany, Greece, Ireland, Italy, Luxembourg, the Netherlands, Portugal, Spain, Sweden and the United Kingdom. EU-25 refers to the EU-15, plus the countries that became member states of the European Union between 1 May 2004 and 31 December 2006, which were Cyprus, Czech Republic, Estonia, Hungary, Latvia, Lithuania, Malta, Poland, Slovenia and Slovakia. EU-27 refers to the EU-25, plus the countries that became member states of the European Union after 1 January 2007, which were Bulgaria and Romania.
CEECs (Central and Eastern European Countries) is the term the Organisation for Economic Co-operation and Development uses for the group of countries comprising Albania, Bulgaria, Croatia, the Czech Republic, Hungary, Poland, Romania, the Slovak Republic, Slovenia, and the three Baltic States – Estonia, Latvia and Lithuania.
Urban and rural classifications
‘Large urban areas’ are settlements of over 125,000 people.
‘Other urban areas’ are settlements of 10,000 to 125,000 people.
‘Accessible small towns’ are settlements of between 3,000 and 10,000 people that are within a 30-minute drive of a settlement of 10,000 people or more.
‘Remote small towns’ are settlements of between 3,000 and 10,000 people that are not within a 30-minute drive of a settlement of 10,000 people or more.
‘Accessible rural settlements’ are settlements of fewer than 3,000 people that are within a 30-minute drive of a settlement of 10,000 people or more.
‘Remote rural settlements’ are settlements of fewer than 3,000 people that are not within a 30-minute drive of a settlement of 10,000 people or more.
You can get more information about the Scottish Government (SG) Urban Rural Classification on the SG website.
Deprivation
The Scottish Government produces the Scottish Index of Multiple Deprivation to define small-area concentrations of deprivation across all of Scotland. The index is based on 38 indicators in eight fields – income, employment, health, education, skills and training, housing, geographic access and crime.
You can get more information about the Scottish Index of Multiple Deprivation on the SG website.
Chapter 1 - Population
All population figures refer to estimates at 30 June of the relevant year.
Population covered
The estimated population of an area includes all those who usually live there, whatever their nationality. Students are treated as living at their term-time address. Members of UK and non-UK armed forces stationed in Scotland are included, but UK forces stationed outside Scotland are not. Short-term international migrants (people who move to Scotland for less than 12 months) are also not included.
Population projections
Population projections are estimates for future years largely based on past trends. The Registrar General asks the Office for National Statistics (ONS) to prepare population projections with input from his own experts. The latest national projections were published in October 2011, and were based on 2010 population estimates.
Sources and quality of statistics – population
Population estimates are based on the 2001 Census and are updated each year by adding one year to the age of everyone in the population and including information on births, deaths and migration (people moving to or away from an area). Births and deaths are estimated using information from the civil registration system, which is virtually complete. Migration is more difficult to estimate because there is no complete migration registration system in the UK.
You can get more information about the quality of population statistics from the Mid-year Population Estimates Methodology Guide and the Mid-2009 Population Estimates ‘About this Publication’ document, both of which are available on the National Records of Scotland (NRS) website.
Sources and quality of statistics – population projections
You can get information about the quality of population projections from the Quality and Methodology Information Paper on the ONS website.
Chapter 2 - Births
Cohort
A cohort is a well-defined group of people who have had a common experience and are observed through time. For example, ‘the birth cohort of 1976’ refers to the people born in that year.
General Fertility Rate (GFR)
The number of births per 1,000 women of childbearing age (15 to 44).
Total Fertility Rate (TFR)
The average number of children who would be born, per woman, to a cohort of women who experienced, throughout their childbearing years, the fertility rates for the calendar year in question.
Age Specific Fertility Rate (ASFR)
The number of births per woman for a specific age during a set time.
Marital status of parents
‘Married parents’ means parents who are married to each other. ‘Unmarried parents’ refers to parents who are not married, or who are married but not to each other.
Sources and quality of statistics – births
Statistics about births in Scotland are produced from information collected when the births are registered. The information should be very accurate as it is almost always provided by one or both of the baby's parents, and the parent (or parents) and the registrar should check the details that will appear on the child's birth certificate before the certificate is produced. Also, each record of a birth is checked by one of our district examiners.
The statistics will cover almost 100% of all births in Scotland − because of the importance of a person's birth certificate, there will be very few births that are not registered, and they are likely to be the result of extremely unusual circumstances (for example, if a pregnancy was hidden, the baby killed and the body disposed of).
You can get more information about statistics on births from the Births – Background Information section of the NRS website.
You can also get some general information on all vital events statistics from the Vital Events – General Background Information section of the NRS website.
Chapter 3 - Deaths
Cause-of-death coding
Since 1 January 2000, deaths in Scotland have been coded in line with the International Statistical Classification of Diseases and Related Health Problems (Tenth Revision), also known as ICD10. We put the underlying causes of death into classes based on information collected from the medical certificate of cause of death, together with any extra information the certifying doctor provides later. We also take account of changes that procurators fiscal tell us about.
You can get more detailed information about death certificates and coding the causes of death, and how we produce statistics of deaths from certain causes, in the Deaths section of the NRS website.
Stillbirth
Section 56(1) of the Registration of Births, Deaths and Marriages (Scotland) Act 1965 (as amended by the Still-Birth (Definition) Act 1992) defines a stillbirth as a child born after the 24th week of pregnancy which does not breathe or show any other sign of life.
Perinatal deaths
This refers to stillbirths and deaths in the first week of life.
Infant deaths
This refers to all deaths in the first year of life.
Sources and quality of statistics – deaths
Statistics about deaths in Scotland are produced from information which is collected when the deaths are registered. Details of the causes of death come from the Medical Certificate of the Cause of Death (MCCD), and so represent the results of a doctor's clinical judgment, which may not be correct (and, sometimes, an investigator may feel that the doctor did not fill in the MCCD properly - for example, perhaps the doctor mentioned on the MCCD a medical condition that was not related in any way to the death). In some cases, the doctor, a procurator fiscal or a pathologist provides extra information about the cause of death later, for example following further investigations.
Other information about the person who has died will be provided by the person who registers the death (who is usually a son or daughter, sometimes a husband, wife or partner, another relative or a friend, or occasionally, someone like a police officer or a care-home manager) or the registrar can get the information from existing registration records (if the person who has died was born or married in
Scotland). In a small percentage of cases, some of the information about the person who has died may not be complete or accurate (for example, if the person registering the death did not know the person very well, and the registrar could not get details from previous registration records). The person registering the death and the registrar should check the details before the certificate is produced. Also, each record of a death is checked by one of our district examiners.
The statistics will cover almost 100% of all deaths in Scotland, as a cemetery or a crematorium will not accept a body unless the death has been registered. However, occasionally a death may not be recorded (for example, because the authorities do not know that someone who is missing has died).
You can get more information about statistics on deaths in the Deaths – Background Information section of the NRS website. You can also get some general information on all vital events statistics from the Vital Events – General Background Information section of the NRS website.
Chapter 4 - Life expectancy
The average number of extra years a person can expect to live if current trends regarding the number of deaths (mortality trends) continue for the rest of that person’s life. Life expectancy is most commonly referred to in relation to life expectancy at birth.
Sources and quality of statistics – life expectancy
The life expectancy estimates are based on the likely trends in the number of deaths indicated by the death records for the three years before the year the records are published. For example, the estimates based on the figures for 2008-2010 for administrative areas were published in October 2011.
You can get more information about the quality of statistics on life expectancy in the Life Expectancy for Scotland Methodology Guide and on the Life Expectancy at Scotland Level Methodology page, both on available on the NRS website.
Net migration figures (the number of people moving to Scotland minus the number of people moving out of Scotland) include people joining and leaving the Armed Forces but do not include other changes, such as changes in the numbers of Armed Forces stationed in Scotland.
Sources and quality of statistics – migration
Estimates of internal migration (that is people moving between Scotland and the rest of the UK) are based on GP registrations and are considered reasonably accurate for most groups. They may be less accurate for young men, as they tend not to register with a GP immediately after moving.
International migration estimates (that is, people moving between Scotland and countries outside the UK) are based largely on the International Passenger Survey (IPS). However, these estimates may not be very accurate.
Net migration figures (the number of people moving to Scotland minus the number of people moving out of Scotland) include people joining and leaving the Armed Forces but do not include other changes, such as changes in the numbers of Armed Forces stationed in Scotland.
You can get more information about the quality of statistics on migration from the Migration Methodology page and Migration Statistics – About these publications document, both available in the Migration section of the NRS website.
Chapter 6 - Marriages and civil partnerships
Civil marriages were introduced by the Marriage (Scotland) Act 1939, which came into force on 1 July 1940.
The Civil Partnership Act 2004, which applies throughout the UK, came into force on 5 December 2005. The act allows same-sex couples aged 16 and over to get legal recognition of their relationship. In Scotland, the first civil partnership was registered on 20 December 2005.
Sources and quality of statistics – marriages and civil partnerships
Statistics about marriages and civil partnerships in Scotland are produced from information which is collected when the marriages and civil partnerships are registered. The information should be very accurate as it will be provided by the bride and groom, or the civil partners, and the couple and the registrar will check the details that will appear on the certificate before the certificate is produced. Also, each record of a marriage or a civil partnership is checked by one of our district examiners.
The statistics cover 100% of all marriages and civil partnerships in Scotland as a marriage or civil partnership is not legally formed unless a district registrar has carried out all the legal requirements.
You can get more information about statistics on marriages and civil partnerships from the Marriages and Civil Partnerships – Background Information section of the NRS website. You can also get some general information on all vital events statistics from the Vital Events – General Background Information section of the NRS website.
Chapter 7 – Divorces and dissolutions
The information on divorces relates to the date on which the decrees were granted. The information on dissolutions of civil partnerships relates to the date on which the decree was granted.
Sources and quality of statistics – divorces and dissolutions
You can get some background information about some of these statistics from the Divorces and Dissolutions – Background Information section of the NRS website. However, the Scottish Government (SG) is the main publisher of statistics on divorces and dissolutions in Scotland which have been granted since April 2009. More information about the quality of these statistics is included in SG's statistical publications on divorces and dissolutions, which are available from the Scottish Government’s website.
Chapter 8 - Adoptions
The Registrar General for Scotland registers adoptions under the Adoption of Children (Scotland) Act 1930.
Sources and quality of statistics – adoptions
You can get some more information about these statistics from the Adoptions section of the NRS website.
We produce household projections (estimates for future years largely based on past trends) every two years. These are mainly used for informing decisions about future housing need and providing services. The latest household projections, covering the length of time from 2010 to 2035, take account of the results of the latest population projections. They use information from the last two censuses to help project trends in how households are structured by type of household and by the age of the head of household. The head of household is defined in the census as the first person on the census form who is aged 16 or over and usually lives at the address in question. The projections give an indication of what would happen if past trends continue. They do not take account of policy initiatives, or other factors that may affect future populations. Projections for small groups are likely to be less reliable than those for larger groups.
Household estimates
Household estimates are produced every year from information on occupied and empty homes taken from council tax billing systems. An occupied home is roughly equivalent to a household. The estimates are used for a range of purposes including informing local authority decisions about housing need and providing services (including housing, planning waste collection and community care). Information on types of housing is taken from the Scottish Assessors' Portal website. The latest household estimates are for 2011.
Sources and quality of statistics – households and housing
Information on occupied and empty homes and on housing type comes from local authority council tax billing systems and from the Scottish Assessors Association, and then goes through a thorough process of quality assurance. It is possible that not all of the information held on the billing systems is up to date. There can also be small differences in the definitions used for various categories in the billing systems. The details can change over time as a result of reviews of council tax discounts and exemptions and year-on-year differences in the way second homes and empty homes are classed by some local authorities. This can have a small effect on the percentages of homes which are classed as empty or second homes.
You can get more information in the 'Uses and Limitations of the Data' and 'Sources, Methods and Definitions' sections of 'Estimates of Households and Dwellings in Scotland, 2011', available in the Household Estimates section of the NRS website.
National Statistics The United Kingdom Statistics Authority (UKSA) has designated these statistics as National Statistics, in line with the Statistics and Registration Service Act 2007 and keeping to the Code of Practice for Official Statistics (available on the UKSA website). This can be broadly interpreted to mean that the statistics:
• meet identified needs of users;
• are well explained and readily accessible;
• are produced according to reliable methods; and
• are managed in a fair, independent and unbiased way in the public interest.
Once statistics have been designated as National Statistics, the Code of Practice for Official Statistics must continue to be followed. National Records of Scotland From 1 April 2011, the General Register Office for Scotland merged with the National Archives of Scotland to become the National Records of Scotland (NRS). The GROS website will remain active until it is replaced by a new website for NRS.
We, the National Records of Scotland, are a non-ministerial department of the Scottish Government. Our aim is to provide relevant and reliable information, analysis and advice that meets the needs of government, business and the people of Scotland. We do this by:
• Preserving the past – We look after Scotland’s national archives so that they are available for current and future generations, and we make available important information for family history.
• Recording the present – At our network of local offices, we register births, marriages, civil partnerships, deaths, divorces and adoptions in Scotland.
• Informing the future – We are responsible for the Census of Population in Scotland which we use, with other sources of information, to produce statistics on the population and households.
You can get other detailed statistics that we have produced from the Statistics section on our website. Statistics from the 2001 Census are on Scotland’s Census Results On-Line website and on the Census section of the GROS website.
We provide information about future publications on our website. If you would like us to tell you about future statistical publications, you can register your interest on the Scottish Government ScotStat website.
Enquiries and suggestions Please visit our enquiries page if you need any further information. If you have comments or suggestions that would help us improve our standards of service, please contact: Kirsty MacLachlan Senior Statistician National Records of Scotland Room 1/2/3 Ladywell House Ladywell Road Edinburgh EH12 7TF. Phone: 0131 314 4242 Email: [email protected]
The Scottish Government (SG) forms the bulk of the devolved Scottish Administration. The aim of the statistical service in the SG is to provide relevant and reliable statistical information, analysis and advice that meets the needs of government, business and the people of Scotland.
Office of the Chief Statistician Scottish Government 1.N04, St Andrew’s House Edinburgh, EH1 3DG Phone: 0131 244 0442 Email: [email protected] Website: www.scotland.gov.uk/Topics/Statistics
The Office for National Statistics (ONS) is responsible for producing a wide range of economic and social statistics. It also carries out the Census of Population for England and Wales.
Customer Contact Centre Room 1.015 Office for National Statistics Cardiff Road Newport, NP10 8XG Phone: 0845 601 3034 Minicom: 01633 812399 Email: [email protected] Website: www.ons.gov.uk
The Northern Ireland Statistics and Research Agency (NISRA) is Northern Ireland’s official statistics organisation. The agency is also responsible, for registering births, marriages, adoptions and deaths in Northern Ireland, and the Census of Population.
Northern Ireland Statistics and Research Agency McAuley House 2-14 Castle Street Belfast, BT1 1SA Phone: 028 9034 8100 Website: www.nisra.gov.uk
Plain English Campaign’s Crystal Mark only applies to pages 7 to 12 and 81 to 92 of this document.