Report To: Scottish Environment Protection AgencyReport No: M0318- 01
Our Ret: AH
Status: V1
Date: 27 March 2018
Scottish Sea Farms Ltd
Blacksness Pier
ScallowayShetland
ZE1 OTQ
Tel: 07769678195
Email: alan. harpin(cDscottishseafarms. com
1. Summary
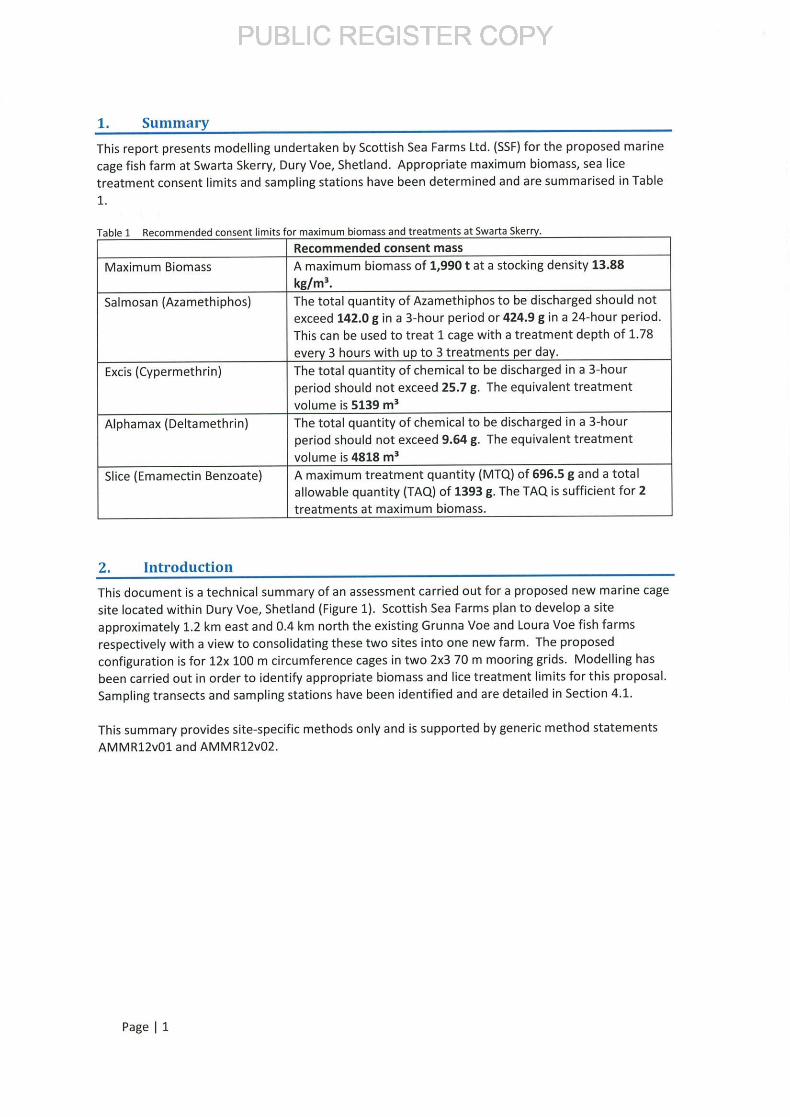
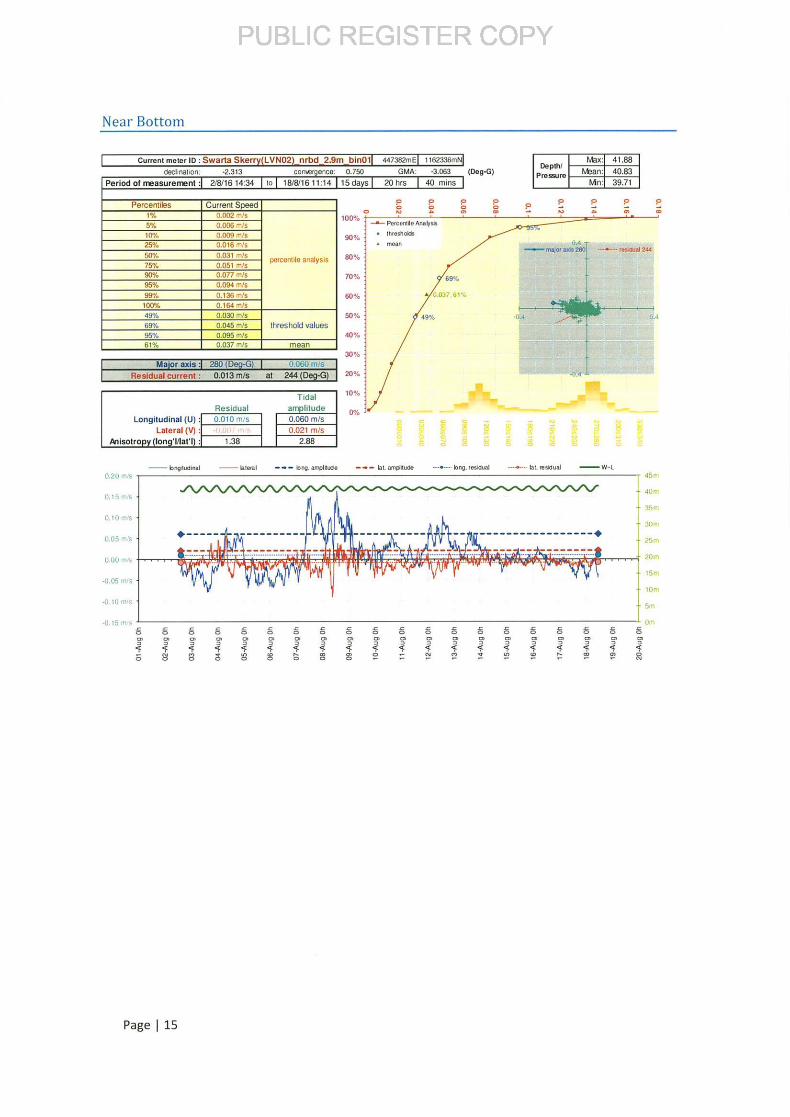
This report presents modelling undertaken by Scottish Sea Farms Ltd. ( SSF) for the proposed marinecage fish farm at Swarta Skerry, Dury Voe, Shetland. Appropriate maximum biomass, sea licetreatment consent limits and sampling stations have been determined and are summarised in Table1.
Tablo t Rornmmandad rons. nt limits for maximum biomass and treatments at Swarta Skein,
2. Introduction
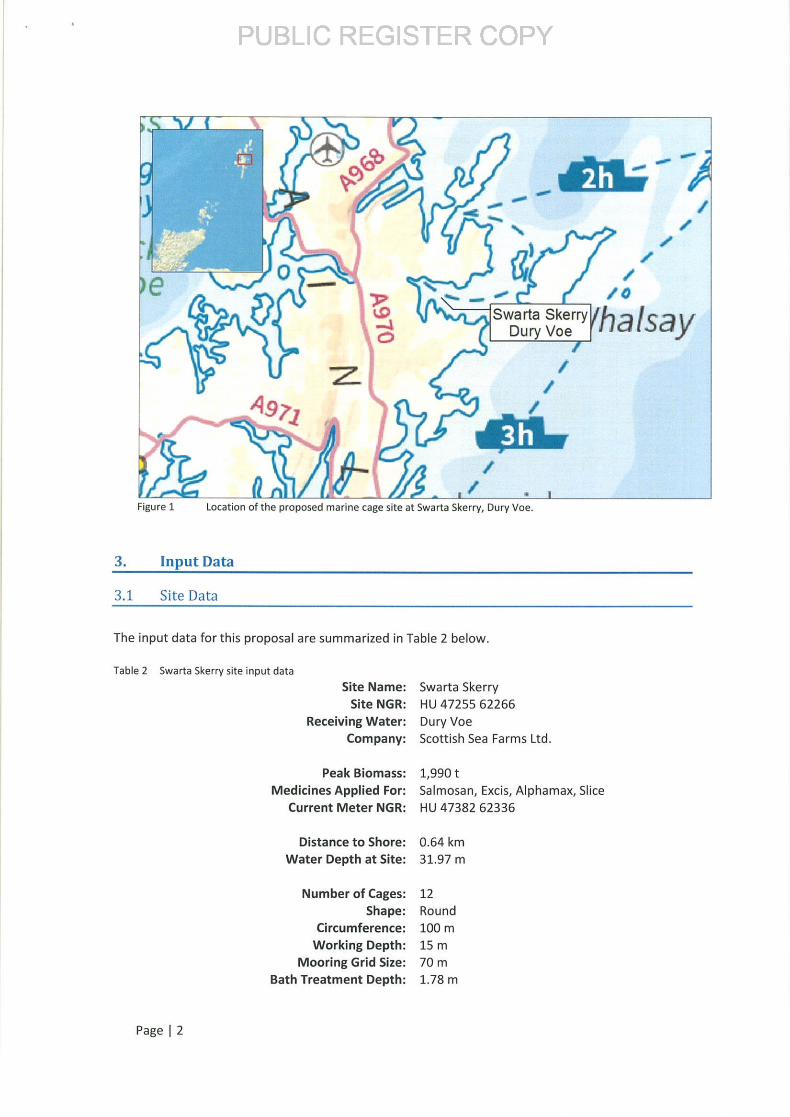
This document is a technical summary of an assessment carried out for a proposed new marine cage
site located within Dury Voe, Shetland ( Figure 1). Scottish Sea Farms plan to develop a siteapproximately 1. 2 km east and 0. 4 km north the existing Grunna Voe and Loura Voe fish farmsrespectively with a view to consolidating these two sites into one new farm. The proposedconfiguration is for 12x 100 m circumference cages in two 2x3 70 m mooring grids. Modelling hasbeen carried out in order to identify appropriate biomass and lice treatment limits for this proposal. Sampling transects and sampling stations have been identified and are detailed in Section 4. 1.
This summary provides site- specific methods only and is supported by generic method statementsAMMR12v01 and AMMR12v02.
Page 11
Recommended consent mass
Maximum Biomass Amaximum biomass of 1, 990 t at a stocking density 13.88
kg/ m'. Salmosan ( Azamethiphos) The total quantity of Azamethiphos to be discharged should not
exceed 142. 0 g in a 3 - hour period or 424. 9 g in a 24- hour period. This can be used to treat 1 cage with a treatment depth of 1. 78
every 3 hours with up to 3 treatments per day. Excis ( Cypermethrin) The total quantity of chemical to be discharged in a 3 -hour
period should not exceed 25.7 g. The equivalent treatmentvolume is 5139 m'
Alphamax ( Deltamethrin) The total quantity of chemical to be discharged in a 3 -hourperiod should not exceed 9. 64 g. The equivalent treatmentvolume is 4818 m'
Slice ( Emamectin Benzoate) A maximum treatment quantity (MTQ) of 696.5 g and a total
allowable quantity ( TAQ) of 1393 g. The TAQ is sufficient for 2treatments at maximum biomass.
2. Introduction
This document is a technical summary of an assessment carried out for a proposed new marine cage
site located within Dury Voe, Shetland ( Figure 1). Scottish Sea Farms plan to develop a siteapproximately 1. 2 km east and 0. 4 km north the existing Grunna Voe and Loura Voe fish farms
respectively with a view to consolidating these two sites into one new farm. The proposedconfiguration is for 12x 100 m circumference cages in two 2x3 70 m mooring grids. Modelling has
been carried out in order to identify appropriate biomass and lice treatment limits for this proposal. Sampling transects and sampling stations have been identified and are detailed in Section 4. 1.
This summary provides site- specific methods only and is supported by generic method statementsAMMR12v01 and AMMR12v02.
Page 11
A
Ag 1
KO
1 /
1 ,
Swarta Skerry j a fsat fDury Voe + j
r
Figure 1 Location of the proposed marine cage site at Swarta Skerry, Dury Voe.
3. Input Data
3. 1 Site Data
The input data for this proposal are summarized in Table 2 below.
Mooring Grid Size: 70 mBath Treatment Depth: 1. 78 m
Page 1 2
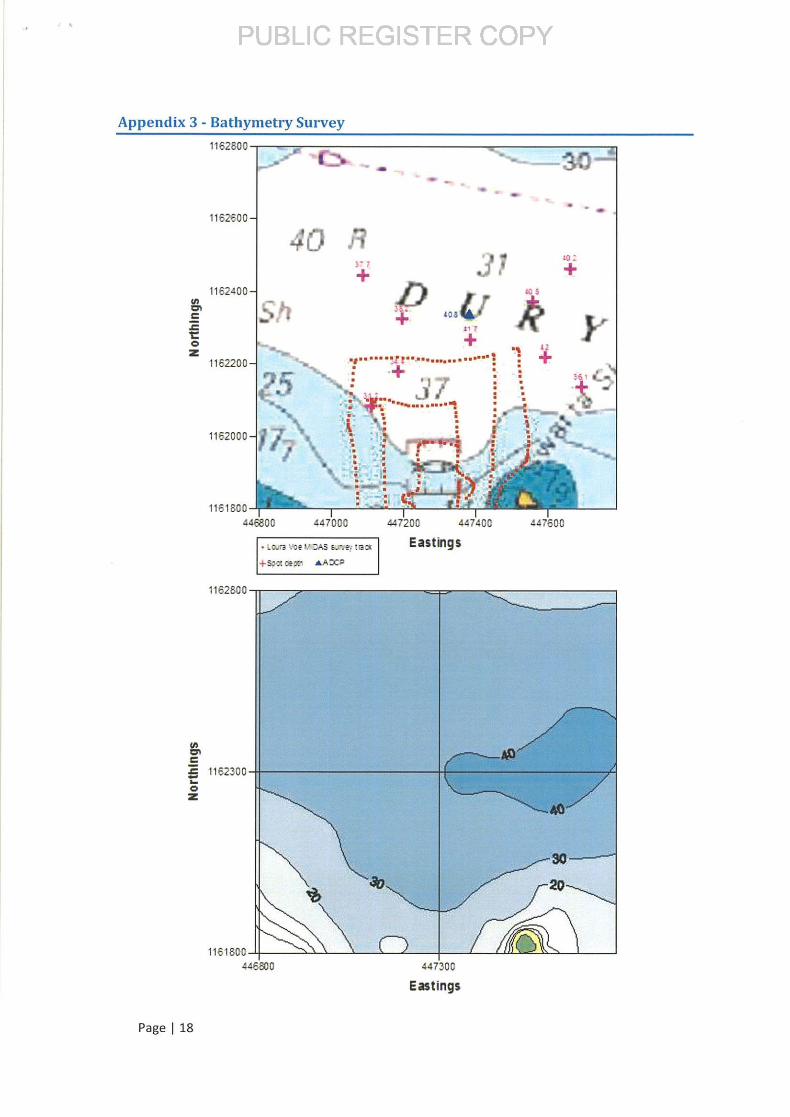
3. 2 Bathymetry
The bathymetry files were created by digitizing contours and spot depths from Admiralty Chart No. 3284-0 and the data limited to a 1 km2 model domain with the following grid limits:
DataAreaXMin= 446790
DataAreaXMax= 447790
DataAreaYM i n= 1161800
DataAreaYMax= 1162800
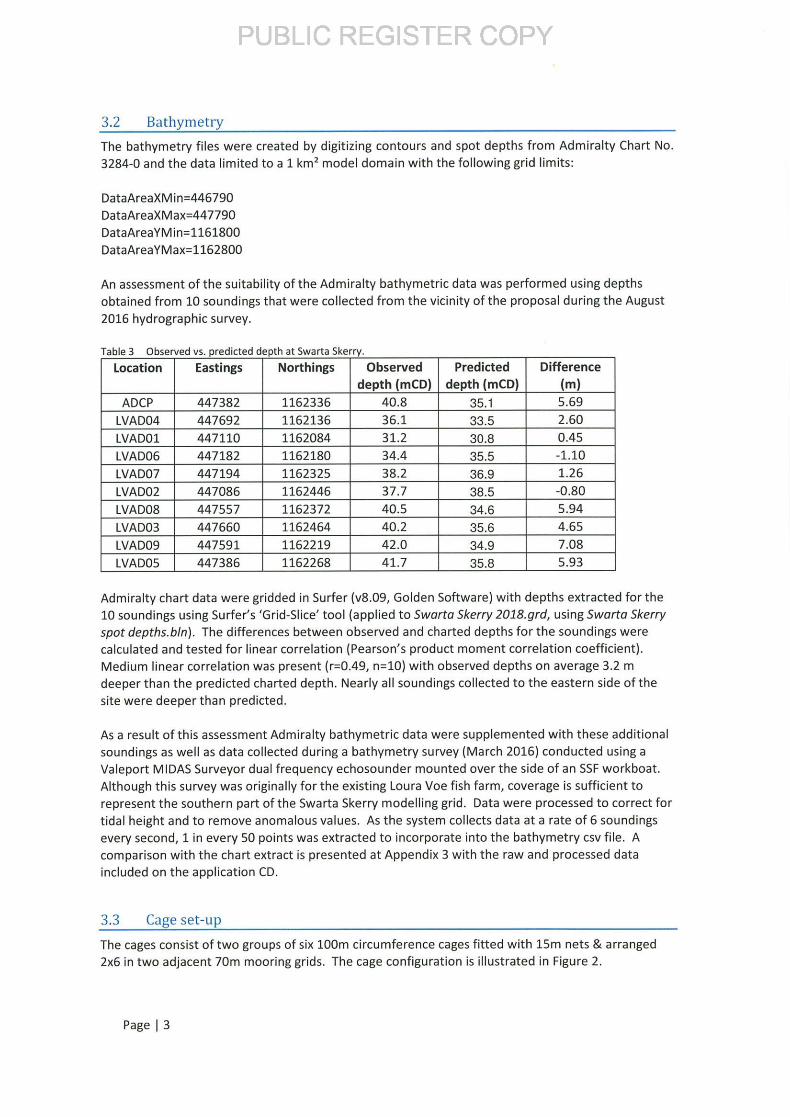
An assessment of the suitability of the Admiralty bathymetric data was performed using depthsobtained from 10 soundings that were collected from the vicinity of the proposal during the August2016 hydrographic survey.
Table 3 Observed vs. Dredicted deoth at Swarta Skerry
Location Eastings Northings Observed
depth (mCD)
Predicted
depth ( mCD)
Difference
m)
ADCP 447382 1162336 40.8 35. 1 5. 69
LVAD04 447692 1162136 36. 1 33. 5 2. 60
LVAD01 447110 1162084 31. 2 30. 8 0.45
LVAD06 447182 1162180 34.4 35. 5 1. 10
LVAD07 447194 1162325 38. 2 36. 9 1. 26
LVAD02 447086 1162446 37. 7 38. 5 0.80
LVAD08 447557 1162372 40.5 34. 6 5. 94
LVAD03 447660 1162464 40. 2 35. 6 4. 65
LVAD09 447591 1162219 42.0 34. 9 7. 08
LVAD05 447386 1162268 41.7 35. 8 5. 93
Admiralty chart data were gridded in Surfer ( v8. 09, Golden Software) with depths extracted for the10 soundings using Surfer' s ' Grid -Slice' tool (applied to Swarta Skerry 2018.grd, using Swarta Skerryspot depths. bin). The differences between observed and charted depths for the soundings were
calculated and tested for linear correlation ( Pearson' s product moment correlation coefficient).
Medium linear correlation was present ( r= 0.49, n= 10) with observed depths on average 3. 2 m
deeper than the predicted charted depth. Nearly all soundings collected to the eastern side of thesite were deeper than predicted.
As a result of this assessment Admiralty bathymetric data were supplemented with these additionalsoundings as well as data collected during a bathymetry survey (March 2016) conducted using aValeport MIDAS Surveyor dual frequency echosounder mounted over the side of an SSF workboat.
Although this survey was originally for the existing Loura Voe fish farm, coverage is sufficient torepresent the southern part of the Swarta Skerry modelling grid. Data were processed to correct fortidal height and to remove anomalous values. As the system collects data at a rate of 6 soundings
every second, 1 in every 50 points was extracted to incorporate into the bathymetry csv file. Acomparison with the chart extract is presented at Appendix 3 with the raw and processed data
included on the application CD.
3. 3 Cage set- up
The cages consist of two groups of six 100m circumference cages fitted with 15m nets & arranged
2x6 in two adjacent 70m mooring grids. The cage configuration is illustrated in Figure 2.
Page 13
OORWP OORWY] JOPWPJ wCunmlYNw
11 a1I1q
IIpi6YJ
I1P} 5pp
11 @, pp
A
1
1f0} 1U0
O
11@1W
OO
118iOJ0
1f01W0
11RIB10
W . 1. . 11% UI= Y110 . 71. Y] WO
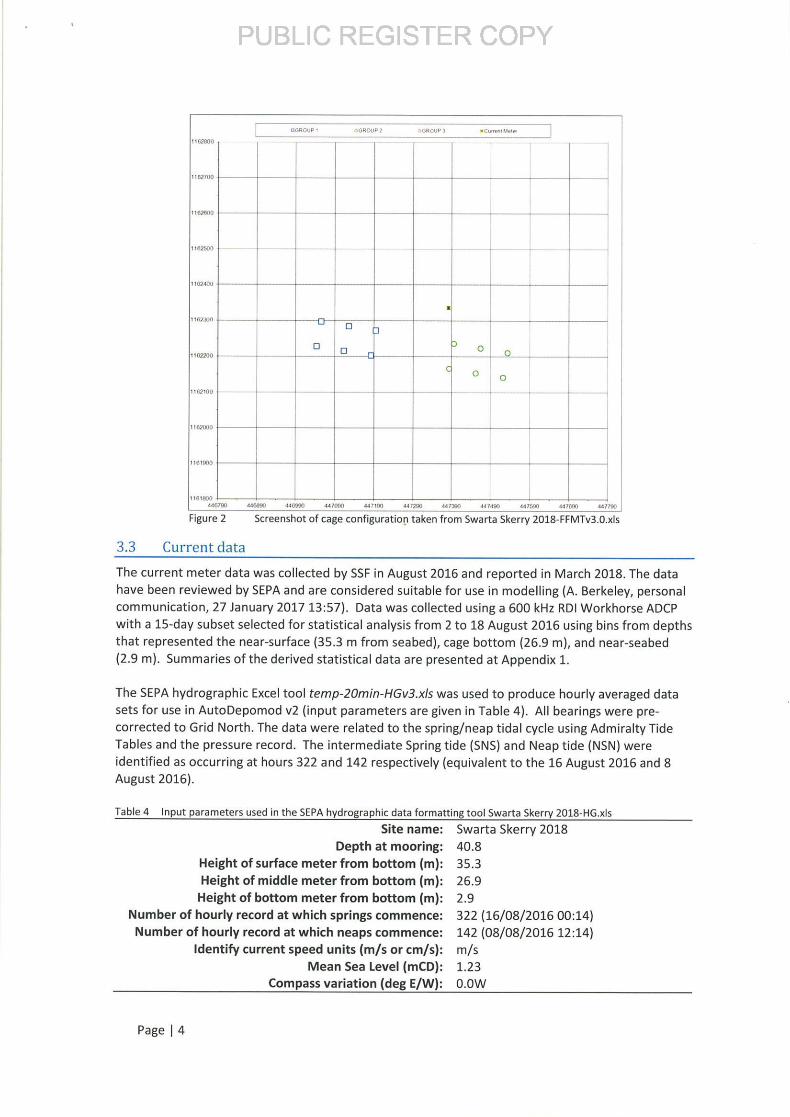
Figure 2 Screenshot of cage configuration taken from Swarta Skerry 2018- FFMTv3. 0. xls
3. 3 Current data
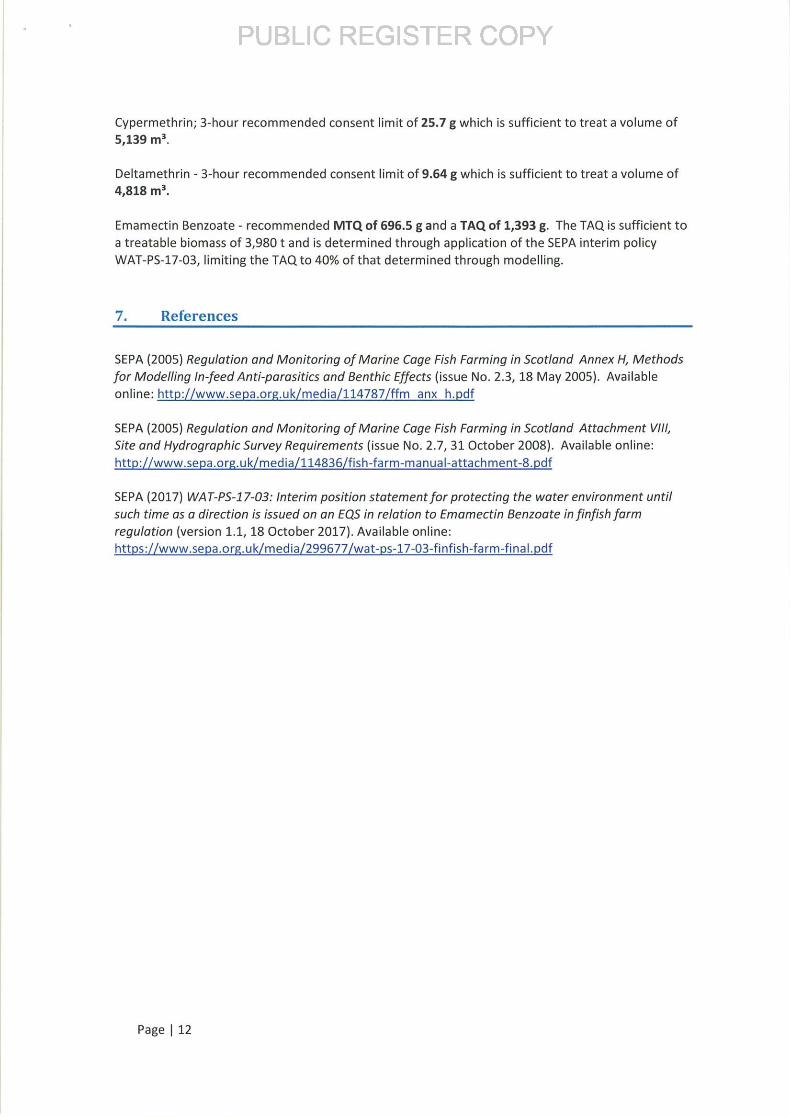
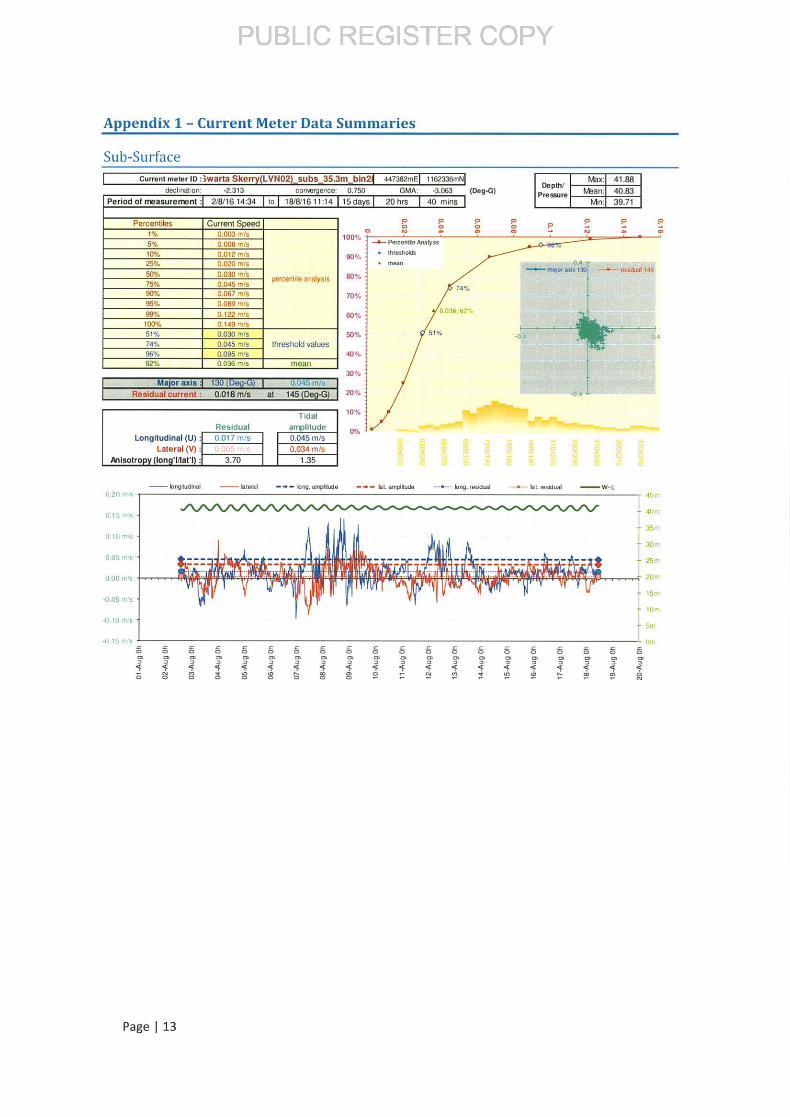
The current meter data was collected by SSF in August 2016 and reported in March 2018. The data
have been reviewed by SEPA and are considered suitable for use in modelling ( A. Berkeley, personalcommunication, 27 January 2017 13: 57). Data was collected using a 600 kHz RDI Workhorse ADCP
with a 15 -day subset selected for statistical analysis from 2 to 18 August 2016 using bins from depthsthat represented the near -surface ( 35. 3 m from seabed), cage bottom ( 26. 9 m), and near -seabed
2. 9 m). Summaries of the derived statistical data are presented at Appendix 1.
The SEPA hydrographic Excel tool temp- 20min- HGO. As was used to produce hourly averaged datasets for use in AutoDepomod v2 ( input parameters are given in Table 4). All bearings were pre -
corrected to Grid North. The data were related to the spring/ neap tidal cycle using Admiralty TideTables and the pressure record. The intermediate Spring tide (SNS) and Neap tide ( NSN) wereidentified as occurring at hours 322 and 142 respectively (equivalent to the 16 August 2016 and 8August 2016).
Table 4 Input parameters used in the SEPA hydrographic data formatting tool Swarta Skerry 2018- 1- 1G. As
Site name: Swarta Skerry 2018Depth at mooring: 40.8
Height of surface meter from bottom (m): 35. 3
Height of middle meter from bottom ( m): 26. 9
Height of bottom meter from bottom (m): 2. 9
Number of hourly record at which springs commence: 322 ( 16/ 08/ 2016 00:14)
Number of hourly record at which neaps commence: 142 ( 08/ 08/ 2016 12: 14)
Identify current speed units ( m/ s or cm/ s): m/ s
Mean Sea Level ( mCD): 1. 23
Compass variation ( deg E/ W): O. OW
Page 14
Mean Sea Level ( defined as the average of MHWS, MHWN, MLWS and MLWN) for Dury Voe was
derived from Admiralty Total Tide software.
The current velocities at the site are weak and indicate the potential for wind influence. Observed
speeds are greatest at the seabed. Transport in the near -surface layer is consistently to the southeast while at the deeper layers shows a residual flow to the west- southwest.
3. 4 Model
Default values were used as described in SEPA guidelines Regulation and Monitoring of Marine Cage
Fish Farming in Scotland. Annex H, Methods for Modelling In feed Anti -parasitics and Benthic Effectsissue No. 2. 3, 18 May 2005).
Initial runs were carried out using a constant feed input, auto -distribute enabled and 10 particles. Asthe proposal intends to consolidate and replace the two existing sites at Loura Voe and Grunna Voe
an initial stocking density of 13. 88 kg/ ma was used to represent 1, 990 tonnes. This is the combinedlicenced biomass at these sites.
4. Results
4. 1 Maximum Biomass
The initial runs at 1, 990 tonnes passed the EQS criteria with an ITI of 10. 3 and 10. 2 for the neap and
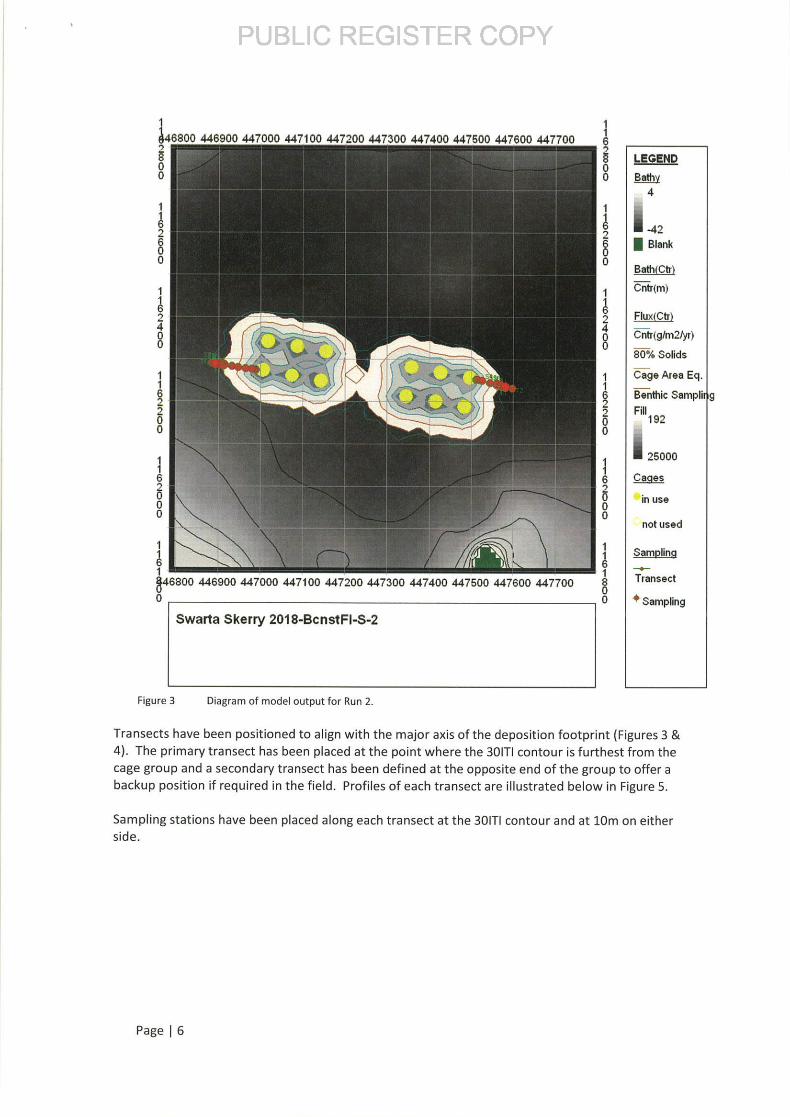
spring scenarios respectively. Table 5 shows the flux, ITI and area results for the spring scenario ( run2; worst case with respect to ITI score) while a plot of the flux contours and deposition footprint is
presented at Figure 3. A full summary of the results is presented in the marine summaryspreadsheet at Appendix 2. The shape and size of the depositional footprint is consistent with the
local bathymetry and the dispersive properties of the location.
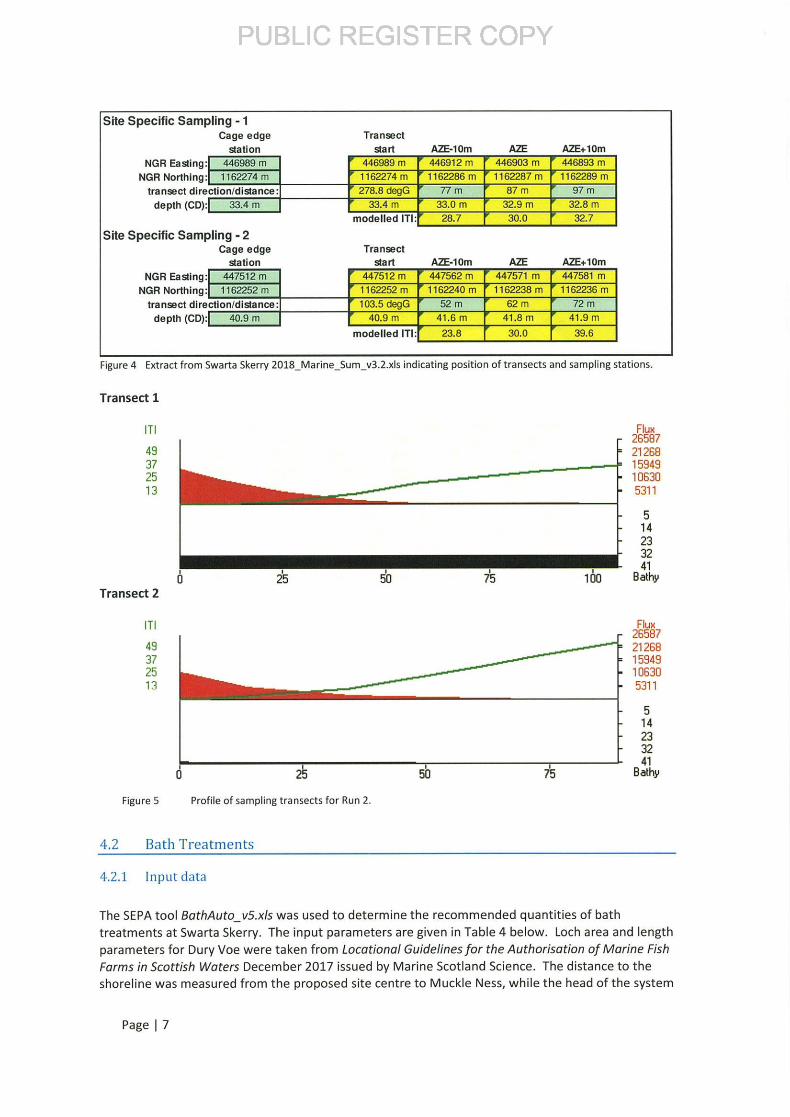
Transects have been positioned to align with the major axis of the deposition footprint ( Figures 3 &
4). The primary transect has been placed at the point where the 301TI contour is furthest from the
cage group and a secondary transect has been defined at the opposite end of the group to offer abackup position if required in the field. Profiles of each transect are illustrated below in Figure 5.
Sampling stations have been placed along each transect at the 301TI contour and at 10m on eitherside.
Page 16
Site Specific Sampling - 1
Transect 1
TI Flux
Cage edge Transect
26587
49
station start AZE- 10m AZE AZE+ 10m
NGR Fasting: 446989 m 446989 m 446912 m 446903 m 446893 m
NGR Northing: 1162274 m 1162274 m 1162286 m 1162287 m 1162289 m
transect direction/ distance: 278. 8 degG 77 m 87 m 97 m
depth ( CD): 33. 4 m 33. 4 m 33. 0 m 32. 9 m 32. 8 m
modelled ITI: 28. 7 30. 0 r 32. 7
Site Specific Sampling - 2Cage edge Transect
station start AZE- 10m AZE AZE+ 10m
NGR Fasting: 447512 m 447512 m 447562 m 44757$ m447581 m
NGR Northing: 1162252 m 1162252 m 1162240 m 116222236
mtransectdirection/ distance: 103. 5 degG 52 m 62 2
mdepthCD): 40. 9 m 40. 9 m 41. 6 m 41. 8. 9
mmodelledITI: 23. 8 30. 9. 6
Figure 4 Extract from Swarta Skerry 2018_ Marine_ Sum _v3. 2. xis indicating position of transects and sampling stations.
Transect 1
TI Flux2658749 21268
37 15949
25 10630
13 5311
5
7 14
23
32
41
0 25 50 75 100 BathyTransect2
T1261587
49 21268
37 15949
25 10630
13 5311
5
14
23
32
41
0 26 50 75 Bathy
Figure 5 Profile of sampling transects for Run 2.
4. 2 Bath Treatments
4. 2. 1 Input data
The SEPA tool BothAuto_ v5. xls was used to determine the recommended quantities of bath
treatments at Swarta Skerry. The input parameters are given in Table 4 below. Loch area and lengthparameters for Dury Voe were taken from Locational Guidelines for the Authorisation of Marine FishFarms in Scottish Waters December 2017 issued by Marine Scotland Science. The distance to theshoreline was measured from the proposed site centre to Muckle Ness, while the head of the system
Page 17
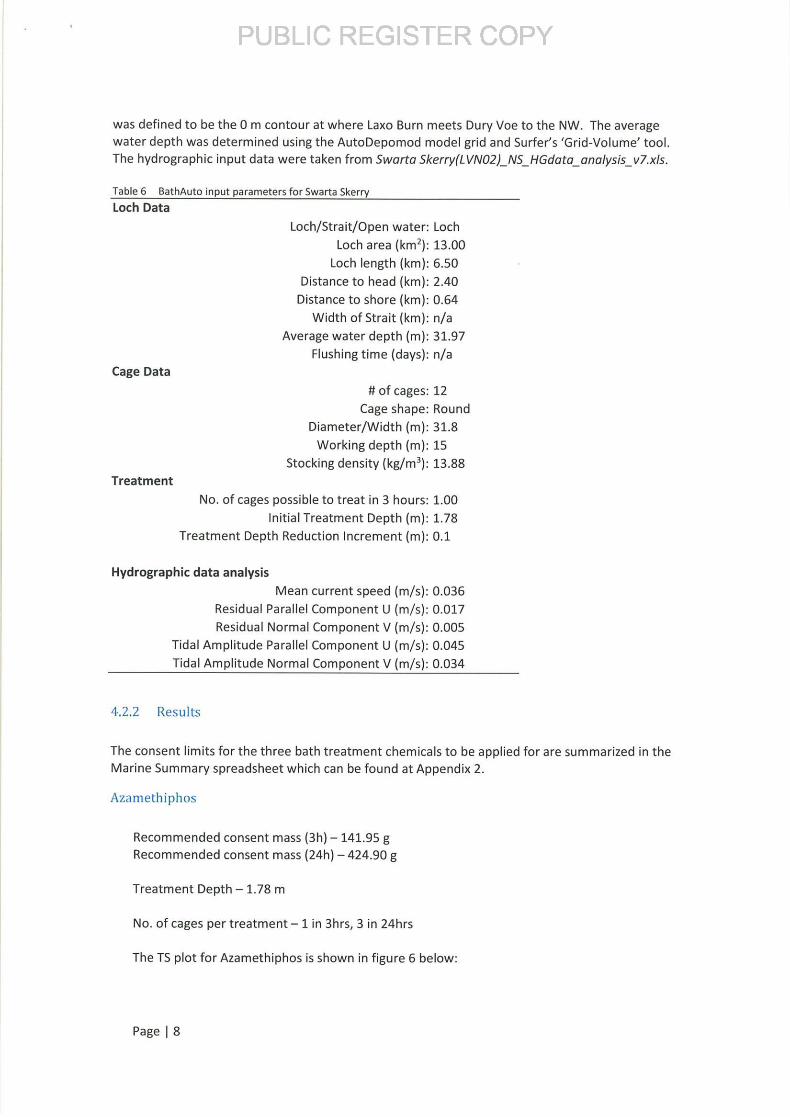
was defined to be the 0 m contour at where Laxo Burn meets Dury Voe to the NW. The averagewater depth was determined using the AutoDepomod model grid and Surfer' s ' Grid -Volume' tool. The hydrographic input data were taken from Sworta Skerry( LVN02)_ NS HGdata analysis v7.xls.
Table 6 BathAuto input parameters for Swarta Skerry
Loch Data
Cage Data
Treatment
Loch/ Strait/ Open water: Loch
Loch area ( km2): 13. 00
Loch length ( km): 6. 50
Distance to head ( km): 2. 40
Distance to shore ( km): 0. 64
Width of Strait ( km): n/ a
Average water depth ( m): 31. 97
Flushing time (days): n/ a
of cages: 12
Cage shape: Round
Diameter/ Width ( m): 31. 8
Working depth (m): 15
Stocking density ( kg/ m'): 13. 88
No. of cages possible to treat in 3 hours: 1. 00
Initial Treatment Depth ( m): 1. 78
Treatment Depth Reduction Increment ( m): 0. 1
Hydrographic data analysis
Mean current speed ( m/ s): 0.036
Residual Parallel Component U ( m/ s): 0.017
Residual Normal Component V ( m/ s): 0.005
Tidal Amplitude Parallel Component U ( m/ s): 0.045
Tidal Amplitude Normal Component V ( m/ s): 0. 034
4.2. 2 Results
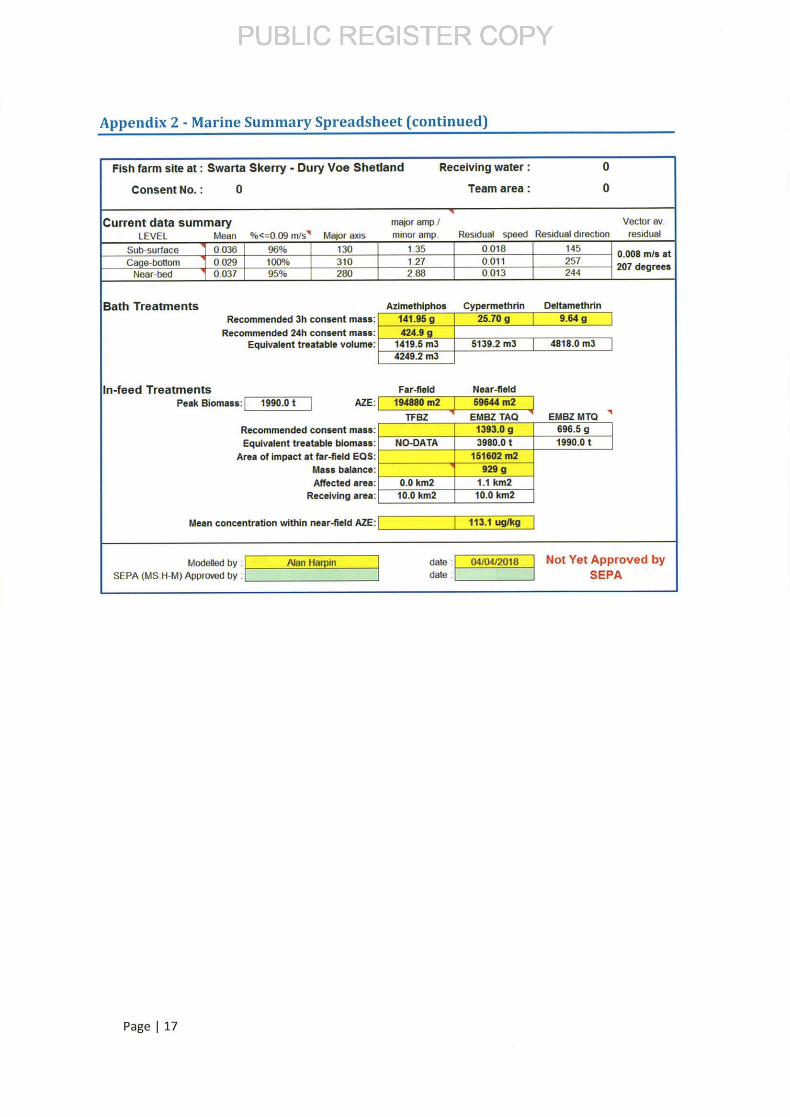
The consent limits for the three bath treatment chemicals to be applied for are summarized in the
Marine Summary spreadsheet which can be found at Appendix 2.
Azamethiphos
Recommended consent mass ( 3h) — 141. 95 g
Recommended consent mass (24h) —424.90 g
Treatment Depth — 1. 78 m
No. of cages per treatment - 1 in 3hrs, 3 in 24hrs
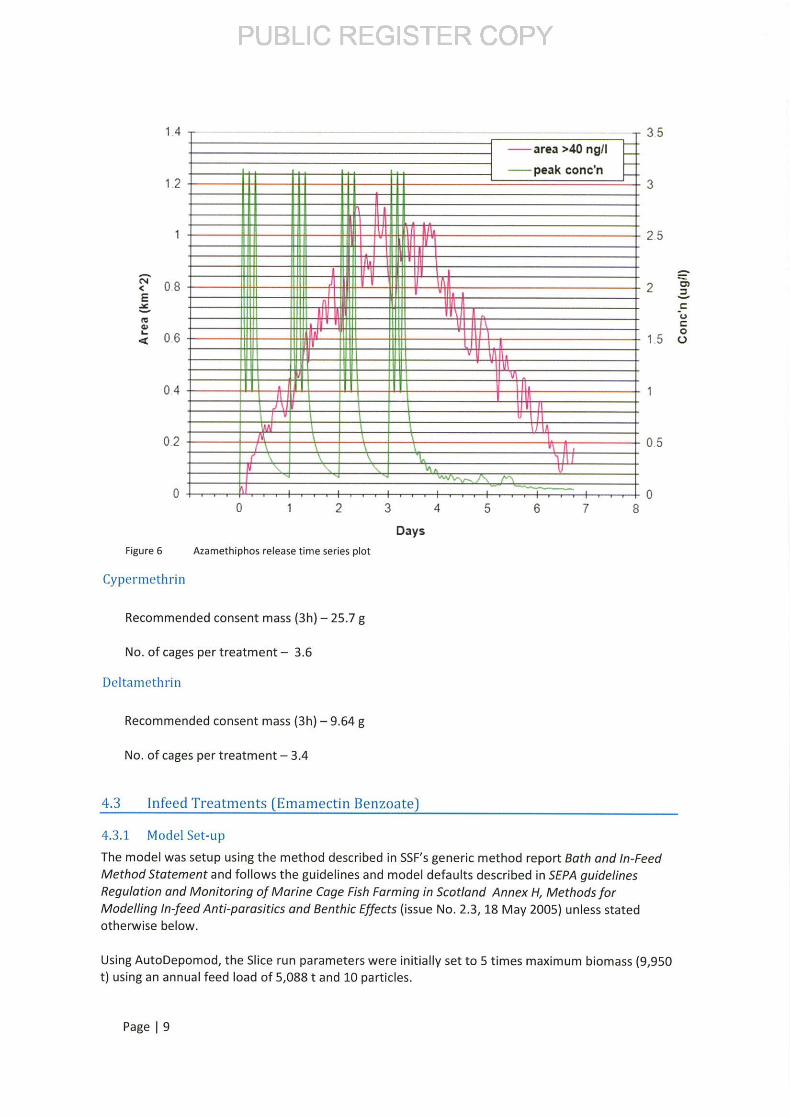
The TS plot for Azamethiphos is shown in figure 6 below:
Page 18
14
12
1
3.5
3
25
2 1=m
0. 4
0.2
0
1
05
0
0 1 2 3 4 5 6 7 8
Days
Figure 6 Azamethiphos release time series plot
Cypermethrin
Recommended consent mass ( 3h) — 25. 7 g
No. of cages per treatment— 3. 6
Deltamethrin
Recommended consent mass ( 3h) — 9. 64 g
No. of cages per treatment— 3. 4
4. 3 Infeed Treatments ( Emamectin Benzoate)
4. 3. 1 Model Set- up
The model was setup using the method described in SSF' s generic method report Bath and In -FeedMethod Statement and follows the guidelines and model defaults described in SERA guidelines
Regulation and Monitoring ofMarine Cage Fish Farming in Scotland Annex H, Methods forModelling In feed Anti -parasitics and Benthic Effects ( issue No. 2. 3, 18 May 2005) unless statedotherwise below.
Using AutoDepomod, the Slice run parameters were initially set to 5 times maximum biomass ( 9, 950t) using an annual feed load of 5, 088 t and 10 particles.
Page 19
4. 3. 2 Results
Initially modelling for Slice passes the assessment criteria with deposition at the far -field EQSstandard at 183, 026 m' ( Run 1). This is below the far -field AZE ( 194, 880 ml). As there are two cage
groups at Swarta Skerry, AutoDepomod will calculate the far -field AZE area for each group leading tothis being overestimated where the two areas overlap. Therefore, the overlap has been calculatedand accounted for in the result above.
In October 2017 SEPA released their interim position for Emamectin Benzoate ( WAT- PS- 17- 03 v1. 1)
whereby the TAQ would be restricted to 40% of that determined through modelling, or the
equivalent of two treatments at peak biomass. At Swarta Skerry this results in a recommended TotalAllowable Quantity ( TAQ) 1, 393 g for an equivalent treatable biomass of 3, 980 t (Run 2).
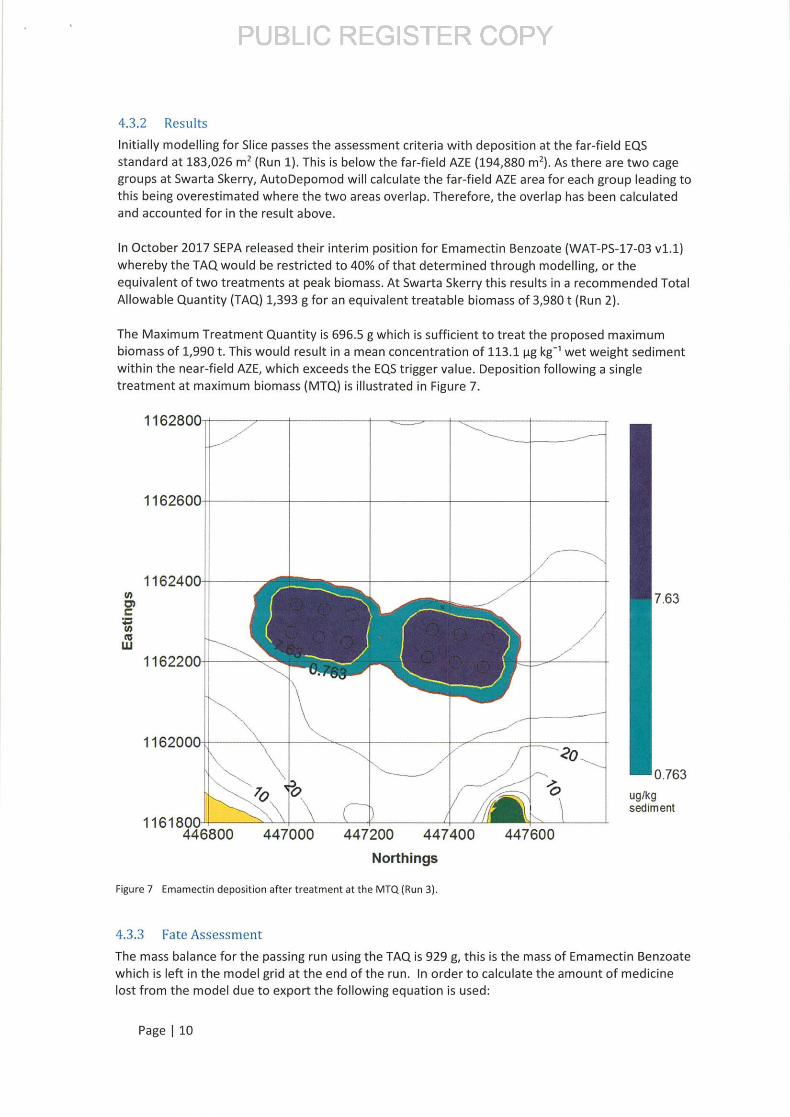
The Maximum Treatment Quantity is 696. 5 g which is sufficient to treat the proposed maximumbiomass of 1, 990 t. This would result in a mean concentration of 113. 1 pg kg-' wet weight sedimentwithin the near -field AZE, which exceeds the EQS trigger value. Deposition following a singletreatment at maximum biomass ( MTQ) is illustrated in Figure 7.
w
F
LU
fiL40Z11I6:
1162600
1162400
1162200
ifc- 2611111
1161800446800
INNEEN
k4hoki
mia0EEEAFM
447000 447200 447400 447600
Northings
Figure 7 Em mectin deposition after treatment at the MTQ ( Run 3).
4. 3. 3 Fate Assessment
7. 63
0. 763
ug/ kgsediment
The mass balance for the passing run using the TAQ is 929 g, this is the mass of Emamectin Benzoatewhich is left in the model grid at the end of the run. In order to calculate the amount of medicine
lost from the model due to export the following equation is used:
Page ) 10
Mlost- s = ( Mstart x 0. 74) - Mena
1393 x 0. 74) - 929
101. 8 g
Therefore around 7. 3 % of the medicine released is exported from the model grid. This is consistent
with the relatively low current speeds found at this site. The model shows that the majority of theSlice residue is retained within the model grid.
Using the SEPA tool Marine sum. v3. 2.xls this exported mass would require an area of 1. 1 km= to bedispersed to the far -field EQS standard, which is smaller than the available receiving area. Thelocation would be classified as restricted with headwards transport which means that the available
receiving area should be defined as half of the seabed area headwards of the site. This has beencalculated as 1. 32 kmZ at Dury Voe. Therefore the TAQ is considered to be compliant with the fateassessment criteria.
5. Discussion
The footprint of deposition predicted by the model is consistent with the bathymetry and currentdata recorded at this site. This is also reflected by the low level of export which means that material
is almost completely retained within the model grid.
Through consolidation of the existing fish farms at Loura Voe and Grunna Voe the proposed site atSwarta Skerry would be licenced to use a quantity of Emamectin Benzoate which represents 40 % ofthe total already licenced at these existing sites combined, leading to an overall reduction of theinfeed treatment into the voe. For the bath treatments Excis and Alphamax recommended consent
limits are 47 % of that licenced at the two existing sites. For Salmosan the dispersive properties ofthe near -surface currents and increased distance from the shoreline would permit a greater quantityof this treatment to be used, 1. 5 times the combined total licenced at the existing sites.
6. Conclusion
The recommended maximum biomass for Swarta Skerry is 1, 990 tonnes at a stocking density of13.88 kg/ m'.
The model output is representative of a site with low dispersive qualities with a deposition footprint
consistent with the relatively weak vector averaged residual current and uniform bathymetry of thesite.
The recommended treatment consent limits are:
Azamethiphos; 3 -hour recommended consent limit of 142.0 g and a 24-hour limit of 424.9 g. This
quantity is sufficient to treat one whole cage with a treatment depth of 1. 78 m in 3 -hours and 3cages every 24 -hours. Treatment of the whole site would take four days.
Page 111
Cypermethrin; 3 -hour recommended consent limit of 25. 7 g which is sufficient to treat a volume of5, 139 m'.
Deltamethrin - 3 -hour recommended consent limit of 9. 64 g which is sufficient to treat a volume of4,818 m'.
Emamectin Benzoate - recommended MTQ of 696. 5 g and a TAQ of 1, 393 g. The TAQ is sufficient toa treatable biomass of 3, 980 t and is determined through application of the SEPA interim policy
WAT- PS- 17- 03, limiting the TAQ to 40% of that determined through modelling.
7. References
SEPA ( 2005) Regulation and Monitoring of Marine Cage Fish Farming in Scotland Annex H, Methodsfor Modelling In feed Anti -parasitics and Benthic Effects ( issue No. 2. 3, 18 May 2005). Availableonline: http:// www. sepa. org. uk/ media/ 114787/ ffm anx h. pdf
SEPA (2005) Regulation and Monitoring of Marine Cage Fish Farming in Scotland Attachment Vlll, Site and Hydrographic Survey Requirements (issue No. 2. 7, 31 October 2008). Available online: http:// www. sepa. org.uk/ media/ 114836/ f ish- farm- m an u a I - attach ment- 8. pdf
SEPA (2017) WAT-PS-17-03: Interim position statementfor protecting the water environment untilsuch time as a direction is issued on an EQS in relation to Emamectin Benzoate in finfish farm
regulation (version 1. 1, 18 October 2017). Available online:
https:// www.sepa. org. u k/ med ia/ 299677/ wat-ps- 17- 03- finfish- farm- fi na I. pdf
Page 112
Appendix 1 - Current Meter Data Summaries
Sub - Surface
OePNIMax: 1 41. 89
W9i8) IPrassum1140.83
Mn: 39.71
1% 0. 003 mis100%
5% 0. 008 MIS Pmcomra amNe
10% 0. 012016 90% Ime.NOYa
25% 0. 020 mis me. n a4
50% 0. 030 Isoircernile anyysis 60%
m4ma4s 140 lo„ m4n4s
75% 0. 015 WS74%
90% 0. 087 Vs 70%
95% 0. 089 m/ s
93116 0. 122 m/ s 99% 0. 036. WIm
1M 0. 149mis
51% 0. 030 m/ s 50% St%
71% 0. 00.5 Ms threshold r41ue5
96% 0. 085 m/ s a%
625; 0. 036 m1s mean
30%
eor 81 A bnll5
Residual current: 0.018 m/ s at 145 20% o. n
10% Tidal
Revtlual a Iiluae0%
Longitudinal ( U) U. Utlnvs 0. 045 m/ s
Lateral ( h : 0. 034 m/ s
Anisotropyhn ' Nat' l 3.70 1. 35
blgAWlml Ylwel 1,'. mlplellWa YL arok. ....... brp. us cual d- YLmwuN — W - L
ans ,.
6A0 -..
0. 45
J, 10 it
0 Cn'
45m
4em
35m
Spm
25m
2Um
15m
Inm
len
4 4 4 4 4 4 4 4 4 4 4 4 4 4 4 4 4 < 4
Page 113
Bottom
0. 750 GMA: 3.063 ( Deg -G)
45m
4nm
ism
mm
ZSm
ZOm
10m
nm
0 04 4 < 4 0 4 4 4 4 4 4 4 4 4 4 4 4 4
Page 1 14
Max: 41. 88OaPOV
40.83
pressuretiMn39. 71
0. 003 mis
45m
4nm
ism
mm
ZSm
ZOm
10m
nm
0 04 4 < 4 0 4 4 4 4 4 4 4 4 4 4 4 4 4
Page 1 14
005% 0. 003 mis Pemmula AivNsh
r,
10% 0. 012 m/ s 90% IMeMdw
25% 0. 020 m1s mean o4
50% 0. 030 m/ sanalysis 80%
mMw eua ls4 aa4uM
75% 0. 00.5 S. 74% 74%
90% 0. 067 mIs 0%
95% 0. 089 MI5
9906 0, 122 m1s 90% 0n96. R"'.
100% 0. 14 m/ s
51% 0.030 m/ s 50% 51%
74% 0. 00.5 m/ s Ihresholtl valuesy
96% 0. 0 / s95 m 40% 162% 0. 038 mss mean
30%
Alistair U9: ms
Residual current: 0.018 m/ s at 145 20%
10% Titlal
Residual a litude0%
Longitudinal ( U): 0.017 m/ s 0. 045 m/ s
Lateral ( V) 0.034 m/ s
Animtro Ion ' Nat' l : 3.70 1 . 35
b 9lWhul WMI brg. 0 Iude b1. mMa. ........ o'. r" OM ... r... pl. wwl — W - L
45m
4nm
ism
mm
ZSm
ZOm
10m
nm
0 04 4 < 4 0 4 4 4 4 4 4 4 4 4 4 4 4 4
Page 1 14
Near Bottom
Max: 41. 89
IW94; I wpwPre . Wan: 40. 83
Mr: j 39. 71
Percentiles Current Speed
1% 0. 002 M9 100% 5% 0. 006 m/ s
10% 0. 003 ar/ s 90% u'. 0 b
PST. 0. 016 artsmyor 190--
50% 0. 031 m/ sPercentile analysis B0. 4
ns LWN2aa
75% 0. 051 Ms
90% 0. 011 ar/ s 70% 69%
95% 0.099 Ms
99% 0. 136 M8 0% 0. 031 0-,a
100% 0. 164arls
49% oar Ms 50% 49% i.
69% 1 0.095Ms threshold values
95% 0. 095 m/ s 90%
61% 0. 03] M9 f11I
30%
Motor axis I 280 - 0.060 m/s
Residual current: 0.013 MIS at 244 M%
10% Tidal
Residual am litudafL -----.
Longitudinal ( U) 0. 010m 0.060 m/s
Laleral( h : qun. 0. 021 m/ s—
Miaotro lon ' Nat'(: 1. 38 2.86
b'.. M blxal b,. mryllule I, La ail. bLnWutl — W - L
0. 20 mr9
0. 15 I' ll
0. 10 irvs
0. 05 m4
9. 00 nn:
0, 05 . s
015
45m
40n,
t5m
gum
PSm
amr
Ism
101%
5, 1
04,
4 4 4 4 4 4 4 4 4 4 4 4 4 4 4 4 4 4 4 4
Page 1 15
Appendix 2 - Marine Summary Spreadsheet
Fish farm site at : Swam Skorry - Duty VollShadand Receiving water
447511 m 1162147 m
License No.:
1 1162285 m
Flux [ l In Area [ m21
Team area
1990. 0 t 80% solids 1519. 0 10. 2 79019
Current data summary
1990. 0 lorries
major amp / Residual Residual Vector av
LEVEL Mean 0.09 m.!s` Major axis minor amp. speed direction residual
Sub -surface 0.036 96% 130 1 1.. 35 0 018 1 145
Cage - bottom 0.029100% 310 1. 27 0.017 1 2570. 008 m/ s at