8
Scottish Statistics - QTAS Presentation to the Scottish Supply Chain Forum 23 November 2010
| Date post: | 31-Mar-2015 |
| Category: |
Documents |
| Upload: | koby-trippe |
| View: | 224 times |
| Download: | 0 times |

Scottish Statistics - QTAS
Presentation to the Scottish Supply Chain Forum23 November 2010
Scottish Statistics
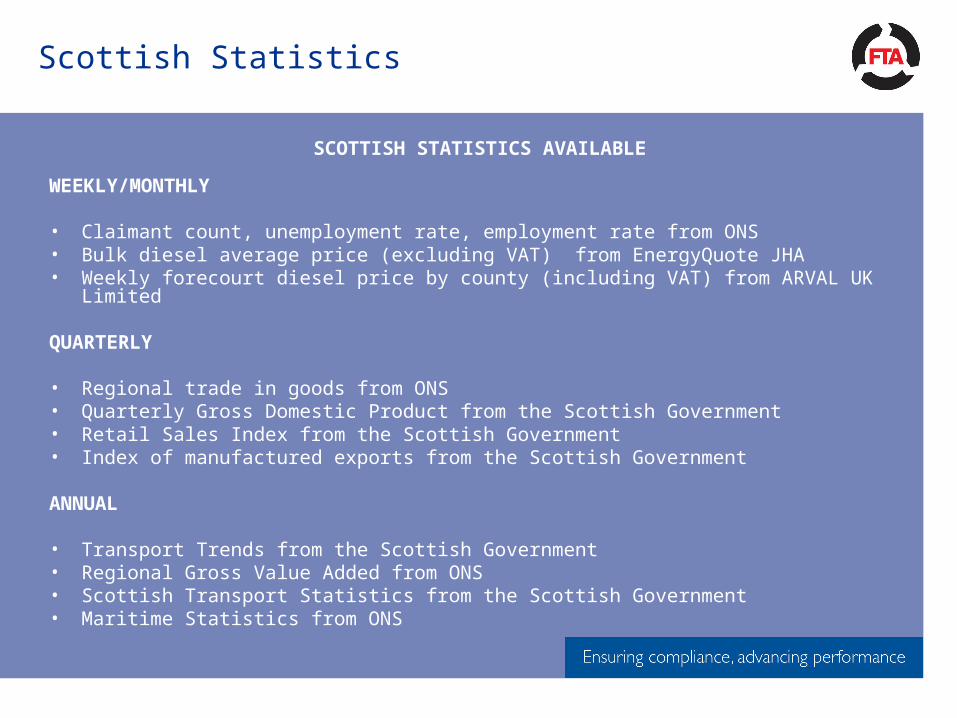
SCOTTISH STATISTICS AVAILABLE
WEEKLY/MONTHLY
• Claimant count, unemployment rate, employment rate from ONS• Bulk diesel average price (excluding VAT) from EnergyQuote JHA• Weekly forecourt diesel price by county (including VAT) from ARVAL UK Limited
QUARTERLY
• Regional trade in goods from ONS• Quarterly Gross Domestic Product from the Scottish Government• Retail Sales Index from the Scottish Government• Index of manufactured exports from the Scottish Government
ANNUAL
• Transport Trends from the Scottish Government• Regional Gross Value Added from ONS• Scottish Transport Statistics from the Scottish Government• Maritime Statistics from ONS

Scottish Statistics
SAMPLE STATISTICS
FORECOURT FUEL PRICES (INCL. VAT)Scotland UK
Week 45 – Week ending 12 November 2010 125.57 ppl 122.94 ppl
BULK DIESEL (EXCL. VAT)Scotland UK
Average price October 2010 99.41ppl 99.51 ppl
LABOUR MARKETScotland UK
Claimant count rate Oct 2010 4.9% 4.5%Unemployment rate 3 months to Sept 2010 8.5% 7.7%Employment rate 3 months to Sept 2010 70.7%
70.8%

Scottish Statistics
GDPScotland UK
Q2 2010 % change to previous quarter +1.3% +1.2%Q2 2010 % change to same quarter previous year +1.2%
+1.7%
PORTS TRAFFIC 2009Scotland UK
Inwards (thousand tonnes) 23,280 303,598Outwards (thousand tonnes) 62,299 197,264All (thousand tonnes) 85,580 500,863
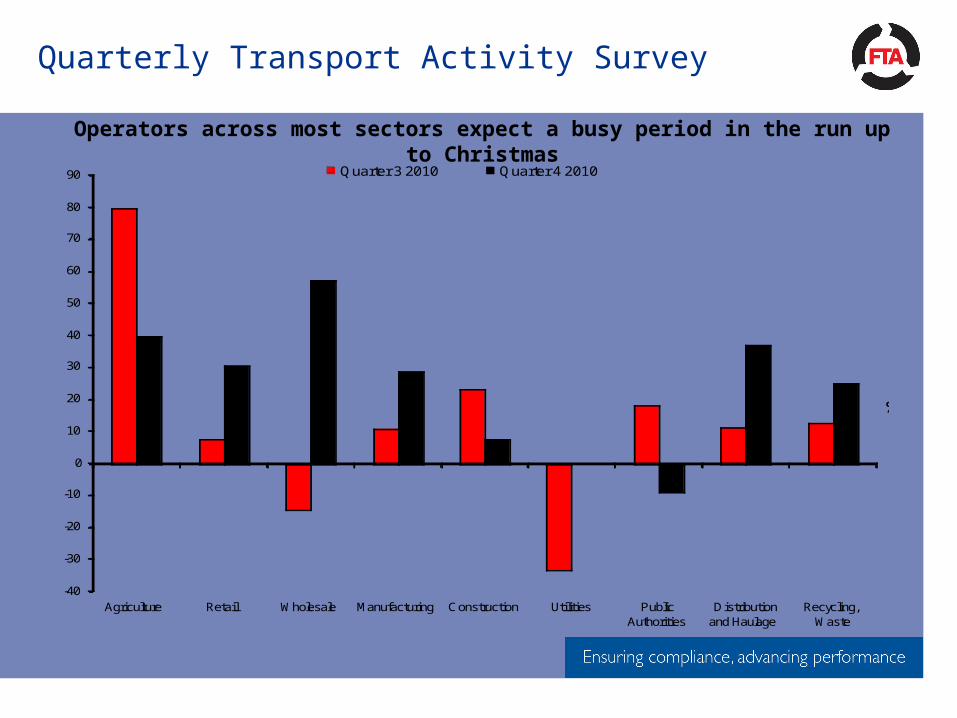
Quarterly Transport Activity Survey
-40
-30
-20
-10
0
10
20
30
40
50
60
70
80
90
Agriculture Retail Wholesale Manufacturing Construction Utilities PublicAuthorities
Distributionand Haulage
Recycling,Waste
per cent balance of respondents
Quarter 3 2010 Quarter 4 2010
% Balance of Respondents
Operators across most sectors expect a busy period in the run up to Christmas
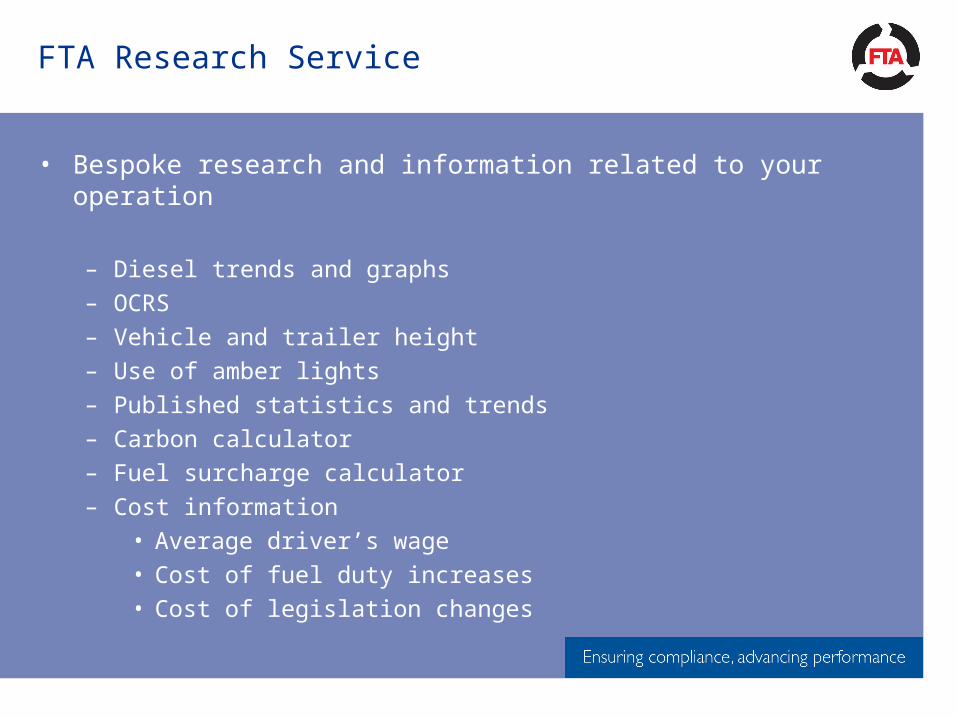
FTA Research Service
• Bespoke research and information related to your operation
– Diesel trends and graphs– OCRS– Vehicle and trailer height– Use of amber lights– Published statistics and trends– Carbon calculator– Fuel surcharge calculator– Cost information
• Average driver’s wage• Cost of fuel duty increases• Cost of legislation changes

FTA Research Team
• Bruce Goodhart – Research Analyst [email protected] 01892 552242
– Manager’s Guide to Distribution Costs– Quarterly Transport Activity Survey– Fuel Price Information– Cost information
• Mark Shergold – Research Analyst [email protected] 01892 552218
– Logistics Buyer– Benchmarking– Fuel Price information– Logistics Carbon Reduction Scheme
• Joan Cooper – Subscription Administrator [email protected] 01892 552365
• Sharon Ryan – Head of Research [email protected] 01892 552286
– Bespoke Research– All products and services

Future Direction
How would you like us to proceed with the report?
• Extra industrial sectors eg food and drink production and fisheries?
• Comparative statistics comparing Scotland and UK?• Scotland’s contribution to UK national statistics?• Particular road, rail, sea freight statistics?• Annual or quarterly report?
Logistics Industry Survey 2010/2011


