Page 1
Screening LCA of GHG emissions related to LNG as ship fuel
Julianne Mari Ryste
Marine Technology
Supervisor: Ingrid Bouwer Utne, IMTCo-supervisor: Erik Karlsson/ Martin Wold, DNV
Department of Marine Technology
Submission date: June 2012
Norwegian University of Science and Technology
Page 3
The world we created today as a result of our thinking thus far has problems which
cannot be solved by thinking the way we thought when we created them
- Albert Einstein
Page 5
Preface
This Master Thesis represents the culmination of the M.Sc. degree within the
programme of Marine Systems at the Department of Marine Technology, Norwegian
University of Science and Technology. It is written in its entirety by stud.techn.
Julianne Mari Ryste, during the spring semester of 2012.
The work succeeds the Project Thesis written in the autumn semester of 2011, which
was a literary study of the life cycle analysis method with application to LNG as ship
fuel. The goal of this report is to perform a life cycle analysis for the process of LNG
bunkering. Both the Project and Master Thesis were part of a large assignment
regarding LNG as fuel, given by DNV to NTNU.
During the Project Thesis, SimaPro was selected as the expected software to be
used for the analysis. However, due to some problems with SimaPro I had to change
software to GaBi in mid-march. This affected the time at disposal to conduct the
analysis, but luckily GaBi was relatively user-friendly, and I feel confident the model
and analysis are up to par.
The scope of the Master Thesis has been altered somewhat from the original plan in
the Project Thesis. Since the main interest in the thesis was to analyse the stages of
the LNG value chain that have not received attention thus far, the scope of the LCA
was changed to a Screening LCA (SLCA), the details of which will be described in full
within the report.
I would like to extend my gratitude to my supervisor at NTNU, Professor Ingrid
Bouwer Utne, for great advice and instruction in the thesis throughout this demanding
semester. Thank you to my supervisors at DNV for their advice and help with data
collection. Lastly, a special thanks to Katrine Strøm at DNV for providing
comprehensive information regarding the bunkering process, without which the
analysis would not have been successful.
The assignment has been a great learning experience, both in regards to LNG and
environmental solutions for the maritime industry, and within the extensive academic
field of LCA. Environmental technology is a subject scarcely addressed in the
academic programme; therefore I am grateful to have been given the opportunity to
write a thesis within this topic. I have gained insight in a field of great personal
interest; valuable knowledge which I will make good use of in the future.
Tyholt, Trondheim 10th June 2012
Julianne Mari Ryste
Page 7
vii
Executive Summary
In view of the increasingly popular climate change debate worldwide, maritime
transport is under pressure to create sustainable solutions for a cleaner future.
One of these solutions is using liquefied natural gas (LNG) as ship fuel. LNG has a
higher hydrogen-to-carbon ratio compared with oil-based fuels, which results in lower
specific CO2 emissions (kg CO2/kg fuel). Other benefits of LNG are the total
elimination of SOx emissions and particulate matter, and 85-90 % reductions in NOx
emissions. DNV has estimated a net global warming benefit of 15 % with the use of
LNG. However there is still a need to map the greenhouse gas emissions throughout
the life cycle of LNG.
This thesis is a Screening Life Cycle Assessment of LNG as fuel, with the main
objective to carry out a life cycle analysis of the process “Bunkering of LNG”.
Screening is a simplified LCA which aims at identifying the important parts of a life
cycle, or so-called hotspots. Bunkering of LNG and the bunkering facility have been
chosen as the hotspots in this analysis for their uniqueness. The processes related to
bunkering have not been analysed at this level of detail in published literature.
The LCA software GaBi Educational has been used to implement the bunkering
model and analyse the life cycle inventory results. Processes related to energy use,
manufacturing and direct emissions were included in the GaBi model.
The CML 2001 method was used to assess the Global Warming Potential (GWP).
This is the main characterisation factor of the environmental issue climate change,
which was in focus in this analysis.
The impact assessment showed that emissions related to manufacturing are the
greatest contributors to the GWP, with a total GWP of 75 917 [kg CO2-Equiv].
Energy use contributes the least, with only 0,36 ‰ of the total impact, which is
considered negligible. Direct emissions stand for 7 777 [kg CO2-Equiv] and is the
only area of the bunkering life cycle where emissions can be considerably reduced.
In fact, all direct emissions can be omitted by the use of BOG recovery strategies,
such as vapour return.
The conclusion drawn is that the emissions associated with bunkering of LNG is
perhaps not the main issue. A more pressing issue at the moment is the low fuelling
possibilities for LNG. If LNG is to become the fuel of the future, fuelling must be made
more accessible and available.
Page 9
ix
Contents
Preface ....................................................................................................................... iii
Executive Summary ................................................................................................... vii
List of Figures ............................................................................................................. xi
List of Tables .............................................................................................................. xi
Abbreviations ............................................................................................................ xiii
1 Introduction .......................................................................................................... 1
1.1 Background ................................................................................................... 1
1.2 Objectives/purpose ........................................................................................ 2
1.3 Limitations ..................................................................................................... 2
1.4 Structure of report .......................................................................................... 3
2 What is LNG ........................................................................................................ 4
2.1 Natural Gas ................................................................................................... 4
2.2 Liquefied Natural Gas .................................................................................... 5
2.3 Boil-off Gas .................................................................................................... 7
3 Screening LCA .................................................................................................... 8
3.1 LCI ................................................................................................................. 9
3.2 LCIA ............................................................................................................ 11
3.2.1 Impact categories .................................................................................. 11
3.2.2 Global Warming Potential ..................................................................... 14
4 The LNG Value Chain ....................................................................................... 15
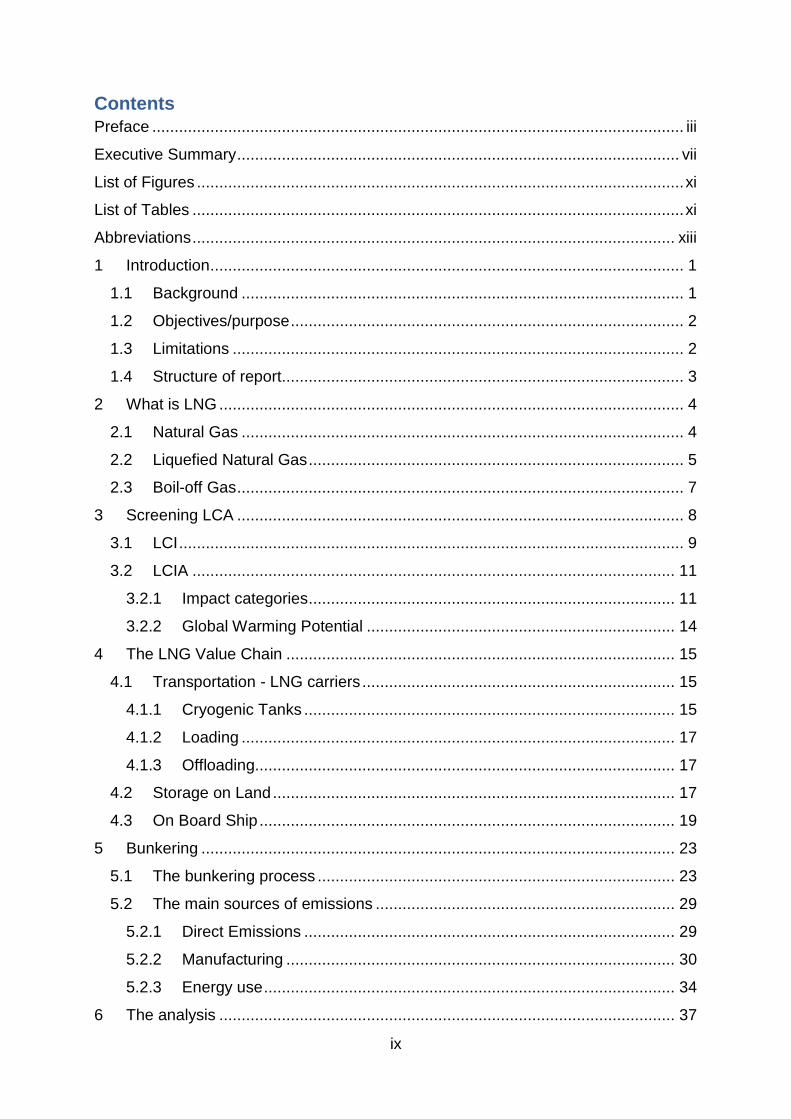
4.1 Transportation - LNG carriers ...................................................................... 15
4.1.1 Cryogenic Tanks ................................................................................... 15
4.1.2 Loading ................................................................................................. 17
4.1.3 Offloading.............................................................................................. 17
4.2 Storage on Land .......................................................................................... 17
4.3 On Board Ship ............................................................................................. 19
5 Bunkering .......................................................................................................... 23
5.1 The bunkering process ................................................................................ 23
5.2 The main sources of emissions ................................................................... 29
5.2.1 Direct Emissions ................................................................................... 29
5.2.2 Manufacturing ....................................................................................... 30
5.2.3 Energy use ............................................................................................ 34
6 The analysis ...................................................................................................... 37
Page 10
x
6.1 Goal and scope of the analysis.................................................................... 37
6.1.1 Goal ...................................................................................................... 37
6.1.2 Scope .................................................................................................... 37
6.2 The Product System .................................................................................... 38
6.2.1 System Boundaries ............................................................................... 38
6.3 Data collection ............................................................................................. 40
6.3.1 Cryogenic Equipment – Materials ......................................................... 40
6.3.2 Cryogenic Equipment – Manufacturing ................................................. 41
6.3.3 Energy use and direct emissions .......................................................... 41
6.4 GaBi Implementation ................................................................................... 43
6.4.1 Implementation of the storage and bunker facilities .............................. 44
6.4.2 Implementation of preparation and rinsing processes ........................... 48
6.4.3 Pre-cooling ............................................................................................ 49
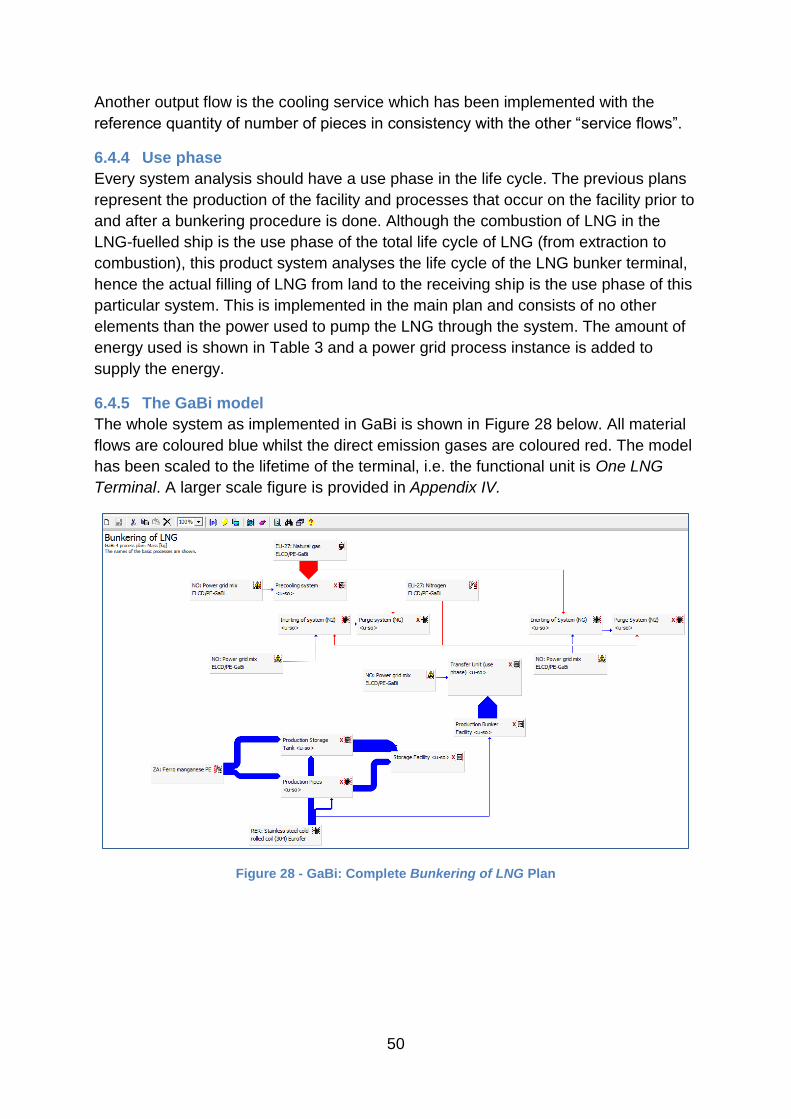
6.4.4 Use phase ............................................................................................. 50
6.4.5 The GaBi model .................................................................................... 50
6.5 Impact Assessment ..................................................................................... 51
6.5.1 CML 2001 ............................................................................................. 51
6.5.2 Global Warming Potential ..................................................................... 52
6.5.3 Sensitivity check ................................................................................... 53
7 Comparison ....................................................................................................... 55
8 Conclusion ......................................................................................................... 56
9 Further work ...................................................................................................... 57
10 References ........................................................................................................ 58
Appendix ................................................................................................................... 61
Page 11
xi
List of Figures
Figure 1- Norwegian natural gas exports by country, 2010 ........................................ 5
Figure 2 - Liquefaction process of LNG ...................................................................... 6
Figure 3 - A simple product system ............................................................................ 9
Figure 4 - Details of a Unit Process .......................................................................... 10
Figure 5 - Midpoint and endpoint categories in an environmental mechanism ......... 12
Figure 6 - An example of an environmental characterisation model ......................... 13
Figure 7 - The Global Warming Potential Integral ..................................................... 14
Figure 8 - LNG carrier with prismatic membrane containment system ..................... 16
Figure 9 - LNG carrier with the self-supporting Moss containment system ............... 16
Figure 10 - Vacuum insulated tank with vaporisers .................................................. 19
Figure 11 - Foam insulated tank with a compressor ................................................. 20
Figure 12 - Illustration of an LNG system. Illustration: Rolls Royce .......................... 21
Figure 13 - Dual fuel propulsion on a Platform Supply Vessel .................................. 21
Figure 14 – LNG bunkering unit ................................................................................ 26
Figure 15 - Vapour return system for sequential filling ............................................. 27
Figure 16 - Vapour return system for vapour recovery during fuelling ...................... 28
Figure 17 - Cylindrical LNG storage tank .................................................................. 31
Figure 18 - An example of Austenitic Stainless Steel LNG piping ............................ 32
Figure 19 - Bunker hose (Fuelling of MS Tresfjord in Trondheim) ............................ 32
Figure 20 - Frozen bunker hose without insulation ................................................... 33
Figure 21 - Cylindrical IMO Type C LNG fuel tank .................................................... 34
Figure 22 - ACD model AC-32 LNG pump................................................................ 36
Figure 23 - ACD model AC/TC 30 LNG pump .......................................................... 36
Figure 24 - The Product System for LNG Bunkering ................................................ 39
Figure 25 - GaBi: Storage Facility Plan .................................................................... 44
Figure 26 - GaBi: Data implementation for Storage tank .......................................... 46
Figure 27 - GaBi: Storage and Bunker facility Plan .................................................. 47
Figure 28 - GaBi: Complete Bunkering of LNG Plan ................................................ 50
List of Tables
Table 1 - Global Warming Potential for common Greenhouse Gases ...................... 14
Table 2 - Calculations representing the size of cryogenic equipment ....................... 41
Table 3 - Calculations of energy use from cryogenic pumps .................................... 41
Table 4 - Calculations of gas amounts (cool, inert and purge) .................................. 42
Table 5 - GaBi input and output values for cryogenic equipment ............................. 45
Table 6 - GaBi input values for cooling, inerting and purging (NG and N2) ............... 48
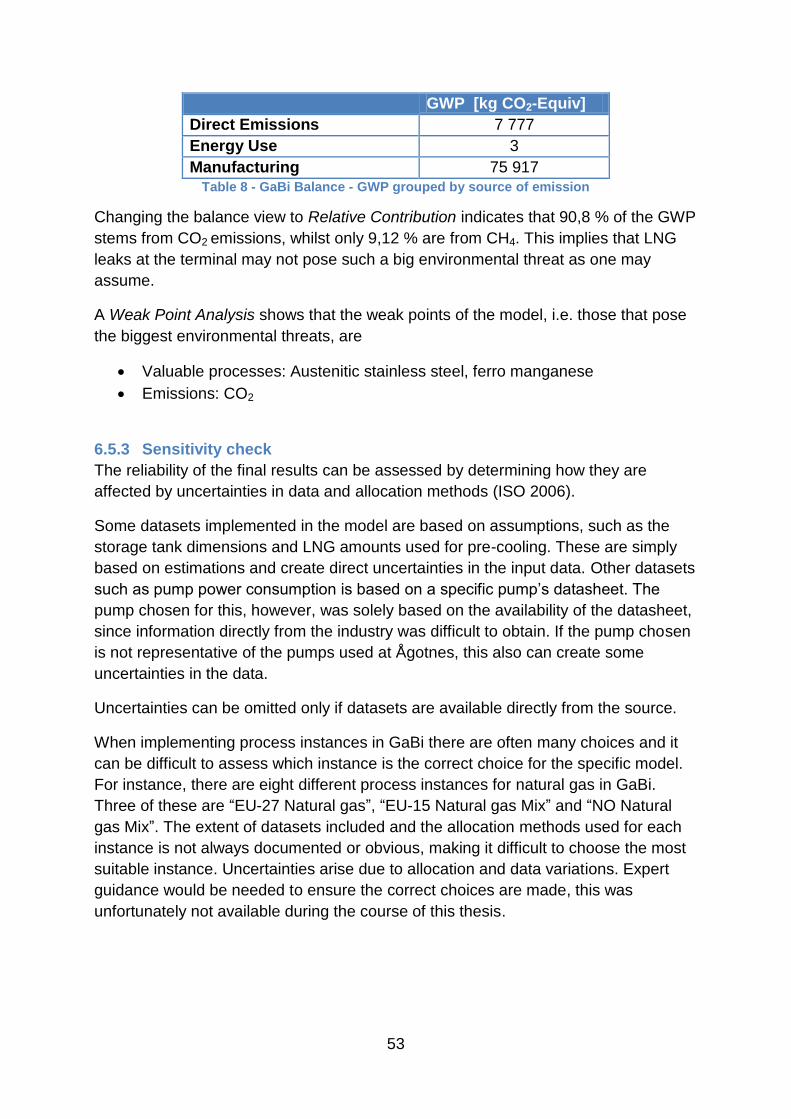
Table 7 - GaBi Balance - Global Warming Potential ................................................. 52
Table 8 - GaBi Balance - GWP grouped by source of emission ............................... 53
Page 13
xiii
Abbreviations
BOG – Boil-off gas CCB – Coast centre base CH4 – Methane CML – Centrum voor Milieuwetenschappen, Leiden University, NL CO2 – Carbon dioxide GHG – Greenhouse gas GTT – Gaztransport & Technigaz GWP – Global warming potential HFC – Hydrofluorocarbons HFO – Heavy fuel oil IMO – International Maritime Organisation IPCC – Intergovernmental panel on climate change ISO – International organisation of standardisation ITPS – Intermediary tank-to-ship via pipeline (land-to-ship) LCA – Life cycle analysis LCI – Life cycle inventory LCIA – Life cycle impact assessment LNG – Liquefied natural gas MDO – Marine diesel oil MGO – Marine gas oil MIP – Mechanically insulated pipe N2 – Nitrogen gas NG – Natural gas NOX – Nitrogen oxide OSV – Offshore supply vessel PFC – Perfluorocarbons PSV – Platform supply vessel SLCA – Screening life cycle analysis SOX – Sulphur oxide STS – Ship-to-ship (bunkering) TTS – Tank-to-ship (bunkering) VIP – Vacuum insulated pipe
Page 15
1
1 Introduction
In view of the increasingly popular climate change debate worldwide, maritime
transport is under pressure to create sustainable solutions for a cleaner future.
Although international shipping is the most energy efficient mode of mass transport
and only a modest contributor to overall carbon dioxide emissions (IMO 2011), action
must be taken to further improve energy efficiency. As sea transport continues to
grow alongside world trade, effective emission control and limitations are needed.
1.1 Background
In 2007 international shipping was estimated to have contributed about 2,7 % to the
global emissions of carbon dioxide (CO2) (IMO 2009). The Second IMO GHG Study
2009 identifies a significant potential for reduction of greenhouse gas (GHG)
emissions through technical and operational measures. The study estimates that, if
implemented, these measures could increase efficiency and reduce the emissions
rate by 25% to 75% below the current rate at which emissions are growing (IMO
2011).
One of these solutions is using Liquefied Natural Gas (LNG) as an alternative fuel in
the shipping industry. There are many documented benefits of LNG as fuel, among
them the total elimination of SOx emissions and particulate matter and 85-90 %
reduction in NOx emissions (Richardsen 2010). LNG has a higher hydrogen-to-
carbon ratio compared with oil-based fuels, which results in lower specific CO2
emissions (kg CO2/kg fuel). DNV has estimated a 15-25 % reduction of CO2
emissions with LNG. The emissions of methane (CH4) related to LNG exhaust gas,
however, reduces the net global warming benefit to a total of 15 % reduction in CO2-
equivalent emissions.
Although the numbers for LNG look promising, they are based mainly on combustion
of natural gas. The environmental performance of the fuel in a life cycle perspective
is not well documented, creating growing concerns and speculations about the actual
net benefit of LNG.
Life Cycle Analysis (LCA) is a renowned method to assess the environmental
performance at all the stages of a product or system’s lifetime. A life cycle begins
with the extraction of raw materials, to manufacturing and use of the product, through
to repair and eventually disposal.
Page 16
2
1.2 Objectives
The thesis is based on the screening life cycle assessment method. Screening
assessments aim to identify the environmental hotspots in a product’s life cycle. The
first goal is therefore to establish these in the LNG value chain, not only by
considering contributions to the environmental impact but also investigating areas of
the LNG life cycle receiving little attention thus far.
Consequently, the main objective of this thesis is to carry out a life cycle analysis of
such a hotspot, namely “Bunkering of LNG”. GaBi Educational software will be used
for this analysis, with an aim at making a model that can easily be adopted and
developed further.
The results will be interpreted with respect to the environmental issue of climate
change. Greenhouse gas emissions are therefore in focus throughout the report. The
results will thereby be compared to other marine fuels such as MDO and HFO. Some
suggestions of improvements in the bunkering cycle will be made accordingly.
Detailed and high quality data from reliable sources create good LCA results. Data
collection is therefore an important part of this thesis, the goal being to obtain as
much data as possible directly from the industry, aiming at quality datasets and
minimum need for assumptions.
Last but not least, the thesis aims to create momentum around LNG as a fuel, as well
as an interest for the subject of environmental issues within marine technology.
Although this thesis is written in cooperation with and for DNV, it will hopefully bode
for interesting reading also for fellow students, professors and others with an interest
for LNG and environmental solutions for the maritime industry.
1.3 Limitations
Data collection is an extensive, time-consuming process in any LCA. Bunkering of
LNG is such a concise, particular part of the LNG value chain making it even more
difficult to obtain reliable data. Where data is not available, estimations based on
background knowledge and possibly academic assumptions will be used.
The bunkering process is so specific that it has not been given attention in any of the
environmental studies found. In addition, LCA requires that systems under subject of
comparison are analysed using equivalent product systems. For these reasons, the
ability to compare the results for different fuels is limited.
Page 17
3
1.4 Structure of report
The first part of this thesis devotes some time to explain the important terms Natural
Gas, LNG and Boil-off Gas before focusing on the SLCA methodology, with a brief
description of Life Cycle Impact Assessment (LCIA) where the Characterisation
Factor Global Warming Potential (GWP) will receive special attention. Following this
the report will focus on the main objective, starting with a description of some stages
in the LNG value chain. The bunkering process is described in detail followed by the
system boundaries of the product system to be analysed. Data collection is shortly
explained prior to presenting the GaBi implementation and analysis. Following this
the results will be discussed before the thesis rounds off with a concluding remark
and ideas for further work.
Page 18
4
2 What is LNG
Before diving into the LNG life cycle and product system description, a short
presentation of natural gas, liquefied natural gas and boil-off gas is provided. These
terms will be used abundantly throughout the report. It is therefore sensible to
describe these to establish a foundation for better overall understanding of the
following thesis.
2.1 Natural Gas
Natural gas (NG) is a combustible mixture of hydrocarbon gases formed primarily by
methane, but also including ethane, propane, butane and pentane (NaturalGas
2010). Due to its small amount of carbon atoms compared to hydrogen atoms in the
molecule, natural gas contains far less carbon per content of energy. This makes it
one of the world’s cleanest burning fossil fuels, emitting much lower air emissions
than other fossil fuels such as oil or coal (Ryste 2011). Natural gas is also one of the
most energy efficient fuels, offering a specific heat of combustion of 54 [kJ/kg]
compared to diesel which only has 45 [kJ/kg].
This means that natural gas offers more energy and less environmentally harmful
emissions per mass than do other common fuels. It has therefore become a vital
component of the world’s energy supply and one of the most useful of all energy
sources (NaturalGas 2010). Today approximately 25% of the world's energy demand
is derived from natural gas (Linde 2012). It is widely used in industrial applications
such as production of plastics, fertilizer, anti-freeze, and fabrics, but also for
residential and commercial heating as well as cooking (NaturalGas 2010). In recent
years, natural gas has become a popular choice as a fuel for transportation, both for
trucks and buses, and now also for passenger vessels and to some extent larger
sea-going vessels.
Natural gas is often called methane or just CH4. When natural gas is utilised, it has
been dried and removed of all hydrocarbons so that it is in its purest form, methane.
This is known as consumer grade natural gas. Like many other forms of energy,
natural gas is internationally measured and expressed in British Thermal Units (Btu).
One Btu is the amount of natural gas that will produce enough energy to heat one
pound of water by one degree at normal pressure. In Norway natural gas is often
measured in [kWh] and [MJ].
Norway is the seventh largest natural gas producer in the world (Statistics Norway
2011). Norway is, however, not a big consumer of natural gas, using only around
seven % of the total natural gas produced on the Norwegian continental shelf. Most
of the natural gas is exported, mainly to The United Kingdom, Germany and France,
as Figure 1 demonstrates.
Page 19
5
Figure 1- Norwegian natural gas exports by country, 2010
2.2 Liquefied Natural Gas
There are four main ways in which gaseous fossil fuels can be retained (Gassteknikk
Ltd. 2012):
Compressed gas: Gases are compressed by pressure in suitable containers.
Examples are Compressed Natural Gas (CNG) and air.
Condensed gas: Gases that become fluid when pressurised in a container.
Examples are carbon dioxide (CO2) and Liquefied Petroleum Gases (LPG)
such as propane and butane.
Dissolved gas: Gases that are dissolved in another medium, such as
acetylene which can be dissolved in acetone under low pressures in a
pressurised container.
Cryogenic gas: Gases that are cooled to sub-zero temperatures in a specially
designed thermos. Examples are Liquefied Nitrogen (LIN), Liquefied Oxygen
(LOX) and finally Liquefied Natural Gas (LNG).
Cryogenics is the science and technology of very low temperatures; traditionally the
field of cryogenics is taken to start at temperatures below -150°C (Ursan 2011). LNG
is formed at low temperatures of -162°C and is classified as a cryogenic fluid.
Liquefied natural gas takes up about one six hundredth the volume of gaseous
natural gas, making it much easier to transport, store and use when in liquid form.
Since 1964 LNG has been transported in specially designed LNG carriers (the first
being MV Methane Princess) (Curt 2004). This made LNG much more accessible,
and it could be transported by ship to areas where pipeline transportation was
uneconomical or impossible. Since then, LNG has been the preferred form of natural
gas.
Page 20
6
Before it is liquefied, natural gas must be purified and dried to remove all components
that can interfere with the liquefaction process. First of all it is purified by removing all
carbon dioxide, mercury, hydrogen sulphide and oxygen residues, making it almost
100 % methane. The gas is then dried by removing all condensate and helium (Linde
2012). Finally the gas is cooled to approximately -162°C in stages, at normal
pressure, which results in the condensation of the gas into liquid form. The process is
shown in Figure 2 (Linde 2012). Quantities of LNG are measured in standard cubic
meters, scm or simply [m3].
Figure 2 - Liquefaction process of LNG
LNG is a clean fuel containing no sulphur; this eliminates the SOX and particulate
matter emissions. Additionally, the NOX emissions are reduced by up to 90% due to
reduced peak temperatures in the combustion process. Due to its low hydrogen-to-
carbon ratio compared with oil-based fuels, results in lower specific CO2 emissions
[kg of CO2/kg of fuel]. Unfortunately, the emissions of methane in the exhaust gas
reduces the net environmental benefit of LNG (IMO 2009).
LNG has been used as a fuel on passenger ferries and other small scale vessels in
Norway since 2000, with a fleet of 16 ferries today (Haugstad 2012). The world’s first
LNG fuelled ferry was the MF Glutra, operating along the Norwegian coast
(Skipsrevyen 2000).
LNG is now becoming a popular subject when discussing environmentally friendly
fuels also for medium to large scale vessels such as Offshore Supply Vessels (OSV)
and cargo ships. Norway is a pioneer within LNG technology, with five LNG-fuelled
OSVs in operation already and several newbuildings on the way (Haugstad 2012).
Page 21
7
2.3 Boil-off Gas
To remain a liquid, LNG must be kept refrigerated at approximately -162°C at all
times. This is done, predominantly by the use of efficient insulation in all tanks, pipes
and transfer units. There is, however, no such thing as perfect insulation, and LNG
that is kept stored over a period of time will inevitably be influenced by heat exchange
into the containment vessel. When the temperature of the fluid increases due to heat
exchange, the fluid begins to boil to maintain a constant pressure in the liquid.
However, LNG expands 600 times from liquid to gas form, meaning that BOG must
be vented out of the containment vessel to keep the volume constant. Thereby the
BOG retains the heat input and keeps the fluid at constant temperature. The resulting
phenomenon is called Auto Refrigeration and is used in all cryogenic technologies
If a substantial amount of BOG is produced, this should be recovered to avoid
emissions directly to the surroundings. Solutions for BOG recovery are explained in
chapter 4.2.
Page 22
8
3 LCA
The following will provide a brief explanation of the LCA methodology, focusing on
application to the LNG analysis. The chapter begins with a description of the
screening method, including some elements of the simplifications applied to the
analysis. Further, the elements of LCI and LCIA relevant to the product system and
interpretation of Global Warming Potential are presented.
3.1 Screening LCA
There are three basic levels of LCA (Hochschorner and Finnveden 2003)
A matrix LCA
A screening LCA
A full LCA
There are many barriers to completing a full LCA, such as inadequate data,
inaccuracy, cut-offs, estimations and limitations. All these barriers narrow the scope
and cause uncertainties and inconsistency in an analysis. A perfect LCA is in practice
impossible, and some go as far as to say that a full LCA has never been
accomplished due to the severity of these barriers (Hur, Lee et al. 2004).
Simplified versions are therefore available to examine certain environmental aspects
and characteristics of the product system, without the need to fully comply with the
LCA ISO standards.
There is not one defined recipe one can follow to carry out a simplified LCA, the
simplifications are individual to each project. Simplifications can be done in two main
ways: By reducing the scope of the study, i.e. by cutting out unit processes or
analysing only certain parts of the life cycle; Or by reducing the data requirements,
i.e. substituting with surrogates where data is not readily available (Hur, Lee et al.
2004).
The two most significant barriers are data and time availability. For these exact
reasons, the LCA in this thesis is limited to what is called a Screening Life Cycle
Assessment (SLCA).
Screening is a simplified LCA which aims at identifying the important parts of a life
cycle, or those that require attention due to data gaps or assumptions (WG
Environment 2004).
Hotspot Assessment is another name for a screening, because it intends to identify
so-called hotspots in the product life cycle which pose special interest to the
practitioner. Hotspots may be stages in the life cycle which have not previously been
analysed, or stages that present opportunities for improvement.
Page 23
9
This particular analysis has been simplified by seeking out the stages of the life cycle
that have received little or no attention and choosing a hotspot among these. Steps
that are well-documented and analysed in other studies have been excluded.
Production, purification, liquefaction and pipeline distribution and combustion are all
parts of the LNG life cycle that are well-documented, for example in the TNO-report
“Environmental aspects of using LNG as fuel” (TNO 2011). Transportation, delivery
and storage at terminal, bunkering, and storage on board were identified in the
preceding project thesis as the stages often left out of LCAs (Ryste 2011).
Bunkering of LNG and the bunkering facility are not big contributors to the total
environmental impact, but have been chosen as the hotspots in this analysis for their
uniqueness. No documentation has been found that these stages have been
analysed in any detail before. Choosing them for the screening will therefore provide
a great supplement to other life cycle studies and create a better overall picture of the
LNG life cycle.
The greenhouse gases carbon dioxide and methane are the main components of
LNG emissions. They primarily contribute to air pollution which leads to the
environmental concern of climate change. Focusing on the Impact Category global
warming potential only in the LCIA is therefore an additional simplification.
Further, the product system for Bunkering of LNG will be simplified by setting system
boundaries. This will be discussed later, but mainly consists of excluding some of the
processes and equipment due to lack of information.
3.2 LCI
Life Cycle Inventory is a compilation and quantification of the inputs and outputs that
flow through the product system. Inputs are the systems resources and are defined in
three groups; materials, energy, and intermediates. These travel through the product
system where material and energy flows are connected to produce a product or
service. The outputs are defined in the groups; product, by-product, waste,
intermediates and emissions. Figure 3 shows a simplified version of a product
system.
Figure 3 - A simple product system
Page 24
10
Each product system is based on the Unit Processes required in order for it to
perform or deliver the function or product that defines the system. Unit processes are
defined by the resources that go into it, the emissions it produces and the product it
produces. Figure 4 shows a detailed picture of what goes on in a typical unit process.
Figure 4 - Details of a Unit Process
A product system is defined by its Functional Unit (FU), the reference unit to which
input and output data are normalised. The functional unit must be consistent with the
goal and scope of the study and should be clearly defined and measurable. The FU
for bunkering will be discussed in chapter 6.4.
LCI is largely dependent on data collection to quantify the input and outputs so that
the product system can be analysed. When sufficient data is gathered, the product
system is implemented as a model in the chosen LCA software and the data values
are inserted.
When the model is finished, the software calculates a temporary inventory result, also
called a Balance. This represents the total amounts of materials and energy used by
the system and the actual emissions related. An LCA can stop here if one is only
after the amount of emissions. To further interpret the results based on environmental
impact, Life cycle impact assessment is used.
Life cycle inventory was presented in detail in the project thesis, and will therefore not
be described further here. For more information please refer to chapter 4.2 in the
project thesis (Ryste 2011).
Page 25
11
3.3 LCIA
Life cycle impact assessment is a helpful tool to interpret the LCI results. It is defined
as the phase in the LCA aimed at understanding and evaluating the magnitude and
significance of the potential environmental impacts of a product system (Pré
Consultants 2010).
LCIA models selected environmental issues, called impact categories, and uses
Category Indicators to condense and explain the LCI results. The category indicators
are intended to reflect the aggregate emissions for each impact category, and
represent the potential environmental impacts.
To do this, LCIA contains a number of Impact Assessment Methods that aim to place
the results into environmental context. Each method is based on a particular
Environmental Mechanism. The methods are distinguished by the impact categories
included in the mechanism and the characterisation factors used to calculate these
categories. The method used is chosen according to the environmental mechanism
that best suits the scope of the analysis.
There is also a broad field of assessment elements that aim to evaluate the
significance of the results and their accuracy. The elements are voluntary, chosen
individually for each project depending on the purpose of the LCA.
The scope of this analysis is to calculate the greenhouse gas emissions only. This
implies that the LCA could stop at the LCI results. Using LCIA does, however, ensure
the analysis is more complete and will make the results easier to use in relation to
other studies. The following will therefore describe some elements of the LCIA
relevant to GHGs.
3.3.1 Impact categories
An Impact category is defined as an environmental issue of concern, such as global
warming or ecotoxicity. To make sense of the LCI results they are assigned to the
relevant impact category for further interpretation.
Categories are divided into Midpoints and Endpoints, which represent each their
stage in the environmental mechanism. Choosing whether to interpret the results at
endpoint or midpoint determines which LCIA method is used.
Midpoint categories represent concrete environmental issues such as smog, human
health and climate change. In the environmental mechanism they precede the
endpoint categories which represent a concrete consequence of the environmental
issues, such as cancer and extinction of species. Figure 5 demonstrates the
environmental mechanism with examples of mid- and endpoints.
Page 26
12
Figure 5 - Midpoint and endpoint categories in an environmental mechanism
To reach a midpoint category, only a small part of the environmental mechanism
needs to be modelled, whilst indicators at endpoint level require additional steps of
modelling and interpretation. Indicators close to the inventory results are therefore
subject to lower uncertainty in interpretation perspectives than endpoints.
Each impact category is linked to the mid-/endpoints by what is called an Impact
Category Indicator. To convert the indicator to a common, understandable unit, a
Characterisation Model is used to describe the relationship between the LCI results,
the category indicators and the category endpoints. From this model a
Characterisation Factor is derived.
Characterisation factors should reflect the relative contribution of an LCI result to the
impact category. For instance, contribution of 1 kg CH4 to global warming is 25 times
higher than the emissions of 1 kg CO2. The characterisation factor of CH4 is therefore
25.
To clarify this, an example is given: The LCI results CO2 and CH4 are assigned to the
impact category Climate change which is calculated by the indicator Radiative
Forcing [W/m2]. Then the characterisation factor converts the result into global
warming potential, which is defined as the Impact Category Indicator Result [kg CO2-
Equivalent]. The indicator result represents the potential environmental impact and is
intended to reflect the aggregate emissions for each impact category.
Page 27
13
Figure 6 below depicts the steps of a characterisation model.
Figure 6 - An example of an environmental characterisation model
With regards to LNG as fuels, the most essential impact categories that reflect the
impacts of fossil fuel are climate change, acidification and eutrophication, toxic
effects on humans and ecosystems, and depletion of resources. As mentioned in the
previous the scope of this thesis is limited to greenhouse gas emissions.
The biggest environmental concern associated with GHG emissions is climate
change. Although climate change has a wide range of consequences, such as rising
sea levels, extreme weather, changes to agriculture and human health issues,
assessing these are not of particular interest to this analysis. A midpoint-
interpretation of climate change is therefore sufficient.
Consequently this analysis will be a Problem-Oriented LCA (problem- and damage-
oriented approaches are described in the project thesis, chapter 4.3.3 (Ryste 2011).
The CML 2001 assessment method is a problem-oriented model which is well-suited
for the analysis. The method will be described in chapter 6.5.1.
As described in the previous the characterisation factor related to climate change is
global warming potential. GWP will therefore be described in detail in the following.
Page 28
14
3.3.2 Global Warming Potential
Global warming potential is a simplified index based on radiative properties, used to
estimate the potential future impact on a climate system due to different gas
emissions, also known as the carbon footprint.
The Climate Change report from IPCC describes the GWP thoroughly (IPCC 2007):
The global warming potential is a well-established and well-defined physical metric
that compares the integrated radiative forcing of two greenhouse gases over some
chosen time period resulting from pulse emissions of an equal mass. Radiative
forcing itself is a fundamental physical parameter that quantifies a primary way in
which human activity causes climate to change.
The IPCC has created a characterisation model for GWP for 20, 50 and 100 year
perspectives. The numerical value of the GWP can change significantly with the
choice of time horizon. The Kyoto Protocol is, for instance, based on the GWP with a
100 year time horizon.
The GWP is defined as the ratio of the time-integrated radiative forcing from the
instantaneous release of 1 kg of a trace substance relative to that of 1 kg of a
reference gas (IPCC 2001). The equation in Figure 7 below demonstrates this.
Figure 7 - The Global Warming Potential Integral
The GWPs of various greenhouse gases can then be easily compared to determine
which will cause the greatest integrated radiative forcing over the time horizon of
interest. Table 1 below lists the global warming potentials of some of the common
greenhouse gases (IPCC 2001).
Species Chemical formula GWP100
Carbon dioxide CO2 1
Methane CH4 25
Nitrous oxide N2O 298
HFCs - 124 – 14 800
Sulphur hexafluoride SF6 22 800
PFCs - 7 390 – 12 200 Table 1 - Global Warming Potential for common Greenhouse Gases
Page 29
15
4 The LNG Value Chain
Bunkering of LNG has already been identified as the process of most interest to the
analysis in this thesis. Nevertheless other stages of the LNG chain should be
documented, not least to create a holistic account and provide better understanding
of the whole life cycle of LNG as a ship fuel.
In the preceding project thesis, five stages of the value chain were highlighted as
areas of interest for the following analysis (Ryste 2011). This chapter will present
these in more detail. The hotspot of the analysis, bunkering of LNG, will be presented
in-depth in chapter 5, along with descriptions of the equipment used both on land at
the terminal, and on board an LNG fuelled vessel, as well as all emissions associated
with bunkering.
4.1 Transportation - LNG carriers
LNG has since 1964 been transported by LNG carriers in specially designed tanks
with insulated walls, where LNG is kept in liquid form by the concept of auto
refrigeration which was described in chapter 2.3. The resulting boil-off gas is vented
out of the storage tank and used as fuel for propulsion, or to generate electricity on
board the vessel.
LNG is a cryogenic fluid. All containment and transfer equipment for cryogenics must
be made to withstand the low temperature, and should be insulated to keep the LNG
refrigerated. Containment tanks must also be designed to take higher pressures so
as to be able to contain the LNG without creating vapour (if the pressure is kept
constant, the LNG will not boil, as explained prior).
4.1.1 Cryogenic Tanks
There are two main types of containment systems for LNG carriers: Membrane and
Self-supporting. These are designed by the two main tank designers Gaztransport &
Technigaz (GTT) and Moss Maritime, respectively. Membrane tanks from GTT are
usually of prismatic shape, directly supported by the inner hull. Figure 8 illustrates the
GTT system, showing that the whole tank is integrated inside the ship hull (GTT
2009).
Page 30
16
Figure 8 - LNG carrier with prismatic membrane containment system
The Moss spherical self-supporting tank claims to be the safest and most reliable
LNG containment system on the market. Moss LNG tanks do not form a part of the
ship’s hull strength and are not affected by possible damage to the ship’s hull (Moss
Maritime 2012). This eliminates the need for a full secondary barrier between the
tank and hull, such as membrane tanks do. LNG carriers with the MOSS system are
recognisable by the tanks protruding from the hull as Figure 9 (NWS 2011) below
illustrates.
Figure 9 - LNG carrier with the self-supporting Moss containment system
Page 31
17
Most LNG carriers have four to six tanks, placed along the centre line of the hull. The
tanks are typically manufactured from aluminium or stainless steel, with tank volumes
ranging from 147-270 000 [m3]. The Moss spherical tank weighs approximately 800
[tonnes] (NWS 2011). Membrane tanks are insulated with polyurethane foam in two
layers (GTT 2009), whilst Moss tanks are insulated with polyurethane purged with
nitrogen in a single layer (NWS 2011).
4.1.2 Loading
The following description of the preparations for LNG loading is provided by
(Liquefied Gas Carriers 2011).
Before loading, tanks are inerted with nitrogen or carbon dioxide to remove the tanks
of oxygen. This is to avoid the risk of having an explosive atmosphere in the tanks.
Inert gas must then be displaced to avoid formation of water condensate. This is
done by blowing a small amount of warmed up LNG through the tanks, sending the
inert gas to shore in pipelines where it is burnt to avoid venting of methane gas to the
atmosphere.
Tanks must then be cooled down to create the appropriate conditions for cryogenic
LNG. This is done by spraying small amounts of cold LNG onto the tank walls via
spray nozzles placed on the top of each tank. This slowly cools down the tanks to at
least -140°C, a process which takes up to 36 hours. Loading can then begin. Excess
gas created during loading is sent to shore by high duty compressors, where it is re-
liquefied or burnt at a flare stack.
Loading of LNG carriers has a sequence similar to LNG bunkering, which is
described in detail in chapter 5.1.
4.1.3 Offloading
Presuming that most LNG is kept refrigerated throughout the voyage without
significant temperature rise (by use of auto refrigeration), offloading at the LNG
terminal will not be time-consuming. The LNG terminal will have an inerted receiving
system with precooled hoses and storage tanks, ready for loading.
4.2 Storage on Land
At LNG terminals, LNG is stored in large cryogenic tanks under strict regulations of
observation and maintenance. The tanks are equipped with excellent insulation to
keep the LNG refrigerated. However, no insulation is perfect. Depending on the
length of time the LNG is stored before use, some heat exchange may occur.
Referring to chapter 2.3, heat exchange leads to the production of BOG.
Page 32
18
The Norwegian Standard for Installation and equipment for liquefied natural gas (NS
2007) states that:
Provisions should be taken during design and operation to ensure that potential gas
waste streams, wherever practically possible, are recovered and not routed to flare or
vent during the normal operation of the plant.
There is however no standard practice that applies for all LNG facilities of how this
boil-off is handled, but there are some known alternatives:
1. Use a pressurised vapour return line to send the boil-off back to the storage
tank
2. Use a re-liquefaction plant to re-liquefy the gas before it is returned to the LNG
tank
3. Use the boil-off to create electricity
4. Vent the BOG to the air
The choice of alternatives depends strongly on the amount of BOG created. If there
is little BOG, the environmental gain of using either a re-liquefaction unit or an
electricity generator will be lost in the production of these large units, as well as the
units being highly cost-inefficient.
The only LNG storage tanks to produce enough BOG for this to be energy and cost-
efficient, are at large LNG liquefaction plants and LNG export terminals (Wold 2012).
At LNG terminals such as Ågotnes, LNG is constantly used, and the storage tanks
are so small that they require continuous re-filling. The time in storage is therefore so
short that little BOG is produced (the time the tank can hold LNG without venting
BOG is called “holding time”. By codes in US and Canada the holding time is five
days (Ursan 2011)). Also, using boil-off to produce electricity is a fairly undeveloped
idea in Norway, and these two alternatives are therefore unlikely to be used at
Norwegian terminals.
Venting the boil-off to the air is the most unwanted alternative; however this is likely
to be the standard procedure at some terminals. Using a vapour return line is the
most cost-efficient and environmentally sound alternative.
Page 33
19
4.3 On Board Ship
The final stage of the LNG value chain is the on board process and combustion in the
engine, also called the Use stage of the entire life cycle. Once LNG has entered the
fuel tank and engine room, Gas Detection and Emergency Shut Down systems make
sure the LNG is monitored and safe at all times. Pipes are not required to be double-
walled due to this extensive monitoring.
LNG is kept in the bunker tank until it is needed in the engine room. From the bunker
tanks, the LNG is sent through a vaporiser and heated up before it is sent through to
the engine. No pumps are needed to transfer LNG; this is done by differential
pressure. Any boil-off that occurs during storage is sent directly to the engine (Strøm
2012).
The amount of emissions caused in the use stage depends largely on the type of
engine used, the type of vessel and its operational profile. If one wishes to be very
thorough in analysing this stage, the type of LNG fuel system, as well as the
equipment used in the LNG engine, also matters. For example, insulation in the
bunker tank can either be foam or vacuum, since vacuum is not a material, this
choice directly affects the amount of emissions.
Two LNG fuel systems are shown below to demonstrate the alternatives. The first
(Figure 10, (Harperscheidt 2011)) is a system using a vacuum insulated tank with
vaporisers. The Tank Vaporiser extracts LNG from the tank and sends gas into the
top of the tank to keep the pressure under control. The LNG Vaporiser converts the
liquid to gas form before it is sent to the heater. Thus the gas is sent directly to the
engine at the correct temperature and pressure. The system uses differential
pressure to transfer the gas, eliminating the need for transfer pumps.
Figure 10 - Vacuum insulated tank with vaporisers
Page 34
20
The second example (Figure 11, (Harperscheidt 2011)) is a fuel gas system with a
compressor. This means that the tank is foam insulated rather than vacuum
insulated, and therefore produces some amount of BOG. This can be sent directly to
the engine as mentioned earlier, and the pressure in the tank is thereby controlled by
venting. Because of this, the LNG must be sent through a compressor to increase its
pressure, before it can enter the engine room.
Figure 11 - Foam insulated tank with a compressor
A complete LNG system is illustrated in Figure 12. The two tanks each have a
capacity of 250 [m3], serving the two LNG engines on board this vessel, the Island
Crusader. Typically, LNG fuelled offshore vessels are also equipped with diesel
engines so they can operate both on LNG and on diesel. This is to ensure an
operation is not affected by low LNG availability (due to few bunkering stations). In
addition, diesel electric propulsion offers higher propeller efficiencies than with LNG
at low engine loads (Æsøy, Einang et al. 2011). The Island Crusader has two
auxiliary diesel engines included in its engine system for these purposes.
Page 35
21
Figure 12 - Illustration of an LNG system. Illustration: Rolls Royce
Some vessels have a dual-fuel system, which allows the vessel to run on both diesel
and LNG intermittently without the need of two separate engine systems. Figure 13
(Æsøy, Einang et al. 2011) is an example of a diesel-electric system for a dual-fuel
engine on an offshore supply vessel fuelled by LNG and MDO.
Figure 13 - Dual fuel propulsion on a Platform Supply Vessel
Two examples of engines used in such systems are the Rolls Royce Bergen B35:40
gas engine (Rolls Royce 2009), and the Wärtsilä 34DF dual-fuel engine (Wärtsilä
2012). Rolls Royce gas engines have a fuel oil consumption of 33 g/kWh less than a
general diesel engine (Haack 2011). However, some engines have unfortunately
proven to produce a methane slip. Some say most engines have been updated and
no longer have this problem; however documentation to prove this has been hard to
come by.
Page 36
22
If this stage is to be analysed in detail, the greatest emission sources apart from the
combustion, are due to energy used to vaporise and heat up the LNG, as well as
potential compressors to pressurise the gas.
For more information about rules and regulations regarding gas fuelled engines,
please refer to DNV’s rules for classification (DNV 2011).
Page 37
23
5 Bunkering
LNG can be transferred to LNG fuelled vessels using three main methods. The two
most widely used are land-to-ship, known as Intermediary Tank-to-Ship via Pipeline
(ITPS), and Truck-to-Ship (TTS). The third option is Ship-to-Ship (STS) bunkering
which takes place between a bunker vessel and a receiving vessel, possible both in
ports and at sea. However, for LNG bunkering, this is a concept under development
and is currently being tested by the “Joint Industry Project” lead by the Swedish
Marine Technology Forum (Swedish MT Forum, Linde Cryo AB et al. 2010). TTS
bunkering is often used for small scale LNG vessels such as passenger ferries, and
can be done at any port where a nitrogen battery and inert line for the inerting
process is provided.
The most common bunkering process for a typical offshore supply vessel at this time
is ITPS, and is the bunkering option chosen for the analysis in this thesis. For this
bunkering option, LNG is provided via a pipeline from an intermediary storage tank at
the terminal. Not all LNG terminals are suitable for ITPS bunkering, due to berth
restrictions and pipeline distances, which affects LNG fuelling availability.
Using LNG as fuel in supply vessels is a fairly new development, and even though
Norway is the most developed in Europe within LNG terminals (42 in total,
(ÅF&SSPA 2011)), only five terminals offer bunkering services for vessels of
medium/large scale (Strøm 2012). This bodes for some difficulties when trying to
make LNG available to a broader selection of ships, and to gain market value for
using LNG as a fuel.
5.1 The bunkering process
Bunkering from land is a fairly extensive procedure which starts before the receiving
vessel arrives at the terminal. All on-land activities start while the ship is approaching
the terminal and during docking. When the system has been precooled and the
vessel has docked, the two bunkering facilities (both on shore and on board) must be
connected safely and then rinsed and prepared for the transfer. The same rinsing
procedures must also be done after bunkering is finished, and finally the bunkering
systems can be disconnected and the vessel is ready to go.
Page 38
24
All the processes involved in bunkering are listed below, along with a more detailed
description in the following.
Pre-cooling of system – 45 minutes
Pre-cooling of cargo pumps – 16 minutes
Connect hose-system - 5 minutes
Prepare (rinse) system
o Inerting (N2) – 5 minutes
o Purging (NG blows out N2) – 2 minutes
Open valves
Transfer – 120 minutes
Empty (rinse)system
o Stripping – 4 minutes
o Inerting (NG) – 5 minutes
o Purging (N2 blows out NG) – 4 minutes
Close valves
Disconnect
The following descriptions are based on standard procedures at the CCB LNG
Terminal at Ågotnes outside Bergen. Details have been provided by Katrine Strøm at
DNV (Strøm 2012).
Precooling of system
Between bunkering operations, the whole on-land LNG system returns to
atmospheric conditions. To ensure that the LNG transferred to the receiving vessel is
of the right temperature and pressure, the system must be cooled down prior to
commencing transferral. If the pumps and hoses are not pre-cooled, the high
temperature difference can lead to rapid phase transition and a high pressure build
up in the piping system. This can lead to burst valves (Bjøndal 2012), and in the
worst case scenario, to cavitation in the system (Strøm 2012). On-land pre-cooling
takes approximately 45 minutes and is operated by pumps, requiring the use of an
energy source.
Cooling is done by pumping LNG through the system in a loop. During this process,
the LNG looping the system gets warmed up, contributing to a temperature rise in the
storage tank. The LNG reacts to this temperature increase by creating boil-off gas
(BOG) which leads to increased pressure in the tank. In some cases, this creates a
substantial amount of BOG, and only by venting this BOG the LNG is restored to its
normal conditions (the principle is called auto refrigeration, as described in chapter
2.3). A major concern here is that venting is done directly to air, as witnessed at the
CCB terminal Ågotnes (Wold 2012). The standard procedure for BOG recovery is not
known, but some options for BOG handling were discussed in chapter 4.2.
Page 39
25
Pre-cooling of cargo pumps
When the receiving vessel has docked, the vessel’s cargo pumps must also be
cooled. This is the same process as described above, using LNG residues in the
ships bunker tank. The whole operation takes approximately 16 minutes.
Grounding and connection
Before the bunkering preparations can begin, the on shore and on board systems
must be securely connected, and the pipes and hoses grounded. This procedure
takes approximately 5 minutes and is done manually.
Inerting of system
Bunkering of LNG in a safe manner according to the regulations requires some steps
of preparation of the system. To ensure there is no risk of explosion, moisture and
oxygen is removed from the pipes and hoses by injecting nitrogen gas (N2) into the
system. This ensures there is not an explosive atmosphere in the tanks and pipes.
The process takes five minutes, and requires the use of an energy source.
Purging of system
After inerting, the system is contaminated with nitrogen. Some engines are sensitive
to N2 and so standard procedure is to rinse the system of any nitrogen residues at
this point. The process is called purging, and takes approximately two minutes. At
most terminals purging is done by injecting natural gas into the system to blow out
the nitrogen. This is then vented directly to air through a gas mast, resulting in the
direct emissions of natural gas and nitrogen (Strøm 2012). Although nitrogen does
not pose a great threat to the environment, natural gas certainly does. The operation
requires an energy source, as well as contributing to direct emissions.
Transfer
The system has now been cautiously prepared, and the filling process can
commence. The process simply requires a pump to send the LNG through the
system. The time to complete this operation of course depends on how much LNG is
to be transferred. As a reference value, the MS Viking Energy has an Aga Cryo LNG
tank with an operational capacity of 220 [m3] (Eidesvik Shipping AS 2007). The
typical transfer rate during ITPS bunkering is 100 [m3/h]. In comparison, TTS
bunkering has a transfer rate of [50 m3/h], and a large LNG carrier has a transfer rate
up to 1000 [m3/h] during loading. For the example above, the filling process will take
approximately 130 minutes, but the average filling process takes 120 minutes (Strøm
2012). An LNG fuel tank shall not be filled with more than 95 % of the tank’s volume.
Page 40
26
Figure 14 – LNG bunkering unit
Figure 14 (Gassteknikk Ltd. 2012) depicts an automatic transfer unit equipped with a
remotely controlled bunker-hose arm. The purple pipes are the LNG terminal pipes
from the storage tank. Mounted to the arm is the flexible bunkering hose.
Differential Pressure between the land system and on board system can, in theory,
push the LNG through the system without the need of pumps. The ability to do this
throughout the whole filling process depends largely on the magnitude of differential
pressure and the time available. If pressure build-up is low, the transfer rate also
decreases. Most bunkering operations are on a time schedule, and without the
pumps to adjust and control the transfer rate, this method is seldom used. Moreover,
some on board tanks are “low pressure tanks” which do not create the differential
pressure required to do this, the same goes for excessively long pipes.
During filling the pressure in the receiving tank will be continuously increasing, and a
pressure build up can occur. To control this, the process called Sequential Filling is
used, by which cold LNG is sprayed into the tank at the top, whilst also being
pumped into the tank at the bottom. This causes condensation in the tank which
thereby reduces the pressure. This is also known as vapour collapse, and the system
is depicted in Figure 15 (Ursan 2011). There is therefore no production of BOG
during filling.
Page 41
27
Figure 15 - Vapour return system for sequential filling
However, in some cases where sequential filling is not used, or it does not control the
pressure correctly, some vapour will be produced, which can potentially lead to
methane emissions. To avoid this, the vapour can be processed in two ways:
1. Many LNG terminals use a vapour return system, which securely re-routes the
vapour back to the storage tank through a vapour return line. Due to increased
pressure in the return line, the vapour is restored to its liquid state before
entering the tank. Figure 16 (Ursan 2011) depicts a vapour return system. No
venting is necessary, but this does however require an energy source such as
a pump.
2. If a vapour return system is not available, an alternative is to vent vapour
directly to the air. However this can have a substantial negative impact on the
environment due to the high methane content, and should be avoided at all
costs.
Page 42
28
Figure 16 - Vapour return system for vapour recovery during fuelling
Stripping of the system
When the tank is fully bunkered, the pipes and hoses need to be emptied for LNG
before they are restored to stand-still mode. Stripping allows the remaining LNG to be
sent back to the storage or bunker tank by use of the pressure difference; When the
valves on each side of the transfer line are closed, a pressure build up occurs due to
rapid phase transition and heating (LNG expands approximately 600 volume units
from liquid phase to gas phase) (Strøm 2012). This forces the LNG back to the
respective tanks, without the need of external pressure. The procedure takes
approximately four minutes, and does not contribute to any emissions.
Inerting of system
To ensure all residual of LNG is removed from the system, the pipes and hoses are
once again inerted. This time warm natural gas is injected through the system (Strøm
2012) to restore the system to its atmospheric temperature (opposite of the inerting
that happens prior to filling). As before, the process takes five minutes and requires
an energy source.
Purging of system
As with the inerting process, purging after filling is also opposite to prior. Now,
nitrogen is injected into the system to blow out the remains of natural gas. As before,
this is vented directly to air, posing an environmental impact. The process takes
approximately four minutes and requires an energy source. To avoid confusion, the
inerting and purging process that takes place before bunkering will be referred to as
“preparation” whilst what takes place after bunkering is referred to as “rinsing”.
Page 43
29
Disconnect hoses
Now that the system has been completely rinsed, and the LNG fuelled ship is fully
tanked, the transfer hoses can be disconnected safely. The whole bunkering process
all together takes an average of three hours.
In literature, the term bunker tank is commonly referred to as the tank supplying the
bunker (LNG), and storage tank refers to the tank receiving the LNG. In this paper,
the term bunker tank refers to the tank receiving LNG on board the LNG fuelled
vessel, whilst storage tank refers to the on-land tank providing the LNG for the
transfer operation. Take care not to get these two confused.
5.2 The main sources of emissions
In order to correctly implement the product system for the bunkering process in the
LCA software, GaBi, and ensure good results, all the sources of emissions should be
determined and evaluated. Relative to the whole LNG value chain, the bunkering
process contributes only a small amount to the environmental impact of LNG’s life
cycle. Therefore some of the sources of emissions in this stage can and should be
left out.
As a result, the system boundaries of the product system will be clearly defined, and
the goal of this chapter is to come to a final conclusion about the product system to
be analysed.
Emissions are the total amount of environmental stressors emitted: Direct and
indirect emissions. The direct emissions in this case are those in the exhaust gas
when burning natural gas and any gas leaks and venting that may occur in the
product system. Indirect emissions are such as those coming from processing,
production and transport (Ryste 2011).
5.2.1 Direct Emissions
There are three processes in which direct emissions occur in the bunkering stage.
These are all during venting of gas to the atmosphere:
During pre-cooling of the system, BOG is vented to the air (see chapter 5.1)
During preparation of the system, inerting and purging leads to venting of
natural gas and nitrogen
As does rinsing the system after bunkering is finished
Page 44
30
5.2.2 Manufacturing
Manufacturing of the equipment used in the bunkering process also contributes to life
cycle emissions. This thesis will focus on analysing only the special cryogenic
equipment associated with the terminal and bunkering. Other manufacturing
elements that potentially could be included are pumps, valves, machines and
electrical equipment used in the process. These have however been deemed too
specific for this purpose and will not be included in the analysis. The equipment
included is:
LNG storage tank at the LNG terminal
Piping from the storage tank to the bunkering facility at the dock
Bunkering hose
LNG fuel tank on board the ship
Many bunkering facilities use a vapour return system, which requires a vapour return
line in addition to the bunkering hose. However vapour is not a cryogenic and does
therefore not have the same requirements for containment, and is therefore not
included.
Cryogenic fluids require equipment manufactured with double-piping/-walls and
insulation, and must withstand cryogenic temperatures. This is the main difference
between a normal fuel tank/pipe and bunker hose, and cryogenic tanks and hoses.
This indicates that manufacturing of this equipment requires almost double the
amount of steel, harder steels as well as a good insulating material over normal fuel
tank/pipe and bunkering equipment.
Additionally, LNG takes up roughly twice the volume of fuel oil for the same energy
content due to its low density (Harperscheidt 2011). This means that the fuel tank
either has to be bigger or the vessels have to bunker more frequently. Since LNG
bunkering has poor availability, this problem is compensated for by using bigger
bunker tanks, often double the size of a diesel fuel tank. Since more steel is needed,
the emissions during production will be higher.
Page 45
31
5.2.2.1 LNG Storage tank
Information about LNG bunkering terminal storage tanks is deficient, however Figure
17 (from a video of LNG bunkering at Ågotnes posted on the DNV blog “LNG –
Energy of the Future” (Blikom 2011)) shows a cylindrical storage tank. It has a
capacity of 500 [m3], and is estimated to be approximately 15 [m] long.
Figure 17 - Cylindrical LNG storage tank
This tank looks similar to the cylindrical IMO type C tank as described by
(Harperscheidt 2011), shown in Figure 17. The inner tank is usually made of
Austenitic Stainless Steel because of its excellent low-temperature characteristics
and stable quality (Osaka Gas 2012). Outer tanks do not have the same
requirements to withstand cryogenic temperatures, so Carbon Alloys are used (see
chapter 6.3.1). Some LNG tanks also have a concrete outer wall to increase
insulation effectiveness. However tanks of the dimension as shown above are too
small to require this.
Cryogenic equipment often requires insulation to keep the LNG refrigerated. There
are many types of insulation available, such as perlite, polyurethane foam, spray
foam and gels. A newer development that is becoming increasingly popular is
vacuum insulation (PHPK Technologies 2008). The annular space between the inner
and outer pipe is vacuumed and sealed to create a static vacuum which will last
throughout the products lifetime. This vacuum nearly eliminates the convective heat
transfer into the LNG containment system and makes this system thermally efficient
(Bonn 2004).
5.2.2.2 LNG piping
As with most equipment handling cryogenic liquids, the LNG piping also requires
double piping and insulation.
As with the storage tanks, austenitic stainless steel is used for LNG piping, along with
carbon alloys for outer piping. Depending on the length of the pipes, bent piping may
be required to absorb thermal contraction (Osaka Gas 2012). Figure 18 below
depicts stainless steel bent LNG piping.
Page 46
32
Figure 18 - An example of Austenitic Stainless Steel LNG piping
For piping, the choice of whether to use vacuum (VIP) or mechanical insulation (MIP)
depends on the length of the pipe. For pipes longer than 200 [m] it is economical to
use VIP, but for those shorter, MIP is preferred (Bonn 2004). The pipes at Ågotnes
are approximately 300[m] long, it is assumed VIP is used.
5.2.2.3 Bunker hose
An LNG bunker hoses main requirement is flexibility. It is therefore a single-piped
hose without insulation. To strengthen the hose it contains an outer layer of steel
braid. Flexibility requirements put greater demands on the material used, the
manufacturing method and maintenance due to requirements of enhanced resistance
to fatigue and tension loads, as well as the ability to bend. Even so, the common
material for bunker hoses is, as for tanks and pipes, austenitic stainless steel.
Figure 19 - Bunker hose (Fuelling of MS Tresfjord in Trondheim)
Figure 19 shows a bunker hose of this type, here used during TTS bunkering of MS
Tresfjord at Trondheim harbour, Pir 1.
Page 47
33
Since the bunker hose lacks insulation, the cryogenic fluid freezes the equipment
during bunkering and the hose eventually looks like Figure 20 below. This may affect
the temperature of the LNG entering the bunker tank.
Figure 20 - Frozen bunker hose without insulation
5.2.2.4 Fuel Tank
There are three main types of self-supporting fuel tanks as defined in the IMO IGC
Code1
Type A – designed as a ship structure
Type B – prismatic or spherical design
Type C – designed as a cylindrical pressure vessel
Type C tank is the only one that can control the pressure in the tank itself, without the
requirement of pressure maintenance as the other two. Also, type A and B do not
have secondary barriers to the surroundings. Therefore the type C is the widely
preferred tank (IMO 1996). Figure 21 shows a cylindrical IMO type C fuel tank
(Harperscheidt 2011).
1 International Code for the Construction and Equipment of Ships Carrying Liquefied Gases in Bulk
Page 48
34
Figure 21 - Cylindrical IMO Type C LNG fuel tank
As mentioned earlier, cryogenic equipment is usually made of austenitic stainless
steel and carbon alloys, this also holds for bunker tanks.
LNG fuel tanks are roughly double the size of a regular diesel tank since LNG takes
up roughly twice the volume of fuel oil for the same energy content. This puts
restrictions and additional requirements to the placement of the fuel tank on board
the ship. One alternative currently being evaluated is placing the bunker tanks below
the accommodation unit if the vessel (Blikom 2011).
Many fuel tanks are vacuum insulated, however this is limited to cylindrical shapes
and does not allow for in-tank inspections or mounting of in-tank equipment since
there is no manhole. Therefore vacuum insulation is normally only used in small
tanks. Tanks that exceed 500 [m2], or that are of bi-lobe or conical shape, require
other insulation such as foam or special insulation panels (Harperscheidt 2011).
Supply vessel fuel tanks seldom exceed 500 [m2], and therefore vacuum insulation is
opted for in this analysis.
5.2.3 Energy use
A most interesting part of this analysis is the energy use throughout the bunkering
process. LNG bunkering requires substantially more preparation and maintenance of
the system than for other fuels. Almost all these activities require power, which leads
to the question whether the energy use is substantially higher than for diesel
bunkering. In addition, the filling process takes longer with LNG due to the need to fill
double the amount of fuel (refer to chapter 5.2.2). This can potentially increase life
cycle emissions a great deal.
Page 49
35
Stages where a power source is needed are:
Pre-cooling of the system
Preparation
o Inerting
o Purging
Filling sequence
Rinsing
o Inerting
o Purging
Storage
Most of these energy consumers are cryogenic pumps, as described in the following.
5.2.3.1 Pumps
To pump the LNG around the on-land system and on board the LNG vessel, two
separate pumping systems are used: one connected to the on-land LNG terminal,
and one at the LNG filling station connected to the vessel. It is assumed that the on-
land pump is used in all cooling, inerting and purging processes, whilst the transfer-
pump is solely used for the actual filling. ACD, a world leading supplier of cryogenic
pumps, provides useful information about their pumps online.
Two of their pumps have therefore been chosen to represent the pumps used at
Ågotnes. The two chosen are presented in Figure 22 and 23, and described below,
(ACD 2012).
AC-32: A seal-less pump for LNG filling and fuel loading with a maximum
rating of 19 [kW]
AC/TC.30: A close-coupled centrifugal pump for liquid storage transfer with a
maximum rating of 75 [kW].
Page 50
36
Figure 22 - ACD model AC-32 LNG pump
Figure 23 - ACD model AC/TC 30 LNG pump
Page 51
37
6 The analysis
6.1 Goal and scope of the analysis
Before a GaBi analysis of the LCI can begin the goal and scope of the analysis shall
be clearly stated and should be consistent with the intended application.
6.1.1 Goal
In the preceding chapters it has become clear that the process of most interest in the
context of this analysis is the process of LNG bunkering. Research of countless life
cycle studies has found that no analyses exist of this stage. It is therefore intriguing
and poses a suitable hotspot for the screening analysis. Three areas draw attention
to this hotspot:
1. Cryogenic fluids place strict requirements on the equipment, such as material
strength and resistance to withstand cryogenic temperatures. Does
manufacturing of this special equipment and the amounts of steel needed
contribute substantially to the total environmental impact?
2. Bunkering of LNG is an extensive process requiring many steps of preparation
and maintenance both before and after fuelling. This implies high energy use
at the LNG terminal, how much does this affect the emissions?
3. Preparations at the terminal contribute to direct emissions of ventilated LNG.
How does this affect the global warming potential?
The goal of the analysis is therefore to answer these three questions and supply
sound results that can be added to life cycle studies where this step has been left
out.
The results of the analysis have potential to highlight the problem areas regarding
emissions. This can bring attention to the areas in the life cycle in need of emission
reduction solutions. These will be discussed and possible solutions or suggestions to
the problem will be evaluated.
6.1.2 Scope
The scope of the analysis has been simplified to a screening analysis as explained in
chapter 3.2. The assessment is limited to a midpoint-evaluation of greenhouse gas
emissions which will be interpreted in a problem-oriented perspective. The CML 2001
method will be used to evaluate the global warming potential of the resulting
emissions.
Page 52
38
Although LNG has been used in ferries since 2000, it is not yet widely used in
offshore supply vessels. To create momentum around LNG as a fuel, more ocean-
faring vessels need to switch to LNG. The analysis is therefore aimed at OSVs.
Eidesvik and their ships MS Viking Energy and MS Viking Queen will be used as
references.
The scope of the model to be implemented in GaBi is described in the following
chapter.
6.2 The Product System
Now that all the operations and processes of LNG bunkering have been meticulously
described and defined, it is time to set the system boundaries for the product system
to be implemented in GaBi.
6.2.1 System Boundaries
Considering each system’s relative contribution to the environmental impact it has
been concluded that the on-land systems are of the most interest to the analysis. The
on-board systems (bunker tank and cargo pumps) are of much smaller dimensions,
thus contribute less to the overall emissions. Additionally, environmental analyses of
LNG combustion are likely to include these steps, meaning they are better
documented than the systems at the terminal.
The GaBi analysis therefore focuses on the manufacturing of the on-land terminal
facilities, the direct emissions related to the bunkering process and the energy use
throughout the system. The treatment of BOG at the LNG terminal during stand-still
periods has also been left out of the analysis, as well as the energy associated with
normal operation of the terminal. This is mainly due to the low availability of data at
such a high level of detail.
Regarding the use of insulation in cryogenic equipment it has been decided that due
to the increasing use of vacuum insulation, this will be used in the GaBi analysis. The
only insulation flow available in GaBi is glass fibre composites, which does not meet
the requirements of cryo-insulation. Since a user-defined flow for insulation would be
difficult to implement, this is left out. Vacuum insulation also reduces manufacturing
emissions since the production of an actual insulation material is taken out of the
balance.
Page 53
39
Depending on the extent of data included in the predefined flows in GaBi, some other
processes will naturally be left out of the product system. For example, not all flows
include data about extraction of resources for the production of steel, or the
processes related to nitrogen production. This will be discussed further in the next
chapter.
Figure 24 below depicts the complete product system that will be implemented in
GaBi. The red arrows represent direct emissions of gases. The blocked blue arrows
represent material flows and finally the through-blue arrows represent the energy use
throughout the bunkering procedure.
Figure 24 - The Product System for LNG Bunkering
Page 54
40
6.3 Data collection
Before implementation in GaBi some datasets need to be established. It should be
mentioned that data at this extreme level of detail is very to challenging obtain.
Although the goal was to collect as much data as possible from the industry, this has
been a difficult and tedious task. The data that could not be gathered by has
therefore been subject to assumptions. These assumptions are based on advice and
suggestions from professionals, as well as information found during research at the
library and on the internet. Some data is based on ISO standards.
Data quality can cause uncertainties, which may lead to misleading results. However,
as the objectives of this thesis state, the goal is to make a model that can be used by
others and potentially developed further. This is to ensure a user-friendly design so
that data can easily be replaced in the GaBi-model should more detailed or reliable
data be gathered.
The following will describe where data has been collected and how amounts and
sizes have been calculated. The resulting datasets are subsequently listed. The units
used to present the datasets are due to the way in which they have been calculated.
In some cases, GaBi will require a different unit is used to insert the values. Unit
conversions are dealt with in chapter 6.4, where the GaBi implementation is
described.
6.3.1 Cryogenic Equipment – Materials
The equipment to be implemented in GaBi is all the critical, cryogenic equipment:
Piping at the LNG terminal (inner and outer pipes)
Storage tank at the terminal (inner and outer tank)
Flexible bunker hose (single piped with braid)
According to Annex A of the ISO 21020 standard for cryogenic vessels, inner jackets
of all vessels, valves and flexible hoses are typically made of Austenitic stainless
steel (ISO 2004). This is a chromium- and nickel-based steel alloy with excellent
corrosion resistance and high tensile and creep strength, which makes it ideal for
cryogenic temperatures. The outer jackets of vessels and pipes are commonly made
of low carbon alloy steels, with manganese being the most common alloy element.
See Appendix II for a summary of ISO 21010 Annex A.
Page 55
41
6.3.2 Cryogenic Equipment – Manufacturing
Manufacturing emissions should be included to make the analysis more
comprehensive, and GaBi does this effortlessly. The difficult part, however, is
gathering information about the size of the equipment and the amounts of steel
required to manufacture them.
When attending an excursion to oversee TTS-bunkering of LNG (in cooperation with
an LNG course by Gassteknikk in Trondheim (Gassteknikk Ltd. 2012)) the diameters
and lengths of a typical bunker hose and LNG piping was collected. The dimensions
of the storage tank have been calculated based on the tank at CCB Ågotnes which
has a capacity of 500 [m3].
Steel plate thickness has been estimated based on information found during
research (AK Steel 2007). All equipment has been assumed to be of cylindrical
shape. Table 2 lists the resulting values representing the size of the cryogenic
equipment. The rightmost column “Size [m3]” refers to the magnitude of steel the
equipment is composed of.
Equipment Diameter [m]
Length [m] Thickness [m]
Size [m3]
Cryogenic piping Inner pipe 0,13 300 0,003 0,19
Outer pipe 0,2 300 0,006 0,57
Cryogenic Storage Tank
Inner tank 7,98 10 0,006 0,75
Outer wall 8,25 10 0,006 0,78
Cryogenic Transfer Hose
Single piped
0,13 10 0,003 0,006
Table 2 - Calculations representing the size of cryogenic equipment
6.3.3 Energy use and direct emissions
The pumps used both during preparation and LNG transfer, were described in
chapter 5.2.3.1. There the power of the pump used during pre-cooling, inerting and
purging was stated at 75 [kW]. During filling the pump used has a power of 19 [kW].
Together with the time used for each process (as listed in chapter 5.1), the energy
use [kWh] is calculated, as Table 3 depicts.
Process [kW] Time [h] [kWh]
Pre-cooling 75 0,75 56,25
Inerting of system (N2) 75 0,08 6,25
Purging (NG) 75 0,03 2,50
Filling (transfer) 19 2,00 38
Inerting of system (NG) 75 0,08 6,25
Purging (N2) 75 0,07 5,00
Table 3 - Calculations of energy use from cryogenic pumps
Page 56
42
The direct emissions of natural gas and nitrogen gas associated with the product
system occur during pre-cooling, inerting and purging of the system. The transfer rate
of the system can be used as a basis for calculation of the amounts of NG and N2
used for these activities.
The pumps have a transfer rate of 100 [m3/h]. However it is unlikely the pumps are
used at full utility during these processes, so a rate of 50 [m3/h] is chosen for these
purposes. The resulting amounts are shown in Table 4.
Process Substance Time [h] Amount [m3]
Pre-cooling LNG 0,75 37,50
Inerting (N2) Nitrogen 0,08 4,17
Purging (NG) Natural Gas 0,03 1,67
Inerting (NG) Natural Gas 0,08 4,17
Purging (N2) Nitrogen 0,07 3,33
Table 4 - Calculations of gas amounts (cool, inert and purge)
Page 57
43
6.4 GaBi Implementation
The starting point to an analysis in GaBi is creating a Plan. Each plan represents a
life cycle or process stage of the product system to be analysed, and is defined as
the working space. The bunkering system as described in the previous is divided into
5 plans which all will be nested onto a main plan before balancing the system:
Storage Facility – Manufacturing of on-land equipment (Piping and storage
tank)
Bunker Facility – Manufacturing of transfer-equipment (Bunker hose)
Preparation for bunkering – Inert and Purge (Nitrogen and Natural Gas)
Rinsing after bunkering – Inert and Purge (Natural Gas and Nitrogen)
Bunkering of LNG – The main plan on which the “use phase” of the product
system is implemented, and onto which the other plans will be nested.
The Balance is GaBi’s name for the LCI results, which is carried out once all plans
are nested and processes connected. This will be described in greater detail later on.
In each plan there are three main elements: Processes, Process Instances and
Flows. A process is often a user-defined element which describes a single unit
process such as “Inerting system with N2”, defined by its unique input and output
flows. A process instance is connected to the process by means of a material flow,
and may be referred to as the source. For example “Nitrogen” is a process instance
that will be connected to “Inerting system with N2” and represents the production of
nitrogen. Flows are the actual materials and gases that flow through the system, from
one process instance to one or more processes. They represent the input and output
of each process, and are the basis for the emissions in each product system.
Throughout the implementation of the specific product system, it is essential to use
as many predefined flows and process instances as possible. This ensures a
standard quality of the inputs and outputs, and reduces uncertainty. The two
databases predominantly used by GaBi Educational are Ecoinvent (EI 99) and the
GaBi’s own GaBi database. The data within each of these databases is individually
collected and updated. The sources, data quality and level of detail by which the data
is collected, will therefore differ between the two. For this reason it is recommended
to use the GaBi database wherever this is possible (Skaar 2012), since it is the more
comprehensive database within the software. It is also favourable to use the same
database throughout the analysis to ensure a uniform data set and quality.
Where predefined processes are lacking, these can easily be created specifically for
the system. Since the system being analysed in this thesis is very unique, there are
not many predefined processes that coincide with the unit processes of LNG
bunkering. This means that most of the processes are created by the user, and
defined by the flows from the GaBi database. The main flows in this particular system
are power, natural gas, nitrogen, LNG and BOG, as well as the material inputs for the
cryogenic manufacturing processes, mainly steel. These flows are standard and are
therefore likely to be found in the database.
Page 58
44
Creating a user-defined flow, however, is not recommended since one would have to
implement the exact composition of the flow in the correct physical state, a
meticulous process which is difficult to carry out correctly (Skaar 2012).
6.4.1 Implementation of the storage and bunker facilities
When a plan for each of the facilities is made, process elements are created
manually for each unit process such as “Production Storage Tank”. It is possible to
add a substantial amount of information about each process, but the results are only
affected by the input and output flows implemented in them so this has not been
prioritised here. An example of such a plan is shown in Figure 25.
Figure 25 - GaBi: Storage Facility Plan
Within each process, the associated flows of steel are chosen. GaBi requires that
flows of metal parts are implemented using the unit [kg]. The values related to the
cryogenic equipment are therefore converted from amounts of steel [m3] to mass of
finished product. This is done by using the values in Table 2 along with the density of
the steels. The resulting input and output values are shown in Table 5 below.
These are implemented as the output flows. It is safe to say that some amount of the
steel used to produce the metals parts go to scrap. However it is difficult to estimate
the percentage of this scrap, and it is therefore uncertain the input of steel used to
manufacture the cryogenic equipment. An assumption of 10 % has been added to
the input flow to each of the unit processes.
Page 59
45
This also requires that the amount of scrap is specified in GaBi as an output, which is
done by implementing the pre-defined flow “Steel scrap” (for waste recovery). This
automatically is included in the balance.
Equipment Material Density [kg/m3]
Input [kg]
Output [kg]
Cryogenic piping
Inner pipe Austenitic Stainless
8 030 1 658,7 1 492,8
Outer pipe Low Carbon Alloy
7 850 5 006,3 4 505,7
Cryogenic Storage Tank
Inner tank Austenitic Stainless
8 030 6 711,9 6 040,7
Outer wall Low Carbon Alloy
7 850 6 783,4 6 105,1
Cryogenic Transfer Hose
Single piped
Austenitic Stainless
8 030 55,3 49,8
Table 5 - GaBi input and output values for cryogenic equipment
The output of each of these unit processes is the terminal pipes, storage tank and
bunker hose respectively. These are not flows that can be found in the GaBi
database. User-defined flows must therefore be created; since they are simply metal
parts, the flow-definition does not require detailed datasets. The flows “Cryogenic
Pipes”, “Cryogenic Tank” and “Bunker Hose” are therefore created, defined as “Metal
Parts” in the Flow-Hierarchy. For each user-defined flow, the reference quantity must
also be defined. Since these flows are defined as metal parts, the reference quantity
is automatically set to mass [kg]. They can also be cross-referenced to other
quantities, for example “number of pieces”. This is done in the implementation where,
for instance, 1 kg of bunker hose is cross-referenced to 1/49,8 [piece of hose].
Page 60
46
The flows represent the output connection to the next step, only dependant on the
amount of steel each part consists of. An example of the input and output
implementation is shown in Figure 26.
Figure 26 - GaBi: Data implementation for Storage tank
As you can see the output is a cryogenic tank weighing 12 146 [kg], the combined
weight of the inner and outer tank. This is an assumption made for simplicity’s sake;
of course the actual tank will weigh a little more than the inner and outer tank only,
since more equipment is connected to the tank, such as valves, bolts, paint, and not
least the insulation used. The elements included here do, however, represent the
largest contributors to the emissions, which in a project with this scope is detail
enough.
Now the plans can be nested onto the “Bunkering of LNG” plan, and the processes
connected. The process instance of each material used must be added to the plan in
order for the emissions connected to these to be included in the analysis.
Page 61
47
As described in chapter 6.3.1 the two main steels used for production of the
cryogenic equipment included in this analysis is austenitic stainless steel and low
carbon alloy steel.
There are two types of austenitic steel in GaBi, type 304 and 306. Type 304 is the
most common of austenitic grades (SPP 2011) and is the material of choice in
cryogenic systems (Marquardt, Le et al. 2000). Of the austenitic type 304 steels in
GaBi the “Stainless steel cold-rolled coil” (Europe) is chosen for the analysis. It
contains 18 % chromium and 10 % nickel, which coincides with the ISO 21010
regulations. The process instance includes a dataset based on average values of
cradle-to-gate data, collected from different European steel producers, including
power grid mix. Stainless steels are manufactured from mixtures of steel scraps, and
the mining process is therefore not included in the dataset.
Of the carbon steels in the GaBi database only one is specified to be low-carbon,
namely the “Ferro Manganese” from South Africa, containing 90 % manganese. The
process instance includes data from the ore mining process, ore beneficiation, power
grid mix and the thermal energy used to produce the finished carbon steel.
With this information, material flows are connected to the unit processes “Production
Storage Tank”, “Production Pipes” and “Production Bunker Facility” as depicted in
Figure 27 below. Please see the Appendix III for details regarding the calculations
and methods used in this chapter.
Figure 27 - GaBi: Storage and Bunker facility Plan
Page 62
48
6.4.2 Implementation of preparation and rinsing processes
Plans and processes for these two stages are implemented the same way as
described in the previous. The amount of nitrogen and natural gas used in each of
the unit processes is given in Table 4 but GaBi requires that these are implemented
in [kg] as opposed to [m3]. The density of natural gas (0,8 [kg/m3]) and nitrogen
(1,165 [kg/m3]) are used to convert the values. Table 6 lists the resulting input and
output flows implemented in GaBi.
Process Substance Amount [m3] Amount [kg]
Pre-cooling LNG 37,5 16 891,9
Inerting (N2) Nitrogen 4,2 4,9
Purging (NG) Natural Gas 1,7 1,3
Inerting (NG) Natural Gas 4,2 3,3
Purging (N2) Nitrogen 3,3 3,9
Table 6 - GaBi input values for cooling, inerting and purging (NG and N2)
The process of stripping the system, as described in chapter 5.1 does not require any
energy, and does not contribute to any emissions. For this reason it has been left out
of the GaBi analysis.
The plans are now nested on to the main plan where the process instance for natural
gas and nitrogen are added. The chosen instance for natural gas is a “European gas
mix (EU-27)” from the GaBi database which includes comprehensive datasets for the
whole supply chain of natural gas: exploration, onshore and offshore production,
processing (liquefaction and re-gasification) as well as pipeline for regional
distribution and LNG tanker for long distance transport. As for nitrogen, an EU-27
instance is again used. The dataset is based on the LINDE process of cryogenic air
separation, and also includes the power grid mix average for nitrogen production.
In order to create a clear picture of what happens in the system each process should
have an output-flow describing the “service” the process supplies the system with,
which can be connected to the next stage of the life cycle. These outputs do not have
materialistic flows, nor do they contribute to emissions, thus they do not exist as
predefined flows in GaBi. However, simple flows can be created, and new output
flows are defined: “system inerted”, “system purged” and “system rinsed”. The
reference quantity of each flow is set as “Number of pieces” which is a standard unit
of measure in GaBi. When the system is inerted, one “piece” of “system inerted” is
connected to the next phase; “Purge system”. All services of this kind will in the
following be referred to as “service flows”.
A power grid mix representing the Norwegian grid is connected to each unit process
that requires power. The values in Table 3 are implemented in [kWh] and GaBi
automatically converts this to [MJ] as this is the preferred unit.
Page 63
49
All the input and output flows are implemented in the scale of one bunkering
operation. This does not, however, coincide with the scale of equipment
manufacturing – if these have the same scale GaBi understands this as: one whole
storage and bunker facility is made each time a ship bunkers (or the system is only
cooled, prepared and rinsed one time throughout the lifetime of the facility) – and
must be scaled accordingly. This is done when the main plan is complete and ready
to balance. The product system should be scaled to coincide with the functional unit,
for example bunkering of one m3 of LNG, however this is up to the user.
In this analysis the model is scaled to represent the lifetime of the whole facility. This
is done by leaving the cryogenic equipment scaled to one, whilst the processes that
happen every time a vessel comes to re-fuel, such as pre-cooling and rinsing the
system, are scaled up accordingly. An LNG tank system with a total capacity of 500
[m3] will provide enough fuel for two to three weeks operating time, this according to
an article about the Island Crusader in (Maritimt Magasin 2012). This suggests that
each LNG fuelled ship needs to re-fuel approximately 26 times each year (provided
they have tanks this big). With five LNG fuelled ships in operation today, 130 fuelling
operations occur each year.
Statistics regarding where the different vessels choose to re-fuel is lacking. There are
five LNG terminals along the coast of Norway suitable for mid to large scale vessels,
it can be estimated that these are used equally. The resulting frequency is thus 26
bunkering operations each year at each LNG terminal. The life expectancy of a
storage facility is set to 20 years (this is the average value for the life expectancies of
10-25 years as stated by the two sources (Lee, Park et al. 2012) and (CIT 2012)).
The resulting scaling factor is therefore calculated to 520 for the whole life time of a
terminal. This is easily implemented in GaBi by inserting the value in the “scale” box.
With only five vessels fuelled by LNG, the frequency of bunkering operations at any
terminal in Norway is rather low. The frequency is expected to increase within the
near future, however it is not possible to take this into account since the rate at which
the frequency will increase cannot be calculated at this stage.
6.4.3 Pre-cooling
The process of precooling the system is added at this point (it is too simple to require
its own plan). Although it is expected that the only emissions related to pre-cooling is
due to energy use, it is stated in chapter 5.1 that at some LNG terminals the LNG
used to pre-cool the on-land system is vented to air. Although this is not assumed
regular practice, it is interesting in this perspective to look at the worst case scenario
of all the emissions. For this reason, it is included in the analysis. The input is shown
in Table 6 and is connected to the natural gas process instance. The output is in
theory BOG but this is not a predefined flow in GaBi. Since it would require extremely
precise data and in-depth knowledge of how GaBi works, it is too risky to create a
new flow. Natural gas is therefore used as the output.
Page 64
50
Another output flow is the cooling service which has been implemented with the
reference quantity of number of pieces in consistency with the other “service flows”.
6.4.4 Use phase
Every system analysis should have a use phase in the life cycle. The previous plans
represent the production of the facility and processes that occur on the facility prior to
and after a bunkering procedure is done. Although the combustion of LNG in the
LNG-fuelled ship is the use phase of the total life cycle of LNG (from extraction to
combustion), this product system analyses the life cycle of the LNG bunker terminal,
hence the actual filling of LNG from land to the receiving ship is the use phase of this
particular system. This is implemented in the main plan and consists of no other
elements than the power used to pump the LNG through the system. The amount of
energy used is shown in Table 3 and a power grid process instance is added to
supply the energy.
6.4.5 The GaBi model
The whole system as implemented in GaBi is shown in Figure 28 below. All material
flows are coloured blue whilst the direct emission gases are coloured red. The model
has been scaled to the lifetime of the terminal, i.e. the functional unit is One LNG
Terminal. A larger scale figure is provided in Appendix IV.
Figure 28 - GaBi: Complete Bunkering of LNG Plan
Page 65
51
When model implementation is complete, the environmental impacts of the system is
analysed by creating a GaBi balance. This is a file containing all the calculated
results for the modelled system, and also includes all LCI and LCIA results. The
following chapter will describe the results for the Bunkering model.
6.5 Impact Assessment
The preliminary balance is called the Life Cycle Inventory and shows a complete list
of all input and output flows related to the model “Bunkering of LNG”. It shows that
the total flow of inputs is 2 050 [tonnes] and the output flows amount to 1 577
[tonnes]. It can also be deducted that the largest contributor to the mass flows is the
process Ferro manganese with a total of 1 300 [tonnes], closely followed by
Austenitic stainless steel with 899 [tonnes].
This however does not give a satisfactory picture of the environmental impacts,
therefore the following will describe the results in an LCIA perspective. All balance
views and diagrams are filed in Appendix V, as well as exported balance results in
the attached zip-file.
6.5.1 CML 2001
GaBi Educational operates with several impact assessment methods:
TRACI (Tool for the Reduction and Assessment of Chemical and Other
Environmental Impacts)
I02+ v2.1
EI 99 (Eco-Indicator 99) using DALY results
EDIP 1997 and 2003 (Environmental Development of Industrial Products)
CML 96, and finally
CML 2001
The CML method was created by the Institute of Environmental Sciences (CML) at
the University of Leiden, Netherlands and is continuously managed and updated
(CML 2001 being the newest version). It is an impact assessment method which
restricts quantitative modelling to early stages in the cause-effect chain to limit
uncertainties (GaBi Software 2012), also known as a problem-oriented method. It is a
reliable method, well-known in the LCA industry, and well-suited for this analysis.
CML 2001 impact categories included in GaBi are, among others, acidification
potential, eutrophication potential, human toxicity potential, ozone layer depletion and
of course global warming potential. The CML 2001 was updated in December 2007
and November 2009, which are both included in GaBi. Being the most up to date, the
2009 method will be used for this analysis.
Page 66
52
The balance mode also offers additional analyses such as Data Quality and “Weak-
point Analysis” which highlights the biggest contributors to environmental impacts.
6.5.2 Global Warming Potential
The CML 2001, November 2009 edition assesses the Global Warming Potential in a
100 years perspective. CML uses IPCC equivalency factors so that the impact
category indicator result is expressed in kg CO2-equivalents.
For this model, the balance shows a total impact of 1 947 [kg CO2-Equiv] from the
input flows. The output flows, naturally, contribute far greater to the emissions, with a
total impact of 81 750 [kg CO2-Equiv]. The total global warming potential in the
bunkering process is 83 698 [kg CO2-Equiv].
INPUTS NG N2 Power Austenitic steel
Ferro manganese
TOTAL
Material resources
1.40
0.01
0.23
1 864.91
80.46
1947.01
OUTPUTS NG N2 Power Austenitic steel
Ferro manganese
TOTAL
Inorganic emissions to air
4 856.93
0.73
3.20
35 971.97
33 365.71
74 198.54
Organic emissions to air (group VOC)
2 917.51
0.04
0.04
1 888.32
2 745.93
7 551.83
TOTAL 7 775.83 0.79 3.47 39 725.21 36 192.09 83 697.39
Table 7 - GaBi Balance - Global Warming Potential
Table 7 above shows the GWP results for each valuable process. Valuable
processes are those process instances in the model that produce emissions related
to the analysis. The only flow categories listed above are Material Resources,
Inorganic Emissions to air and Organic Emissions to air, which makes sense since
only these types of flows contribute to the GWP. Specifically the environmental
impacts stem from:
Material resources: CO2
Inorganic Emissions to Air: CO2, CO2(biotic) and N2O
Organic Emissions to Air: CH4
Austenitic steel is the greatest contributor to global warming potential, closely
followed by ferro manganese. Natural Gas also does a solid effort. Direct emissions,
energy use and materials are the three main flows contributing to emissions; Table 8
lists the total results. Energy use has a surprisingly low GWP, in fact only 0,36 ‰ of
the total impact.
Page 67
53
GWP [kg CO2-Equiv]
Direct Emissions 7 777
Energy Use 3
Manufacturing 75 917
Table 8 - GaBi Balance - GWP grouped by source of emission
Changing the balance view to Relative Contribution indicates that 90,8 % of the GWP
stems from CO2 emissions, whilst only 9,12 % are from CH4. This implies that LNG
leaks at the terminal may not pose such a big environmental threat as one may
assume.
A Weak Point Analysis shows that the weak points of the model, i.e. those that pose
the biggest environmental threats, are
Valuable processes: Austenitic stainless steel, ferro manganese
Emissions: CO2
6.5.3 Sensitivity check
The reliability of the final results can be assessed by determining how they are
affected by uncertainties in data and allocation methods (ISO 2006).
Some datasets implemented in the model are based on assumptions, such as the
storage tank dimensions and LNG amounts used for pre-cooling. These are simply
based on estimations and create direct uncertainties in the input data. Other datasets
such as pump power consumption is based on a specific pump’s datasheet. The
pump chosen for this, however, was solely based on the availability of the datasheet,
since information directly from the industry was difficult to obtain. If the pump chosen
is not representative of the pumps used at Ågotnes, this also can create some
uncertainties in the data.
Uncertainties can be omitted only if datasets are available directly from the source.
When implementing process instances in GaBi there are often many choices and it
can be difficult to assess which instance is the correct choice for the specific model.
For instance, there are eight different process instances for natural gas in GaBi.
Three of these are “EU-27 Natural gas”, “EU-15 Natural gas Mix” and “NO Natural
gas Mix”. The extent of datasets included and the allocation methods used for each
instance is not always documented or obvious, making it difficult to choose the most
suitable instance. Uncertainties arise due to allocation and data variations. Expert
guidance would be needed to ensure the correct choices are made, this was
unfortunately not available during the course of this thesis.
Page 68
54
Process instance choices can also affect the consistency of the results. For example,
if a European process instance is chosen for one unit process and a Norwegian
instance is chosen for a similar unit, this can lead to allocation inconsistencies within
in the model. Such issues will not become apparent at any stage in the balance, and
can cause uncertainties in the results.
Page 69
55
7 Comparison
In a comparative study, the equivalence of the systems being compared shall be
evaluated before interpreting the results. Consequently, the scope of the study shall
be defined in such a way that the systems can be compared (ISO 2006). They must
have the equivalent functional units and system boundaries, and the same
assessment method must be used to interpret the results. Since the scope of this
thesis focuses on LNG, there was not enough time available to perform similar
analyses for other fuels.
Comparisons can be based on similar life cycle studies; however the bunkering
process is too specific to have been given attention in any of the environmental
studies found. This chapter will therefore be based on aspects of the bunkering
process by which comparisons could be made, along with characteristics that
distinguish bunkering processes of different fuels or create emission differences.
An aspect that can create differences in GHG emissions when bunkering LNG vs.
traditional fuels is BOG production. BOG is created when LNG is stored over a period
of time. There are no standard guidelines of how to handle this BOG, causing
speculations whether this is vented directly to air. For diesel, the low vapour pressure
limits requirements to vapour recovery and therefore also direct air emissions.
At CCB’s terminals the MGO tanks are 1000-9000 [m3] whilst the LNG tank is only
500 [m3] (CCB 2012). Along with the fact that LNG takes up double the volume for
the same energy output as diesel fuels, there is far less fuel energy of LNG
compared to MGO available at the terminal. If LNG is to serve the same amount of
vessels, expansion of the terminal is necessary. Manufacturing of new LNG tanks
and more transport of LNG will contribute to emissions.
At Ågotnes CCB terminal the LNG transfer rate is approximately 100 [m3/h], whilst
the rate for MGO and SDM (special distillate Marine) is 140-200 [m3/h] (CCB 2012).
This indicates that the total estimated time to transfer 1 [m3] of fuel is much higher for
LNG than MGO. Although the energy use has been found to have a negligible effect
in GWP, this is something to consider when comparing the bunkering processes for
different fuels.
Page 70
56
8 Conclusion
Bunkering of LNG was chosen as the hotspot due to being an undiscovered aspect
of the LNG value chain. Although this lead to difficulties in completing a comparison,
the analysis hopefully creates a solid basis for comparison should similar analyses of
other fuels become available. The GaBi model is easy to use so that new values can
be added if data of better quality can be gathered. The work presented in this report
addresses issues that until now have been a missing link in environmental studies of
LNG.
Manufacturing of cryogenic equipment is the largest contributor, with a total GWP of
75 917 [kg CO2-Equivalent], representing 90,7 % of the emissions. This is clearly the
area with the biggest potential to reduce the GWP. However, it is unlikely the material
technology will advance enough to become more environmentally friendly in the near
future. That said it may be possible to decrease emissions by searching for solutions
to change the manufacturing process, or perhaps build more compact terminals to
save steel.
Direct emissions are the only areas that can noticeably reduce GWP. They only
account for 9,3 % of the total impact with a GWP of 7 777 [kg CO2-Equivalent]. Still,
all direct emissions can in fact be omitted. Options for LNG and BOG recovery are
plentiful, the easiest being a vapour return line.
The emissions related to energy use only contribute to 0,36 ‰ of the total GWP
impact. This is to be considered negligible when compared to the other contributors.
The extended time it takes to bunker LNG should therefore not be a concern when
comparing fuels.
BOG production can become substantial if LNG is stored over longer periods of time.
To ensure this is not vented directly to air, regulations for BOG recovery should come
into force, for example using BOG to produce electricity. This will not only eliminate
direct emissions but also reduce energy consumption due to the terminal generating
its own energy.
If LNG is to become the fuel of the future, fuelling availability must increase. Options
for ship-to-ship bunkering are under development, which means ships can fuel both
at shore and at sea. A major disadvantage with LNG at the moment is that fuelling
can only take place at specified terminals. Diesel-fuelled ships that fuel portside can
load and offload simultaneously, which LNG-fuelled cannot. STS bunkering will solve
this problem, providing increased fuelling efficiency and availability for LNG.
Page 71
57
9 Further work
To produce a more reliable inventory result, there are some issues that should be
investigated further. Firstly, more precise data should be collected, preferably directly
from an LNG terminal. Also, the only process instance available for low carbon steel
(Ferro Manganese) originated from South Africa. Production countries can be revised
to create more sound results. Lastly, more equipment such as valves and pumps
ought to be included in the model to get a more thorough assessment of the
emissions related to manufacturing.
End of life treatment and recycling was not included in the analysis. Since the
balance was based on the entire lifetime of the facility, it is assumed some
percentage of the materials will be recycled at the end of life. Implementing this will
ensure a more complete analysis.
Where the LNG and natural gas comes from is important and can alter the
environmental effect. Presumably most LNG used in Norway comes from Norwegian
producers, however this should be considered if this report is to be used in other
environmental studies. The LNG implemented in GaBi was based on an average
value of all LNG-producers in the EU-countries.
Transportation of LNG is an additional hotspot that was considered for this analysis.
There is a debate regarding the environmental impact of large LNG carriers. The
general view is that LNG transport has a low GWP compared to other transoceanic
cargo ships due to using excess BOG as fuel. Others now argue that the energy use
is so enormous (possibly as much as 7 times the normal) that the GWP benefit is
challenged. A detailed LCA of this stage can produce some interesting results.
LNG leaks and BOG production and emissions are all contributors to the overall
emissions that should be investigated further. There is for instance no documentation
of leakages. When observing a TTS bunkering procedure in Trondheim, LNG leaked
out during filling simply because the connection was not tight enough. The crew did
not seem to care about this because “it happens all the time”. If this is the standard
attitude leaks might pose a bigger threat than thought.
Page 72
58
10 References AK Steel. (2007). "304L Stainless Steel " Product Data Sheet
Retrieved 19th April 2012, from www.aksteel.com.
Bjøndal, L. H. (2012). Risk Analysis; Bunkering of LNG. Master
Thesis, NTNU.
Blikom, L. P. (2011). "LNG Bunkering operation caught on tape " DNV
Blog: LNG - Energy of the Future.
http://blogs.dnv.com/lng/2011/10/lng-bunkering-operation-
caught-on-tape/ Desember 2011.
Blikom, L. P. (2011). "LNG fuel tanks located underneath
accomodation unit " http://blogs.dnv.com/lng/2011/10/lng-fuel-
tanks-located-underneath-accommodation-unit/ 5th Desember 2011.
Bonn, J. (2004). "Vacuum insulated pipe seeks increased use with
LNG." Pipeline & Gas Journal.
CCB. (2012). "Bunkring." Retrieved 25th April 2012, from
http://www.coastcenterbase.no/index.php?mapping=53.
CIT. (2012). "Storage Tank Inspection " Retrieved 8th May, 2012,
from http://www.cituk-
online.com/acatalog/Storage_Tank_Inspection.html.
Curt, B. (2004). "Marine Transportation of LNG" Intertanko
Conference
DNV (2011). Rules for classification of Ships, High speed light
craft and naval surface craft. Gas Fuelled Engine
Installations.
Eidesvik Shipping AS. (2007). "Viking Queen Datasheet " Retrieved
25th April, 2012, from http://www.eidesvik.no/viking-
queen/category128.html.
GaBi Software. (2012). "CML 2001 Method." Life Cycle Impact
Assessment methods Retrieved 2nd February 2012, from
http://www.gabi-software.com/support.
Gassteknikk Ltd. (2012). Compendium for Gas bunkering safety
training course. Gasskurs kat A, B & C. Torghatten Nord AS.
Trondheim, Norway
GTT. (2009). "LNG Carrier containment systems." Retrieved 12th
February 2012, from http://www.gtt.fr/index.php.
Haack, T. (2011). Natural Gas as fuel in shipping - Experiences and
perspectives, Rolls Royce.
Harperscheidt, J. (2011). "Bunkering, infrastructure, storage, and
processing of LNG " Ship & Offshore(No.1).
Haugstad, T. (2012). Gassdrevne skip. Teknisk Ukeblad. Online
Edition.
Hochschorner, E. and G. Finnveden (2003). "LCA Methodology -
Evaluation of Two Simplified Life Cycle Assessment Methods "
The International Journal of LifeCycle Assessment 8 (3): 119-
128.
Hur, T., J. Lee, et al. (2004). "Simplified LCA and matrix methods
in identifying the environmental aspects of a product system "
Journal of Environmental Managament 75: 229-237.
IMO (1996). IMO IGC Code Chapter 4 - Cargo Containment.
International Maritime Organisation, DNV "Vega" Database.
IMO (2009). Second IMO GHG Study 2009, International Maritime
Organization.
IMO. (2011). "Air Pollution and Greenhouse Gas Emissions." GHG
Emissions, Retrieved 12th March 2012, from
Page 73
59
http://www.imo.org/OurWork/Environment/PollutionPrevention/AirP
ollution/Pages/GHG-Emissions.aspx.
IPCC (2001). IPCC Third Assessment Report: Climate Change 2001.
Radiative Forcing of Climate Change - Global Warming Potential
IPCC (2007). IPCC Fourth Assessment Report: Climate Change 2007.
Direct Global Warming Potentials. S. Solomon and D. Qin.
Cambridge, United Kingdom, Intergovernmental Panel on Climate
Change.
ISO (2004). Cryogenic vessels- Gas/materials compatibility. Annex A,
International Organisation for Standardisation. ISO 21010.
ISO (2006). Environmental Management - Life cycle Assessment -
Requirements and guidelines. Life Cycle Interpretation -
Evaluation, International Organisation for Standardisation. ISO
14044.
Lee, S., J. S. Park, et al. (2012). Service Life prediction of 9% Ni
Steel LNG Storage Tank Using Fatigue Analysis. 12th Topical
Conference on Gas Utilization
Linde. (2012). "Liquefaction of Natural Gas." Retrieved 13th May
2012, from http://www.linde-
engineering.com/en/process_plants/liquefied_natural_gas/index.h
tml.
Liquefied Gas Carriers. (2011). "Preparation for loading LNG cargo."
Retrieved 16th February 2012, from
http://www.liquefiedgascarrier.com/preparation-for-loading-
LNG.html.
Maritimt Magasin (2012). "Island Crusader er levert og døpt".
Marquardt, E. D., J. P. Le, et al. (2000). Cryogenic Material
Properties Database. 11th International Cryocooler Conference
Boulder, Colorado, USA.
MGI. (2012). "Products - LNG Fuel." Retrieved 17th April, 2012,
from http://www.mg-ins.no/index.cfm?id=337902.
Moss Maritime. (2012). "Moss Maritime General Brochure " Moss LNG
Carriers Retrieved 12th February 2012, from
http://www.mossww.com/pdfs/Moss%20Maritime%20General%20Brochure
.pdf.
NaturalGas. (2010). "Focus on LNG " Retrieved 24th April 2012 from
http://www.naturalgas.org/index.asp.
NS (2007). Installation and equipment for liquefied natural gas
Design of onshore installations, Norwegian Standard. NS
1473:2007.
NWS. (2011). "Ship Technical Informations." Moss Rosenberg
Retrieved 14th February 2012, from
http://www.nwsssc.com.au/fleet_moss-rosenberg.aspx.
Osaka Gas. (2012). "Development of Invar Alloy LNG Piping." Gas
Material, Processing and Power Technologies Retrieved 18th May
2012, from http://www.osakagas.co.jp/rd/sheet/001e.html.
PHPK Technologies. (2008). "Vacuum Insulated Piping for LNG
Service." Retrieved 18th April 2012, from
http://www.phpk.com/pdf/2008Brochure.pdf.
Pré Consultants (2010). Introduction to LCA with SimaPro 7. Impact
Assessment.
Richardsen, P. W. (2010). "A major step towards the new
environmental era for tanker shipping." LNG as fuel for ships
Retrieved October 2011, from
http://www.dnv.no/presse/pressemeldinger/2010/Amajorsteptowards
thenewenvironmentalerafortankershipping.asp.
Page 74
60
Rolls Royce. (2009). "Bergen B35:40 Gas Engine " Retrieved 2nd
February, 2012, from http://www.rolls-
royce.com/marine/products/diesels_gas_turbines/gas_engines/b354
0_gas.jsp.
Ryste, J. M. (2011). A literature study of the LCA methodology and
application to LNG as ship fuel. Project Thesis, NTNU.
Skaar, C. (2012). Conversation regarding GaBi with Christofer Skaar,
Researcher at the Department of Industrial Economics and
Technology Management, NTNU.
Skipsrevyen. (2000). "Ship of the Year - M/F "Glutra"." from
http://www.shipoftheyear.com/ship-of-the-year-2000/ship-of-the-
year-2000-mf-%C2%ABglutra%C2%BB/.
SPP. (2011). "A Brief Overview of Stainless Steel." Type 304
Retrieved 25th April 2012 from
http://www.sppusa.com/reference/white_paper/wp_ss.pdf.
Statistics Norway. (2011). "Natural gas, domestic use, 2011." Lower
consumption of natural gas. Retrieved 13th May 2012, from
http://www.ssb.no/naturgass/.
Strøm, K. L. (2012). Conversation with Katrine Lie Strøm (DNV) about
the details regarding the bunkering process, as identified by
DNV in cooperation with Gasnor.
Swedish MT Forum, Linde Cryo AB, et al. (2010). "LNG ship to ship
bunkering procedure". Gothenburg, Sweden.
TNO (2011). Environmental and Economical aspects of using LNG as a
fuel for shipping in The Netherlands. Netherlands, TNO -
Netherlands Organisation for Applied Scientific Research.
Ursan, M. (2011). "What is Boil-off?", Westport Power Inc.
WG Environment (2004). Life Cycle Assessment EIGA - Environmental
Newsletter Brussels, European Industrial Gases Association
(EIGA).
Wold, M. (2012). Conversation with Martin Wold (DNV) regarding the
procedures at Ågotnes LNG terminal.
Wärtsilä. (2012). "Wärtsilä 34 DF." Retrieved 2nd February, 2012,
from http://www.wartsila.com/en/engines/medium-speed-
engines/wartsila34DF.
Æsøy, V., P. M. Einang, et al. (2011). "LNG-fuelled Engines and Fuel
Systems for Medium-Speed Engines in Maritime Applications".
Trondheim, Norway, NTNU and MARINTEK.
ÅF&SSPA (2011). "North European LNG Infrastructure Project: A
feasibility study for an LNG filling station infrastructure and
test of recommendations". Draft Feasibility Report. Sweden.
Page 75
61
Appendix
Appendix I – Problem Description
Faculty of Engineering Science and Technology
Department of Marine Technology
MASTER THESIS
for
M.Sc. student Julianne Mari Ryste
Department of Marine Technology
Spring 2012
Screening LCA of GHG emissions related to LNG as ship fuel
Miljøanalyse av klimagasser knyttet til LNG som drivstoff
Page 76
62
Background
In view of the increasingly popular climate change debate worldwide, maritime
transport is under pressure to create sustainable solutions for a cleaner future. One
of these solutions is using Liquefied natural gas (LNG) as an alternative fuel in the
shipping industry.
LNG is a clean fuel containing no sulphur; this eliminates the SOX and particulate
matter emissions. Additionally, the NOX emissions are reduced by up to 90% due to
reduced peak temperatures in the combustion process. Due to its low hydrogen-to-
carbon ratio compared with oil-based fuels, results in lower specific CO2 emissions
[kg of CO2/kg of fuel]. However life cycle assessments of GHG emissions throughout
the LNG value chain requires more attention.
Life cycle analysis (LCA) is a renowned method to assess the environmental
performance at all the stages of a product or system’s lifetime. A life cycle begins
with the extraction of raw materials to manufacturing and use of the product, through
to repair and eventually disposal.
Objective and sub-objectives
A screening LCA is to be carried out for the GHG emissions related to LNG as ship
fuel. Firstly, the LNG value chain should be established and the areas suitable for
screening highlighted. Consider both contributions to the environmental impact as
well as areas of the LNG life cycle receiving little attention thus far.
GaBi educational software will be used to analyse the hotspots of the LNG value
chain. The model design should aim to be user-friendly so that it can easily be
adopted and developed further.
The results of the GaBi analysis will be assessed in a problem-oriented manner,
focusing on GHG emissions and their Global Warming Potential. The results will
thereby be compared to other marine fuels such as MDO and HFO.
Lastly, some suggestions of improvements in the bunkering cycle will be made
according to the results.
Page 77
63
General
The thesis must be written like a research report, with an abstract, conclusions,
contents list, reference list, etc.
During preparation of the thesis it is important that the candidate emphasizes easily
understood and well written text. For ease of reading, the thesis should contain
adequate references at appropriate places to related text, tables and figures. On
evaluation, a lot of weight is put on thorough preparation of results, their clear
presentation in the form of tables and/or graphs, and on comprehensive discussion.
The thesis is to be handed in electronically. Also a .pdf-version of the final thesis is to
be submitted to the supervisor by email.
Starting date: 15th January 2012
Completion date: 10th June 2012
Handed in: 10th June 2012
Trondheim 10th June 2012.
Ingrid Bouwer Utne
Professor
Page 78
64
Appendix II – Materials for Cryogenic Equipment
ISO 21010, Annex A – review of common materials used for cryogenic vessels and
associated equipment.
Page 79
65
Appendix III – Manufacturing of Cryogenic Equipment: Details
Piping
The outer diameter and length was discussed with the crew on board the LNG ferry
“MS Tresfjord” and the crew manning the LNG filling truck, during the LNG course by
Gassteknikk. The inner diameter was estimated based on own assumptions, and the
thickness of the steel pipes was discussed with colleagues.
Storage Tank
The CCB LNG terminal at Ågotnes has a storage tank that rooms 500 m3 of LNG
(CCB 2012). By using an estimation about the length of the tank I was able to
calculate the diameter, and thereby also the amount of steel needed. Information
from Marine Gas Insulation (MGI 2012) has been used previously, since it is safe to
assume the LNG terminals in Norway use a Norwegian based insulation expert. It is
here again used to estimate the amount of insulation used and the MGI spray foam
product catalogue states that 250-300 mm of insulation is normally used in their
tanks. For ease of implementation in GaBi, the amount is set at 270 mm. Thereby the
diameter of the outer tank is 0,27 [m] bigger than the inner. The distance between the
pipes can be assumed the same whatever type of insulation.
Density of materials
GaBi uses kg as the standard unit, so the density of each material was used to
convert from [m3] to [kg].
Gases Density [kg/m3]
Nitrogen 1,165
Natural Gas 0,8
LNG 450,45
Steel
Austenitic steel 8 030
Low alloy steel 7 850
Page 80
66
Appendix IV – GaBi Implementation – Product System
Page 81
67
Appendix V – GaBi Result Figures
GaBi Balance – Life Cycle Inventory
Page 82
68
Global Warming Potential
Page 83
69
Weak Point Analysis
Page 84
70
GaBi Diagram – Global Warming Potential – Outputs
Page 85
71
GaBi Diagram – Mass contribution – Inputs and Outputs (Relative Contribution)