31
SDN WAN Applications Brighten Godfrey CS 538 March 1, 2017 slides ©2010-2017 by Brighten Godfrey

SDN WAN ApplicationsBrighten Godfrey
CS 538 March 1, 2017
slides ©2010-2017 by Brighten Godfrey

Initial “Killer apps”
Cloud virtualization
• Create separate virtual networks for tenants• Allow flexible placement and movement of VMs
WAN traffic engineering
• Drive utilization to near 100% when possible• Protect critical traffic from congestion
Key characteristics of the above
• Special-purpose deployments with less diverse hardware• Existing solutions aren’t just annoying, they don’t work!

How large online services work

How large online services work
The Internet

Why multiple data centers?
Data availability
Load balancing
Latency
Local data laws
Hybrid public-private operation

Inter-data center traffic is significant
IEEE INFOCOM, 2011A First Look at Inter-Data Center Traffic Characteristics via
Yahoo! DatasetsYingying Chen1, Sourabh Jain1, Vijay Kumar Adhikari1, Zhi-Li Zhang1, and Kuai Xu2
1University of Minnesota-Twin Cities2Arizona State University
Abstract—Effectively managing multiple data centers and theirtraffic dynamics pose many challenges to their operators, as littleis known about the characteristics of inter-data center (D2D)traffic. In this paper we present a first study of D2D trafficcharacteristics using the anonymized NetFlow datasets collectedat the border routers of five major Yahoo! data centers. Ourcontributions are mainly two-fold: i) we develop novel heuristicsto infer the Yahoo! IP addresses and localize their locations fromthe anonymized NetFlow datasets, and ii) we study and analyzeboth D2D and client traffic characteristics and the correlationsbetween these two types of traffic. Our study reveals thatYahoo! uses a hierarchical way of deploying data centers, withseveral satellite data centers distributed in other countries andbackbone data centers distributed in US locations. For Yahoo!US data centers, we separate the client-triggered D2D traffic andbackground D2D traffic from the aggregate D2D traffic usingport based correlation, and study their respective characteristics.Our findings shed light on the interplay of multiple data centersand their traffic dynamics within a large content provider, andprovide insights to data center designers and operators as wellas researchers.Index Terms—Content provider, Inter-data center, NetFlow,
Anonymization
I. INTRODUCTION
Recent years have seen unprecedented growth in the datacenter driven technologies and services. Various organizationsare now sourcing their computing to “cloud-based” infrastruc-tures. Therefore, large scale data centers and associated cloudservices are developed and deployed by various organizationsand service providers to store massive amounts of data, andenable “anywhere, anytime” data access as well as compu-tations on the data. Further, for scalability, robustness andperformance (e.g., latency), multiple data centers are oftendeployed to cover large geographical regions. For instance,Microsoft, Google, and Yahoo! own large scale data centersthat are located in different geographic locations around theworld.While there are a few recent studies [1], [2] regarding the
traffic characteristics within a single data center, little is knownabout the inter-data center (D2D) traffic dynamics among mul-tiple data centers. Just as the studies of traffic characteristicswithin a data center, such as workload distribution and wherecongestion occurs, helps the design and management of datacenters, we believe that better understanding of the trafficcharacteristics between multiple data centers (within a singleservice provider, e.g., a content provider) and their interactions
with client-triggered traffic is critical to effective operationsand management of multiple data centers. For instance, suchunderstanding can help in deciding what and how servicesshould be deployed across multiple data centers, what cachingand load-balancing strategies [3], [4] should be employed,and how to manage the traffic in the wide-area networkbackbone connecting the data centers to optimize performanceand minimize operational costs [3], [4].In this paper we present a first study of inter-data center
(D2D) traffic characteristics using the anonymized NetFlowdatasets collected at the border routers of five major Yahoo!data centers. Our contributions are multi-fold. First, we de-velop novel heuristics to infer the Yahoo! IP addresses that areinvolved in data center-client (D2C) traffic and localize theirlocations from the anonymized NetFlow datasets. Based onseveral key observations regarding traffic directions and routerinterfaces, we develop an effective methodology to extract andseparate inter-data (D2D) traffic from data center-client (D2C)traffic, and analyze the characteristics of both D2D and D2Ctraffic and their correlations. Our analysis reveals that Yahoo!organizes data centers in a hierarchical way. In “satellite”data centers, D2D traffic is strongly correlated with the clienttraffic. In “backbone” data centers, we classify D2D traffic intotwo categories: i) client-triggered D2D traffic, i.e., D2D traffictriggered by the front-end “customer-facing” services such asweb search, email, online chat, gaming, video, and so forth;ii) background D2D traffic, i.e., D2D traffic due to internaltasks such as routine background computation (e.g., search in-dexing), periodic data back-up, and so forth. Using novel portbased correlation analysis, we are able to further separate thesetypes of D2D traffic, and study their respective characteristics.We find that background D2D traffic has smaller variance, withno significant trends over the day; on the other hand, client-triggered D2D traffic exhibits varying trends over the day.Furthermore, we show that several D2C services are stronglycorrelated with each other. These correlations among differentservices have important implications for distributing differentservices at multiple data centers. For instance, services withhighly correlated traffic can be served from the same datacenter to minimize the inter-data center traffic.To our best knowledge, our work is the first study of inter-
data center traffic characteristics of a large global contentprovider. It sheds light on the interplay of multiple data centersand their traffic dynamics within a large content provider.
Though the D2D and D2C traffic characteristics studied in thepaper may be specific to Yahoo! and the services it provides,our methodology is nonetheless general, and can be appliedto understand the D2D and D2C traffic characteristics of anyother large content provider or cloud-service provider. All inall, we believe that our work provides useful insight to datacenter designers and operators as well as researchers.The remainder of the paper is organized as follows. In
Sec. III we provide the overview of the datasets and Yahoo!data centers. Sec. IV presents the methodology for separatingYahoo and non-Yahoo IP addresses, and analysis of inter-datacenter traffic are presented in Sec. V. Finally, we provide adiscussion of the implications for our findings in Sec. VI andconclude the paper in Sec. VII.
II. RELATED WORK
As mentioned earlier, there have been a few recent stud-ies [1], [2] regarding the traffic characteristics within a singledata center. In [1], authors provide both macroscopic and amicroscopic view of the traffic characteristics and congestionconditions within data center networks. In [2], authors analyzethe end-to-end traffic patterns in data center networks, andexamine temporal and spatial variations in link loads andlosses. On the other hand, little is known about inter-datacenter traffic characteristics. Similarly in [4], the authors studythe YouTube data center traffic dynamics using the Netflowdata collected at a tier-1 ISP, with the emphasis on inferenceof load-balancing strategy used by YouTube and its interactionand impact on the ISP network. Due to the nature of data used,the traffic seen is primarily D2C traffic, and limited to theperspective to a single ISP. To our best knowledge, our workis the first attempt at analyzing and characterizing inter-datacenter traffic characteristics; we also develop novel methodsfor separating D2D traffic from D2C traffic, and for furtherseparating background D2D traffic and client-triggered D2Dtraffic.
III. OVERVIEW OF YAHOO! DATASETSIn this section we provide the overview of the Yahoo! data
centers and their connectivity. We also describe the networkflow datasets [5] used in this study. Further, to facilitate thediscussion in the paper we classify the flows into severalmeaningful categories which is described later in the section.In this study we consider five major Yahoo! data centers
which are located at Dallas (DAX), Washington DC (DCP),Palo Alto (PAO), Hong Kong (HK), and United Kingdom(UK). DAX, DCP and PAO are located in US, and providemost of the core services such as web, email, messenger andgames, etc. They are also the largest Yahoo! data centers interms of the amount of traffic exchanged. At each of the datacenters, Yahoo’s border routers connect to several other ISPs toreach its clients and other data centers. These data centers arealso directly connected to each other through a private networkservice(e.g. VPN, leased lines etc), and hence may carry trafficfor each other through this private network. Fig. 1 provides anoverview of the Yahoo! data centers and their connectivity.
Fig. 1. Overview of five major Yahoo! data centers and their networkconnectivity.
Our study is based on NetFlow datasets collected at oneof the border routers at each of the locations mentioned.Unlike the datasets used in the previous studies related to datacenter traffic analysis (such as [1], [2]) the NetFlow datasetsused in our study provide us with not only the profilingof Yahoo! to “client”1 traffic, but also the traffic exchangedbetween different Yahoo! data centers, which we believe isthe first such work that sheds light on the inter-data centertraffic characteristics for a large content provider. The networkflow data collected at each border router, includes both theinbound and outbound traffic. Each record in the NetFlowdata contains a “sampled flow” information, which includesfollowing fields: a) timestamp, b) source and destination IPaddresses and transport layer port numbers, c) source anddestination interface on the router, d) IP protocol, e) numberof bytes and packets exchanged.An important challenge with the datasets is that the IP
addresses in the network flow traces are permuted to hidethe identities of the Yahoo! users. However, prefix-preservingschemes [6], [7] are used in permutation, i.e. if an IP addressa.b.c.d is permuted to w.x.y.z then another IP address a.b.c.d̄is mapped to w.x.y.z̄. Due to this reason, through out thispaper we represent summarized IP address based statisticsusing /24 IP prefixes. Also, we use the term “client” torepresents the non-Yahoo hosts connected to Yahoo! servers.These hosts may be the actual Yahoo! users connecting toYahoo! servers to access various services, or other serversconnecting to Yahoo! servers, such as other mail servers mayconnect to Yahoo! mail servers to exchange emails.Classification of Flows: In order to facilitate the discussionin this paper, we classify the flows collected into followingtwo categories:i. D2C traffic: The traffic exchanged between Yahoo! serversand clients.ii. D2D traffic: The traffic exchanged between different Yahoo!servers at different locations.A border router at a given location may also carry D2C
and D2D traffic for other locations. We refer to these types
1We refer to non-Yahoo hosts connecting to Yahoo! servers as clients unlessspecified.
TABLE IVTHE NUMBER OF IPS PROVIDING EACH D2C SERVICE AND THE OVERLAPPING NUMBER OF IPS BETWEEN EACH PAIR OF SERVICES.
email DNS IM news video game web SMTP uniqueemail 83 8 2 3 1 0 62 67 10DNS 8 131 2 2 1 0 27 22 102IM 2 2 235 60 1 1 163 64 71news 3 2 60 66 0 0 64 64 2video 1 1 1 0 87 0 67 2 20game 0 0 1 0 0 2 1 0 1web 62 27 163 64 67 1 3773 262 3333SMTP 67 22 64 64 2 0 262 699 424
0 20 40 60 800
1
2
3
4
5x 10⁵
Time interval
Num
ber o
f flo
ws
0 20 40 60 800
2
4
6x 10⁴
Time interval
Num
ber o
f flo
ws
UK HK
(b) D2D Flow Pattern(a) D2C Flow Pattern
Fig. 6. The D2C and D2D flow patterns during one day in UK and HK.
0 20 40 60 800
5
10
x 106
Time interval
Num
ber o
f flo
ws
a) D2C Flow Pattern
0 20 40 60 800
0.5
1
1.5
2x 10⁶
Time interval
Num
ber o
f flo
ws
b) D2D Flow Pattern
DAX DCP PAO
Fig. 7. The D2C and D2D flow patterns during one day in US locations.
143 53 80 465
110
995
587
1935
1199
944
3 2550
0050
0150
5050
61 119
143 53 80 465 110 995 587
1935 11999
443 25
5000 5001 5050 5061 119 −1
−0.5
0
0.5
1D2C Service Correlation
Fig. 5. Cross-correlation between each pair of D2C services.
in this figure, the aggregate D2C traffic is mainly dominatedby the web services, which is not surprising as most of theservices provided by Yahoo! have web-based interface, andthese services are provided at all five locations. On the otherhand, instant-messaging (IM), video, and game services havesmaller but significant contribution to D2C traffic at all threeUS locations. Moreover, the choice of location for differentservices can be affected by many factors such as regionaldemand, cost of infrastructure and the nature of service itself.Also location based services replicate content at multiple datacenters to provide better performance [15], [16]. Table IVshows the number of IPs providing each type of service inDCP data center. We separate port 25 (SMTP) from rest ofthe email category due to the fact that this is mainly usedbetween Yahoo! mail servers, or between Yahoo! and otherservice providers’ mail servers such as Gmail or Hotmail. On
the other hand, other email port numbers are used by clients todirectly interact with Yahoo!. The diagonal entries in the tableshow the number of IPs providing each service as specified inrow or column, and the non-diagonal entries show the numberof overlapping IPs between two services as specified per rowand column. In the last column, we also list the number ofunique IPs providing each D2C service. As seen in this table,some of the IP addresses only provide one type of service(see the “unique” column), a large number of them providemultiple services on the same server IP address. From the tablewe learn that many of the web, SMTP, and DNS services aremostly served using a dedicated set of IP addresses, while theremaining services share IP addresses with other services4.2) Cross-Correlation among D2C Services: Though D2C
services can be categorized into 7 groups, we find that someof them are strongly correlated (positively or negatively) witheach other, while others are independent of each other. Wecompute the pair wise temporal correlation of each servicecategory to get a better understanding of the interplay amongdifferent types of D2C services. Figure 5 shows the correlationbetween each pair of D2C services in the PAO data center.In this figure, both x-axis and y-axis represent the list ofD2C server ports observed in this location. The colored cellcorresponding to a pair of services as specified in x-axis andy-axis shows the correlation between them. It turns out that theD2C service ports are clustered into 2 major traffic patterns.The first group consists of several email related ports, andthe other messenger ports. These correlations among different4It can happen due to a variety of reasons, such as a single host machine
might be running multiple different server instances or a NAT based forward-ing is used to divide the traffic to multiple physical(or virtual) servers. It isalso likely that these IP addresses are simply frontend servers.
Inter-data center traffic is significant

Inter-data center traffic is significant
Back-Office Web Traffic on The Internet
Enric PujolTU Berlin
Philipp RichterTU Berlin
Balakrishnan ChandrasekaranDuke University
Georgios SmaragdakisMIT / TU Berlin / [email protected]
Anja FeldmannTU Berlin
Bruce MaggsDuke / Akamai
Keung-Chi NgAkamai
ABSTRACTAlthough traffic between Web servers and Web browsers is read-ily apparent to many knowledgeable end users, fewer are aware ofthe extent of server-to-server Web traffic carried over the publicInternet. We refer to the former class of traffic as front-office In-ternet Web traffic and the latter as back-office Internet Web traffic(or just front-office and back-office traffic, for short). Back-officetraffic, which may or may not be triggered by end-user activity, isessential for today’s Web as it supports a number of popular butcomplex Web services including large-scale content delivery, so-cial networking, indexing, searching, advertising, and proxy ser-vices. This paper takes a first look at back-office traffic, measuringit from various vantage points, including from within ISPs, IXPs,and CDNs. We describe techniques for identifying back-office traf-fic based on the roles that this traffic plays in the Web ecosystem.Our measurements show that back-office traffic accounts for a sig-nificant fraction not only of core Internet traffic, but also of Webtransactions in the terms of requests and responses. Finally, we dis-cuss the implications and opportunities that the presence of back-office traffic presents for the evolution of the Internet ecosystem.
Categories and Subject DescriptorsC.2.3 [Computer-Communication Networks]: Network Opera-tions.
KeywordsNetwork measurement; the Web; content delivery; online adver-tisements; real-time bidding; crawlers.
1. INTRODUCTIONThe Web has not only revolutionized the way people publish, ac-
cess, and search for content but, some would argue (e.g., [49]),has also evolved to become the new “narrow waist” of the Internet.Indeed, the HTTP protocol provides a common interface that manypopular Internet applications rely on, including video, social net-working, e-commerce, and software delivery. These applications
Permission to make digital or hard copies of all or part of this work for personal orclassroom use is granted without fee provided that copies are not made or distributedfor profit or commercial advantage and that copies bear this notice and the full cita-tion on the first page. Copyrights for components of this work owned by others thanACM must be honored. Abstracting with credit is permitted. To copy otherwise, or re-publish, to post on servers or to redistribute to lists, requires prior specific permissionand/or a fee. Request permissions from [email protected] ’14, November 5–7, 2014, Vancouver, BC, Canada.Copyright 2014 ACM 978-1-4503-3213-2/14/11 ...$15.00.http://dx.doi.org/10.1145/2663716.2663756.
front-office traffic back-office traffic
S1 S2
S3
S4
org. A
org. B
org. C
Figure 1: Front- vs. back-office Internet Web traffic.
are often supported by advertisements, which are also delivered viaHTTP.
Although an end user typically views a Web page as a unit, re-cent studies [17, 36] demonstrate that a single Web page often con-tains links to objects that are delivered by a large and diverse setof servers. For example, the creation of a single Web page may in-volve several Web companies as, e.g., parts of the Web page may beunder the control of a content provider, a Web advertiser, a videostreamer, a search engine, and/or a social network. Furthermore,even fetching an individual part of a Web page may involve manyparties. For example, when an end user requests Web content,the delivery involves not only the servers that receive HTTP re-quests from the end user’s browser, but also a whole service ecosys-tem consisting of proxies, content delivery networks (CDNs), ad-sellers, ad-bidders, back-end servers or databases, crawler bots, etc.
Thus, “there is more to content delivery than is visible to theeye,” and, consequently, this paper explores the distinction betweenfront-office and back-office Web traffic. The first refers to the traf-fic involving end users directly. The second refers to Web trafficexchanged between machines (e.g., the front-office servers and anyother server which is part of the Web service ecosystem). Figure 1depicts this distinction. Note that not all back-office Web traffictravels over the public Internet. Some is carried over private back-bones or within data centers. In this paper, we focus on back-officeWeb traffic on the public Internet. For short, we henceforth use theterm “front-office traffic” to refer to front-office Web traffic carriedon the public Internet and similarly for “back-office traffic.”
In contrast to back-office traffic, front-office traffic has long beenstudied, e.g., [8, 14, 17, 26, 27, 45, 47]. While there is some relatedwork on Machine-to-Machine traffic in specific environments, e.g.,in cellular networks [52] and within data centers [12, 13, 34], weare not aware of studies of back-office Web traffic on the publicInternet. Liang et al. studied security-related aspects arising fromCDN back-end communication [44] and for some specific otherservices, e.g., DNS, Gao et al. have characterized the correspond-ing Machine-to-Machine traffic [31].
The reason why previous work has focused mainly on front-office traffic is that end-user Quality of Experience (QoE) can beanalyzed by observing front-office traffic, but back-office traffic is
257
[IMC 2014]
(d) Crawlers
Web Crawler
S1 S2
S4S3
HTTP GET
(b) CDN Servers
Front-EndServer
Back-EndServer
Content OriginServer
CDN
HTTP GET
HTTP GET
(c) Ad Exchanges - Auctioneers and Bidders
Ad Publisher
Advertiser/Bidder A
Advertiser/Bidder B
Advertiser/Bidder C
Ad ExchangeAuctioneer
HTTPGET/POST
HTTP GET
Web ProxyS1 S2
S4S3
(a) Proxies/Intermediaries
HTTP GET/POSTHTTP GET/POST
front-office Web requests back-office Web requests
Figure 2: Back-office Web Traffic: typical HTTP requests made by Web proxies, CDNs, ad-exchanges, and crawlers.
overlays to improve end-to-end performance and for task sharingbetween front-end and back-end servers are deployed by today’sCDNs [43, 54, 28, 40, 21].
(c) Ad Exchanges – Auctioneers and Bidders: As shown inFigure 2(c), advertisement exchanges consist of (i) publishers thatsell advertisement space (ad space) on their Web pages, as well as(ii) advertisers that buy ad space on these Web pages. An exchangeacts as a common platform to bring publishers and advertisers to-gether. The matching between offered ad space on a Web site andinterested advertisers is often performed using real-time bidding(RTB). Once an end user visits a Web page where ad space is avail-able, the ad exchange auctioneer contacts the potential advertisers(i.e., the bidders), and provides information about the visitor to starta bidding process among the interested parties [10, 59, 55, 9].1 Anumber of sophisticated tools together with visitor information sup-pliers optimize the bidding process for both the advertisers and thepublishers. Hence, if RTB is used to place ads on a website, thevisit of a Web page by an end user may trigger a large number ofrequests in the background. The final advertisement content is typ-ically delivered via CDNs [9]. We note that today’s Web advertise-ment ecosystem is complex and may involve many different typesof back-office traffic, caused by a variety of different actors. Inthis paper, we solely focus on RTB-related activity, i.e., back-officetraffic as a result of auctioneers interacting with bidders.
(d) Crawlers: Web crawlers continuously index the Web. To op-timize crawling, each crawl bot is typically responsible for indexinga small part of the Web [11]. Indexing involves requesting the Webpage as well as following embedded links [38, 16]. Web crawlerstypically issue an order of magnitude more Web queries than reg-ular end users. Best practices among the major search engines en-sure that crawlers have appropriate reverse DNS entries along withwell-specified user agents in order to avoid being blocked by Websites.
Hereafter, we refer to back-office Web traffic as all Web traf-fic that is not exchanged between end users and servers. This in-cludes traffic exchanged between intermediaries and Web servers(e.g., traffic between a CDN front-end server and a back-end serveror between a Web proxy and a Web server), as well as traffic ex-changed between automated hosts such as crawlers or auctioneersand any other Web server.
3. DATA SETSIn this work we rely on measurements collected at a diverse set
of vantage points.1The bidders may also contact other entities (i.e., trackers) to getinformation regarding the profile of the visitor [33, 59].
IXPs: Packet-sampled traces collected at two Internet eXchangePoints (IXPs), which allow us to study back-office trafficin an inter-domain environment, as exchanged between hun-dreds of networks [6].
ISP: Anonymized packet-sampled traces collected from two transat-lantic links from a Tier-1 ISP, providing a view of back-officetraffic on long-distance links.
Access network: Anonymized packet dumps collected in a resi-dential network of a Tier-1 ISP, revealing front-office trafficbetween end users and servers.
CDN: Web server logs from multiple servers in different locationswithin a large commercial CDN. These logs give us an insideview of back-office traffic created by a CDN.
Active measurements: Probes of IP addresses and DNS reverselookups to identify Web servers.
This diverse set of traces allows us to study back-office trafficin a variety of locations, including between domains, on backbonelinks, and within a CDN. Table 1 summarizes the properties of ourdata sets.
The IXP traces are collected from the public switching infras-tructure at two European IXPs. This includes a large IXP (L-IXP)with around 500 members and a medium-sized IXP (M-IXP) witharound 100 members. Among the member ASes there are manyCDNs, Web hosting services, cloud providers, and large commer-cial Web sites. We collect sFlow records [51] with a 1 out of 16Ksampling rate. sFlow captures the first 128 bytes of each sampledEthernet frame, providing us access to full network- and transport-layer headers and some initial bytes of the payload, allowing fordeep packet inspection (DPI).
The ISP traces are collected from two transatlantic links on thebackbone of a large European Tier-1 ISP. These links carry mainlytransit traffic. We collect anonymized packet traces with a randompacket sampling rate of 1 out of 1K. We also collect unsampledanonymized packet dumps in a residential network with about 20Kend users of the same ISP.
The logs from the large commercial CDN encompass the activ-ity of all servers at one hosting location in each of five large cities.Each log entry contains TCP summary statistics including endpointIPs, number of bytes transferred, and initial TCP handshake round-trip latency. In addition, we received a complete list of all IP ad-dresses used by the CDN infrastructure.
We also use active measurement data from the ZMap Project [25].This data set contains a list of IPs, i.e., servers, that are responsiveto GET requests on port 80 (HTTP) and SSL services on port 443(HTTPS), spanning the time period from October 2013 to January2014. In addition, we also make use of the data made public by the
259
“Back office” web traffic:server-to-server rather than
directly communicating with user

Inter-data center traffic is significant
Back-Office Web Traffic on The Internet
Enric PujolTU Berlin
Philipp RichterTU Berlin
Balakrishnan ChandrasekaranDuke University
Georgios SmaragdakisMIT / TU Berlin / [email protected]
Anja FeldmannTU Berlin
Bruce MaggsDuke / Akamai
Keung-Chi NgAkamai
ABSTRACTAlthough traffic between Web servers and Web browsers is read-ily apparent to many knowledgeable end users, fewer are aware ofthe extent of server-to-server Web traffic carried over the publicInternet. We refer to the former class of traffic as front-office In-ternet Web traffic and the latter as back-office Internet Web traffic(or just front-office and back-office traffic, for short). Back-officetraffic, which may or may not be triggered by end-user activity, isessential for today’s Web as it supports a number of popular butcomplex Web services including large-scale content delivery, so-cial networking, indexing, searching, advertising, and proxy ser-vices. This paper takes a first look at back-office traffic, measuringit from various vantage points, including from within ISPs, IXPs,and CDNs. We describe techniques for identifying back-office traf-fic based on the roles that this traffic plays in the Web ecosystem.Our measurements show that back-office traffic accounts for a sig-nificant fraction not only of core Internet traffic, but also of Webtransactions in the terms of requests and responses. Finally, we dis-cuss the implications and opportunities that the presence of back-office traffic presents for the evolution of the Internet ecosystem.
Categories and Subject DescriptorsC.2.3 [Computer-Communication Networks]: Network Opera-tions.
KeywordsNetwork measurement; the Web; content delivery; online adver-tisements; real-time bidding; crawlers.
1. INTRODUCTIONThe Web has not only revolutionized the way people publish, ac-
cess, and search for content but, some would argue (e.g., [49]),has also evolved to become the new “narrow waist” of the Internet.Indeed, the HTTP protocol provides a common interface that manypopular Internet applications rely on, including video, social net-working, e-commerce, and software delivery. These applications
Permission to make digital or hard copies of all or part of this work for personal orclassroom use is granted without fee provided that copies are not made or distributedfor profit or commercial advantage and that copies bear this notice and the full cita-tion on the first page. Copyrights for components of this work owned by others thanACM must be honored. Abstracting with credit is permitted. To copy otherwise, or re-publish, to post on servers or to redistribute to lists, requires prior specific permissionand/or a fee. Request permissions from [email protected] ’14, November 5–7, 2014, Vancouver, BC, Canada.Copyright 2014 ACM 978-1-4503-3213-2/14/11 ...$15.00.http://dx.doi.org/10.1145/2663716.2663756.
front-office traffic back-office traffic
S1 S2
S3
S4
org. A
org. B
org. C
Figure 1: Front- vs. back-office Internet Web traffic.
are often supported by advertisements, which are also delivered viaHTTP.
Although an end user typically views a Web page as a unit, re-cent studies [17, 36] demonstrate that a single Web page often con-tains links to objects that are delivered by a large and diverse setof servers. For example, the creation of a single Web page may in-volve several Web companies as, e.g., parts of the Web page may beunder the control of a content provider, a Web advertiser, a videostreamer, a search engine, and/or a social network. Furthermore,even fetching an individual part of a Web page may involve manyparties. For example, when an end user requests Web content,the delivery involves not only the servers that receive HTTP re-quests from the end user’s browser, but also a whole service ecosys-tem consisting of proxies, content delivery networks (CDNs), ad-sellers, ad-bidders, back-end servers or databases, crawler bots, etc.
Thus, “there is more to content delivery than is visible to theeye,” and, consequently, this paper explores the distinction betweenfront-office and back-office Web traffic. The first refers to the traf-fic involving end users directly. The second refers to Web trafficexchanged between machines (e.g., the front-office servers and anyother server which is part of the Web service ecosystem). Figure 1depicts this distinction. Note that not all back-office Web traffictravels over the public Internet. Some is carried over private back-bones or within data centers. In this paper, we focus on back-officeWeb traffic on the public Internet. For short, we henceforth use theterm “front-office traffic” to refer to front-office Web traffic carriedon the public Internet and similarly for “back-office traffic.”
In contrast to back-office traffic, front-office traffic has long beenstudied, e.g., [8, 14, 17, 26, 27, 45, 47]. While there is some relatedwork on Machine-to-Machine traffic in specific environments, e.g.,in cellular networks [52] and within data centers [12, 13, 34], weare not aware of studies of back-office Web traffic on the publicInternet. Liang et al. studied security-related aspects arising fromCDN back-end communication [44] and for some specific otherservices, e.g., DNS, Gao et al. have characterized the correspond-ing Machine-to-Machine traffic [31].
The reason why previous work has focused mainly on front-office traffic is that end-user Quality of Experience (QoE) can beanalyzed by observing front-office traffic, but back-office traffic is
257
[IMC 2014]
(d) Crawlers
Web Crawler
S1 S2
S4S3
HTTP GET
(b) CDN Servers
Front-EndServer
Back-EndServer
Content OriginServer
CDN
HTTP GET
HTTP GET
(c) Ad Exchanges - Auctioneers and Bidders
Ad Publisher
Advertiser/Bidder A
Advertiser/Bidder B
Advertiser/Bidder C
Ad ExchangeAuctioneer
HTTPGET/POST
HTTP GET
Web ProxyS1 S2
S4S3
(a) Proxies/Intermediaries
HTTP GET/POSTHTTP GET/POST
front-office Web requests back-office Web requests
Figure 2: Back-office Web Traffic: typical HTTP requests made by Web proxies, CDNs, ad-exchanges, and crawlers.
overlays to improve end-to-end performance and for task sharingbetween front-end and back-end servers are deployed by today’sCDNs [43, 54, 28, 40, 21].
(c) Ad Exchanges – Auctioneers and Bidders: As shown inFigure 2(c), advertisement exchanges consist of (i) publishers thatsell advertisement space (ad space) on their Web pages, as well as(ii) advertisers that buy ad space on these Web pages. An exchangeacts as a common platform to bring publishers and advertisers to-gether. The matching between offered ad space on a Web site andinterested advertisers is often performed using real-time bidding(RTB). Once an end user visits a Web page where ad space is avail-able, the ad exchange auctioneer contacts the potential advertisers(i.e., the bidders), and provides information about the visitor to starta bidding process among the interested parties [10, 59, 55, 9].1 Anumber of sophisticated tools together with visitor information sup-pliers optimize the bidding process for both the advertisers and thepublishers. Hence, if RTB is used to place ads on a website, thevisit of a Web page by an end user may trigger a large number ofrequests in the background. The final advertisement content is typ-ically delivered via CDNs [9]. We note that today’s Web advertise-ment ecosystem is complex and may involve many different typesof back-office traffic, caused by a variety of different actors. Inthis paper, we solely focus on RTB-related activity, i.e., back-officetraffic as a result of auctioneers interacting with bidders.
(d) Crawlers: Web crawlers continuously index the Web. To op-timize crawling, each crawl bot is typically responsible for indexinga small part of the Web [11]. Indexing involves requesting the Webpage as well as following embedded links [38, 16]. Web crawlerstypically issue an order of magnitude more Web queries than reg-ular end users. Best practices among the major search engines en-sure that crawlers have appropriate reverse DNS entries along withwell-specified user agents in order to avoid being blocked by Websites.
Hereafter, we refer to back-office Web traffic as all Web traf-fic that is not exchanged between end users and servers. This in-cludes traffic exchanged between intermediaries and Web servers(e.g., traffic between a CDN front-end server and a back-end serveror between a Web proxy and a Web server), as well as traffic ex-changed between automated hosts such as crawlers or auctioneersand any other Web server.
3. DATA SETSIn this work we rely on measurements collected at a diverse set
of vantage points.1The bidders may also contact other entities (i.e., trackers) to getinformation regarding the profile of the visitor [33, 59].
IXPs: Packet-sampled traces collected at two Internet eXchangePoints (IXPs), which allow us to study back-office trafficin an inter-domain environment, as exchanged between hun-dreds of networks [6].
ISP: Anonymized packet-sampled traces collected from two transat-lantic links from a Tier-1 ISP, providing a view of back-officetraffic on long-distance links.
Access network: Anonymized packet dumps collected in a resi-dential network of a Tier-1 ISP, revealing front-office trafficbetween end users and servers.
CDN: Web server logs from multiple servers in different locationswithin a large commercial CDN. These logs give us an insideview of back-office traffic created by a CDN.
Active measurements: Probes of IP addresses and DNS reverselookups to identify Web servers.
This diverse set of traces allows us to study back-office trafficin a variety of locations, including between domains, on backbonelinks, and within a CDN. Table 1 summarizes the properties of ourdata sets.
The IXP traces are collected from the public switching infras-tructure at two European IXPs. This includes a large IXP (L-IXP)with around 500 members and a medium-sized IXP (M-IXP) witharound 100 members. Among the member ASes there are manyCDNs, Web hosting services, cloud providers, and large commer-cial Web sites. We collect sFlow records [51] with a 1 out of 16Ksampling rate. sFlow captures the first 128 bytes of each sampledEthernet frame, providing us access to full network- and transport-layer headers and some initial bytes of the payload, allowing fordeep packet inspection (DPI).
The ISP traces are collected from two transatlantic links on thebackbone of a large European Tier-1 ISP. These links carry mainlytransit traffic. We collect anonymized packet traces with a randompacket sampling rate of 1 out of 1K. We also collect unsampledanonymized packet dumps in a residential network with about 20Kend users of the same ISP.
The logs from the large commercial CDN encompass the activ-ity of all servers at one hosting location in each of five large cities.Each log entry contains TCP summary statistics including endpointIPs, number of bytes transferred, and initial TCP handshake round-trip latency. In addition, we received a complete list of all IP ad-dresses used by the CDN infrastructure.
We also use active measurement data from the ZMap Project [25].This data set contains a list of IPs, i.e., servers, that are responsiveto GET requests on port 80 (HTTP) and SSL services on port 443(HTTPS), spanning the time period from October 2013 to January2014. In addition, we also make use of the data made public by the
259
0
20
40
60
80
100
BytesRequests
BytesRequests
BytesRequests
BytesRequests
% b
ack-
offic
e w
eb tr
affic
IPs-CDNIPs-DPI+Manual - IPs-CDNIPs-ZMap - IPs-DPI+Manual - IPs-CDN
BBone-2BBone-1M-IXPL-IXP
(a) % of Web traffic which is back-office across vantage points.
0
10
20
30
40
50
0 24 48 72 96 120 144 168
% b
ack-
offic
e w
eb tr
affic
Elapsed hours since 00:00 CET
BBone-1L-IXPM-IXPBBone-2
(b) % of Web traffic which is back-office over time (IPs-ZMap).
Figure 4: Fraction of back-/front-office Web traffic across van-tage points.
CDN is not active here but most of its traffic is front-office traf-fic. In terms of requests, the fraction of requests associated withback-office traffic is even larger with a minimum of 9% when us-ing the IPs-CDN and IPs-DPI+Manual sets. This points out thatsome components of back-office traffic are associated with smallertransactions. But asymmetric routing—meaning the forward andreturn path do not use the same link— are likely the explanationfor the extreme difference at BBone-1, where we see a huge num-ber of back-office requests but only a relatively small percentage ofback-office bytes. When we include the ZMap server IPs, the per-centages of back-office traffic increases to more than 10% acrossall vantage points.
We next dissect the back-office traffic by type of activity usingthe IPs-DPI+Manual and the IPs-ZMap information. We illustrateour findings in Table 5, where we attribute back-office traffic tothe entity that acts as client. We find that CDPs contribute 11%and 12% to the back-office requests and bytes in the L-IXP trace.The crawlers contribute 15% and 10% to the back-office requestsand bytes, respectively. Surprisingly, the auctioneers are the bigcontributors to the number of requests with a share of 22% but only1% of the bytes. The rest of intermediaries contribute more than76% and 50% of the back-office bytes and requests. The situationdiffers for the other vantage points, where CDPs clearly dominatethe share of bytes and requests with at least 50% of the bytes and65% of the requests.
Figure 4(b) shows how the percentages of back- and front-officebytes change over time using time bins of one hour. The percent-ages never decrease below 5% but can even exceed 40%. Whilesome traffic is triggered by end-user action, activities such as crawl-ing and cache synchronization are not. We see that, particularly forthe two IXPs, the percentage of back-office traffic increases duringthe off-hours. The percentage of back-office traffic for BBone-2increases on the third day of the trace by more than 10%. This in-
Name % of CDPs Auctioneers Crawlers Other
L-IXP Bytes 12.1% 1.1% 10.3% 76.5%Requests 11.8% 22.5% 15.1% 50.6%
M-IXP Bytes 73.3% - 1.5% 25.2%Requests 65.7% - 3.2% 31.1%
BBone-1 Bytes 50.7% - <0.1% 49.2%Requests 95.3% - <0.1% 4.6%
BBone-2 Bytes 93.6% - <0.1% 6.3%Requests 73.7% - 4.3% 22%
Table 5: Classification of back-office Web traffic.
crease may be due to (a) a routing change or (b) a change in theoperation of the application infrastructure or (c) a change in thepopularity of a Web application. In addition, we see more variabil-ity for the individual backbone links than for the IXPs. A likelyexplanation for this is that the IXPs aggregate the information fromthousands of different peering links. Similar observations hold forthe percentages of back-/front-office requests and responses (notshown).
6.2 Across peering linksThe two backbone traces illustrate that there can be notable dif-
ferences in terms of percentages of back-office bytes and requestson different links, suggesting that links should be examined indi-vidually. Hence, we now take advantage of our ability to dissectthe traffic seen on hundreds of individual AS-AS links at L-IXP.
Figure 5(a) shows the fractions of back-office traffic per AS-ASlink (of the total traffic carried over it), where we sort them by thefraction of back-office Web traffic. We see that the fractions varydrastically from 100% to 0%. Indeed, 18.2% (10.9%) of the peer-ing links carry more than 15% (7%) back-office bytes when relyingon the IPs-ZMap + IPs-DPI+Manual (IPs-DPI+Manual) data set.On the other hand, 25.5% (40.8%) of the peering links carry noback-office traffic at all. In order to get a better understanding ofthe most important AS-AS links, we inspect more closely the top-10 traffic-carrying links that have a fraction of back-office trafficlarger than 95%. We find four links between cloud providers andcontent providers, three links between search engines and hostingproviders, two links between CDNs and content providers, and onelink between a content provider and an online advertisement com-pany. This analysis illustrates the diversity of the players contribut-ing to the back-office Web traffic.
If we aggregate the information to the level of IXP member-ASes, the overall observation does change a bit, as shown in Fig-ure 5(b). We do not see member ASes that exchange only back-office Web traffic. They all have at least 20% front-office Webtraffic. Nevertheless, most have some fraction of back-office traf-fic. There are 19.2% (18.0%) of the members with more than15% (7%) back-office bytes for the IPs-ZMap + IPs-DPI+Manual(IPs-DPI+Manual) data set. Among the networks with the highestshare of back-office traffic are cloud providers, hosting providers,a search engine, and an advertisement company.
SummaryWe find a significant percentage of back-office Web traffic in ourtraces, yet this percentage varies from vantage point to vantagepoint. Indeed, the back-office traffic carried over the backbonelinks is mostly dominated by CDPs. The picture differs when look-ing at IXPs, where we can monitor multiple links at once. Whilemost of the back-office traffic there is also due to CDPs and otherintermediaries, real-time-bidding and crawling also contribute asignificant share of bytes and Web requests. Our analysis illus-
264
% of web traffic that is “back office” in 4 ISP, IXP data sets
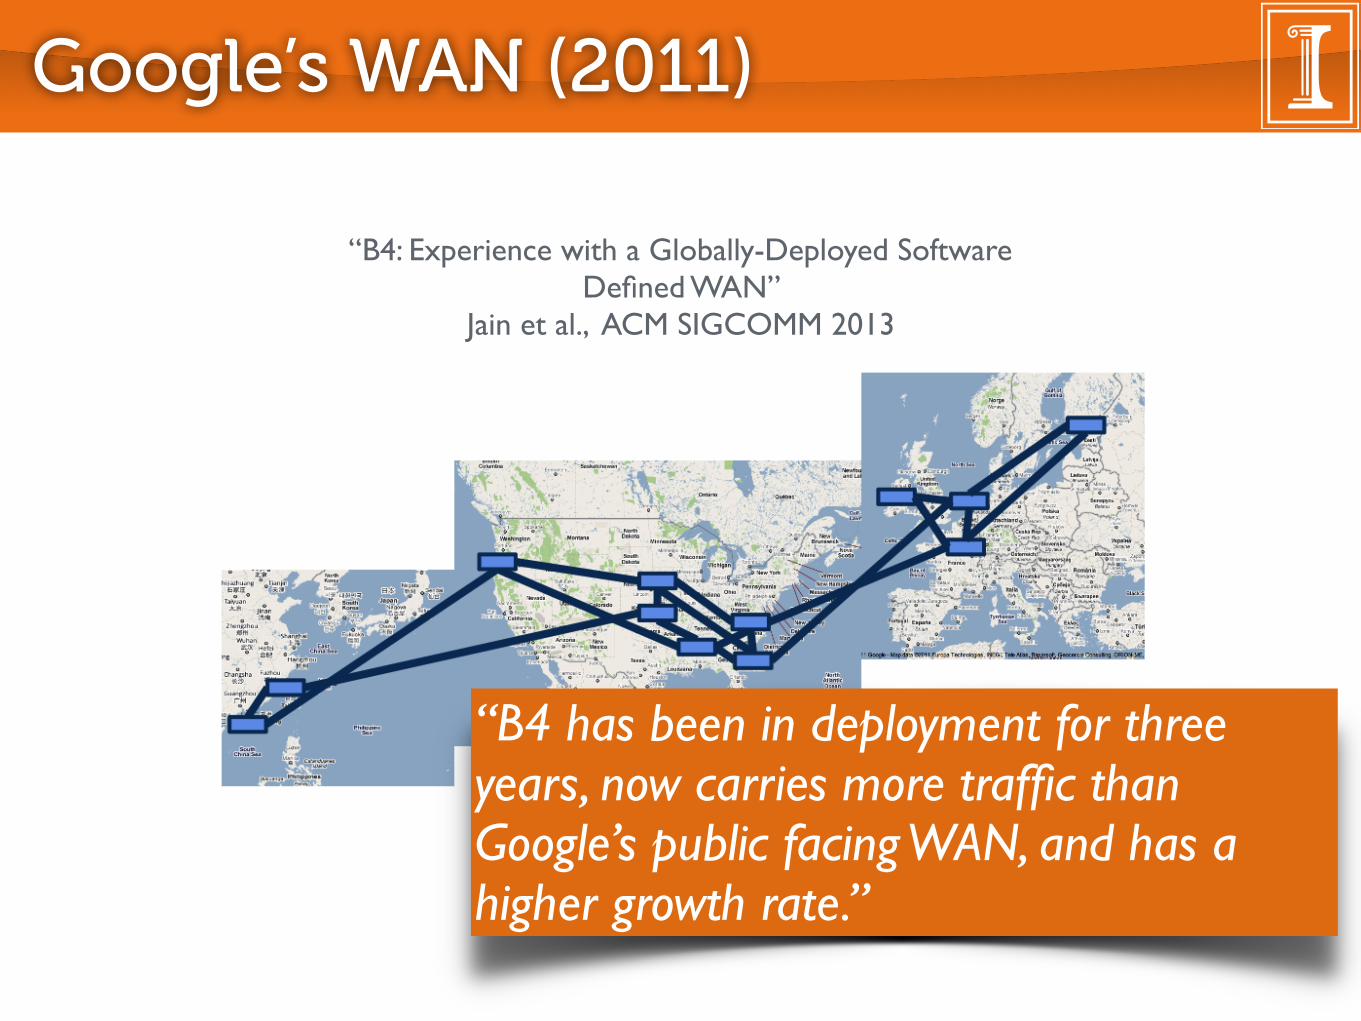
Google’s WAN (2011)
Figure �: B� worldwide deployment (����).
not a panacea; we summarize our experience with a large-scale B�outage, pointing to challenges in both SDN and large-scale networkmanagement. While our approach does not generalize to all WANsor SDNs, we hope that our experience will inform future design inboth domains.
2. BACKGROUNDBefore describing the architecture of our so�ware-de�nedWAN,
we provide an overview of our deployment environment and tar-get applications. Google’s WAN is among the largest in the Internet,delivering a range of search, video, cloud computing, and enterpriseapplications to users across the planet. �ese services run across acombination of data centers spread across the world, and edge de-ployments for cacheable content.
Architecturally, we operate two distinct WANs. Our user-facingnetwork peers with and exchanges tra�c with other Internet do-mains. End user requests and responses are delivered to our datacenters and edge caches across this network. �e second network,B�, provides connectivity among data centers (see Fig. �), e.g., forasynchronous data copies, index pushes for interactive serving sys-tems, and end user data replication for availability. Well over ���of internal application tra�c runs across this network.
We maintain two separate networks because they have di�erentrequirements. For example, our user-facing networking connectswith a range of gear and providers, and hence must support a widerange of protocols. Further, its physical topology will necessarily bemore dense than a network connecting a modest number of datacenters. Finally, in delivering content to end users, it must supportthe highest levels of availability.
�ousands of individual applications run across B�; here, we cat-egorize them into three classes: i) user data copies (e.g., email, doc-uments, audio/video �les) to remote data centers for availability/-durability, ii) remote storage access for computation over inherentlydistributed data sources, and iii) large-scale data push synchroniz-ing state across multiple data centers. �ese three tra�c classes areordered in increasing volume, decreasing latency sensitivity, and de-creasing overall priority. For example, user-data represents the low-est volume on B�, is the most latency sensitive, and is of the highestpriority.
�e scale of our network deployment strains both the capacityof commodity network hardware and the scalability, fault tolerance,and granularity of control available from network so�ware. Internetbandwidth as a whole continues to grow rapidly [��]. However, ourownWAN tra�c has been growing at an even faster rate.
Our decision to build B� around So�ware De�ned Networkingand OpenFlow [��] was driven by the observation that we could notachieve the level of scale, fault tolerance, cost e�ciency, and controlrequired for our network using traditional WAN architectures. Anumber of B�’s characteristics led to our design approach:
● Elastic bandwidth demands: �e majority of our data cen-ter tra�c involves synchronizing large data sets across sites.�ese applications bene�t from as much bandwidth as theycan get but can tolerate periodic failures with temporarybandwidth reductions.● Moderate number of sites: While B�must scale among multi-ple dimensions, targeting our data center deployments meantthat the total number of WAN sites would be a few dozen.● End application control: We control both the applications andthe site networks connected to B�. Hence, we can enforce rel-ative application priorities and control bursts at the networkedge, rather than through overprovisioning or complex func-tionality in B�.● Cost sensitivity: B�’s capacity targets and growth rate led tounsustainable cost projections. �e traditional approach ofprovisioningWAN links at ��-��� (or �-�x the cost of a fully-utilized WAN) to protect against failures and packet loss,combined with prevailing per-port router cost, would makeour network prohibitively expensive.
�ese considerations led to particular design decisions for B�,which we summarize in Table �. In particular, SDN gives us adedicated, so�ware-based control plane running on commodityservers, and the opportunity to reason about global state, yieldingvastly simpli�ed coordination and orchestration for both plannedand unplanned network changes. SDN also allows us to leveragethe raw speed of commodity servers; latest-generation servers aremuch faster than the embedded-class processor in most switches,and we can upgrade servers independently from the switch hard-ware. OpenFlow gives us an early investment in an SDN ecosys-tem that can leverage a variety of switch/data plane elements. Crit-ically, SDN/OpenFlow decouples so�ware and hardware evolution:control plane so�ware becomes simpler and evolves more quickly;data plane hardware evolves based on programmability and perfor-mance.We had several additional motivations for our so�ware de�ned
architecture, including: i) rapid iteration on novel protocols, ii) sim-pli�ed testing environments (e.g., we emulate our entire so�warestack running across the WAN in a local cluster), iii) improvedcapacity planning available from simulating a deterministic cen-tral TE server rather than trying to capture the asynchronous rout-ing behavior of distributed protocols, and iv) simpli�ed manage-ment through a fabric-centric rather than router-centricWAN view.However, we leave a description of these aspects to separate work.
3. DESIGNIn this section, we describe the details of our So�ware De�ned
WAN architecture.
3.1 OverviewOur SDN architecture can be logically viewed in three layers, de-
picted in Fig. �. B� serves multiple WAN sites, each with a num-ber of server clusters. Within each B� site, the switch hardwarelayer primarily forwards tra�c and does not run complex controlso�ware, and the site controller layer consists of Network ControlServers (NCS) hosting both OpenFlow controllers (OFC) and Net-work Control Applications (NCAs).�ese servers enable distributed routing and central tra�c engi-
neering as a routing overlay. OFCs maintain network state based onNCA directives and switch events and instruct switches to set for-warding table entries based on this changing network state. For faulttolerance of individual servers and control processes, a per-site in-
“B4: Experience with a Globally-Deployed Software Defined WAN”
Jain et al., ACM SIGCOMM 2013
“B4 has been in deployment for three years, now carries more traffic than Google’s public facing WAN, and has a higher growth rate.”

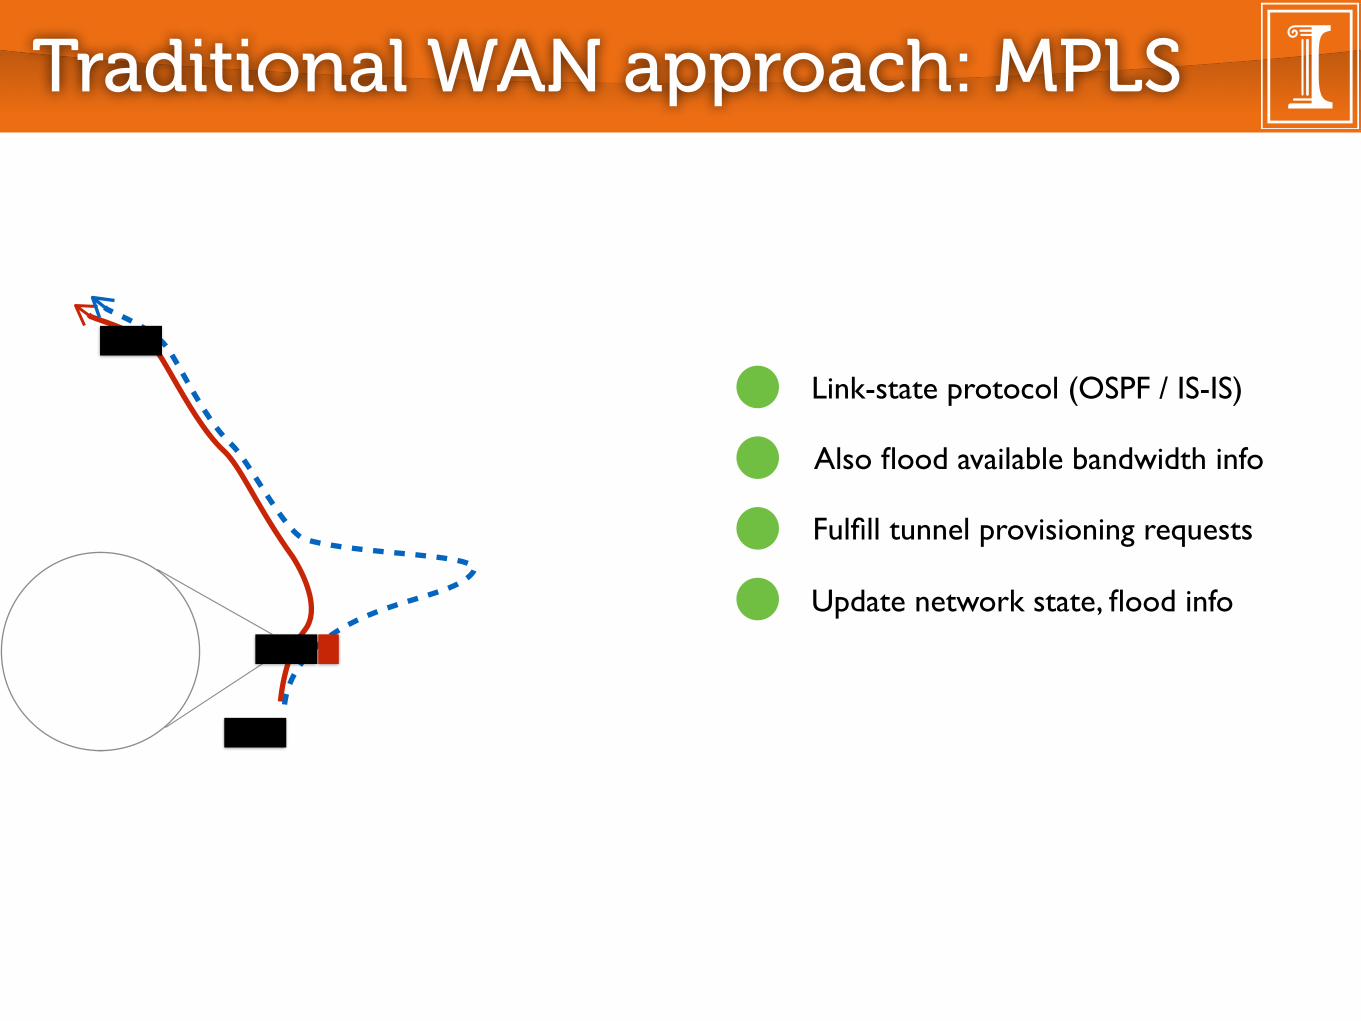
Traditional WAN approach: MPLS

Traditional WAN approach: MPLS
Link-state protocol (OSPF / IS-IS)

Traditional WAN approach: MPLS
Link-state protocol (OSPF / IS-IS)
Also flood available bandwidth info
Fulfill tunnel provisioning requests

Traditional WAN approach: MPLS
Update network state, flood info
Link-state protocol (OSPF / IS-IS)
Also flood available bandwidth info
Fulfill tunnel provisioning requests
Traditional WAN approach: MPLS
Update network state, flood info
Link-state protocol (OSPF / IS-IS)
Also flood available bandwidth info
Fulfill tunnel provisioning requests

Problem 1: inefficiency
Link-state protocol
Also flood available
Fulfill tunnel provisioning
Update network state, (a)
0 0.2 0.4 0.6 0.8
1Mean
PeakPeak-to-mean ratio = 2.17
(b)
traffi
c ra
te Background traffic
(c)
Figure 1: Illustration of poor utilization. (a) Daily tra�cpattern on a busy link in a production inter-DC WAN.(b) Breakdown based on tra�c type. (c) Reduction inpeak usage if background tra�c is dynamically adapted.
(a) Local path selection (b) Globally optimal paths
Figure 2: Ine�cient routing due to local allocation.
over- and under-subscription. Figure 1a shows the load overa day on a busy link in IDN. Assuming capacity matchespeak usage (a common provisioning model to avoid conges-tion), the average utilization on this link is under 50%. Thus,half the provisioned capacity is wasted. This ine�ciency isnot fundamental but can be remedied by exploiting tra�ccharacteristics. As a simple illustration, Figure 1b separatesbackground tra�c. Figure 1c shows that the same total traf-fic can fit in half the capacity if background tra�c is adaptedto use capacity left unused by other tra�c.
Second, the local, greedy resource allocation model ofMPLS TE is ine�cient. Consider Figure 2 in which eachlink can carry at most one flow. If the flows arrive in theorder FA, FB , and FC , Figure 2a shows the path assignmentwith MPLS TE: FA is assigned to the top path which is oneof the shortest paths; when FB arrives, it is assigned to theshortest path with available capacity (CSPF); and the samehappens with FC . Figure 2b shows a more e�cient routingpattern with shorter paths and many links freed up to carrymore tra�c. Such an allocation requires non-local changes,e.g., moving FA to the lower path when FB arrives.
Partial solutions for such ine�ciency exist. Flows canbe split across two tunnels, which would divide FA acrossthe top and bottom paths, allowing half of FB and FC touse direct paths; a preemption strategy that prefers shorterpaths can also help. But such strategies do not address thefundamental problem of local allocation decisions [27].
Poor sharing: Inter-DC WANs have limited support forflexible resource allocation. For instance, it is di�cult tobe fair across services or favor some services over certainpaths. When services compete today, they typically obtainthroughput proportional to their sending rate, an undesir-able outcome (e.g., it creates perverse incentives for servicedevelopers). Mapping each service onto its own queue atrouters can alleviate problems but the number of services(100s) far exceeds the number of available router queues.Even if we had infinite queues and could ensure fairness onthe data plane, network-wide fairness is not possible without
(a) Link-level (b) Network-wide
Figure 3: Link-level fairness 6= network-wide fairness.
controlling which flows have access to which paths. ConsiderFigure 3 in which each link has unit capacity and each ser-vice (Si!Di) has unit demand. With link-level fairness,S2
!D2
gets twice the throughput of other services. As weshow, flexible sharing can be implemented with a limitednumber of queues by carefully allocating paths to tra�c andcontrol the sending rate of services.
3. SWAN OVERVIEW AND CHALLENGESOur goal is to carry more tra�c and support flexible
network-wide sharing. Driven by inter-DC tra�c character-istics, SWAN supports two types of sharing policies. First,it supports a small number of priority classes (e.g., Inter-active > Elastic > Background) and allocates bandwidthin strict precedence across these classes, while preferringshorter paths for higher classes. Second, within a class,SWAN allocates bandwidth in a max-min fair manner.SWAN has two basic components that address the funda-
mental shortcomings of the current practice. It coordinatesthe network activity of services and uses centralized resourceallocation. Abstractly, it works as:
1. All services, except interactive ones, inform the SWAN
controller of their demand between pairs of DCs. In-teractive tra�c is sent like today, without permissionfrom the controller, so there is no delay.
2. The controller, which has an up-to-date, global view ofthe network topology and tra�c demands, computeshow much each service can send and the network pathsthat can accommodate the tra�c.
3. Per SDN paradigm, the controller directly updates theforwarding state of the switches. We use OpenFlowswitches, though any switch that permits direct pro-gramming of forwarding state (e.g., MPLS ExplicitRoute Objects [3]) may be used.
While the architecture is conceptually simple, we must ad-dress three challenges to realize this design. First, we needa scalable algorithm for global allocation that maximizesnetwork utilization subject to constraints on service prior-ity and fairness. Best known solutions are computationallyintensive as they solve long sequences of linear programs(LP) [9, 26]. Instead, SWAN uses a more practical approachthat is approximately fair with provable bounds and closeto optimal in practical scenarios (§6).Second, atomic reconfiguration of a distributed system of
switches is hard to engineer. Network forwarding state needsupdating in response to changes in the tra�c demand ornetwork topology. Lacking WAN-wide atomic changes, thenetwork can drop many packets due to transient congestioneven if both the initial and final configurations are uncon-gested. Consider Figure 4 in which each flow is 1 unit andeach link’s capacity is 1.5 units. Suppose we want to changethe network’s forwarding state from Figure 4a to 4b, perhapsto accommodate a new flow from R
2
to R4
. This change re-quires changes to at least two switches. Depending on the
Achieving High Utilization with Software-Driven WAN
Chi-Yao Hong (UIUC) Srikanth Kandula Ratul Mahajan Ming ZhangVijay Gill Mohan Nanduri Roger Wattenhofer (ETH)
Microsoft
Abstract— We present SWAN, a system that boosts theutilization of inter-datacenter networks by centrally control-ling when and how much tra�c each service sends and fre-quently re-configuring the network’s data plane to matchcurrent tra�c demand. But done simplistically, these re-configurations can also cause severe, transient congestionbecause di↵erent switches may apply updates at di↵erenttimes. We develop a novel technique that leverages a smallamount of scratch capacity on links to apply updates in aprovably congestion-free manner, without making any as-sumptions about the order and timing of updates at individ-ual switches. Further, to scale to large networks in the faceof limited forwarding table capacity, SWAN greedily selectsa small set of entries that can best satisfy current demand.It updates this set without disrupting tra�c by leveraging asmall amount of scratch capacity in forwarding tables. Ex-periments using a testbed prototype and data-driven simu-lations of two production networks show that SWAN carries60% more tra�c than the current practice.
Categories and Subject Descriptors: C.2.1 [Computer-
Communication Networks]: Network Architecture and Design
Keywords: Inter-DC WAN; software-defined networking
1. INTRODUCTIONThe wide area network (WAN) that connects the data-
centers (DC) is critical infrastructure for providers of onlineservices such as Amazon, Google, and Microsoft. Many ser-vices rely on low-latency inter-DC communication for gooduser experience and on high-throughput transfers for relia-bility (e.g., when replicating updates). Given the need forhigh capacity—inter-DC tra�c is a significant fraction ofInternet tra�c and rapidly growing [20]—and unique traf-fic characteristics, the inter-DC WAN is often a dedicatednetwork, distinct from the WAN that connects with ISPs toreach end users [15]. It is an expensive resource, with amor-tized annual cost of 100s of millions of dollars, as it provides100s of Gbps to Tbps of capacity over long distances.
However, providers are unable to fully leverage this in-vestment today. Inter-DC WANs have extremely poor ef-ficiency; the average utilization of even the busier links is40-60%. One culprit is the lack of coordination among theservices that use the network. Barring coarse, static limits
Permission to make digital or hard copies of all or part of this work for personal orclassroom use is granted without fee provided that copies are not made or distributedfor profit or commercial advantage and that copies bear this notice and the full cita-tion on the first page. Copyrights for components of this work owned by others thanACM must be honored. Abstracting with credit is permitted. To copy otherwise, or re-publish, to post on servers or to redistribute to lists, requires prior specific permissionand/or a fee. Request permissions from [email protected]’13, August 12–16, 2013, Hong Kong, China.Copyright 2013 ACM 978-1-4503-2056-6/13/08 ...$15.00.
in some cases, services send tra�c whenever they want andhowever much they want. As a result, the network cyclesthrough periods of peaks and troughs. Since it must be pro-visioned for peak usage to avoid congestion, the network isunder-subscribed on average. Observe that network usagedoes not have to be this way if we can exploit the char-acteristics of inter-DC tra�c. Some inter-DC services aredelay-tolerant. We can tamp the cyclical behavior if suchtra�c is sent when the demand from other tra�c is low.This coordination will boost average utilization and enablethe network to either carry more tra�c with the same ca-pacity or use less capacity to carry the same tra�c.1
Another culprit behind poor e�ciency is the distributedresource allocation model of today, typically implementedusing MPLS TE (Multiprotocol Label Switching Tra�c En-gineering) [4, 24]. In this model, no entity has a global viewand ingress routers greedily select paths for their tra�c. Asa result, the network can get stuck in locally optimal routingpatterns that are globally suboptimal [27].We present SWAN (Software-driven WAN), a system that
enables inter-DC WANs to carry significantly more tra�c.By itself, carrying more tra�c is straightforward—we can letloose bandwidth-hungry services. SWAN achieves high e�-ciency while meeting policy goals such as preferential treat-ment for higher-priority services and fairness among similarservices. Per observations above, its two key aspects are i)globally coordinating the sending rates of services; and ii)centrally allocating network paths. Based on current servicedemands and network topology, SWAN decides how muchtra�c each service can send and configures the network’sdata plane to carry that tra�c.Maintaining high utilization requires frequent updates to
the network’s data plane, as tra�c demand or network topol-ogy changes. A key challenge is to implement these updateswithout causing transient congestion that can hurt latency-sensitive tra�c. The underlying problem is that the updatesare not atomic as they require changes to multiple switches.Even if the before and after states are not congested, con-gestion can occur during updates if tra�c that a link is sup-posed to carry after the update arrives before the tra�cthat is supposed to leave has left. The extent and durationof such congestion is worse when the network is busier andhas larger RTTs (which lead to greater temporal disparityin the application of updates). Both these conditions hold
1In some networks, fault tolerance is another reason for lowutilization; the network is provisioned such that there is am-ple capacity even after (common) failures. However, in inter-DC WANs, tra�c that needs strong protection is a smallsubset of the overall tra�c, and existing technologies cantag and protect such tra�c in the face of failures (§2).
ACM SIGCOMM, 2013
Time
Utilization
(a)
(b)
(c)
0 0.2 0.4 0.6 0.8
1
traffi
c ra
te
>50% peak reductionPeak after adapting
Peak before adapting
Figure 1: Illustration of poor utilization. (a) Daily tra�cpattern on a busy link in a production inter-DC WAN.(b) Breakdown based on tra�c type. (c) Reduction inpeak usage if background tra�c is dynamically adapted.
(a) Local path selection (b) Globally optimal paths
Figure 2: Ine�cient routing due to local allocation.
over- and under-subscription. Figure 1a shows the load overa day on a busy link in IDN. Assuming capacity matchespeak usage (a common provisioning model to avoid conges-tion), the average utilization on this link is under 50%. Thus,half the provisioned capacity is wasted. This ine�ciency isnot fundamental but can be remedied by exploiting tra�ccharacteristics. As a simple illustration, Figure 1b separatesbackground tra�c. Figure 1c shows that the same total traf-fic can fit in half the capacity if background tra�c is adaptedto use capacity left unused by other tra�c.
Second, the local, greedy resource allocation model ofMPLS TE is ine�cient. Consider Figure 2 in which eachlink can carry at most one flow. If the flows arrive in theorder FA, FB , and FC , Figure 2a shows the path assignmentwith MPLS TE: FA is assigned to the top path which is oneof the shortest paths; when FB arrives, it is assigned to theshortest path with available capacity (CSPF); and the samehappens with FC . Figure 2b shows a more e�cient routingpattern with shorter paths and many links freed up to carrymore tra�c. Such an allocation requires non-local changes,e.g., moving FA to the lower path when FB arrives.
Partial solutions for such ine�ciency exist. Flows canbe split across two tunnels, which would divide FA acrossthe top and bottom paths, allowing half of FB and FC touse direct paths; a preemption strategy that prefers shorterpaths can also help. But such strategies do not address thefundamental problem of local allocation decisions [27].
Poor sharing: Inter-DC WANs have limited support forflexible resource allocation. For instance, it is di�cult tobe fair across services or favor some services over certainpaths. When services compete today, they typically obtainthroughput proportional to their sending rate, an undesir-able outcome (e.g., it creates perverse incentives for servicedevelopers). Mapping each service onto its own queue atrouters can alleviate problems but the number of services(100s) far exceeds the number of available router queues.Even if we had infinite queues and could ensure fairness onthe data plane, network-wide fairness is not possible without
(a) Link-level (b) Network-wide
Figure 3: Link-level fairness 6= network-wide fairness.
controlling which flows have access to which paths. ConsiderFigure 3 in which each link has unit capacity and each ser-vice (Si!Di) has unit demand. With link-level fairness,S2
!D2
gets twice the throughput of other services. As weshow, flexible sharing can be implemented with a limitednumber of queues by carefully allocating paths to tra�c andcontrol the sending rate of services.
3. SWAN OVERVIEW AND CHALLENGESOur goal is to carry more tra�c and support flexible
network-wide sharing. Driven by inter-DC tra�c character-istics, SWAN supports two types of sharing policies. First,it supports a small number of priority classes (e.g., Inter-active > Elastic > Background) and allocates bandwidthin strict precedence across these classes, while preferringshorter paths for higher classes. Second, within a class,SWAN allocates bandwidth in a max-min fair manner.SWAN has two basic components that address the funda-
mental shortcomings of the current practice. It coordinatesthe network activity of services and uses centralized resourceallocation. Abstractly, it works as:
1. All services, except interactive ones, inform the SWAN
controller of their demand between pairs of DCs. In-teractive tra�c is sent like today, without permissionfrom the controller, so there is no delay.
2. The controller, which has an up-to-date, global view ofthe network topology and tra�c demands, computeshow much each service can send and the network pathsthat can accommodate the tra�c.
3. Per SDN paradigm, the controller directly updates theforwarding state of the switches. We use OpenFlowswitches, though any switch that permits direct pro-gramming of forwarding state (e.g., MPLS ExplicitRoute Objects [3]) may be used.
While the architecture is conceptually simple, we must ad-dress three challenges to realize this design. First, we needa scalable algorithm for global allocation that maximizesnetwork utilization subject to constraints on service prior-ity and fairness. Best known solutions are computationallyintensive as they solve long sequences of linear programs(LP) [9, 26]. Instead, SWAN uses a more practical approachthat is approximately fair with provable bounds and closeto optimal in practical scenarios (§6).Second, atomic reconfiguration of a distributed system of
switches is hard to engineer. Network forwarding state needsupdating in response to changes in the tra�c demand ornetwork topology. Lacking WAN-wide atomic changes, thenetwork can drop many packets due to transient congestioneven if both the initial and final configurations are uncon-gested. Consider Figure 4 in which each flow is 1 unit andeach link’s capacity is 1.5 units. Suppose we want to changethe network’s forwarding state from Figure 4a to 4b, perhapsto accommodate a new flow from R
2
to R4
. This change re-quires changes to at least two switches. Depending on the
(a)
(b)
0 0.2 0.4 0.6 0.8
1
traffi
c ra
te Background trafficNon-background traffic
(c)
Figure 1: Illustration of poor utilization. (a) Daily tra�cpattern on a busy link in a production inter-DC WAN.(b) Breakdown based on tra�c type. (c) Reduction inpeak usage if background tra�c is dynamically adapted.
(a) Local path selection (b) Globally optimal paths
Figure 2: Ine�cient routing due to local allocation.
over- and under-subscription. Figure 1a shows the load overa day on a busy link in IDN. Assuming capacity matchespeak usage (a common provisioning model to avoid conges-tion), the average utilization on this link is under 50%. Thus,half the provisioned capacity is wasted. This ine�ciency isnot fundamental but can be remedied by exploiting tra�ccharacteristics. As a simple illustration, Figure 1b separatesbackground tra�c. Figure 1c shows that the same total traf-fic can fit in half the capacity if background tra�c is adaptedto use capacity left unused by other tra�c.
Second, the local, greedy resource allocation model ofMPLS TE is ine�cient. Consider Figure 2 in which eachlink can carry at most one flow. If the flows arrive in theorder FA, FB , and FC , Figure 2a shows the path assignmentwith MPLS TE: FA is assigned to the top path which is oneof the shortest paths; when FB arrives, it is assigned to theshortest path with available capacity (CSPF); and the samehappens with FC . Figure 2b shows a more e�cient routingpattern with shorter paths and many links freed up to carrymore tra�c. Such an allocation requires non-local changes,e.g., moving FA to the lower path when FB arrives.
Partial solutions for such ine�ciency exist. Flows canbe split across two tunnels, which would divide FA acrossthe top and bottom paths, allowing half of FB and FC touse direct paths; a preemption strategy that prefers shorterpaths can also help. But such strategies do not address thefundamental problem of local allocation decisions [27].
Poor sharing: Inter-DC WANs have limited support forflexible resource allocation. For instance, it is di�cult tobe fair across services or favor some services over certainpaths. When services compete today, they typically obtainthroughput proportional to their sending rate, an undesir-able outcome (e.g., it creates perverse incentives for servicedevelopers). Mapping each service onto its own queue atrouters can alleviate problems but the number of services(100s) far exceeds the number of available router queues.Even if we had infinite queues and could ensure fairness onthe data plane, network-wide fairness is not possible without
(a) Link-level (b) Network-wide
Figure 3: Link-level fairness 6= network-wide fairness.
controlling which flows have access to which paths. ConsiderFigure 3 in which each link has unit capacity and each ser-vice (Si!Di) has unit demand. With link-level fairness,S2
!D2
gets twice the throughput of other services. As weshow, flexible sharing can be implemented with a limitednumber of queues by carefully allocating paths to tra�c andcontrol the sending rate of services.
3. SWAN OVERVIEW AND CHALLENGESOur goal is to carry more tra�c and support flexible
network-wide sharing. Driven by inter-DC tra�c character-istics, SWAN supports two types of sharing policies. First,it supports a small number of priority classes (e.g., Inter-active > Elastic > Background) and allocates bandwidthin strict precedence across these classes, while preferringshorter paths for higher classes. Second, within a class,SWAN allocates bandwidth in a max-min fair manner.SWAN has two basic components that address the funda-
mental shortcomings of the current practice. It coordinatesthe network activity of services and uses centralized resourceallocation. Abstractly, it works as:
1. All services, except interactive ones, inform the SWAN
controller of their demand between pairs of DCs. In-teractive tra�c is sent like today, without permissionfrom the controller, so there is no delay.
2. The controller, which has an up-to-date, global view ofthe network topology and tra�c demands, computeshow much each service can send and the network pathsthat can accommodate the tra�c.
3. Per SDN paradigm, the controller directly updates theforwarding state of the switches. We use OpenFlowswitches, though any switch that permits direct pro-gramming of forwarding state (e.g., MPLS ExplicitRoute Objects [3]) may be used.
While the architecture is conceptually simple, we must ad-dress three challenges to realize this design. First, we needa scalable algorithm for global allocation that maximizesnetwork utilization subject to constraints on service prior-ity and fairness. Best known solutions are computationallyintensive as they solve long sequences of linear programs(LP) [9, 26]. Instead, SWAN uses a more practical approachthat is approximately fair with provable bounds and closeto optimal in practical scenarios (§6).Second, atomic reconfiguration of a distributed system of
switches is hard to engineer. Network forwarding state needsupdating in response to changes in the tra�c demand ornetwork topology. Lacking WAN-wide atomic changes, thenetwork can drop many packets due to transient congestioneven if both the initial and final configurations are uncon-gested. Consider Figure 4 in which each flow is 1 unit andeach link’s capacity is 1.5 units. Suppose we want to changethe network’s forwarding state from Figure 4a to 4b, perhapsto accommodate a new flow from R
2
to R4
. This change re-quires changes to at least two switches. Depending on the

Problem 2: inflexible sharing
2x the bandwidth!

B4 key design decisions
[Jain et al., SIGCOMM 2013]
Separate hardware from software
B4 routers custom-built from merchant silicon
Drive links to 100% utilization
Centralized traffic engineering

Google’s B4
“B4: Experience with a Globally-Deployed Software Defined WAN”
Jain et al., ACM SIGCOMM 2013
Figure �: B� worldwide deployment (����).
not a panacea; we summarize our experience with a large-scale B�outage, pointing to challenges in both SDN and large-scale networkmanagement. While our approach does not generalize to all WANsor SDNs, we hope that our experience will inform future design inboth domains.
2. BACKGROUNDBefore describing the architecture of our so�ware-de�nedWAN,
we provide an overview of our deployment environment and tar-get applications. Google’s WAN is among the largest in the Internet,delivering a range of search, video, cloud computing, and enterpriseapplications to users across the planet. �ese services run across acombination of data centers spread across the world, and edge de-ployments for cacheable content.
Architecturally, we operate two distinct WANs. Our user-facingnetwork peers with and exchanges tra�c with other Internet do-mains. End user requests and responses are delivered to our datacenters and edge caches across this network. �e second network,B�, provides connectivity among data centers (see Fig. �), e.g., forasynchronous data copies, index pushes for interactive serving sys-tems, and end user data replication for availability. Well over ���of internal application tra�c runs across this network.
We maintain two separate networks because they have di�erentrequirements. For example, our user-facing networking connectswith a range of gear and providers, and hence must support a widerange of protocols. Further, its physical topology will necessarily bemore dense than a network connecting a modest number of datacenters. Finally, in delivering content to end users, it must supportthe highest levels of availability.
�ousands of individual applications run across B�; here, we cat-egorize them into three classes: i) user data copies (e.g., email, doc-uments, audio/video �les) to remote data centers for availability/-durability, ii) remote storage access for computation over inherentlydistributed data sources, and iii) large-scale data push synchroniz-ing state across multiple data centers. �ese three tra�c classes areordered in increasing volume, decreasing latency sensitivity, and de-creasing overall priority. For example, user-data represents the low-est volume on B�, is the most latency sensitive, and is of the highestpriority.
�e scale of our network deployment strains both the capacityof commodity network hardware and the scalability, fault tolerance,and granularity of control available from network so�ware. Internetbandwidth as a whole continues to grow rapidly [��]. However, ourownWAN tra�c has been growing at an even faster rate.
Our decision to build B� around So�ware De�ned Networkingand OpenFlow [��] was driven by the observation that we could notachieve the level of scale, fault tolerance, cost e�ciency, and controlrequired for our network using traditional WAN architectures. Anumber of B�’s characteristics led to our design approach:
● Elastic bandwidth demands: �e majority of our data cen-ter tra�c involves synchronizing large data sets across sites.�ese applications bene�t from as much bandwidth as theycan get but can tolerate periodic failures with temporarybandwidth reductions.● Moderate number of sites: While B�must scale among multi-ple dimensions, targeting our data center deployments meantthat the total number of WAN sites would be a few dozen.● End application control: We control both the applications andthe site networks connected to B�. Hence, we can enforce rel-ative application priorities and control bursts at the networkedge, rather than through overprovisioning or complex func-tionality in B�.● Cost sensitivity: B�’s capacity targets and growth rate led tounsustainable cost projections. �e traditional approach ofprovisioningWAN links at ��-��� (or �-�x the cost of a fully-utilized WAN) to protect against failures and packet loss,combined with prevailing per-port router cost, would makeour network prohibitively expensive.
�ese considerations led to particular design decisions for B�,which we summarize in Table �. In particular, SDN gives us adedicated, so�ware-based control plane running on commodityservers, and the opportunity to reason about global state, yieldingvastly simpli�ed coordination and orchestration for both plannedand unplanned network changes. SDN also allows us to leveragethe raw speed of commodity servers; latest-generation servers aremuch faster than the embedded-class processor in most switches,and we can upgrade servers independently from the switch hard-ware. OpenFlow gives us an early investment in an SDN ecosys-tem that can leverage a variety of switch/data plane elements. Crit-ically, SDN/OpenFlow decouples so�ware and hardware evolution:control plane so�ware becomes simpler and evolves more quickly;data plane hardware evolves based on programmability and perfor-mance.We had several additional motivations for our so�ware de�ned
architecture, including: i) rapid iteration on novel protocols, ii) sim-pli�ed testing environments (e.g., we emulate our entire so�warestack running across the WAN in a local cluster), iii) improvedcapacity planning available from simulating a deterministic cen-tral TE server rather than trying to capture the asynchronous rout-ing behavior of distributed protocols, and iv) simpli�ed manage-ment through a fabric-centric rather than router-centricWAN view.However, we leave a description of these aspects to separate work.
3. DESIGNIn this section, we describe the details of our So�ware De�ned
WAN architecture.
3.1 OverviewOur SDN architecture can be logically viewed in three layers, de-
picted in Fig. �. B� serves multiple WAN sites, each with a num-ber of server clusters. Within each B� site, the switch hardwarelayer primarily forwards tra�c and does not run complex controlso�ware, and the site controller layer consists of Network ControlServers (NCS) hosting both OpenFlow controllers (OFC) and Net-work Control Applications (NCAs).�ese servers enable distributed routing and central tra�c engi-
neering as a routing overlay. OFCs maintain network state based onNCA directives and switch events and instruct switches to set for-warding table entries based on this changing network state. For faulttolerance of individual servers and control processes, a per-site in-
circa 2011

Google’s B4
“B4: Experience with a Globally-Deployed Software Defined WAN”
Jain et al., ACM SIGCOMM 2013
Figure �: B� worldwide deployment (����).
not a panacea; we summarize our experience with a large-scale B�outage, pointing to challenges in both SDN and large-scale networkmanagement. While our approach does not generalize to all WANsor SDNs, we hope that our experience will inform future design inboth domains.
2. BACKGROUNDBefore describing the architecture of our so�ware-de�nedWAN,
we provide an overview of our deployment environment and tar-get applications. Google’s WAN is among the largest in the Internet,delivering a range of search, video, cloud computing, and enterpriseapplications to users across the planet. �ese services run across acombination of data centers spread across the world, and edge de-ployments for cacheable content.
Architecturally, we operate two distinct WANs. Our user-facingnetwork peers with and exchanges tra�c with other Internet do-mains. End user requests and responses are delivered to our datacenters and edge caches across this network. �e second network,B�, provides connectivity among data centers (see Fig. �), e.g., forasynchronous data copies, index pushes for interactive serving sys-tems, and end user data replication for availability. Well over ���of internal application tra�c runs across this network.
We maintain two separate networks because they have di�erentrequirements. For example, our user-facing networking connectswith a range of gear and providers, and hence must support a widerange of protocols. Further, its physical topology will necessarily bemore dense than a network connecting a modest number of datacenters. Finally, in delivering content to end users, it must supportthe highest levels of availability.
�ousands of individual applications run across B�; here, we cat-egorize them into three classes: i) user data copies (e.g., email, doc-uments, audio/video �les) to remote data centers for availability/-durability, ii) remote storage access for computation over inherentlydistributed data sources, and iii) large-scale data push synchroniz-ing state across multiple data centers. �ese three tra�c classes areordered in increasing volume, decreasing latency sensitivity, and de-creasing overall priority. For example, user-data represents the low-est volume on B�, is the most latency sensitive, and is of the highestpriority.
�e scale of our network deployment strains both the capacityof commodity network hardware and the scalability, fault tolerance,and granularity of control available from network so�ware. Internetbandwidth as a whole continues to grow rapidly [��]. However, ourownWAN tra�c has been growing at an even faster rate.
Our decision to build B� around So�ware De�ned Networkingand OpenFlow [��] was driven by the observation that we could notachieve the level of scale, fault tolerance, cost e�ciency, and controlrequired for our network using traditional WAN architectures. Anumber of B�’s characteristics led to our design approach:
● Elastic bandwidth demands: �e majority of our data cen-ter tra�c involves synchronizing large data sets across sites.�ese applications bene�t from as much bandwidth as theycan get but can tolerate periodic failures with temporarybandwidth reductions.● Moderate number of sites: While B�must scale among multi-ple dimensions, targeting our data center deployments meantthat the total number of WAN sites would be a few dozen.● End application control: We control both the applications andthe site networks connected to B�. Hence, we can enforce rel-ative application priorities and control bursts at the networkedge, rather than through overprovisioning or complex func-tionality in B�.● Cost sensitivity: B�’s capacity targets and growth rate led tounsustainable cost projections. �e traditional approach ofprovisioningWAN links at ��-��� (or �-�x the cost of a fully-utilized WAN) to protect against failures and packet loss,combined with prevailing per-port router cost, would makeour network prohibitively expensive.
�ese considerations led to particular design decisions for B�,which we summarize in Table �. In particular, SDN gives us adedicated, so�ware-based control plane running on commodityservers, and the opportunity to reason about global state, yieldingvastly simpli�ed coordination and orchestration for both plannedand unplanned network changes. SDN also allows us to leveragethe raw speed of commodity servers; latest-generation servers aremuch faster than the embedded-class processor in most switches,and we can upgrade servers independently from the switch hard-ware. OpenFlow gives us an early investment in an SDN ecosys-tem that can leverage a variety of switch/data plane elements. Crit-ically, SDN/OpenFlow decouples so�ware and hardware evolution:control plane so�ware becomes simpler and evolves more quickly;data plane hardware evolves based on programmability and perfor-mance.We had several additional motivations for our so�ware de�ned
architecture, including: i) rapid iteration on novel protocols, ii) sim-pli�ed testing environments (e.g., we emulate our entire so�warestack running across the WAN in a local cluster), iii) improvedcapacity planning available from simulating a deterministic cen-tral TE server rather than trying to capture the asynchronous rout-ing behavior of distributed protocols, and iv) simpli�ed manage-ment through a fabric-centric rather than router-centricWAN view.However, we leave a description of these aspects to separate work.
3. DESIGNIn this section, we describe the details of our So�ware De�ned
WAN architecture.
3.1 OverviewOur SDN architecture can be logically viewed in three layers, de-
picted in Fig. �. B� serves multiple WAN sites, each with a num-ber of server clusters. Within each B� site, the switch hardwarelayer primarily forwards tra�c and does not run complex controlso�ware, and the site controller layer consists of Network ControlServers (NCS) hosting both OpenFlow controllers (OFC) and Net-work Control Applications (NCAs).�ese servers enable distributed routing and central tra�c engi-
neering as a routing overlay. OFCs maintain network state based onNCA directives and switch events and instruct switches to set for-warding table entries based on this changing network state. For faulttolerance of individual servers and control processes, a per-site in-
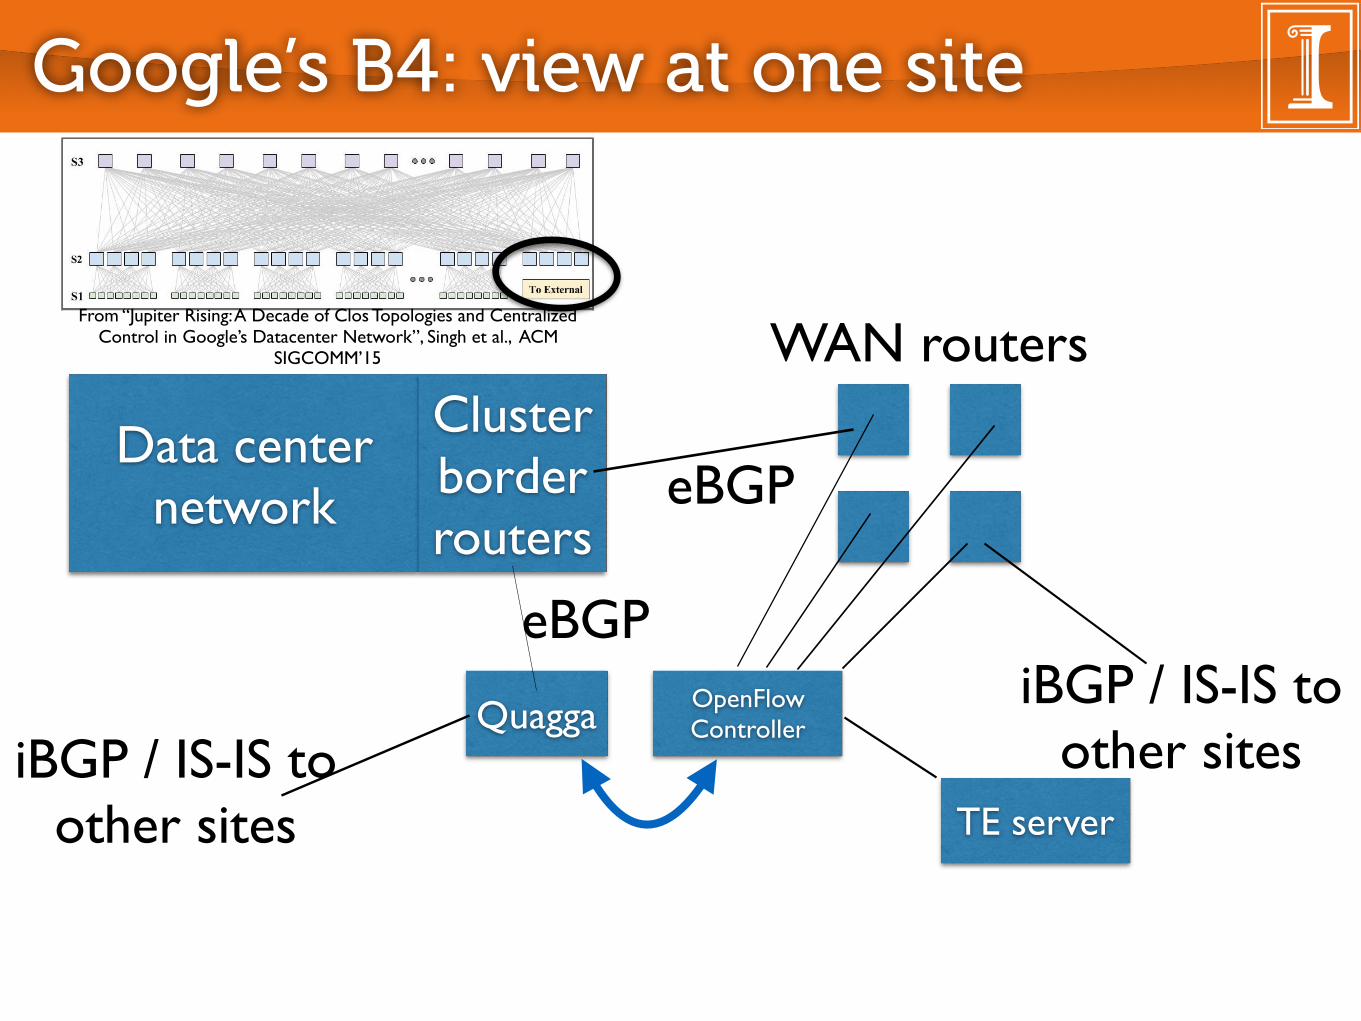
Google’s B4: view at one site
Data center network
Cluster border routers
WAN routers
iBGP / IS-IS to other sites
eBGP
Quagga OpenFlow Controller
eBGP
iBGP / IS-IS to other sites TE server
Figure 8: Firehose 1.1 deployed as a bag-on-the-side Closfabric.
Figure 9: A 128x10G port Watchtower chassis (top left).The internal non-blocking topology over eight linecards(bottom left). Four chassis housed in two racks cabled withfiber (right).
cific intra-cluster tra�c would use the uplinks to Fire-hose 1.1. Since our four-post cluster employed 1G links,we only needed to reserve four 1GE ToR ports. We builta Big Red Button fail-safe to configure the ToRs to avoidFirehose uplinks in case of catastrophic failure.
3.3 Watchtower: Global DeploymentOur deployment experience with Firehose 1.1 was
largely positive. We showed that services could en-joy substantially more bandwidth than with traditionalarchitectures, all with lower cost per unit bandwidth.Firehose 1.1 went into production with a handful of clus-ters and remained operational until recently. The maindrawback to Firehose 1.1 was the deployment challengeswith the external copper cabling.
We used these experiences to design Watchtower, ourthird-generation cluster fabric. The key idea was toleverage the next-generation merchant silicon switchchips, 16x10G, to build a traditional switch chassis witha backplane. Figure 9 shows the half rack Watchtower
Figure 10: Reducing deployment complexity by bundlingcables. Stages 1, 2 and 3 in the fabric are labeled S1, S2 andS3, respectively.
# Individual cables 15872# S2-S3 bundles (16-way) 512Normalized cost of fiber/m in 16-way bundle 55%# S2-ToR bundles (8-way) 960Normalized cost of fiber/m in 8-way bundle 60%# Total cable bundles 1472Normalized cost of fiber/m with bundling(capex + opex)
57%
Table 3: Benefits of cable bundling in Watchtower.
chassis along with its internal topology and cabling.Watchtower consists of eight line cards, each with threeswitch chips. Two chips on each linecard have half theirports externally facing, for a total of 16x10GE SFP+ports. All three chips also connect to a backplane forport to port connectivity. Watchtower deployment, asseen in Figure 9 was substantially easier than the earlierFirehose deployments. The larger bandwidth densityof the switching silicon also allowed us to build largerfabrics with more bandwidth to individual servers, anecessity as servers were employing an ever-increasingnumber of cores.Fiber bundling further reduced the cabling complex-
ity of Watchtower clusters. Figure 10 shows a Watch-tower fabric deployment without any cable bundling.Individual fibers of varying length need to be pulledfrom each chassis location, leading to significant deploy-ment overhead. The bottom figure shows how bundlingcan substantially reduce complexity. We deploy twochassis in each rack and co-locate two racks. We canthen pull cable bundles to the midpoint of the co-locatedracks, where each bundle is split to each rack and thenfurther to each chassis.Finally, manufacturing fiber in bundles is more cost
e↵ective than individual strands. Cable bundlinghelped reduce fiber cost (capex + opex) by nearly 40%and expedited bringup of Watchtower fabric by multi-ple weeks. Table 3 summarizes the bundling and costsavings.
188
From “Jupiter Rising: A Decade of Clos Topologies and Centralized Control in Google’s Datacenter Network”, Singh et al., ACM
SIGCOMM’15

Google’s B4: Traffic engineering
TE server

Vs. Semi-Distributed TE
What aspects of B4 would have been difficult with MPLS-based TE such as TeXCP?
What aspects of B4 are similar to TeXCP?

Small group discussion
1 How does B4 scale?
• Subsecond centralized scheduling of more traffic than Google’s public WAN serves!
2 What does B4 assume about network’s traffic?
• In what environments would these assumptions be violated?
• In what other environments would they be valid?

How does B4 scale?

How does B4 scale?
Hierarchy
• Not a simple contoller-to-switch design!
Design Decision Rationale/Bene�ts ChallengesB� routers built frommerchant switch silicon
B� apps are willing to trade more average bandwidth for fault tolerance.Edge application control limits need for large bu�ers. Limited number of B� sites meanslarge forwarding tables are not required.Relatively low router cost allows us to scale network capacity.
Sacri�ce hardware fault tolerance,deep bu�ering, and support forlarge routing tables.
Drive links to ����utilization
Allows e�cient use of expensive long haul transport.Many applications willing to trade higher average bandwidth for predictability. Largestbandwidth consumers adapt dynamically to available bandwidth.
Packet loss becomes inevitablewith substantial capacity loss dur-ing link/switch failure.
Centralized tra�cengineering
Use multipath forwarding to balance application demands across available capacity in re-sponse to failures and changing application demands.Leverage application classi�cation and priority for scheduling in cooperation with edge ratelimiting.Tra�c engineering with traditional distributed routing protocols (e.g. link-state) is knownto be sub-optimal [��, ��] except in special cases [��].Faster, deterministic global convergence for failures.
No existing protocols for func-tionality. Requires knowledgeabout site to site demand and im-portance.
Separate hardwarefrom so�ware
Customize routing and monitoring protocols to B� requirements.Rapid iteration on so�ware protocols.Easier to protect against common case so�ware failures through external replication.Agnostic to range of hardware deployments exporting the same programming interface.
Previously untested developmentmodel. Breaks fate sharing be-tween hardware and so�ware.
Table �: Summary of design decisions in B�.
Figure �: B� architecture overview.
stance of Paxos [�] elects one of multiple available so�ware replicas(placed on di�erent physical servers) as the primary instance.
�e global layer consists of logically centralized applications (e.g.an SDN Gateway and a central TE server) that enable the centralcontrol of the entire network via the site-levelNCAs.�e SDNGate-way abstracts details of OpenFlow and switch hardware from thecentral TE server. We replicate global layer applications across mul-tiple WAN sites with separate leader election to set the primary.
Each server cluster in our network is a logical “Autonomous Sys-tem” (AS)with a set of IP pre�xes. Each cluster contains a set of BGProuters (not shown in Fig. �) that peerwith B� switches at eachWANsite. Even before introducing SDN, we ran B� as a single AS pro-viding transit among clusters running traditional BGP/ISIS networkprotocols. We chose BGP because of its isolation properties betweendomains and operator familiarity with the protocol.�e SDN-basedB� then had to support existing distributed routing protocols, bothfor interoperability with our non-SDN WAN implementation, andto enable a gradual rollout.
We considered a number of options for integrating existing rout-ing protocols with centralized tra�c engineering. In an aggressiveapproach, we would have built one integrated, centralized servicecombining routing (e.g., ISIS functionality) and tra�c engineering.We instead chose to deploy routing and tra�c engineering as in-dependent services, with the standard routing service deployed ini-tially and central TE subsequently deployed as an overlay. �is sep-
aration delivers a number of bene�ts. It allowed us to focus initialwork on building SDN infrastructure, e.g., the OFC and agent, rout-ing, etc. Moreover, since we initially deployed our network with nonew externally visible functionality such as TE, it gave time to de-velop and debug the SDN architecture before trying to implementnew features such as TE.Perhaps most importantly, we layered tra�c engineering on top
of baseline routing protocols using prioritized switch forwarding ta-ble entries (§ �). �is isolation gave our network a “big red button”;faced with any critical issues in tra�c engineering, we could dis-able the service and fall back to shortest path forwarding. �is faultrecovery mechanism has proven invaluable (§ �).Each B� site consists of multiple switches with potentially hun-
dreds of individual ports linking to remote sites. To scale, the TE ab-stracts each site into a single node with a single edge of given capac-ity to each remote site. To achieve this topology abstraction, all traf-�c crossing a site-to-site edge must be evenly distributed across allits constituent links. B� routers employ a custom variant of ECMPhashing [��] to achieve the necessary load balancing.In the rest of this section, we describe how we integrate ex-
isting routing protocols running on separate control servers withOpenFlow-enabled hardware switches. § � then describes how welayer TE on top of this baseline routing implementation.
3.2 Switch DesignConventional wisdom dictates that wide area routing equipment
must have deep bu�ers, very large forwarding tables, and hardwaresupport for high availability. All of this functionality adds to hard-ware cost and complexity. We posited that with careful endpointmanagement, we could adjust transmission rates to avoid the needfor deep bu�ers while avoiding expensive packet drops. Further,our switches run across a relatively small set of data centers, sowe did not require large forwarding tables. Finally, we found thatswitch failures typically result from so�ware rather than hardwareissues. By moving most so�ware functionality o� the switch hard-ware, we can manage so�ware fault tolerance through known tech-niques widely available for existing distributed systems.Even so, the main reason we chose to build our own hardware
was that no existing platform could support an SDN deployment,i.e., one that could export low-level control over switch forwardingbehavior. Any extra costs from using custom switch hardware aremore than repaid by the e�ciency gains available from supportingnovel services such as centralized TE. Given the bandwidth required
5
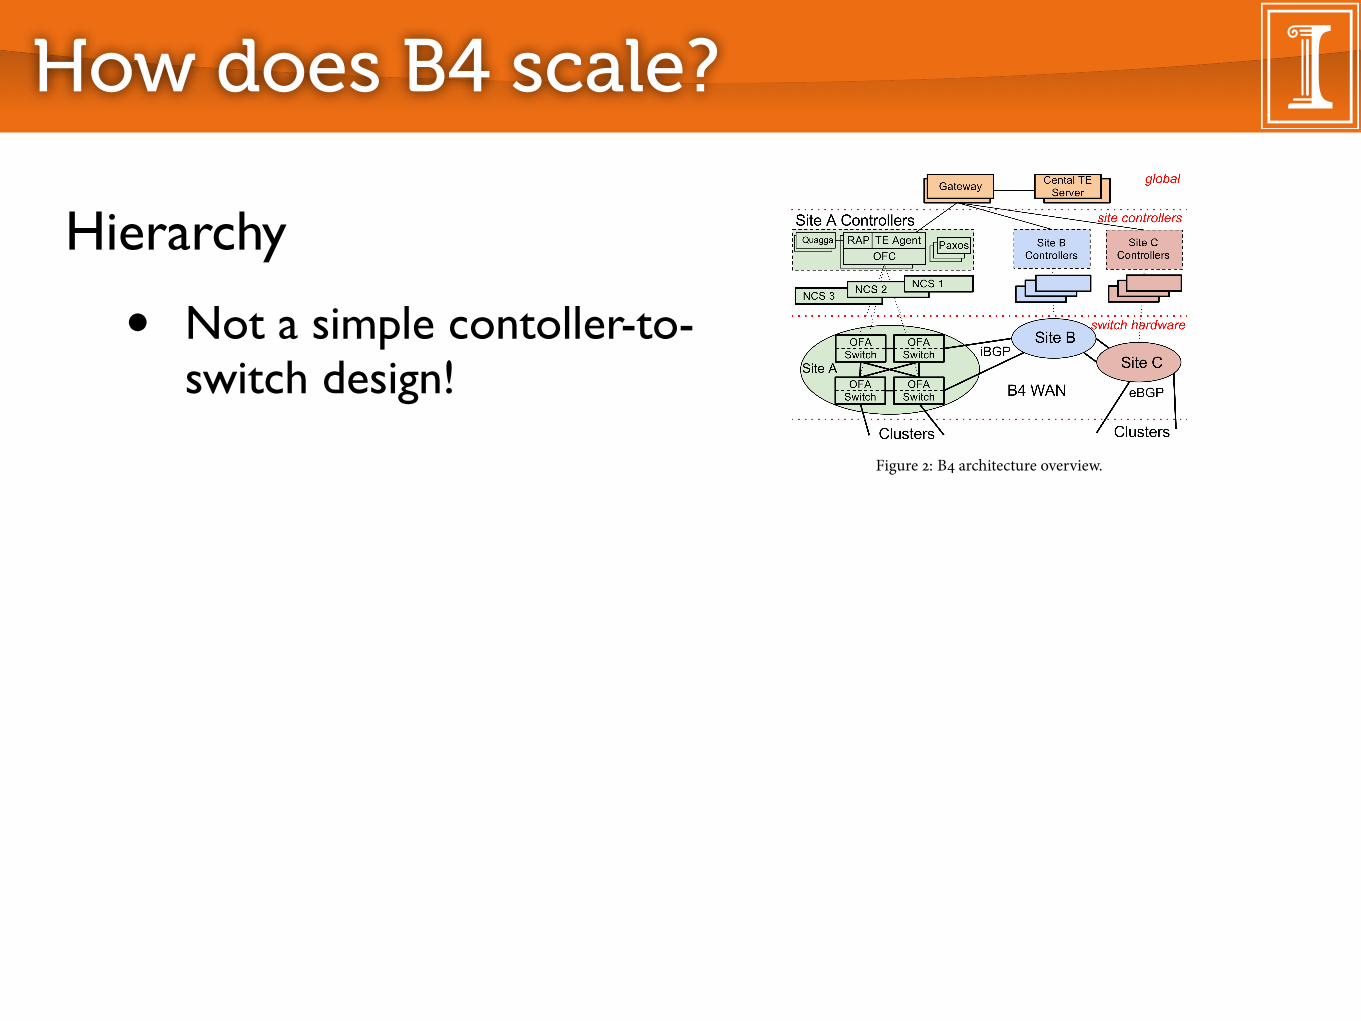
How does B4 scale?
Hierarchy
• Not a simple contoller-to-switch design!
Design Decision Rationale/Bene�ts ChallengesB� routers built frommerchant switch silicon
B� apps are willing to trade more average bandwidth for fault tolerance.Edge application control limits need for large bu�ers. Limited number of B� sites meanslarge forwarding tables are not required.Relatively low router cost allows us to scale network capacity.
Sacri�ce hardware fault tolerance,deep bu�ering, and support forlarge routing tables.
Drive links to ����utilization
Allows e�cient use of expensive long haul transport.Many applications willing to trade higher average bandwidth for predictability. Largestbandwidth consumers adapt dynamically to available bandwidth.
Packet loss becomes inevitablewith substantial capacity loss dur-ing link/switch failure.
Centralized tra�cengineering
Use multipath forwarding to balance application demands across available capacity in re-sponse to failures and changing application demands.Leverage application classi�cation and priority for scheduling in cooperation with edge ratelimiting.Tra�c engineering with traditional distributed routing protocols (e.g. link-state) is knownto be sub-optimal [��, ��] except in special cases [��].Faster, deterministic global convergence for failures.
No existing protocols for func-tionality. Requires knowledgeabout site to site demand and im-portance.
Separate hardwarefrom so�ware
Customize routing and monitoring protocols to B� requirements.Rapid iteration on so�ware protocols.Easier to protect against common case so�ware failures through external replication.Agnostic to range of hardware deployments exporting the same programming interface.
Previously untested developmentmodel. Breaks fate sharing be-tween hardware and so�ware.
Table �: Summary of design decisions in B�.
Figure �: B� architecture overview.
stance of Paxos [�] elects one of multiple available so�ware replicas(placed on di�erent physical servers) as the primary instance.
�e global layer consists of logically centralized applications (e.g.an SDN Gateway and a central TE server) that enable the centralcontrol of the entire network via the site-levelNCAs.�e SDNGate-way abstracts details of OpenFlow and switch hardware from thecentral TE server. We replicate global layer applications across mul-tiple WAN sites with separate leader election to set the primary.
Each server cluster in our network is a logical “Autonomous Sys-tem” (AS)with a set of IP pre�xes. Each cluster contains a set of BGProuters (not shown in Fig. �) that peerwith B� switches at eachWANsite. Even before introducing SDN, we ran B� as a single AS pro-viding transit among clusters running traditional BGP/ISIS networkprotocols. We chose BGP because of its isolation properties betweendomains and operator familiarity with the protocol.�e SDN-basedB� then had to support existing distributed routing protocols, bothfor interoperability with our non-SDN WAN implementation, andto enable a gradual rollout.
We considered a number of options for integrating existing rout-ing protocols with centralized tra�c engineering. In an aggressiveapproach, we would have built one integrated, centralized servicecombining routing (e.g., ISIS functionality) and tra�c engineering.We instead chose to deploy routing and tra�c engineering as in-dependent services, with the standard routing service deployed ini-tially and central TE subsequently deployed as an overlay. �is sep-
aration delivers a number of bene�ts. It allowed us to focus initialwork on building SDN infrastructure, e.g., the OFC and agent, rout-ing, etc. Moreover, since we initially deployed our network with nonew externally visible functionality such as TE, it gave time to de-velop and debug the SDN architecture before trying to implementnew features such as TE.
Perhaps most importantly, we layered tra�c engineering on topof baseline routing protocols using prioritized switch forwarding ta-ble entries (§ �). �is isolation gave our network a “big red button”;faced with any critical issues in tra�c engineering, we could dis-able the service and fall back to shortest path forwarding. �is faultrecovery mechanism has proven invaluable (§ �).
Each B� site consists of multiple switches with potentially hun-dreds of individual ports linking to remote sites. To scale, the TE ab-stracts each site into a single node with a single edge of given capac-ity to each remote site. To achieve this topology abstraction, all traf-�c crossing a site-to-site edge must be evenly distributed across allits constituent links. B� routers employ a custom variant of ECMPhashing [��] to achieve the necessary load balancing.
In the rest of this section, we describe how we integrate ex-isting routing protocols running on separate control servers withOpenFlow-enabled hardware switches. § � then describes how welayer TE on top of this baseline routing implementation.
3.2 Switch DesignConventional wisdom dictates that wide area routing equipment
must have deep bu�ers, very large forwarding tables, and hardwaresupport for high availability. All of this functionality adds to hard-ware cost and complexity. We posited that with careful endpointmanagement, we could adjust transmission rates to avoid the needfor deep bu�ers while avoiding expensive packet drops. Further,our switches run across a relatively small set of data centers, sowe did not require large forwarding tables. Finally, we found thatswitch failures typically result from so�ware rather than hardwareissues. By moving most so�ware functionality o� the switch hard-ware, we can manage so�ware fault tolerance through known tech-niques widely available for existing distributed systems.
Even so, the main reason we chose to build our own hardwarewas that no existing platform could support an SDN deployment,i.e., one that could export low-level control over switch forwardingbehavior. Any extra costs from using custom switch hardware aremore than repaid by the e�ciency gains available from supportingnovel services such as centralized TE. Given the bandwidth required
5

How does B4 scale?
Hierarchy
• Not a simple contoller-to-switch design!
Aggregation
• Node = site (data center)• Link = 100s of links• Flow group = {src, dst,
QoS} tuple
Design Decision Rationale/Bene�ts ChallengesB� routers built frommerchant switch silicon
B� apps are willing to trade more average bandwidth for fault tolerance.Edge application control limits need for large bu�ers. Limited number of B� sites meanslarge forwarding tables are not required.Relatively low router cost allows us to scale network capacity.
Sacri�ce hardware fault tolerance,deep bu�ering, and support forlarge routing tables.
Drive links to ����utilization
Allows e�cient use of expensive long haul transport.Many applications willing to trade higher average bandwidth for predictability. Largestbandwidth consumers adapt dynamically to available bandwidth.
Packet loss becomes inevitablewith substantial capacity loss dur-ing link/switch failure.
Centralized tra�cengineering
Use multipath forwarding to balance application demands across available capacity in re-sponse to failures and changing application demands.Leverage application classi�cation and priority for scheduling in cooperation with edge ratelimiting.Tra�c engineering with traditional distributed routing protocols (e.g. link-state) is knownto be sub-optimal [��, ��] except in special cases [��].Faster, deterministic global convergence for failures.
No existing protocols for func-tionality. Requires knowledgeabout site to site demand and im-portance.
Separate hardwarefrom so�ware
Customize routing and monitoring protocols to B� requirements.Rapid iteration on so�ware protocols.Easier to protect against common case so�ware failures through external replication.Agnostic to range of hardware deployments exporting the same programming interface.
Previously untested developmentmodel. Breaks fate sharing be-tween hardware and so�ware.
Table �: Summary of design decisions in B�.
Figure �: B� architecture overview.
stance of Paxos [�] elects one of multiple available so�ware replicas(placed on di�erent physical servers) as the primary instance.
�e global layer consists of logically centralized applications (e.g.an SDN Gateway and a central TE server) that enable the centralcontrol of the entire network via the site-levelNCAs.�e SDNGate-way abstracts details of OpenFlow and switch hardware from thecentral TE server. We replicate global layer applications across mul-tiple WAN sites with separate leader election to set the primary.
Each server cluster in our network is a logical “Autonomous Sys-tem” (AS)with a set of IP pre�xes. Each cluster contains a set of BGProuters (not shown in Fig. �) that peerwith B� switches at eachWANsite. Even before introducing SDN, we ran B� as a single AS pro-viding transit among clusters running traditional BGP/ISIS networkprotocols. We chose BGP because of its isolation properties betweendomains and operator familiarity with the protocol.�e SDN-basedB� then had to support existing distributed routing protocols, bothfor interoperability with our non-SDN WAN implementation, andto enable a gradual rollout.
We considered a number of options for integrating existing rout-ing protocols with centralized tra�c engineering. In an aggressiveapproach, we would have built one integrated, centralized servicecombining routing (e.g., ISIS functionality) and tra�c engineering.We instead chose to deploy routing and tra�c engineering as in-dependent services, with the standard routing service deployed ini-tially and central TE subsequently deployed as an overlay. �is sep-
aration delivers a number of bene�ts. It allowed us to focus initialwork on building SDN infrastructure, e.g., the OFC and agent, rout-ing, etc. Moreover, since we initially deployed our network with nonew externally visible functionality such as TE, it gave time to de-velop and debug the SDN architecture before trying to implementnew features such as TE.
Perhaps most importantly, we layered tra�c engineering on topof baseline routing protocols using prioritized switch forwarding ta-ble entries (§ �). �is isolation gave our network a “big red button”;faced with any critical issues in tra�c engineering, we could dis-able the service and fall back to shortest path forwarding. �is faultrecovery mechanism has proven invaluable (§ �).
Each B� site consists of multiple switches with potentially hun-dreds of individual ports linking to remote sites. To scale, the TE ab-stracts each site into a single node with a single edge of given capac-ity to each remote site. To achieve this topology abstraction, all traf-�c crossing a site-to-site edge must be evenly distributed across allits constituent links. B� routers employ a custom variant of ECMPhashing [��] to achieve the necessary load balancing.
In the rest of this section, we describe how we integrate ex-isting routing protocols running on separate control servers withOpenFlow-enabled hardware switches. § � then describes how welayer TE on top of this baseline routing implementation.
3.2 Switch DesignConventional wisdom dictates that wide area routing equipment
must have deep bu�ers, very large forwarding tables, and hardwaresupport for high availability. All of this functionality adds to hard-ware cost and complexity. We posited that with careful endpointmanagement, we could adjust transmission rates to avoid the needfor deep bu�ers while avoiding expensive packet drops. Further,our switches run across a relatively small set of data centers, sowe did not require large forwarding tables. Finally, we found thatswitch failures typically result from so�ware rather than hardwareissues. By moving most so�ware functionality o� the switch hard-ware, we can manage so�ware fault tolerance through known tech-niques widely available for existing distributed systems.
Even so, the main reason we chose to build our own hardwarewas that no existing platform could support an SDN deployment,i.e., one that could export low-level control over switch forwardingbehavior. Any extra costs from using custom switch hardware aremore than repaid by the e�ciency gains available from supportingnovel services such as centralized TE. Given the bandwidth required
5
Figure �: B� worldwide deployment (����).
not a panacea; we summarize our experience with a large-scale B�outage, pointing to challenges in both SDN and large-scale networkmanagement. While our approach does not generalize to all WANsor SDNs, we hope that our experience will inform future design inboth domains.
2. BACKGROUNDBefore describing the architecture of our so�ware-de�nedWAN,
we provide an overview of our deployment environment and tar-get applications. Google’s WAN is among the largest in the Internet,delivering a range of search, video, cloud computing, and enterpriseapplications to users across the planet. �ese services run across acombination of data centers spread across the world, and edge de-ployments for cacheable content.
Architecturally, we operate two distinct WANs. Our user-facingnetwork peers with and exchanges tra�c with other Internet do-mains. End user requests and responses are delivered to our datacenters and edge caches across this network. �e second network,B�, provides connectivity among data centers (see Fig. �), e.g., forasynchronous data copies, index pushes for interactive serving sys-tems, and end user data replication for availability. Well over ���of internal application tra�c runs across this network.
We maintain two separate networks because they have di�erentrequirements. For example, our user-facing networking connectswith a range of gear and providers, and hence must support a widerange of protocols. Further, its physical topology will necessarily bemore dense than a network connecting a modest number of datacenters. Finally, in delivering content to end users, it must supportthe highest levels of availability.
�ousands of individual applications run across B�; here, we cat-egorize them into three classes: i) user data copies (e.g., email, doc-uments, audio/video �les) to remote data centers for availability/-durability, ii) remote storage access for computation over inherentlydistributed data sources, and iii) large-scale data push synchroniz-ing state across multiple data centers. �ese three tra�c classes areordered in increasing volume, decreasing latency sensitivity, and de-creasing overall priority. For example, user-data represents the low-est volume on B�, is the most latency sensitive, and is of the highestpriority.
�e scale of our network deployment strains both the capacityof commodity network hardware and the scalability, fault tolerance,and granularity of control available from network so�ware. Internetbandwidth as a whole continues to grow rapidly [��]. However, ourownWAN tra�c has been growing at an even faster rate.
Our decision to build B� around So�ware De�ned Networkingand OpenFlow [��] was driven by the observation that we could notachieve the level of scale, fault tolerance, cost e�ciency, and controlrequired for our network using traditional WAN architectures. Anumber of B�’s characteristics led to our design approach:
● Elastic bandwidth demands: �e majority of our data cen-ter tra�c involves synchronizing large data sets across sites.�ese applications bene�t from as much bandwidth as theycan get but can tolerate periodic failures with temporarybandwidth reductions.● Moderate number of sites: While B�must scale among multi-ple dimensions, targeting our data center deployments meantthat the total number of WAN sites would be a few dozen.● End application control: We control both the applications andthe site networks connected to B�. Hence, we can enforce rel-ative application priorities and control bursts at the networkedge, rather than through overprovisioning or complex func-tionality in B�.● Cost sensitivity: B�’s capacity targets and growth rate led tounsustainable cost projections. �e traditional approach ofprovisioningWAN links at ��-��� (or �-�x the cost of a fully-utilized WAN) to protect against failures and packet loss,combined with prevailing per-port router cost, would makeour network prohibitively expensive.
�ese considerations led to particular design decisions for B�,which we summarize in Table �. In particular, SDN gives us adedicated, so�ware-based control plane running on commodityservers, and the opportunity to reason about global state, yieldingvastly simpli�ed coordination and orchestration for both plannedand unplanned network changes. SDN also allows us to leveragethe raw speed of commodity servers; latest-generation servers aremuch faster than the embedded-class processor in most switches,and we can upgrade servers independently from the switch hard-ware. OpenFlow gives us an early investment in an SDN ecosys-tem that can leverage a variety of switch/data plane elements. Crit-ically, SDN/OpenFlow decouples so�ware and hardware evolution:control plane so�ware becomes simpler and evolves more quickly;data plane hardware evolves based on programmability and perfor-mance.We had several additional motivations for our so�ware de�ned
architecture, including: i) rapid iteration on novel protocols, ii) sim-pli�ed testing environments (e.g., we emulate our entire so�warestack running across the WAN in a local cluster), iii) improvedcapacity planning available from simulating a deterministic cen-tral TE server rather than trying to capture the asynchronous rout-ing behavior of distributed protocols, and iv) simpli�ed manage-ment through a fabric-centric rather than router-centricWAN view.However, we leave a description of these aspects to separate work.
3. DESIGNIn this section, we describe the details of our So�ware De�ned
WAN architecture.
3.1 OverviewOur SDN architecture can be logically viewed in three layers, de-
picted in Fig. �. B� serves multiple WAN sites, each with a num-ber of server clusters. Within each B� site, the switch hardwarelayer primarily forwards tra�c and does not run complex controlso�ware, and the site controller layer consists of Network ControlServers (NCS) hosting both OpenFlow controllers (OFC) and Net-work Control Applications (NCAs).�ese servers enable distributed routing and central tra�c engi-
neering as a routing overlay. OFCs maintain network state based onNCA directives and switch events and instruct switches to set for-warding table entries based on this changing network state. For faulttolerance of individual servers and control processes, a per-site in-
4
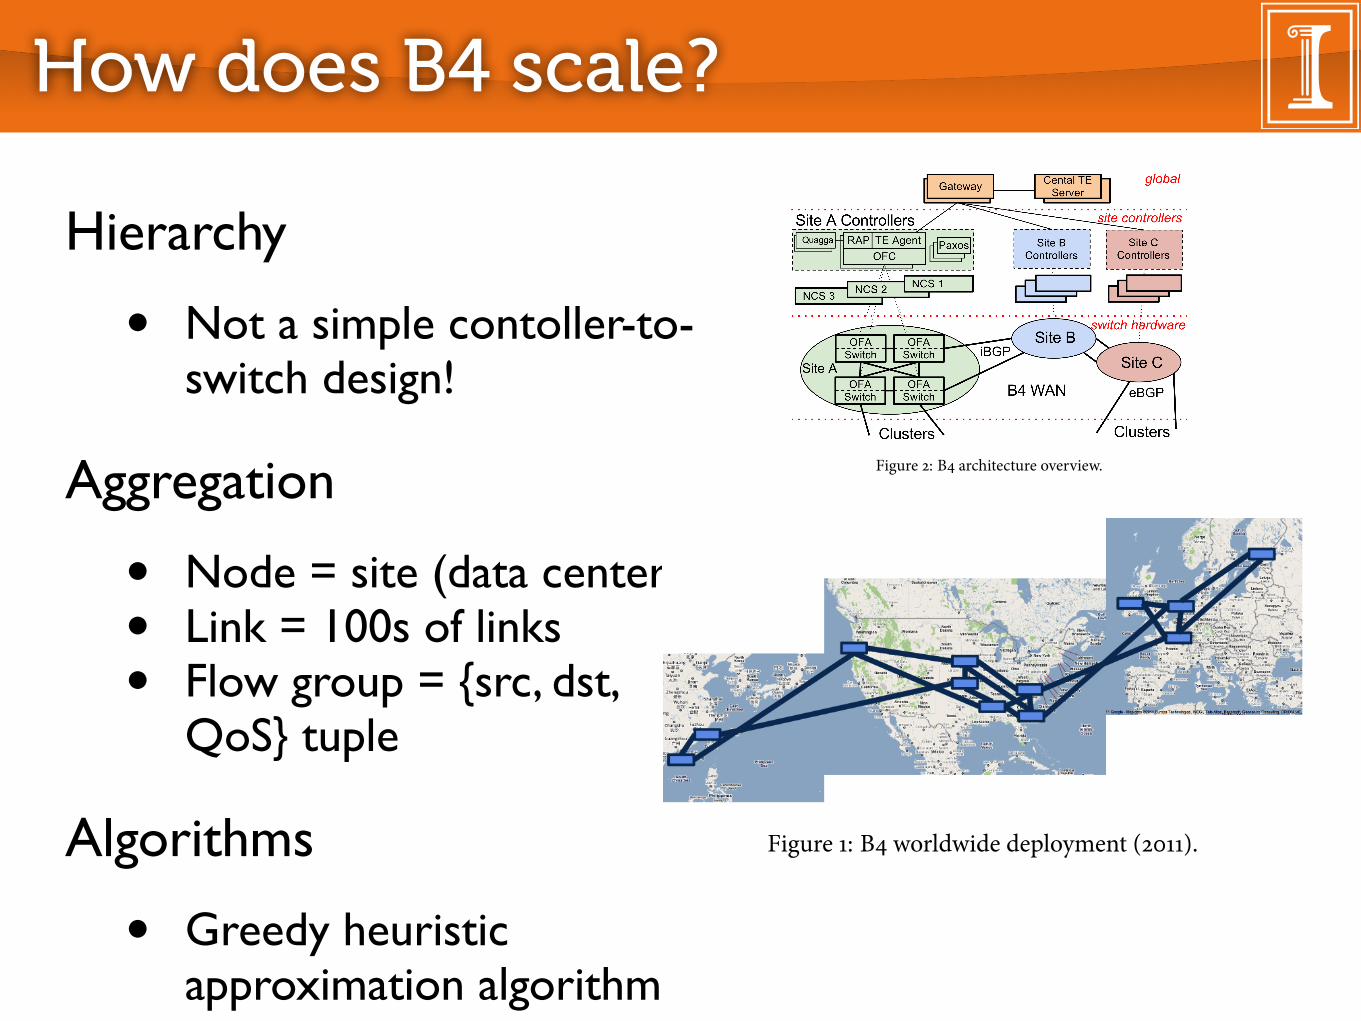
How does B4 scale?
Hierarchy
• Not a simple contoller-to-switch design!
Aggregation
• Node = site (data center)• Link = 100s of links• Flow group = {src, dst,
QoS} tuple
Algorithms
• Greedy heuristic approximation algorithm
Figure �: B� worldwide deployment (����).
not a panacea; we summarize our experience with a large-scale B�outage, pointing to challenges in both SDN and large-scale networkmanagement. While our approach does not generalize to all WANsor SDNs, we hope that our experience will inform future design inboth domains.
2. BACKGROUNDBefore describing the architecture of our so�ware-de�nedWAN,
we provide an overview of our deployment environment and tar-get applications. Google’s WAN is among the largest in the Internet,delivering a range of search, video, cloud computing, and enterpriseapplications to users across the planet. �ese services run across acombination of data centers spread across the world, and edge de-ployments for cacheable content.
Architecturally, we operate two distinct WANs. Our user-facingnetwork peers with and exchanges tra�c with other Internet do-mains. End user requests and responses are delivered to our datacenters and edge caches across this network. �e second network,B�, provides connectivity among data centers (see Fig. �), e.g., forasynchronous data copies, index pushes for interactive serving sys-tems, and end user data replication for availability. Well over ���of internal application tra�c runs across this network.
We maintain two separate networks because they have di�erentrequirements. For example, our user-facing networking connectswith a range of gear and providers, and hence must support a widerange of protocols. Further, its physical topology will necessarily bemore dense than a network connecting a modest number of datacenters. Finally, in delivering content to end users, it must supportthe highest levels of availability.
�ousands of individual applications run across B�; here, we cat-egorize them into three classes: i) user data copies (e.g., email, doc-uments, audio/video �les) to remote data centers for availability/-durability, ii) remote storage access for computation over inherentlydistributed data sources, and iii) large-scale data push synchroniz-ing state across multiple data centers. �ese three tra�c classes areordered in increasing volume, decreasing latency sensitivity, and de-creasing overall priority. For example, user-data represents the low-est volume on B�, is the most latency sensitive, and is of the highestpriority.
�e scale of our network deployment strains both the capacityof commodity network hardware and the scalability, fault tolerance,and granularity of control available from network so�ware. Internetbandwidth as a whole continues to grow rapidly [��]. However, ourownWAN tra�c has been growing at an even faster rate.
Our decision to build B� around So�ware De�ned Networkingand OpenFlow [��] was driven by the observation that we could notachieve the level of scale, fault tolerance, cost e�ciency, and controlrequired for our network using traditional WAN architectures. Anumber of B�’s characteristics led to our design approach:
● Elastic bandwidth demands: �e majority of our data cen-ter tra�c involves synchronizing large data sets across sites.�ese applications bene�t from as much bandwidth as theycan get but can tolerate periodic failures with temporarybandwidth reductions.● Moderate number of sites: While B�must scale among multi-ple dimensions, targeting our data center deployments meantthat the total number of WAN sites would be a few dozen.● End application control: We control both the applications andthe site networks connected to B�. Hence, we can enforce rel-ative application priorities and control bursts at the networkedge, rather than through overprovisioning or complex func-tionality in B�.● Cost sensitivity: B�’s capacity targets and growth rate led tounsustainable cost projections. �e traditional approach ofprovisioningWAN links at ��-��� (or �-�x the cost of a fully-utilized WAN) to protect against failures and packet loss,combined with prevailing per-port router cost, would makeour network prohibitively expensive.
�ese considerations led to particular design decisions for B�,which we summarize in Table �. In particular, SDN gives us adedicated, so�ware-based control plane running on commodityservers, and the opportunity to reason about global state, yieldingvastly simpli�ed coordination and orchestration for both plannedand unplanned network changes. SDN also allows us to leveragethe raw speed of commodity servers; latest-generation servers aremuch faster than the embedded-class processor in most switches,and we can upgrade servers independently from the switch hard-ware. OpenFlow gives us an early investment in an SDN ecosys-tem that can leverage a variety of switch/data plane elements. Crit-ically, SDN/OpenFlow decouples so�ware and hardware evolution:control plane so�ware becomes simpler and evolves more quickly;data plane hardware evolves based on programmability and perfor-mance.We had several additional motivations for our so�ware de�ned
architecture, including: i) rapid iteration on novel protocols, ii) sim-pli�ed testing environments (e.g., we emulate our entire so�warestack running across the WAN in a local cluster), iii) improvedcapacity planning available from simulating a deterministic cen-tral TE server rather than trying to capture the asynchronous rout-ing behavior of distributed protocols, and iv) simpli�ed manage-ment through a fabric-centric rather than router-centricWAN view.However, we leave a description of these aspects to separate work.
3. DESIGNIn this section, we describe the details of our So�ware De�ned
WAN architecture.
3.1 OverviewOur SDN architecture can be logically viewed in three layers, de-
picted in Fig. �. B� serves multiple WAN sites, each with a num-ber of server clusters. Within each B� site, the switch hardwarelayer primarily forwards tra�c and does not run complex controlso�ware, and the site controller layer consists of Network ControlServers (NCS) hosting both OpenFlow controllers (OFC) and Net-work Control Applications (NCAs).�ese servers enable distributed routing and central tra�c engi-
neering as a routing overlay. OFCs maintain network state based onNCA directives and switch events and instruct switches to set for-warding table entries based on this changing network state. For faulttolerance of individual servers and control processes, a per-site in-
4
Design Decision Rationale/Bene�ts ChallengesB� routers built frommerchant switch silicon
B� apps are willing to trade more average bandwidth for fault tolerance.Edge application control limits need for large bu�ers. Limited number of B� sites meanslarge forwarding tables are not required.Relatively low router cost allows us to scale network capacity.
Sacri�ce hardware fault tolerance,deep bu�ering, and support forlarge routing tables.
Drive links to ����utilization
Allows e�cient use of expensive long haul transport.Many applications willing to trade higher average bandwidth for predictability. Largestbandwidth consumers adapt dynamically to available bandwidth.
Packet loss becomes inevitablewith substantial capacity loss dur-ing link/switch failure.
Centralized tra�cengineering
Use multipath forwarding to balance application demands across available capacity in re-sponse to failures and changing application demands.Leverage application classi�cation and priority for scheduling in cooperation with edge ratelimiting.Tra�c engineering with traditional distributed routing protocols (e.g. link-state) is knownto be sub-optimal [��, ��] except in special cases [��].Faster, deterministic global convergence for failures.
No existing protocols for func-tionality. Requires knowledgeabout site to site demand and im-portance.
Separate hardwarefrom so�ware
Customize routing and monitoring protocols to B� requirements.Rapid iteration on so�ware protocols.Easier to protect against common case so�ware failures through external replication.Agnostic to range of hardware deployments exporting the same programming interface.
Previously untested developmentmodel. Breaks fate sharing be-tween hardware and so�ware.
Table �: Summary of design decisions in B�.
Figure �: B� architecture overview.
stance of Paxos [�] elects one of multiple available so�ware replicas(placed on di�erent physical servers) as the primary instance.
�e global layer consists of logically centralized applications (e.g.an SDN Gateway and a central TE server) that enable the centralcontrol of the entire network via the site-levelNCAs.�e SDNGate-way abstracts details of OpenFlow and switch hardware from thecentral TE server. We replicate global layer applications across mul-tiple WAN sites with separate leader election to set the primary.
Each server cluster in our network is a logical “Autonomous Sys-tem” (AS)with a set of IP pre�xes. Each cluster contains a set of BGProuters (not shown in Fig. �) that peerwith B� switches at eachWANsite. Even before introducing SDN, we ran B� as a single AS pro-viding transit among clusters running traditional BGP/ISIS networkprotocols. We chose BGP because of its isolation properties betweendomains and operator familiarity with the protocol.�e SDN-basedB� then had to support existing distributed routing protocols, bothfor interoperability with our non-SDN WAN implementation, andto enable a gradual rollout.
We considered a number of options for integrating existing rout-ing protocols with centralized tra�c engineering. In an aggressiveapproach, we would have built one integrated, centralized servicecombining routing (e.g., ISIS functionality) and tra�c engineering.We instead chose to deploy routing and tra�c engineering as in-dependent services, with the standard routing service deployed ini-tially and central TE subsequently deployed as an overlay. �is sep-
aration delivers a number of bene�ts. It allowed us to focus initialwork on building SDN infrastructure, e.g., the OFC and agent, rout-ing, etc. Moreover, since we initially deployed our network with nonew externally visible functionality such as TE, it gave time to de-velop and debug the SDN architecture before trying to implementnew features such as TE.
Perhaps most importantly, we layered tra�c engineering on topof baseline routing protocols using prioritized switch forwarding ta-ble entries (§ �). �is isolation gave our network a “big red button”;faced with any critical issues in tra�c engineering, we could dis-able the service and fall back to shortest path forwarding. �is faultrecovery mechanism has proven invaluable (§ �).
Each B� site consists of multiple switches with potentially hun-dreds of individual ports linking to remote sites. To scale, the TE ab-stracts each site into a single node with a single edge of given capac-ity to each remote site. To achieve this topology abstraction, all traf-�c crossing a site-to-site edge must be evenly distributed across allits constituent links. B� routers employ a custom variant of ECMPhashing [��] to achieve the necessary load balancing.
In the rest of this section, we describe how we integrate ex-isting routing protocols running on separate control servers withOpenFlow-enabled hardware switches. § � then describes how welayer TE on top of this baseline routing implementation.
3.2 Switch DesignConventional wisdom dictates that wide area routing equipment
must have deep bu�ers, very large forwarding tables, and hardwaresupport for high availability. All of this functionality adds to hard-ware cost and complexity. We posited that with careful endpointmanagement, we could adjust transmission rates to avoid the needfor deep bu�ers while avoiding expensive packet drops. Further,our switches run across a relatively small set of data centers, sowe did not require large forwarding tables. Finally, we found thatswitch failures typically result from so�ware rather than hardwareissues. By moving most so�ware functionality o� the switch hard-ware, we can manage so�ware fault tolerance through known tech-niques widely available for existing distributed systems.
Even so, the main reason we chose to build our own hardwarewas that no existing platform could support an SDN deployment,i.e., one that could export low-level control over switch forwardingbehavior. Any extra costs from using custom switch hardware aremore than repaid by the e�ciency gains available from supportingnovel services such as centralized TE. Given the bandwidth required
5

What assumptions about traffic?
Design makes what assumption about traffic to approach 100% utilization on some links?
• High priority traffic is in the minority• Elastic traffic is the majority (backups, offline data
analytics, ...)
We tolerate high utilization by di�erentiating among di�erent tra�cclasses.
�e two graphs in Fig. �� show tra�c on all links between twoWAN sites. �e top graph shows how we drive utilization close to���� over a ��-hour period. �e second graph shows the ratio ofhigh priority to low priority packets, and packet-drop fractions foreach priority. A key bene�t of centralized TE is the ability to mixpriority classes across all edges. By ensuring that heavily utilizededges carry substantial low priority tra�c, local QoS schedulers canensure that high priority tra�c is insulated from loss despite shallowswitch bu�ers, hashing imperfections and inherent tra�c bursti-ness. Our low priority tra�c tolerates loss by throttling transmis-sion rate to available capacity at the application level.
(a)
(b)
Figure ��: Utilization and drops for a site-to-site edge.
Site-to-site edge utilization can also be studied at the granular-ity of the constituent links of the edge, to evaluate B�’s ability toload-balance tra�c across all links traversing a given edge. Suchbalancing is a prerequisite for topology abstraction in TE (§�.�).Fig. �� shows the uniform link utilization of all links in the site-to-site edge of Fig. �� over a period of �� hours. In general, the resultsof our load-balancing scheme in the �eld have been very encour-aging across the B� network. For at least ��� of site-to-site edges,the max:min ratio in link utilization across constituent links is �.��without failures (i.e., �� from optimal), and �.� with failures. Moree�ective load balancing during failure conditions is a subject of ourongoing work.
Figure ��: Per-link utilization in a trunk, demonstrating the e�ec-tiveness of hashing.
7. EXPERIENCE FROM AN OUTAGEOverall, B� system availability has exceeded our expectations.
However, it has experienced one substantial outage that has beeninstructive both inmanaging a largeWAN in general and in the con-text of SDN in particular. For reference, our public facing networkhas also su�ered failures during this period.
�e outage started during a planned maintenance operation, afairly complex move of half the switching hardware for our biggestsite from one location to another. One of the new switches was in-advertently manually con�gured with the same ID as an existingswitch. �is led to substantial link �aps. When switches receivedISIS Link State Packets (LSPs) with the same ID containing di�erentadjacencies, they immediately �ooded new LSPs through all otherinterfaces.�e switcheswith duplicate IDswould alternate respond-ing to the LSPs with their own version of network topology, causingmore protocol processing.
Recall that B� forwards routing-protocols packets through so�-ware, from Quagga to the OFC and �nally to the OFA. �e OFCto OFA connection is the most constrained in our implementation,leading to substantial protocol packet queueing, growing to morethan ���MB at its peak.
�e queueing led to the next chain in the failure scenario: normalISIS Hello messages were delayed in queues behind LSPs, well pasttheir useful lifetime. �is led switches to declare interfaces down,breaking BGP adjacencies with remote sites. TE Tra�c transitingthrough the site continued to work because switches maintainedtheir last known TE state. However, the TE server was unable tocreate new tunnels through this site. At this point, any concurrentphysical failures would leave the network using old broken tunnels.
With perfect foresight, the solution was to drain all links fromone of the switches with a duplicate ID. Instead, the very reasonableresponse was to reboot servers hosting the OFCs. Unfortunately,the high system load uncovered a latent OFC bug that preventedrecovery during periods of high background load.
�e system recovered a�er operators drained the entire site, dis-abled TE, and �nally restarted the OFCs from scratch. �e outagehighlighted a number of important areas for SDN andWANdeploy-ment that remain active areas of work:
�. Scalability and latency of the packet IO path between theOFC and OFA is critical and an important target for evolvingOpenFlow and improving our implementation. For exam-ple, OpenFlow might support two communication channels,high priority for latency sensitive operations such as packetIO and low priority for throughput-oriented operations suchas switch programming operations. Credit-based�ow controlwould aid in bounding the queue buildup. Allowing certainduplicate messages to be dropped would help further, e.g.,consider that the earlier of two untransmitted LSPs can sim-ply be dropped.
�. OFA should be asynchronous and multi-threaded for moreparallelism, speci�cally in a multi-linecard chassis wheremultiple switch chips may have to be programmed in parallelin response to a single OpenFlow directive.
�. We require additional performance pro�ling and reporting.�erewere a number of “warning signs” hidden in system logsduring previous operations and it was no accident that theoutage took place at our largest B� site, as it was closest to itsscalability limits.
�. Unlike traditional routing control systems, loss of a controlsession, e.g., TE-OFC connectivity, does not necessarily in-validate forwarding state. With TE, we do not automati-cally reroute existing tra�c around an unresponsive OFC
12

What assumptions about traffic?
Design makes what assumption about traffic to approach 100% utilization on some links?
• High priority traffic is in the minority• Elastic traffic is the majority (backups, offline data
analytics, ...)
When would that assumption be violated?
• Google’s user-facing wide area network


