4- bga-S) (200) WRi no.80-84 • v • NO # • • • \) 3.9R E A LI - r i & lc4 1- t , * JUN .1 91981 * - ---4-- -r - 7- • G_— — 4 —_ — N •11314:0 -1 I. 1 ' . 1 11.., t ----- --lerig•L__-- % ;-.-- - - ---- - ....... '-"— ‘,: ___ - f-7- 7:— -_, .._....... , . —____ -- ... __. oef ....„...\ SEAWATER INTRUSION AND POTENTIAL YIELD OF AQUIFERS IN THE SOQUEL-APTOS AREA, SANTA CRUZ COUNTY, CALIFORNIA U.S. GEOLOGICAL SURVEY Water-Resources Investigations 80-84 epa red in cooperation with the SOQUEL CREEK COUNTY WATER DISTRICT
Transcript
4- bga-S) (200) WRi no80-84
bull v bull NO bull bull bull
)39REALI-riamplc41-t JUN 1 91981
----4---r - 7- bull
G_mdash mdash 4 mdash_mdash Nbull113140 -1 I 1 111 t -------lerigbullL__-- --- - - ---- --mdashlsquo ___-f-7-7mdash -__
mdash____ -- __oef bdquo
SEAWATER INTRUSION AND POTENTIAL YIELD OF AQUIFERS IN THE SOQUEL-APTOS AREA SANTA CRUZ COUNTY CALIFORNIA
US GEOLOGICAL SURVEY
Water-Resources Investigations 80-84
epa red in cooperation with the
SOQUEL CREEK COUNTY WATER DISTRICT
50272 -101
1 REPORT NO 3 Recipients Accession NoREPORT DOCUMENTATION PAGE
4 Title and Subtitle 5 Report Date
October 1980SEAWATER INTRUSION AND POTENTIAL YIELD OF AQUIFERS IN THE SOQUEL-APTOS AREA SANTA CRUZ COUNTY CALIFORNIA
6
7 Author(s) 8 Performing Organization Rept No
Muir K S USGSWRI 80-84 9 Performing Organization Name and Address 10 ProjectTaskWork Unit No
US Geological Survey Water Resources Division California District Office 11 Contract(C) or Grant(G) No
345 Middlefield Road (C)
Menlo Park California 94025 (G)
12 Sponsoring Organization Name and Address 13 Type of Report amp Period Covered US Geological Survey Water Resources Division California District Office
Final 345 Middlefield Road 14
Menlo Park California 94025
15 Supplementary Notes
Prepared in cooperation with the Soquel Creek County Water District
16 Abstract (Limit 200 words)
Seawater has intruded the Purisima Formation in the interval 0-100 feet below sea
level in the Soquel-Aptos area It occurs in the central part of the area and extends
inland about half a mile
The potential yields of the two principal aquifers in the Soquel-Aptos area are
4400 acre-feet per year from the Purisima Formation and 1500 acre-feet per year from
the Aromas Sand Pumping from the Purisima Formation averaging abput 5400 acre-feet
per year since 1970 has caused water levels along the coast to decline below sea level
and has allowed seawater to enter the aquifer
Seawater intrusion and ground-water storage could be monitored in all depth zones
by expanding the observation-well network to include a number of shallow wells one deep
well inland from the coast and three deep wells along the coast
17 Document Analysis a Descriptors
Ground Water Water Utilization Saline Water Intrusion Ground-Water Availability
California Monitoring
b IdentifiersOpen-Ended Terms
Santa Cruz County Ground-Water Yield Observation Networks Purisima Formation
c COSATI FieldGroup
18 Availability Statement 19 Security Class (This Report) 121 No of Pages
UNCLASSIFIED 34No restriction on distribution 20 Security Class (This Page) 22 Price
UNCLASSIFIED (See ANSI-23918) See Instructions on Reverse OPTIONAL FORM 272 (4-77)
(Formerly NTIS-35) Department of Commerce
SEAWATER INTRUSION AND POTENTIAL YIELD OF AQUIFERS IN THE SOQUEL-APTOS AREA
SANTA CRUZ COUNTY CALIFORNIA
By K S Muir
US GEOLOGICAL SURVEY
Water-Resources Investigations 80-84
Prepared in cooperation with the
Soquel Creek County Water District
Menlo Park California October 1980
UNITED STATES DEPARTMENT OF THE INTERIOR
CECIL D ANDRUS Secretary
GEOLOGICAL SURVEY
H William Menard Director
For additional information write to
District Chief Water Resources Division US Geological Survey 345 Middlefield Rd Menlo Park Calif 94025
CONTENTS
Page Conversion factors IV Abstract 1 Introduction 2
Purpose and scope 2 Location and general features 2 Acknowledgments 4 Well-numbering system 4
Seawater intrusion 5 Geologic framework 5 Indications of seawater intrusion 6 Methods for controlling seawater intrusion 16
For readers who prefer to use metric units rather than inch-pound units the conversion factors for the terms used in this report are listed below
Multiply By To obtain
acres 04047 square hectometers acre-ft (acre-feet) 0001233 cubic hectometers acre-ftyr (acre-feet 0001233 cubic hectometers per per year) year
ft (feet) 03048 meters in (inches) 254 millimeters mi (miles) 1609 kilometers mil (square miles) 259 square kilometers
National Geodetic Vertical Datum of 1929 is a geodetic datum derived from the average sea level over a period of many years at 26 tide stations along the Atlantic Gulf of Mexico and Pacific Coasts and as such does not necessarily represent local mean sea level at any particular place To establish a more precise nomenclature the term NGVD of 1929 is used in place of Sea Level Datum of 1929 or mean sea level In the text of this report the term sea level is synonymous with National Geodetic Vertical Datum of 1929
SEAWATER INTRUSION AND POTENTIAL YIELD OF AQUIFERS IN THE SOQUEL-APTOS AREA
SANTA CRUZ COUNTY CALIFORNIA
By K S Muir
ABSTRACT
Seawater has intruded the Purisima Formation in the interval 0-100 feet below sea level in the Soquel-Aptos area It occurs in the central part of the area and extends inland about half a mile
The potential yields of the two principal aquifers in the Soquel-Aptos area are 4400 acre-feet per year from the Purisima Formation and 1500 acre-feet per year from the Aromas Sand Pumping from the Purisima Formation averaging about 5400 acre-feet per year since 1970 has caused water levels along the coast to decline below sea level and has allowed seawater to enter the aquifer
Seawater intrusion and ground-water storage could be monitored in all depth zones by expanding the observation-well network to include a number of shallow wells one deep well inland from the coast and three deep wells along the coast
1
2 SEAWATER INTRUSION SOQUEL-APTOS AREA CALIFORNIA
INTRODUCTION
Purpose and Scope
This investigation was made by the US Geological Survey in cooperation with the Soquel Creek County Water District and with financial support from the city of Santa Cruz The purpose of the study is to provide information to develop plans that will insure sufficient water for future needs of an in-creasing population The district the major public water-supply agency in the Soquel-Aptos area (fig 1) obtains its supply from 15 wells in the Purisima Formation and the Aromas Sand The city of Santa Cruz Water Depart-ment also withdraws water from the Purisima Formation If ground-water sources are inadequate to supply the increasing demands projected to the year 2020 other water sources will have to be considered
The two main factors that will limit ground-water development in the Soquel-Aptos area are seawater intrusion and potential yield of the aquifers The scope of this report is to describe where and how seawater has intruded the aquifers in the Soquel-Aptos area to determine the potential ground-water yield of the Purisima Formation - and Aromas Sand and to design an observation-well network for monitoring the status of ground-water storage and seawater intrusion
Location and General Features
The Soquel-Aptos study area covers about 50 mil extending south from the Zayante fault to Monterey Bay west to Scotts Valley and east to Watsonville (fig 1) Terrain in the north is mountainous and grades to rolling hills Well-developed marine terraces along the coastline are abruptly terminated by high cliffs
Annual precipitation almost entirely in the form of rainfall ranges from 24 to 32 inches along the coast and from 40 to 50 inches at the higher altitudes along the northern boundary Approximately 80 percent of the pre-cipitation occurs between November and March The principal streams in the area are Soquel Creek and Aptos Creek
The study area is predominantly urban and is almost completely dependent on ground water for its water supply In 1977 about 30000 people used over 7000 acre-ft of ground water to supply their domestic irrigation commer-cial and industrial water needs Increases are expected in both population and water needs for many years
3 INTRODUCTION
122- 00 5230 121deg 45 37deg07 30
37deg 00
Base from U S Geological Survey San Francisco Bay Region sheet 3 1125000 1970 MI IND MM
San Francisco
bullbull
MAP AREA N N
FIGURE 1mdashLocation of study area
4 SEAWATER INTRUSION SOQUEL-APTOS AREA CALIFORNIA
Acknowledgments
Special thanks are given to Robert M Johnson Jr General Manager and Chief Engineer and Hank Dodds Assistant Chief Engineer of the Soquel Creek County Water District for supplying geologic information well data water-level measurements pumpage records and chemical analyses of ground water Appreciation is also expressed to the many residents of the Soquel-Aptos area who allowed the Geological Survey to measure and sample their wells
Well-Numbering System
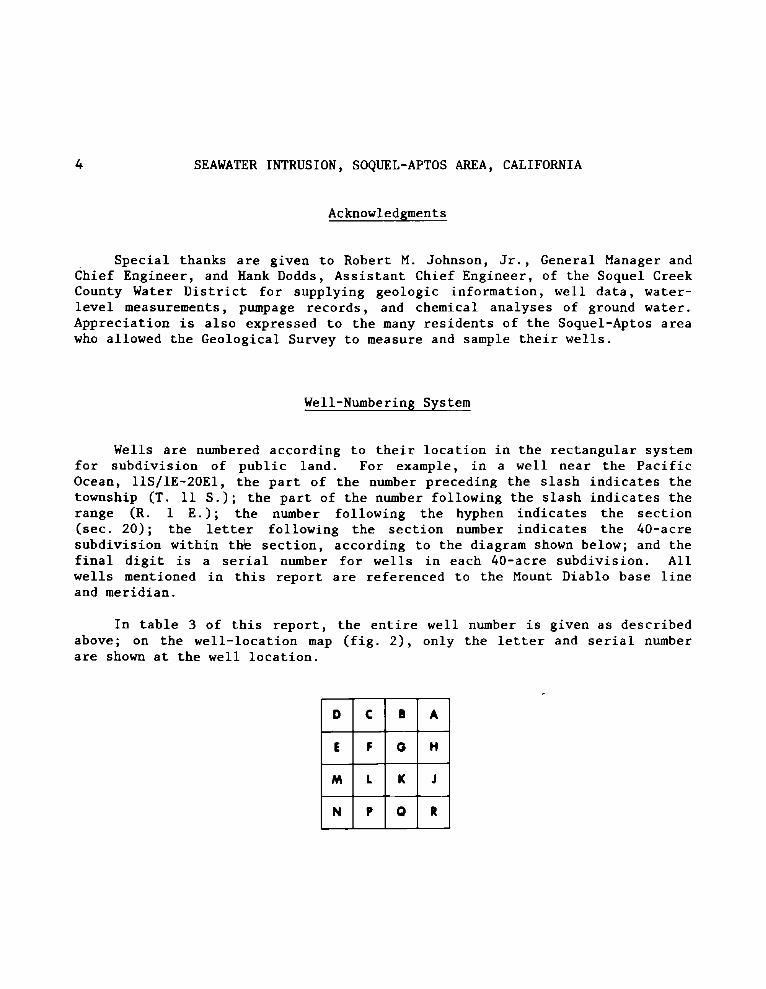
Wells are numbered according to their location in the rectangular system for subdivision of public land For example in a well near the Pacific Ocean 11S1E-20El the part of the number preceding the slash indicates the township (T 11 S) the part of the number following the slash indicates the range (R 1 E) the number following the hyphen indicates the section (sec 20) the letter following the section number indicates the 40-acre subdivision within the section according to the diagram shown below and the final digit is a serial number for wells in each 40-acre subdivision All wells mentioned in this report are referenced to the Mount Diablo base line and meridian
In table 3 of this report the entire well number is given as described above on the well-location map (fig 2) only the letter and serial number are shown at the well location
D C B A
EMI
PAL K J
N P O R
5 SEAWATER INTRUSION SOQUEL-APTOS AREA CALIFORNIA
SEAWATER INTRUSION
The landward movement of seawater induced by ground-water development of coastal aquifers may be the most important element which must be considered in plans for the proper management of ground water in this area Seawater intrusion is always a votential source of contamination of aquifers in areas where water is pumped from wells along a coast This intrusion can occur by horizontal migration of a seawater wedge into the aquifer at depth or by downward movement and subsequent lateral migration of seawater through shallow deposits adjacent to the coast or streams and estuaries containing seawater Either way the ground-water level in a coastal aquifer in relation to sea level is the factor that determines if seawater intrusion can occur Under natural conditions ground-water levels near the coast are above sea level the potentiometric surface has a seaward gradient and freshwater is dis-charged into the ocean offshore If ground-water levels in the fresh part of the aquifer decline below sea level the reversal of gradient will cause seawater to migrate landward The actual seawater-freshwater front is not a sharp line of demarcation it is a zone of diffusion where the two kinds of water intermingle resulting in a transitional zone of mixed water having a composition intermediate between fresh and salt water The width of the zone depends upon the hydraulic characteristics of the aquifer the magnitude of the periodic movement of the seawater front in response to ocean tides and the rise and fall of the water table due to recharge and pumping
Another factor that determines whether seawater will intrude a coastal aquifer is the absence or presence of a ground-water barrier If a ground-water barrier separates the landward side of the basin from its seaward exten-sion seawater intrusion may be impeded in the basin The barrier could be a fault a decrease in permeability or any geologic feature that impedes the movement of water On the other hand if there are no barriers and if ground-water levels decline seawater intrusion is likely to occur
There are no vertical ground-water barriers in the coastal part of the Soquel-Aptos area Consequently the factor controlling seawater intrusion is the ground-water level at or near the coastline Because the aquifers extend under Monterey Bay they are in contact with the ocean either on the sea floor adjacent to the coast or on the sides of Monterey Submarine Canyon several miles offshore and avenues are present for the movement of seawater into the coastal aquifer
Geologic Framework
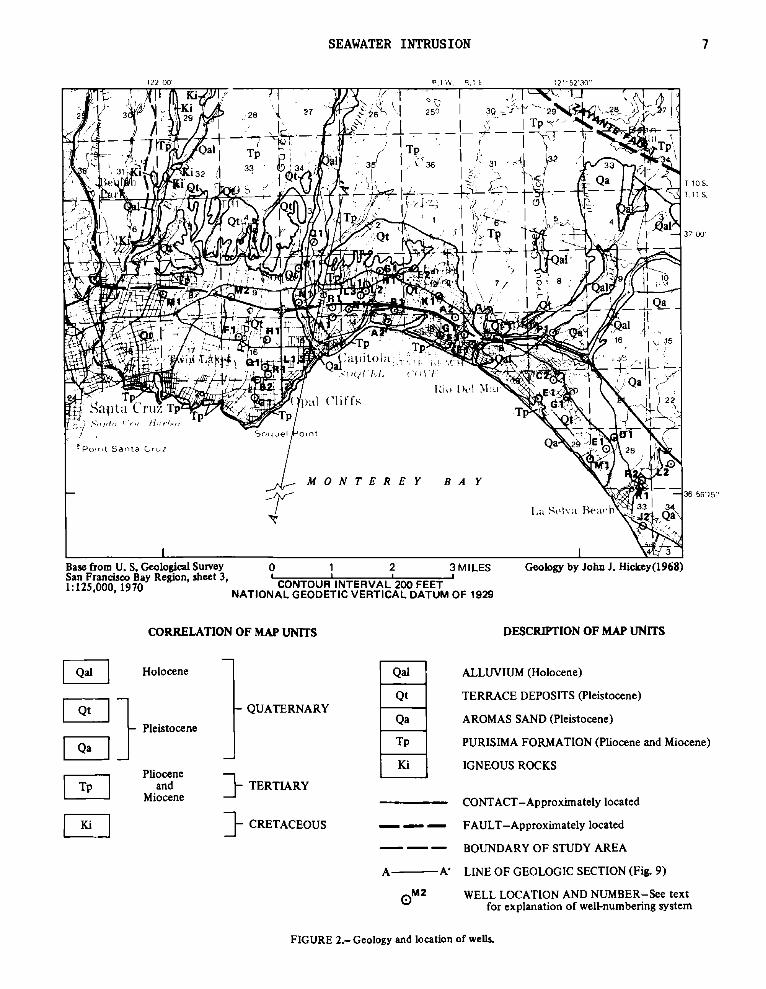
The regional geology of the Soquel-Aptos area has been described in a report by Hickey (1968) The present discussion is limited to the geology of the coastal area shown in figure 2 All the geologic units shown in figure 2 are water bearing except the igneous rocks The two principal water-bearing units are the Purisima Formation and the Aromas Sand The alluvium and the terrace deposits are thin and yield only minor quantities of ground water to wells
6 SEAWATER INTRUSION SOQUEL-APTOS AREA CALIFORNIA
The Purisima Formation of late Miocene and Pliocene age is a sequence of blue moderately to poorly consolidated silty to clean very fine to medium-grained sandstone beds interbedded with siltstone The formation underlies the entire Soquel-Aptos study area and extends southwestward under Monterey Bay It is exposed on the sea floor except in the area between about 2 mi and 7 mi offshore where bay mud overlies it (Gary Greene US Geological Survey oral commun 1978) and on the walls of Monterey Submarine Canyon The formation is predominantly of marine origin and overlies all older units unconformably In turn it is overlain unconformably by all younger units The formation has a regional dip of 3 to 5 degrees southeast In the northwestern part of the area shown in figure 2 it is about 600 ft thick near Soquel about 1000 ft thick and in the vicinity of La Selva Beach over 2000 ft thick Most of the ground water in the Purisima Formation is confined Some areas of unconfined water occur in the foothills inland from the coast It is in these inland areas that most of the recharge to the aquifer occurs The Purisima Formation is the major aquifer in the Soquel-Aptos area and the one from which most wells pump
The Aromas Sand consists of well-sorted quartzose brown-to-red sand containing lenses of silt and clay and a few lenses of gravel The sand deposited during Pleistocene time in a lagoonal shoreline environment rests unconformably on the Purisima Formation The unit crops out only in the eastern part of the area It dips about 4 degrees toward the southeast and ranges in thickness from zero near Aptos to an average of about 600 ft in the vicinity of La Selva Beach extending under Monterey Bay and exposed on the sea floor
Ground water in the Aromas Sand in general occurs under unconfined conditions but is locally confined between silty and clayey beds Recharge to the aquifer is mainly by direct infiltration of rainfall The recharge water moves southward toward the coast and toward the southeast
bull
Indications of Seawater Intrusion
One of the best indications that seawater intrusion is occurring in an aquifer is an increase in the concentration of chloride in water from wells Chloride the major constituent in seawater is relatively stable chemically and will move through an aquifer at virtually the same rate as the intruding water
Another way to recognize seawater intrusion is to compare the chloride concentrations of water from wells near the coast with those in water from wells inland If the chloride concentration of coastal well water is consid-erably higher than that of inland well water seawater intrusion is suspect
7 SEAWATER INTRUSION
12200 P1 W R1 E 121 5230
Ir I c I i I N-- 1-1
28 27 C NI
250
__ bullTp
- - 36
I
I
3Q 2-il -29
-------t2 _
4 I V
i I i 32 31 A lt-
i_ -IRmdash mdash ill
Tp
___ _
) --1 _4 -L_ _ 4_ T10 S
T11 S - 0
-bull-t I 37 00
9a1
16 15Tp TPbdquo
apitola-bdquo VIII II bull-()() ( -()IT
Qa 1 bullRio Del Mar
Tp 22pal (TiffsC ruz Tp r Tp
I rto Cr Soquel -Dint
Point Santa Cruz
MONTEREY BAY 36 5615
Ia Selva Beach 3 Qa
3
Base from U S Geological Survey 0 1 2 3 MILES Geology by John J Hickey(1968)San Francisco Bay Region sheet 3 I i 1 1125000 1970 CONTOUR INTERVAL 200 FEET
Tp and aTERTIARY Miocene CONTACTmdashApproximately located
Ki CRETACEOUS FAULTmdashApproximately locateda BOUNDARY OF STUDY AREA
A A LINE OF GEOLOGIC SECTION (Fig 9)
0M2 WELL LOCATION AND NUMBERmdashSee text for explanation of well-numbering system
FIGURE 2mdash Geology and location of wells
8 SEAWATER INTRUSION SOQUEL-APTOS AREA CALIFORNIA
Data from two principal sources were used to identify seawater intrusion in the Soquel-Aptos area (1) Long-term chemical data collected by the Soquel Creek County Water District from their supply wells (fig 3) and (2) chemical data collected by the Geological Survey in July 1978 from more than 20 private wells adjacent to the coast In addition some chemical data were available from wells owned by the city of Santa Cruz (fig 3)
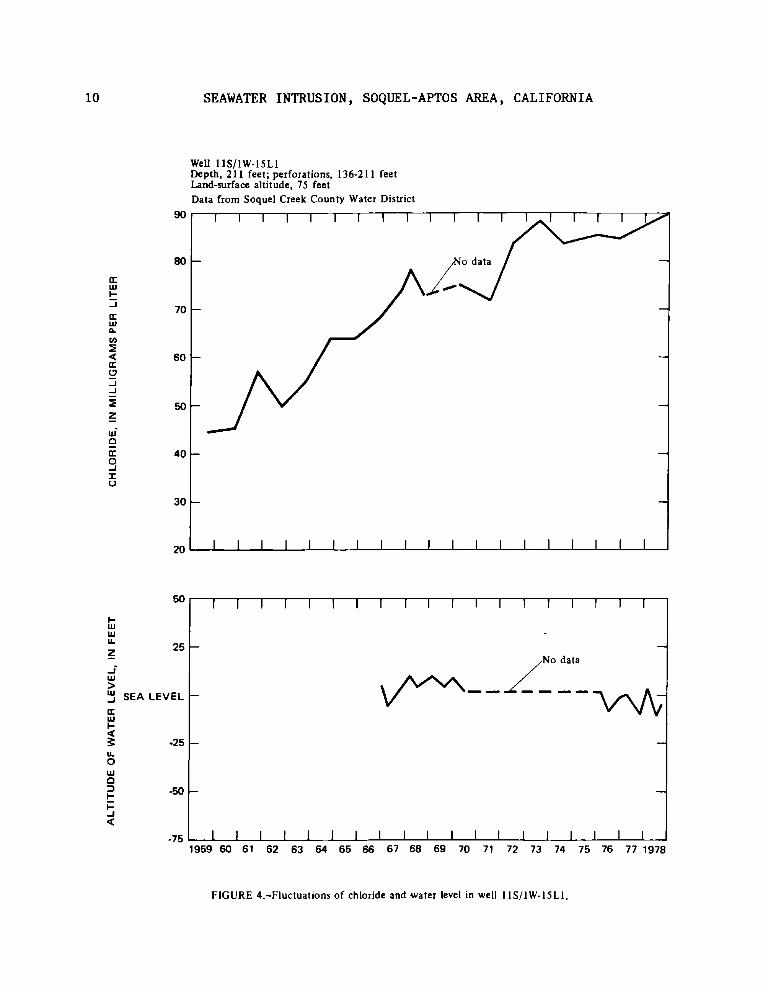
Seawater intrusion is occurring in the vicinity of Capitola in the upper part of the Purisima Formation 0-100 ft below sea level It is evidenced by a concentration of chloride in well water exceeding 100 mgL (milligrams per liter) which the author considers an indicator of seawater intrusion in the Soquel-Aptos area In unintruded parts of the Soquel-Aptos area the chloride concentration in ground water from the Purisima Formation ranges from about 20 to 80 mgL and in the Aromas Sand it is about 20 mgL (fig 3) Figure 3 shows the extent of the intrusion It appears that intrusion has been pro-gressing since 1959 or earlier This is illustrated by figure 4 the 1959-78 plot of the chloride concentration of water from well 11S1W-15L1 which obtains most of its water from the interval 0-100 ft below sea level In 1959 the chloride concentration was about 45 mgL--by 1978 it had increased to 90 mgL Seawater intrusion is also indicated by statements of some residents in the Capitola area who say that water from their shallow wells has over the past few years become salty to taste and unusable for garden and lawn irrigation
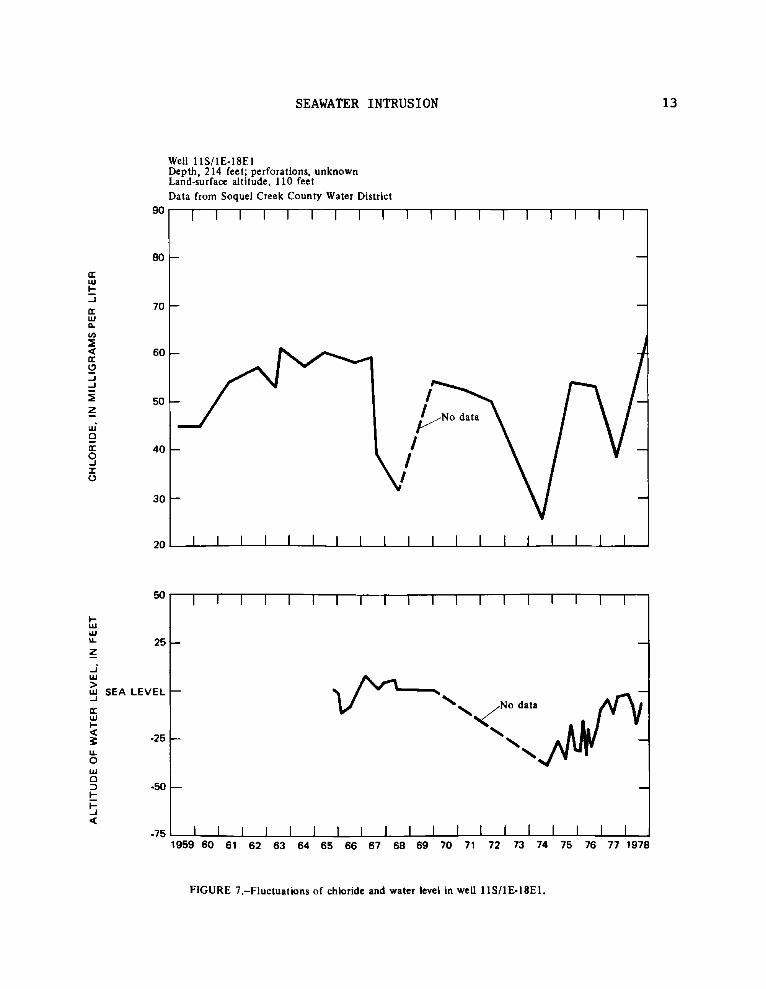
Water pumped from intervals deeper than 100 ft below sea level shows little or no increase in chloride concentration as illustrated by the plots shown in figures 5-8 These plots are for Soquel Creek County Water District supply wells in the Capitola-La Selva Beach area (fig 3) all of which pump from the deeper intervals No seawater intrusion is indicated in spite of the fact that the nonpumping water levels in most of the wells have been below sea level since the early 1970s Probably the freshwater-seawater interface is advancing landward but still lies at some distance offshore or at depth
Figure 9 is a diagrammatic geologic section showing how seawater may be intruding in the Soquel-Aptos area The interval 0-100 ft below sea level is being intruded by seawater moving into deposits exposed on the sea floor near the shoreline and then landward The seaward end of the Purisima Formation probably contains seawater that enters through the wall of Monterey Submarine Canyon and through the sea floor
Seawater intrusion is occurring because since the early 1970s ground-water pumpage which is concentrated in an area from the shoreline inland about 1 mi has reduced the head in the Purisima Formation and caused ground-water levels near the coast to decline and lie below sea level (figs 4-8) Thus a landward ground-water gradient has developed in the aquifer allowing seawater to move shoreward (fig 10)
12200 R1 W R1 E 121deg5230
EXPLANATION
APPROXIMATE LIMIT OF SEAWATER WELLS IN THE PURISIMA FORMATION INTRUSION IN THE INTERVAL Upper number is chloride concentration 0 mdash 100 FEET BELOW SEA LEVEL in milligrams per liter lower two numbers JULY 1978 are altitudes of top and bottom of perfo-
rated interval in feet below or above (+) National Geodetic Vertical Datum of 1929
36 Lower single number is altitude of well bottom in feet where perforated interval is not known T10 S
T11 S33 Soquel Creek County Water District 270-810 January 1979
_47__ Privately owned July 197815-71 3700
City of Santa Cruz April 197864111
Box indicates well is perforated in the Aromas Sand
22
Si oto Horbor
APO
23 100140
36deg5615
34
Oft
moi
SfIE
LN
I 111
1V
ti VaS
Base from U S Geological Survey 0 2 3 MILES San Francisco Bay Region sheet 3 1125000 1970
CONTOUR INTERVAL 200 FEET NATIONAL GEODETIC VERTICAL DATUM OF 1929
FIGURE 3 mdash Chloride concentration of water from wells altitudes of perforated intervals and approximate landward limit of seawater intrusion July 1978
10 SEAWATER INTRUSION SOQUEL-APTOS AREA CALIFORNIA C
HL
OR
IDE
IN
MIL
LIG
RA
MS
PE
R L
ITE
R
70
60
50
40
30
20
50
Imdash w w u_
25Z
_i w gt Ill_j SEA LEVEL tx w Imdash lt
-25 u 0 w 0 D -50Imdash i=_1Q
-75
Well 11S1W-15L1 Depth 211 feet perforations 136-211 feet Land-surface altitude 75 feet Data from Soquel Creek County Water District
DISTANCE IN MILES FROM SHORELINE VERTICAL EXAGGERATION X 26
EXPLANATION
BAY MUD APPROXIMATE LIMIT OF SEAWATER INTRUSION
O 0 GRAVEL AND SAND (Terrace deposits) ARROW INDICATES DIRECTION OF FLOW
bull SAND SILT AND CLAY (Purisirna Formation) MEM+ Seawater
bull bull bull
bull bull bull CONSOLIDATED ROCK (Igneous rocks) Freshwater
NO
ISIP
1IN
IH
ILVM
VH
S
FIGURE 9mdashGeneralized geologic section showing zones intruded by seawater (see fig 2 for location of section) Ln
16 SEAWATER INTRUSION SOQUEL-APTOS AREA CALIFORNIA
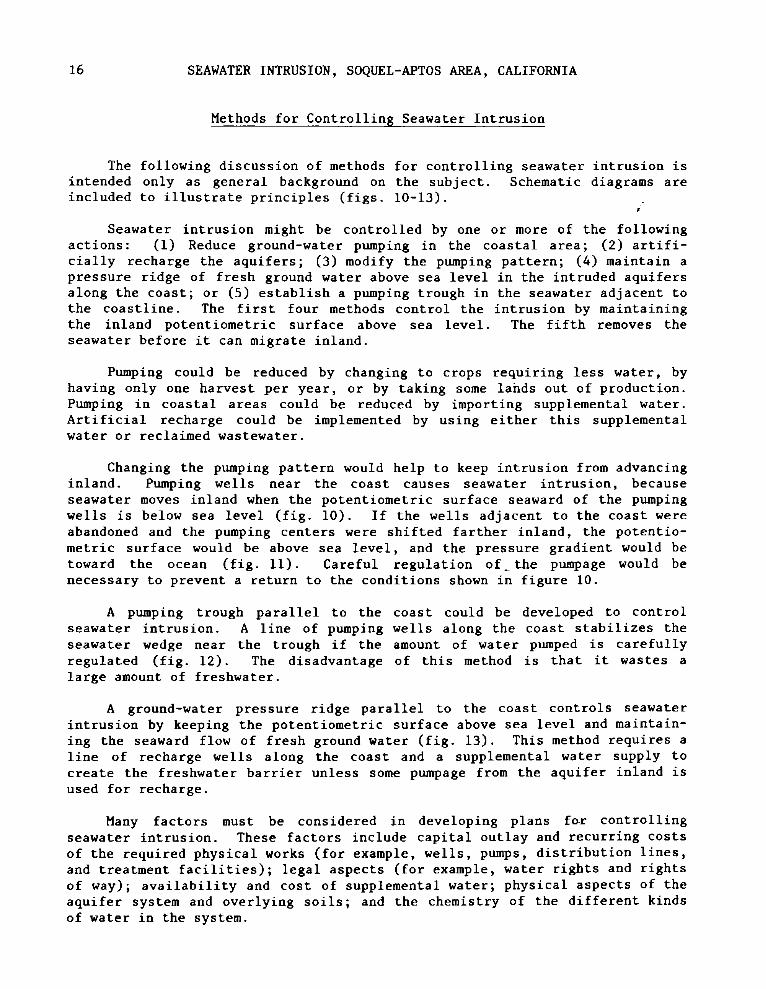
Methods for Controlling Seawater Intrusion
The following discussion of methods for controlling seawater intrusion is intended only as general background on the subject Schematic diagrams are included to illustrate principles (figs 10-13)
Seawater intrusion might be controlled by one or more of the following actions (1) Reduce ground-water pumping in the coastal area (2) artifi-cially recharge the aquifers (3) modify the pumping pattern (4) maintain a pressure ridge of fresh ground water above sea level in the intruded aquifers along the coast or (5) establish a pumping trough in the seawater adjacent to the coastline The first four methods control the intrusion by maintaining the inland potentiometric surface above sea level The fifth removes the seawater before it can migrate inland
Pumping could be reduced by changing to crops requiring less water by having only one harvest per year or by taking some lands out of production Pumping in coastal areas could be reduced by importing supplemental water Artificial recharge could be implemented by using either this supplemental water or reclaimed wastewater
Changing the pumping pattern would help to keep intrusion from advancing inland Pumping wells near the coast causes seawater intrusion because seawater moves inland when the potentiometric surface seaward of the pumping wells is below sea level (fig 10) If the wells adjacent to the coast were abandoned and the pumping centers were shifted farther inland the potentio-metric surface would be above sea level and the pressure gradient would be toward the ocean (fig 11) Careful regulation of the pumpage would be necessary to prevent a return to the conditions shown in figure 10
A pumping trough parallel to the coast could be developed to control seawater intrusion A line of pumping wells along the coast stabilizes the seawater wedge near the trough if the amount of water pumped is carefully regulated (fig 12) The disadvantage of this method is that it wastes a large amount of freshwater
A ground-water pressure ridge parallel to the coast controls seawater intrusion by keeping the potentiometric surface above sea level and maintain-ing the seaward flow of fresh ground water (fig 13) This method requires a line of recharge wells along the coast and a supplemental water supply to create the freshwater barrier unless some pumpage from the aquifer inland is used for recharge
Many factors must be considered in developing plans far controlling seawater intrusion These factors include capital outlay and recurring costs of the required physical works (for example wells pumps distribution lines and treatment facilities) legal aspects (for example water rights and rights of way) availability and cost of supplemental water physical aspects of the aquifer system and overlying soils and the chemistry of the different kinds of water in the system
17 SEAWATER INTRUS ION
Bra
ckis
h w
ate
r
LAND SURFACPumping wells POTENTIOMETRIC SURFACE
SEA LEVEL
onfming be
Perforated interval
AQUIFER SEAWATER WEDGE
Fresh ground water
ARROWSmdashIndicate direction of water flow
FIGURE 10mdashSchematic section at coast showing influence of coastal pumping on seawater intrusion
POTENTIOMETRIC SURFACE A Pumping
wells
SEA LEVEL
SEAWATER WEDGE
ARROWS mdashIndicate direction of water flow
FIGURE 11mdashSchematic section at coast showing influence of inland pumping on seawater intrusion
18 SEAWATER INTRUSION SOQUELmdashAPTOS AREA CALIFORNIA
Fres
hwat
er
POTENTIOMETRIC SURFACE A Pumping well
Line of pumping wells
LAND SURFACESEA LEVEL
-4mdash7mdash AQUIFER ----411- _AmdashN
SEAWATER WEDGE Fresh ground water _
Stable seawater wedgeARROWS-Indicate direction of water flow
FIGURE 12-Schematic section at coast showing effects of a pumping trough on seawater intrusion
Fre
shw
ater
POTENTIOMETRIC SURFACE Pumping well
LAND SURFACELine of recharging wells
SEA LEVEL
SEAWATER WEDGE
ARROWS-Indicate direction of water flow
FIGURE 13mdashSchematic section at coast showing effects of a pressure ridge on seawater intrusion
19 SEAWATER INTRUSION SOQUEL-APTOS AREA CALIFORNIA
POTENTIAL AQUIFER YIELD
In this report the potential aquifer yield in the Soquel-Aptos area is defined as the long-term average inflow to the ground-water reservoir minus unrecoverable water lost to evapotranspiration and the quantity of underflow to the ocean necessary to maintain a barrier against seawater intrusion
The Soquel Creek County Water District and city of Santa Cruz Water Department pump water from the Purisima Formation which is the main aquifer in the area The Soquel Creek County Water District also pumps from the Aromas Sand located in the vicinity of La Selva Beach (fig 14) A separate potential yield value was determined for each of the aquifers
The techniques used to estimate potential ground-water yield for this report have been used by many investigators (see Todd 1964 p 206-208) Those used to determine the yield for the Purisima Formation and Aromas Sand although not specifying an item-by-item evaluation of inflow and outflow are based on the general equation of hydrologic equilibrium
Surface inflow Surface outflow + Subsurface inflow + Subsurface outflow + Precipitation = + Consumptive use + Imported water + Exported water + Decrease in surface storage + Increase in surface storage + Decrease in ground-water storage + Increase in ground-water storage
Purisima Formation
The potential yield of the Purisima Formation is shown by the relation between average annual pumpage and the corresponding average annual net change of ground water in storage for a base period in which climatic conditions approximate the long-term average For simplicity the base period spring 1962 to spring 1975 was selected because ground-water storage was the same at the end of the period as it was at the beginning Therefore average inflow was equal to average outflow and potential yield was equal to the average pump-age The hydrograph for well 11S1W-10C1 has water-level fluctuations con-sidered representative of those in the Purisima Formation and was used to make the estimates of potential yield (fig 15)
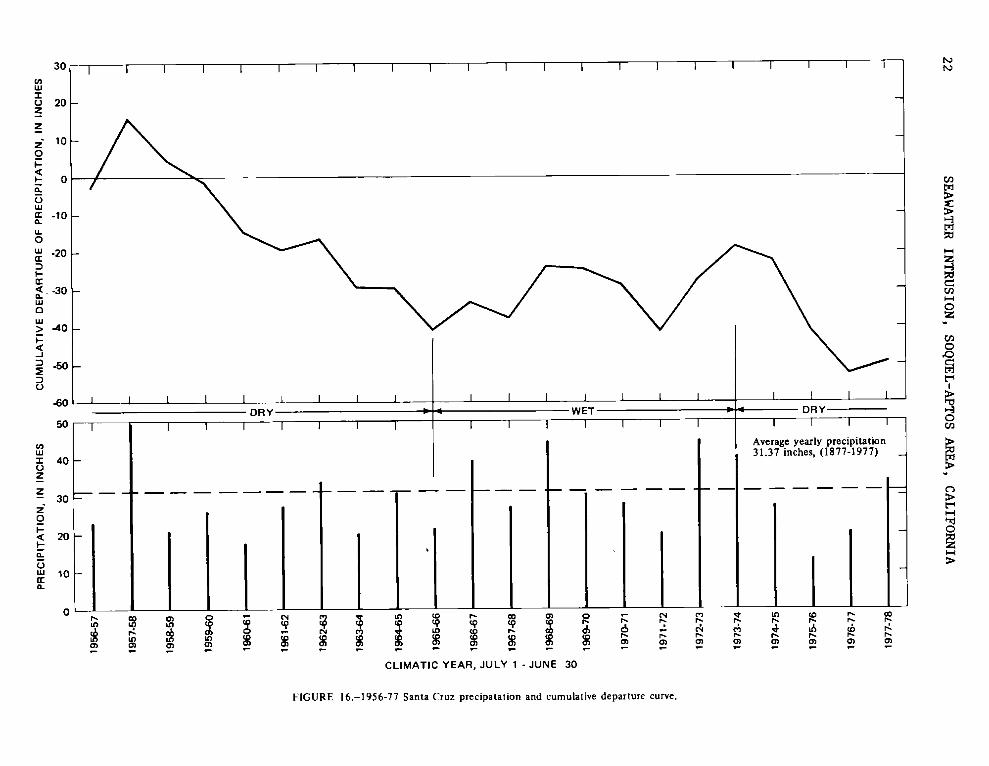
On the cumulative departure curve (fig 16) a line joining the beginning and end of the period 1962-1975 would be nearly horizontal indicating that the average rainfall for that period was close to the long-term average In fact rainfall was 98 percent of the 100-year average To be representative climatically a base period should include a wet period and a dry period The base period spring 1962 to spring 1975 includes parts of two dry periods and a complete wet period It is important also to select a period that does not begin after or end with an extremely wet year because of the water-in-transit problem It may take a year or more for the water levels to fully reflect recharge from a wet year Figure 16 indicates that neither the 1960-61 or 1974-75 rainfall years were wet years
20 SEAWATER INTRUSION SOQUEL-APTOS AREA CALIFORNIA
122deg00 5230 121deg45 37deg0730
37deg00
Sibnr Cr
La Selva Beach
I 0 A 7 4
R
0 1 2 3 4 5 MILESI I I
Base from U S Geological Survey San Francisco Bay Region sheet 3 1125000 1970
EXPLANATION
PURISIMA FORMATION
AROMAS SAND Ammorilormarmmomm
FAULT mdash Approximately located
FIGURE I4mdashAreas for which potential aquifer yield was determined
21 POTENTIAL AQUIFER YIELD
AL
TIT
UD
EO
F W
AT
ER
LE
VE
L I
N F
EE
T
Well 11S1W-10C1 Depth 350 feet perforations unknown Land-surface altitude 90 feet Data from California Department of Water Resources
FIGURE 15mdashFluctuation of water level in well 1151 W-10C1
The 1962-75 period fits the required criteria for a valid base period Therefore the potential ground-water yield of the Purisima Formation in the Soquel-Aptos area based on 1962-75 conditions and on average annual pumpage (4400 acre-ft) as determined from table 1 is about 4400 acre-ftyr
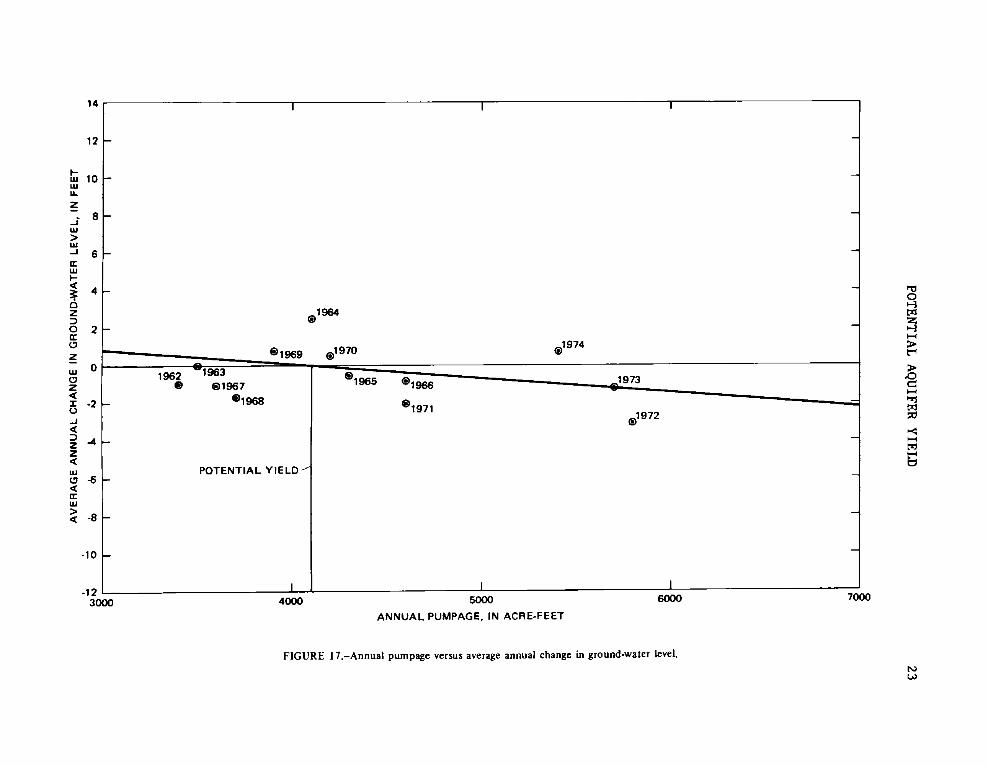
The estimated yield value was checked by plotting the annual average change in ground-water levels in all wells measured against annual pumpage (fig 17) If inflow to the aquifer is reasonably constant the points can be fitted to a straight line and pumpage corresponding to zero change in water level equals the potential yield The zero change in water level in figure 17 is at a point corresponding to 4100 acre-ft a quantity which agrees reasonably well with the yield figure determined in the previous paragraph
PR
EC
IPIT
AT
ION
IN
IN
CH
ES
C
UM
UL
AT
IVE
DE
PA
RT
UR
E O
F P
RE
CIP
ITA
TIO
N IN
IN
CH
ES
n
) CJ
it
(
71
6)
Ja
eJ
43
N3
C1
0
8 0
0
0
0
0
0
0
0
8 8
0
0
I I
I 1
I 1
I
FIGU RE 16 -1956-77 Santa Cruzprecipatationand cumulative departurecurve
1 OC 3N1 111--IAinr 1IV3A 011V141 110
1956
-57
1957
-58
1958
-59
1959
-60
1960
-61
1961
-62
1962
-63
1963
-64
1964
-65
1965
-66
1966
-67
1967
-68
1968
-69
1969
-70
1970
-71
1971
-72
1972
-73
1973
-74
1974
-75
1975
-76
D 33 m II
1976
-77
1977
-78
I
VINTIIWD yaw samv-ianOos Noisnalsi aummvas
ZZ
AV
ER
AG
E A
NN
UA
L C
HA
NG
E IN
GR
OU
ND
- WA
TE
R L
EV
EL
IN
FE
ET
mu
uaai
rew avimagm
14
12
10
1964 0
491969 01970 1974
o
1962 euro
01)1963 euro01967 1965 01966 1973
611968 6)1971
1972e-4 mdash
POTENTIAL YIELD --- -6 --
-10
-12 3000
I 4000
I 5000
I 6000
ANNUAL PUMPAGE IN ACRE-FEET
FIGURE 17mdashAnnual pumpage versus average annual change in ground-water level
24 SEAWATER INTRUSION SOQUEL-APTOS AREA CALIFORNIA
TABLE 1 - Pumpage in acre-feet from Purisima Formation 1962-74
CentralSoquel Miscel-
City Santa Miscel-Creek laneous
Agri- of Indus- Cruz laneousCounty water
Year cul- Santa trial3 County domestic TotalWater pur-
Metered 2Agriculture pumpage was computed from total electrical energy used for
pumping water and the electrical energy required to pump a unit volume of water 3Estimated
Aromas Sand
The potential yield of the Aromas Sand was estimated by comparing the average annual pumpage with the corresponding average annual net change of ground water in storage The estimate does not have the same degree of accu-racy as that determined for the Purisima Formation because long-term water-level fluctuations are available only for the coastal part of the aquifer and not for the large part of the recharge area several miles inland The hydro-graphs of wells 11S1E-28D1 and 11S1E-28R2 (fig 18) indicate that ground-water storage in 1977 was about the same as in 1966 Therefore average
25 POTENTIAL AQUIFER YIELD
AL
TIT
UD
E O
F W
AT
ER
LE
VE
L I
NF
EE
T
Well 11S1E-28R2 Depth 290 feet perforations 250-290 feet Land-surface altitude 150 feet Well 11S1E-28D1 Depth 550 feet perforations 310-550 feet Land-surface altitude 120 feet Data from Soquel Creek County Water District
FIGURE 18mdashFluctuation of water level in wells 11S1E-28D1 and 28R2
inflow for the 1966-77 period was equal to average outflow and ground-water yield is equal to average annual pumpage The period includes a wet cycle (fig 16) and 3 years of a dry cycle including the drought years 1975-76 and 1976-77 Neither the 1964-65 nor the 1976-77 rainfall year was extremely wet so there is no water-in-transit problem with the base period Average rainfall for the 1966-77 base period was 2946 inches about 94 percent of the 100-year average This means that inflow to the ground-water reservoir for the 1966-77 period was slightly less than the long-term average and an esti-mate of ground-water yield based on average annual pumpage for this period is probably conservative The ground-water yield of the Aromas Sand in the Soquel-Aptos area based on 1966-76 conditions and on average pumpage as determined from table 2 is about 1500 acre-ftyr
26 SEAWATER INTRUSION SOQUEL-APTOS AREA CALIFORNIA
TABLE 2 - Pumpage in acre-feet from Aromas Sand 1966-77
Metered 2Agriculture pumpage was computed from total electricalenergy used for
pumping water and the electrical energy required to pump a unit volume of water 3Estimated
OBSERVATION-WELL NETWORK
The objective of an observation-well network in the Soquel-Aptos area is to function as an early warning system to alert those responsible for managing and protecting the ground-water resources of the area from adverse changes Water-level measurements in wells are necessary to indicate the effects of pumping on the ground-water system and the status of ground-water storage Ground-water sample analyses are needed to monitor seawater intrusion and other water-quality changes
At the present time the Soquel Creek County Water District makes monthly pumping and nonpumping water-level measurements in 15 supply wells The same wells are sampled every autumn and analyzed for major-ion concentration including total alkalinity (as CaCO3) bicarbonate boron calcium chloride specific conductance dissolved solids fluoride iron magnesium potassium silica sodium sulfate and nitrate plus nitrite as nitrogen The California Department of Water Resources measures water levels in wells 11S1W-10C1 and 15E2 (USGS 16H1) at monthly intervals
27 OBSERVATION-WELL NETWORK
TABLE 3 - Potential observation-well network
Type of data and frequency of collection
Water level Water quality Well Depth
April Chloride and specific conductance Major ionsNo (ft)
Monthly and April September September
September
10S1W-27J1 238 X 11S1W-9M2 110 X X X 11S1W-10C1 350 X X X 11S1W-11L1 628 X X x 11S1W-11L2 650 X X x 11S1W-11L3 150 X X X 11S1W-11N1 398 X X x 11S1W-11R1 220 X X X 11S1W-12K1 1020 X X x 11S1W-131 700-800 X X X 11S1W-13G1 330 X X x 11S1W-14A2 194 X X x 11S1W-151 700-800 X X x 11S1W-15A1 168 X X x 11S1W-15L1 211 X X x 11S1W-15L2 256 X X x 11S1W-16H1 101 X 11S1W-16Q1 98 X X X 11S1E-17F1 460 X X x 11S1E-18E1 214 X X x 11S1E-18F1 713 X X x 11S1E-191 700-800 X X X 11S1E-20E1 400 X X x 11S1E-20G1 495 X X x 11S1E-28D1 550 X X x 11S1E-28M1 184 X X X 11S1E-28R1 355 X X x 11S1E-28R2 290 X X x 11S1E-33J2 205 X X X
1Well to be drilled
Table 3 and figure 19 show the wells in the current observation network and the wells that could be used to expand the network for more effective monitoring Additional shallow wells that might monitor the depth interval now being intruded by seawater are 11S1W-9M2 11L3 11R1 14A2 15A1 and 16Q1 and 11S1E-28M1 and 33J2 Observations made at these wells would be most effective if made twice yearly in April when ground-water storage is highest and in September when ground-water storage is lowest Water-level measurements will show the status of ground-water storage and determination of chloride concentration and specific conductance in water samples will show changes in water quality The 15 district supply wells would also be most effectively monitored in April and September The April samples need only be analyzed for chloride and the specific conductance determined Complete chemical analyses of the September samples would be needed Water-level measurements are currently being taken at district supply wells at monthly intervals The addition of April and September water-level data from well 10S1W-27J1 would help to monitor changes in ground-water storage in the Purisima Formation in the central part of the Soquel-Aptos area
12T 00 R1 W R1 E 121deg5230
co
29 bdquo Amdash I
EXPLANATION
Soquel Creek County Water Districtbull supply-well observation network
4) Well monitored by California Depart- T10 S ment of Water Resources T11 S
3 Shallow well to be added to observation network
37-00bull Deep well to be added to observation network
bull Well to be drilled
VIt
2IO
3IIV
3 ` N
ois
nu
m u
nvm
vas
tilrrrtn Craz Harbor
(1AS -r CL AkL) -eES
Point Santa Cruz
Base from U S Geological Survey San Francisco Bay Region sheet 3 1125000 1970
apitola TAlE BF A-
uurpf ()SH(1
Rio Del Mar op Opal Cliffs au
Soquel Point
MONTEREY BAY 365615
La Selva Beach
4
0 1 2 3 MILES
CONTOUR INTERVAL 200 FEET NATIONAL GEODETIC VERTICAL DATUM OF 1929
Three new wells 700-800 ft deep and adjacent to the coast one in SWk sec 13 T 11 S R 1 W one in SEA sec 15 T 11 S R 1 W and one in SWk sec 19 T 11 S R 1 E could monitor the lower part of the Purisima Formation Data from these wells might be used to detect the advancing sea-water front at depth before it reaches the Soquel Creek County Water District wells
CONCLUSIONS
Ground-water pumpage from the Purisima Formation a confined aquifer has averaged about 5400 acre-ftyr since 1970--1000 acre-ftyr more than its potential yield of 4400 acre-ftyr This pumping has caused a decrease in freshwater head and water levels in wells along the coast have declined to below sea level Prior to the 1970s the head was sufficient to produce a seaward gradient and freshwater was discharged into the ocean at the outcrop of the aquifer maintaining the freshwater-seawater interface an unknown but probably considerable distance offshore Since the early 1970s the reduction of head has reversed the ground-water gradient in the aquifer and has brought about conditions that are favorable for migration of seawater landward Seawater intrusion has resulted and has progressed in the interval 0-100 ft below sea level to the vicinity of Capitola Intrusion has been detected in this shallow interval first probably because it crops out near shore on the floor of Monterey Bay and seawater had only a short distance to travel to reach shallow wells
It is unknown how long it will take seawater to intrude the inland parts of the deeper zones if indeed it ever does It will depend on how carefully pumpage with its effect on freshwater head is managed As the freshwater head is reduced seawater will move landward and a new freshwater-saltwater interface will be established If the interface reaches deep wells then saltwater will be pumped Conversely if the freshwater head is increased the interface will move seaward and the threat of seawater intrusion will be eliminated
Ground-water pumpage from the Aromas Sand in the vicinity of La Selva Beach (fig 14) has been near its potential yield--about 1500 acre-ftyr--since the early 1970s No changes in the quantity of ground water in storage or in water quality have been observed
An observation-well network could be established to monitor status of ground-water storage and water quality
REFERENCES CITED
Hickey J J 1968 Hydrogeologic study of the Soquel-Aptos area Santa Cruz County California US Geological Survey open-file report 48 p
Todd D K 1964 Ground water hydrology New York John Wiley 336 p
bull bull
bull bull
bull r
4 A
bull -
obdquo rtt
s bull bull
bulllsquo44
bull
mdashbull
t s
s O
t
4 lsquo-zii bullIc
44
-t- ---bull
f4 4
ibdquobull
-4
bull
- bullbull
t --bdquo
-r4
2-
bullbullbull
x bull k
4
$
bull bull
1
a
bull bull 70bull
It bullbullbull
raf 1 i
oo
- bull 4 bull
sis
bull
x bull
bdquo
s
sY
bull
1 il
rik
- tr
-bull bull
bull
1-
t
bull
os
4
to7 1
I
r bull
-~4 44
aorss i
bull Ns4
bull bullsio
mdashso
bull o
bull -4
hi
Ot i
bull
USGS LIBRARY - RESTON
Muir--SEAWATER INTRUSION SOQUEL-APTOS AREA SANTA CRUZ COUNTY CALIFORNIA--WRI 80-84
0CO
COOOOOC
O
Page 1
Page 2
Page 3
Page 4
Page 5
Page 6
Page 7
Page 8
Page 9
Page 10
Page 11
Page 12
Page 13
Page 14
Page 15
Page 16
Page 17
Page 18
Page 19
Page 20
Page 21
Page 22
Page 23
Page 24
Page 25
Page 26
Page 27
Page 28
Page 29
Page 30
Page 31
Page 32
Page 33
Page 34
Page 35
Page 36
Page 37
Page 38
Page 39
Page 40
50272 -101
1 REPORT NO 3 Recipients Accession NoREPORT DOCUMENTATION PAGE
4 Title and Subtitle 5 Report Date
October 1980SEAWATER INTRUSION AND POTENTIAL YIELD OF AQUIFERS IN THE SOQUEL-APTOS AREA SANTA CRUZ COUNTY CALIFORNIA
6
7 Author(s) 8 Performing Organization Rept No
Muir K S USGSWRI 80-84 9 Performing Organization Name and Address 10 ProjectTaskWork Unit No
US Geological Survey Water Resources Division California District Office 11 Contract(C) or Grant(G) No
345 Middlefield Road (C)
Menlo Park California 94025 (G)
12 Sponsoring Organization Name and Address 13 Type of Report amp Period Covered US Geological Survey Water Resources Division California District Office
Final 345 Middlefield Road 14
Menlo Park California 94025
15 Supplementary Notes
Prepared in cooperation with the Soquel Creek County Water District
16 Abstract (Limit 200 words)
Seawater has intruded the Purisima Formation in the interval 0-100 feet below sea
level in the Soquel-Aptos area It occurs in the central part of the area and extends
inland about half a mile
The potential yields of the two principal aquifers in the Soquel-Aptos area are
4400 acre-feet per year from the Purisima Formation and 1500 acre-feet per year from
the Aromas Sand Pumping from the Purisima Formation averaging abput 5400 acre-feet
per year since 1970 has caused water levels along the coast to decline below sea level
and has allowed seawater to enter the aquifer
Seawater intrusion and ground-water storage could be monitored in all depth zones
by expanding the observation-well network to include a number of shallow wells one deep
well inland from the coast and three deep wells along the coast
17 Document Analysis a Descriptors
Ground Water Water Utilization Saline Water Intrusion Ground-Water Availability
California Monitoring
b IdentifiersOpen-Ended Terms
Santa Cruz County Ground-Water Yield Observation Networks Purisima Formation
c COSATI FieldGroup
18 Availability Statement 19 Security Class (This Report) 121 No of Pages
UNCLASSIFIED 34No restriction on distribution 20 Security Class (This Page) 22 Price
UNCLASSIFIED (See ANSI-23918) See Instructions on Reverse OPTIONAL FORM 272 (4-77)
(Formerly NTIS-35) Department of Commerce
SEAWATER INTRUSION AND POTENTIAL YIELD OF AQUIFERS IN THE SOQUEL-APTOS AREA
SANTA CRUZ COUNTY CALIFORNIA
By K S Muir
US GEOLOGICAL SURVEY
Water-Resources Investigations 80-84
Prepared in cooperation with the
Soquel Creek County Water District
Menlo Park California October 1980
UNITED STATES DEPARTMENT OF THE INTERIOR
CECIL D ANDRUS Secretary
GEOLOGICAL SURVEY
H William Menard Director
For additional information write to
District Chief Water Resources Division US Geological Survey 345 Middlefield Rd Menlo Park Calif 94025
CONTENTS
Page Conversion factors IV Abstract 1 Introduction 2
Purpose and scope 2 Location and general features 2 Acknowledgments 4 Well-numbering system 4
Seawater intrusion 5 Geologic framework 5 Indications of seawater intrusion 6 Methods for controlling seawater intrusion 16
For readers who prefer to use metric units rather than inch-pound units the conversion factors for the terms used in this report are listed below
Multiply By To obtain
acres 04047 square hectometers acre-ft (acre-feet) 0001233 cubic hectometers acre-ftyr (acre-feet 0001233 cubic hectometers per per year) year
ft (feet) 03048 meters in (inches) 254 millimeters mi (miles) 1609 kilometers mil (square miles) 259 square kilometers
National Geodetic Vertical Datum of 1929 is a geodetic datum derived from the average sea level over a period of many years at 26 tide stations along the Atlantic Gulf of Mexico and Pacific Coasts and as such does not necessarily represent local mean sea level at any particular place To establish a more precise nomenclature the term NGVD of 1929 is used in place of Sea Level Datum of 1929 or mean sea level In the text of this report the term sea level is synonymous with National Geodetic Vertical Datum of 1929
SEAWATER INTRUSION AND POTENTIAL YIELD OF AQUIFERS IN THE SOQUEL-APTOS AREA
SANTA CRUZ COUNTY CALIFORNIA
By K S Muir
ABSTRACT
Seawater has intruded the Purisima Formation in the interval 0-100 feet below sea level in the Soquel-Aptos area It occurs in the central part of the area and extends inland about half a mile
The potential yields of the two principal aquifers in the Soquel-Aptos area are 4400 acre-feet per year from the Purisima Formation and 1500 acre-feet per year from the Aromas Sand Pumping from the Purisima Formation averaging about 5400 acre-feet per year since 1970 has caused water levels along the coast to decline below sea level and has allowed seawater to enter the aquifer
Seawater intrusion and ground-water storage could be monitored in all depth zones by expanding the observation-well network to include a number of shallow wells one deep well inland from the coast and three deep wells along the coast
1
2 SEAWATER INTRUSION SOQUEL-APTOS AREA CALIFORNIA
INTRODUCTION
Purpose and Scope
This investigation was made by the US Geological Survey in cooperation with the Soquel Creek County Water District and with financial support from the city of Santa Cruz The purpose of the study is to provide information to develop plans that will insure sufficient water for future needs of an in-creasing population The district the major public water-supply agency in the Soquel-Aptos area (fig 1) obtains its supply from 15 wells in the Purisima Formation and the Aromas Sand The city of Santa Cruz Water Depart-ment also withdraws water from the Purisima Formation If ground-water sources are inadequate to supply the increasing demands projected to the year 2020 other water sources will have to be considered
The two main factors that will limit ground-water development in the Soquel-Aptos area are seawater intrusion and potential yield of the aquifers The scope of this report is to describe where and how seawater has intruded the aquifers in the Soquel-Aptos area to determine the potential ground-water yield of the Purisima Formation - and Aromas Sand and to design an observation-well network for monitoring the status of ground-water storage and seawater intrusion
Location and General Features
The Soquel-Aptos study area covers about 50 mil extending south from the Zayante fault to Monterey Bay west to Scotts Valley and east to Watsonville (fig 1) Terrain in the north is mountainous and grades to rolling hills Well-developed marine terraces along the coastline are abruptly terminated by high cliffs
Annual precipitation almost entirely in the form of rainfall ranges from 24 to 32 inches along the coast and from 40 to 50 inches at the higher altitudes along the northern boundary Approximately 80 percent of the pre-cipitation occurs between November and March The principal streams in the area are Soquel Creek and Aptos Creek
The study area is predominantly urban and is almost completely dependent on ground water for its water supply In 1977 about 30000 people used over 7000 acre-ft of ground water to supply their domestic irrigation commer-cial and industrial water needs Increases are expected in both population and water needs for many years
3 INTRODUCTION
122- 00 5230 121deg 45 37deg07 30
37deg 00
Base from U S Geological Survey San Francisco Bay Region sheet 3 1125000 1970 MI IND MM
San Francisco
bullbull
MAP AREA N N
FIGURE 1mdashLocation of study area
4 SEAWATER INTRUSION SOQUEL-APTOS AREA CALIFORNIA
Acknowledgments
Special thanks are given to Robert M Johnson Jr General Manager and Chief Engineer and Hank Dodds Assistant Chief Engineer of the Soquel Creek County Water District for supplying geologic information well data water-level measurements pumpage records and chemical analyses of ground water Appreciation is also expressed to the many residents of the Soquel-Aptos area who allowed the Geological Survey to measure and sample their wells
Well-Numbering System
Wells are numbered according to their location in the rectangular system for subdivision of public land For example in a well near the Pacific Ocean 11S1E-20El the part of the number preceding the slash indicates the township (T 11 S) the part of the number following the slash indicates the range (R 1 E) the number following the hyphen indicates the section (sec 20) the letter following the section number indicates the 40-acre subdivision within the section according to the diagram shown below and the final digit is a serial number for wells in each 40-acre subdivision All wells mentioned in this report are referenced to the Mount Diablo base line and meridian
In table 3 of this report the entire well number is given as described above on the well-location map (fig 2) only the letter and serial number are shown at the well location
D C B A
EMI
PAL K J
N P O R
5 SEAWATER INTRUSION SOQUEL-APTOS AREA CALIFORNIA
SEAWATER INTRUSION
The landward movement of seawater induced by ground-water development of coastal aquifers may be the most important element which must be considered in plans for the proper management of ground water in this area Seawater intrusion is always a votential source of contamination of aquifers in areas where water is pumped from wells along a coast This intrusion can occur by horizontal migration of a seawater wedge into the aquifer at depth or by downward movement and subsequent lateral migration of seawater through shallow deposits adjacent to the coast or streams and estuaries containing seawater Either way the ground-water level in a coastal aquifer in relation to sea level is the factor that determines if seawater intrusion can occur Under natural conditions ground-water levels near the coast are above sea level the potentiometric surface has a seaward gradient and freshwater is dis-charged into the ocean offshore If ground-water levels in the fresh part of the aquifer decline below sea level the reversal of gradient will cause seawater to migrate landward The actual seawater-freshwater front is not a sharp line of demarcation it is a zone of diffusion where the two kinds of water intermingle resulting in a transitional zone of mixed water having a composition intermediate between fresh and salt water The width of the zone depends upon the hydraulic characteristics of the aquifer the magnitude of the periodic movement of the seawater front in response to ocean tides and the rise and fall of the water table due to recharge and pumping
Another factor that determines whether seawater will intrude a coastal aquifer is the absence or presence of a ground-water barrier If a ground-water barrier separates the landward side of the basin from its seaward exten-sion seawater intrusion may be impeded in the basin The barrier could be a fault a decrease in permeability or any geologic feature that impedes the movement of water On the other hand if there are no barriers and if ground-water levels decline seawater intrusion is likely to occur
There are no vertical ground-water barriers in the coastal part of the Soquel-Aptos area Consequently the factor controlling seawater intrusion is the ground-water level at or near the coastline Because the aquifers extend under Monterey Bay they are in contact with the ocean either on the sea floor adjacent to the coast or on the sides of Monterey Submarine Canyon several miles offshore and avenues are present for the movement of seawater into the coastal aquifer
Geologic Framework
The regional geology of the Soquel-Aptos area has been described in a report by Hickey (1968) The present discussion is limited to the geology of the coastal area shown in figure 2 All the geologic units shown in figure 2 are water bearing except the igneous rocks The two principal water-bearing units are the Purisima Formation and the Aromas Sand The alluvium and the terrace deposits are thin and yield only minor quantities of ground water to wells
6 SEAWATER INTRUSION SOQUEL-APTOS AREA CALIFORNIA
The Purisima Formation of late Miocene and Pliocene age is a sequence of blue moderately to poorly consolidated silty to clean very fine to medium-grained sandstone beds interbedded with siltstone The formation underlies the entire Soquel-Aptos study area and extends southwestward under Monterey Bay It is exposed on the sea floor except in the area between about 2 mi and 7 mi offshore where bay mud overlies it (Gary Greene US Geological Survey oral commun 1978) and on the walls of Monterey Submarine Canyon The formation is predominantly of marine origin and overlies all older units unconformably In turn it is overlain unconformably by all younger units The formation has a regional dip of 3 to 5 degrees southeast In the northwestern part of the area shown in figure 2 it is about 600 ft thick near Soquel about 1000 ft thick and in the vicinity of La Selva Beach over 2000 ft thick Most of the ground water in the Purisima Formation is confined Some areas of unconfined water occur in the foothills inland from the coast It is in these inland areas that most of the recharge to the aquifer occurs The Purisima Formation is the major aquifer in the Soquel-Aptos area and the one from which most wells pump
The Aromas Sand consists of well-sorted quartzose brown-to-red sand containing lenses of silt and clay and a few lenses of gravel The sand deposited during Pleistocene time in a lagoonal shoreline environment rests unconformably on the Purisima Formation The unit crops out only in the eastern part of the area It dips about 4 degrees toward the southeast and ranges in thickness from zero near Aptos to an average of about 600 ft in the vicinity of La Selva Beach extending under Monterey Bay and exposed on the sea floor
Ground water in the Aromas Sand in general occurs under unconfined conditions but is locally confined between silty and clayey beds Recharge to the aquifer is mainly by direct infiltration of rainfall The recharge water moves southward toward the coast and toward the southeast
bull
Indications of Seawater Intrusion
One of the best indications that seawater intrusion is occurring in an aquifer is an increase in the concentration of chloride in water from wells Chloride the major constituent in seawater is relatively stable chemically and will move through an aquifer at virtually the same rate as the intruding water
Another way to recognize seawater intrusion is to compare the chloride concentrations of water from wells near the coast with those in water from wells inland If the chloride concentration of coastal well water is consid-erably higher than that of inland well water seawater intrusion is suspect
7 SEAWATER INTRUSION
12200 P1 W R1 E 121 5230
Ir I c I i I N-- 1-1
28 27 C NI
250
__ bullTp
- - 36
I
I
3Q 2-il -29
-------t2 _
4 I V
i I i 32 31 A lt-
i_ -IRmdash mdash ill
Tp
___ _
) --1 _4 -L_ _ 4_ T10 S
T11 S - 0
-bull-t I 37 00
9a1
16 15Tp TPbdquo
apitola-bdquo VIII II bull-()() ( -()IT
Qa 1 bullRio Del Mar
Tp 22pal (TiffsC ruz Tp r Tp
I rto Cr Soquel -Dint
Point Santa Cruz
MONTEREY BAY 36 5615
Ia Selva Beach 3 Qa
3
Base from U S Geological Survey 0 1 2 3 MILES Geology by John J Hickey(1968)San Francisco Bay Region sheet 3 I i 1 1125000 1970 CONTOUR INTERVAL 200 FEET
Tp and aTERTIARY Miocene CONTACTmdashApproximately located
Ki CRETACEOUS FAULTmdashApproximately locateda BOUNDARY OF STUDY AREA
A A LINE OF GEOLOGIC SECTION (Fig 9)
0M2 WELL LOCATION AND NUMBERmdashSee text for explanation of well-numbering system
FIGURE 2mdash Geology and location of wells
8 SEAWATER INTRUSION SOQUEL-APTOS AREA CALIFORNIA
Data from two principal sources were used to identify seawater intrusion in the Soquel-Aptos area (1) Long-term chemical data collected by the Soquel Creek County Water District from their supply wells (fig 3) and (2) chemical data collected by the Geological Survey in July 1978 from more than 20 private wells adjacent to the coast In addition some chemical data were available from wells owned by the city of Santa Cruz (fig 3)
Seawater intrusion is occurring in the vicinity of Capitola in the upper part of the Purisima Formation 0-100 ft below sea level It is evidenced by a concentration of chloride in well water exceeding 100 mgL (milligrams per liter) which the author considers an indicator of seawater intrusion in the Soquel-Aptos area In unintruded parts of the Soquel-Aptos area the chloride concentration in ground water from the Purisima Formation ranges from about 20 to 80 mgL and in the Aromas Sand it is about 20 mgL (fig 3) Figure 3 shows the extent of the intrusion It appears that intrusion has been pro-gressing since 1959 or earlier This is illustrated by figure 4 the 1959-78 plot of the chloride concentration of water from well 11S1W-15L1 which obtains most of its water from the interval 0-100 ft below sea level In 1959 the chloride concentration was about 45 mgL--by 1978 it had increased to 90 mgL Seawater intrusion is also indicated by statements of some residents in the Capitola area who say that water from their shallow wells has over the past few years become salty to taste and unusable for garden and lawn irrigation
Water pumped from intervals deeper than 100 ft below sea level shows little or no increase in chloride concentration as illustrated by the plots shown in figures 5-8 These plots are for Soquel Creek County Water District supply wells in the Capitola-La Selva Beach area (fig 3) all of which pump from the deeper intervals No seawater intrusion is indicated in spite of the fact that the nonpumping water levels in most of the wells have been below sea level since the early 1970s Probably the freshwater-seawater interface is advancing landward but still lies at some distance offshore or at depth
Figure 9 is a diagrammatic geologic section showing how seawater may be intruding in the Soquel-Aptos area The interval 0-100 ft below sea level is being intruded by seawater moving into deposits exposed on the sea floor near the shoreline and then landward The seaward end of the Purisima Formation probably contains seawater that enters through the wall of Monterey Submarine Canyon and through the sea floor
Seawater intrusion is occurring because since the early 1970s ground-water pumpage which is concentrated in an area from the shoreline inland about 1 mi has reduced the head in the Purisima Formation and caused ground-water levels near the coast to decline and lie below sea level (figs 4-8) Thus a landward ground-water gradient has developed in the aquifer allowing seawater to move shoreward (fig 10)
12200 R1 W R1 E 121deg5230
EXPLANATION
APPROXIMATE LIMIT OF SEAWATER WELLS IN THE PURISIMA FORMATION INTRUSION IN THE INTERVAL Upper number is chloride concentration 0 mdash 100 FEET BELOW SEA LEVEL in milligrams per liter lower two numbers JULY 1978 are altitudes of top and bottom of perfo-
rated interval in feet below or above (+) National Geodetic Vertical Datum of 1929
36 Lower single number is altitude of well bottom in feet where perforated interval is not known T10 S
T11 S33 Soquel Creek County Water District 270-810 January 1979
_47__ Privately owned July 197815-71 3700
City of Santa Cruz April 197864111
Box indicates well is perforated in the Aromas Sand
22
Si oto Horbor
APO
23 100140
36deg5615
34
Oft
moi
SfIE
LN
I 111
1V
ti VaS
Base from U S Geological Survey 0 2 3 MILES San Francisco Bay Region sheet 3 1125000 1970
CONTOUR INTERVAL 200 FEET NATIONAL GEODETIC VERTICAL DATUM OF 1929
FIGURE 3 mdash Chloride concentration of water from wells altitudes of perforated intervals and approximate landward limit of seawater intrusion July 1978
10 SEAWATER INTRUSION SOQUEL-APTOS AREA CALIFORNIA C
HL
OR
IDE
IN
MIL
LIG
RA
MS
PE
R L
ITE
R
70
60
50
40
30
20
50
Imdash w w u_
25Z
_i w gt Ill_j SEA LEVEL tx w Imdash lt
-25 u 0 w 0 D -50Imdash i=_1Q
-75
Well 11S1W-15L1 Depth 211 feet perforations 136-211 feet Land-surface altitude 75 feet Data from Soquel Creek County Water District
DISTANCE IN MILES FROM SHORELINE VERTICAL EXAGGERATION X 26
EXPLANATION
BAY MUD APPROXIMATE LIMIT OF SEAWATER INTRUSION
O 0 GRAVEL AND SAND (Terrace deposits) ARROW INDICATES DIRECTION OF FLOW
bull SAND SILT AND CLAY (Purisirna Formation) MEM+ Seawater
bull bull bull
bull bull bull CONSOLIDATED ROCK (Igneous rocks) Freshwater
NO
ISIP
1IN
IH
ILVM
VH
S
FIGURE 9mdashGeneralized geologic section showing zones intruded by seawater (see fig 2 for location of section) Ln
16 SEAWATER INTRUSION SOQUEL-APTOS AREA CALIFORNIA
Methods for Controlling Seawater Intrusion
The following discussion of methods for controlling seawater intrusion is intended only as general background on the subject Schematic diagrams are included to illustrate principles (figs 10-13)
Seawater intrusion might be controlled by one or more of the following actions (1) Reduce ground-water pumping in the coastal area (2) artifi-cially recharge the aquifers (3) modify the pumping pattern (4) maintain a pressure ridge of fresh ground water above sea level in the intruded aquifers along the coast or (5) establish a pumping trough in the seawater adjacent to the coastline The first four methods control the intrusion by maintaining the inland potentiometric surface above sea level The fifth removes the seawater before it can migrate inland
Pumping could be reduced by changing to crops requiring less water by having only one harvest per year or by taking some lands out of production Pumping in coastal areas could be reduced by importing supplemental water Artificial recharge could be implemented by using either this supplemental water or reclaimed wastewater
Changing the pumping pattern would help to keep intrusion from advancing inland Pumping wells near the coast causes seawater intrusion because seawater moves inland when the potentiometric surface seaward of the pumping wells is below sea level (fig 10) If the wells adjacent to the coast were abandoned and the pumping centers were shifted farther inland the potentio-metric surface would be above sea level and the pressure gradient would be toward the ocean (fig 11) Careful regulation of the pumpage would be necessary to prevent a return to the conditions shown in figure 10
A pumping trough parallel to the coast could be developed to control seawater intrusion A line of pumping wells along the coast stabilizes the seawater wedge near the trough if the amount of water pumped is carefully regulated (fig 12) The disadvantage of this method is that it wastes a large amount of freshwater
A ground-water pressure ridge parallel to the coast controls seawater intrusion by keeping the potentiometric surface above sea level and maintain-ing the seaward flow of fresh ground water (fig 13) This method requires a line of recharge wells along the coast and a supplemental water supply to create the freshwater barrier unless some pumpage from the aquifer inland is used for recharge
Many factors must be considered in developing plans far controlling seawater intrusion These factors include capital outlay and recurring costs of the required physical works (for example wells pumps distribution lines and treatment facilities) legal aspects (for example water rights and rights of way) availability and cost of supplemental water physical aspects of the aquifer system and overlying soils and the chemistry of the different kinds of water in the system
17 SEAWATER INTRUS ION
Bra
ckis
h w
ate
r
LAND SURFACPumping wells POTENTIOMETRIC SURFACE
SEA LEVEL
onfming be
Perforated interval
AQUIFER SEAWATER WEDGE
Fresh ground water
ARROWSmdashIndicate direction of water flow
FIGURE 10mdashSchematic section at coast showing influence of coastal pumping on seawater intrusion
POTENTIOMETRIC SURFACE A Pumping
wells
SEA LEVEL
SEAWATER WEDGE
ARROWS mdashIndicate direction of water flow
FIGURE 11mdashSchematic section at coast showing influence of inland pumping on seawater intrusion
18 SEAWATER INTRUSION SOQUELmdashAPTOS AREA CALIFORNIA
Fres
hwat
er
POTENTIOMETRIC SURFACE A Pumping well
Line of pumping wells
LAND SURFACESEA LEVEL
-4mdash7mdash AQUIFER ----411- _AmdashN
SEAWATER WEDGE Fresh ground water _
Stable seawater wedgeARROWS-Indicate direction of water flow
FIGURE 12-Schematic section at coast showing effects of a pumping trough on seawater intrusion
Fre
shw
ater
POTENTIOMETRIC SURFACE Pumping well
LAND SURFACELine of recharging wells
SEA LEVEL
SEAWATER WEDGE
ARROWS-Indicate direction of water flow
FIGURE 13mdashSchematic section at coast showing effects of a pressure ridge on seawater intrusion
19 SEAWATER INTRUSION SOQUEL-APTOS AREA CALIFORNIA
POTENTIAL AQUIFER YIELD
In this report the potential aquifer yield in the Soquel-Aptos area is defined as the long-term average inflow to the ground-water reservoir minus unrecoverable water lost to evapotranspiration and the quantity of underflow to the ocean necessary to maintain a barrier against seawater intrusion
The Soquel Creek County Water District and city of Santa Cruz Water Department pump water from the Purisima Formation which is the main aquifer in the area The Soquel Creek County Water District also pumps from the Aromas Sand located in the vicinity of La Selva Beach (fig 14) A separate potential yield value was determined for each of the aquifers
The techniques used to estimate potential ground-water yield for this report have been used by many investigators (see Todd 1964 p 206-208) Those used to determine the yield for the Purisima Formation and Aromas Sand although not specifying an item-by-item evaluation of inflow and outflow are based on the general equation of hydrologic equilibrium
Surface inflow Surface outflow + Subsurface inflow + Subsurface outflow + Precipitation = + Consumptive use + Imported water + Exported water + Decrease in surface storage + Increase in surface storage + Decrease in ground-water storage + Increase in ground-water storage
Purisima Formation
The potential yield of the Purisima Formation is shown by the relation between average annual pumpage and the corresponding average annual net change of ground water in storage for a base period in which climatic conditions approximate the long-term average For simplicity the base period spring 1962 to spring 1975 was selected because ground-water storage was the same at the end of the period as it was at the beginning Therefore average inflow was equal to average outflow and potential yield was equal to the average pump-age The hydrograph for well 11S1W-10C1 has water-level fluctuations con-sidered representative of those in the Purisima Formation and was used to make the estimates of potential yield (fig 15)
On the cumulative departure curve (fig 16) a line joining the beginning and end of the period 1962-1975 would be nearly horizontal indicating that the average rainfall for that period was close to the long-term average In fact rainfall was 98 percent of the 100-year average To be representative climatically a base period should include a wet period and a dry period The base period spring 1962 to spring 1975 includes parts of two dry periods and a complete wet period It is important also to select a period that does not begin after or end with an extremely wet year because of the water-in-transit problem It may take a year or more for the water levels to fully reflect recharge from a wet year Figure 16 indicates that neither the 1960-61 or 1974-75 rainfall years were wet years
20 SEAWATER INTRUSION SOQUEL-APTOS AREA CALIFORNIA
122deg00 5230 121deg45 37deg0730
37deg00
Sibnr Cr
La Selva Beach
I 0 A 7 4
R
0 1 2 3 4 5 MILESI I I
Base from U S Geological Survey San Francisco Bay Region sheet 3 1125000 1970
EXPLANATION
PURISIMA FORMATION
AROMAS SAND Ammorilormarmmomm
FAULT mdash Approximately located
FIGURE I4mdashAreas for which potential aquifer yield was determined
21 POTENTIAL AQUIFER YIELD
AL
TIT
UD
EO
F W
AT
ER
LE
VE
L I
N F
EE
T
Well 11S1W-10C1 Depth 350 feet perforations unknown Land-surface altitude 90 feet Data from California Department of Water Resources
FIGURE 15mdashFluctuation of water level in well 1151 W-10C1
The 1962-75 period fits the required criteria for a valid base period Therefore the potential ground-water yield of the Purisima Formation in the Soquel-Aptos area based on 1962-75 conditions and on average annual pumpage (4400 acre-ft) as determined from table 1 is about 4400 acre-ftyr
The estimated yield value was checked by plotting the annual average change in ground-water levels in all wells measured against annual pumpage (fig 17) If inflow to the aquifer is reasonably constant the points can be fitted to a straight line and pumpage corresponding to zero change in water level equals the potential yield The zero change in water level in figure 17 is at a point corresponding to 4100 acre-ft a quantity which agrees reasonably well with the yield figure determined in the previous paragraph
PR
EC
IPIT
AT
ION
IN
IN
CH
ES
C
UM
UL
AT
IVE
DE
PA
RT
UR
E O
F P
RE
CIP
ITA
TIO
N IN
IN
CH
ES
n
) CJ
it
(
71
6)
Ja
eJ
43
N3
C1
0
8 0
0
0
0
0
0
0
0
8 8
0
0
I I
I 1
I 1
I
FIGU RE 16 -1956-77 Santa Cruzprecipatationand cumulative departurecurve
1 OC 3N1 111--IAinr 1IV3A 011V141 110
1956
-57
1957
-58
1958
-59
1959
-60
1960
-61
1961
-62
1962
-63
1963
-64
1964
-65
1965
-66
1966
-67
1967
-68
1968
-69
1969
-70
1970
-71
1971
-72
1972
-73
1973
-74
1974
-75
1975
-76
D 33 m II
1976
-77
1977
-78
I
VINTIIWD yaw samv-ianOos Noisnalsi aummvas
ZZ
AV
ER
AG
E A
NN
UA
L C
HA
NG
E IN
GR
OU
ND
- WA
TE
R L
EV
EL
IN
FE
ET
mu
uaai
rew avimagm
14
12
10
1964 0
491969 01970 1974
o
1962 euro
01)1963 euro01967 1965 01966 1973
611968 6)1971
1972e-4 mdash
POTENTIAL YIELD --- -6 --
-10
-12 3000
I 4000
I 5000
I 6000
ANNUAL PUMPAGE IN ACRE-FEET
FIGURE 17mdashAnnual pumpage versus average annual change in ground-water level
24 SEAWATER INTRUSION SOQUEL-APTOS AREA CALIFORNIA
TABLE 1 - Pumpage in acre-feet from Purisima Formation 1962-74
CentralSoquel Miscel-
City Santa Miscel-Creek laneous
Agri- of Indus- Cruz laneousCounty water
Year cul- Santa trial3 County domestic TotalWater pur-
Metered 2Agriculture pumpage was computed from total electrical energy used for
pumping water and the electrical energy required to pump a unit volume of water 3Estimated
Aromas Sand
The potential yield of the Aromas Sand was estimated by comparing the average annual pumpage with the corresponding average annual net change of ground water in storage The estimate does not have the same degree of accu-racy as that determined for the Purisima Formation because long-term water-level fluctuations are available only for the coastal part of the aquifer and not for the large part of the recharge area several miles inland The hydro-graphs of wells 11S1E-28D1 and 11S1E-28R2 (fig 18) indicate that ground-water storage in 1977 was about the same as in 1966 Therefore average
25 POTENTIAL AQUIFER YIELD
AL
TIT
UD
E O
F W
AT
ER
LE
VE
L I
NF
EE
T
Well 11S1E-28R2 Depth 290 feet perforations 250-290 feet Land-surface altitude 150 feet Well 11S1E-28D1 Depth 550 feet perforations 310-550 feet Land-surface altitude 120 feet Data from Soquel Creek County Water District
FIGURE 18mdashFluctuation of water level in wells 11S1E-28D1 and 28R2
inflow for the 1966-77 period was equal to average outflow and ground-water yield is equal to average annual pumpage The period includes a wet cycle (fig 16) and 3 years of a dry cycle including the drought years 1975-76 and 1976-77 Neither the 1964-65 nor the 1976-77 rainfall year was extremely wet so there is no water-in-transit problem with the base period Average rainfall for the 1966-77 base period was 2946 inches about 94 percent of the 100-year average This means that inflow to the ground-water reservoir for the 1966-77 period was slightly less than the long-term average and an esti-mate of ground-water yield based on average annual pumpage for this period is probably conservative The ground-water yield of the Aromas Sand in the Soquel-Aptos area based on 1966-76 conditions and on average pumpage as determined from table 2 is about 1500 acre-ftyr
26 SEAWATER INTRUSION SOQUEL-APTOS AREA CALIFORNIA
TABLE 2 - Pumpage in acre-feet from Aromas Sand 1966-77
Metered 2Agriculture pumpage was computed from total electricalenergy used for
pumping water and the electrical energy required to pump a unit volume of water 3Estimated
OBSERVATION-WELL NETWORK
The objective of an observation-well network in the Soquel-Aptos area is to function as an early warning system to alert those responsible for managing and protecting the ground-water resources of the area from adverse changes Water-level measurements in wells are necessary to indicate the effects of pumping on the ground-water system and the status of ground-water storage Ground-water sample analyses are needed to monitor seawater intrusion and other water-quality changes
At the present time the Soquel Creek County Water District makes monthly pumping and nonpumping water-level measurements in 15 supply wells The same wells are sampled every autumn and analyzed for major-ion concentration including total alkalinity (as CaCO3) bicarbonate boron calcium chloride specific conductance dissolved solids fluoride iron magnesium potassium silica sodium sulfate and nitrate plus nitrite as nitrogen The California Department of Water Resources measures water levels in wells 11S1W-10C1 and 15E2 (USGS 16H1) at monthly intervals
27 OBSERVATION-WELL NETWORK
TABLE 3 - Potential observation-well network
Type of data and frequency of collection
Water level Water quality Well Depth
April Chloride and specific conductance Major ionsNo (ft)
Monthly and April September September
September
10S1W-27J1 238 X 11S1W-9M2 110 X X X 11S1W-10C1 350 X X X 11S1W-11L1 628 X X x 11S1W-11L2 650 X X x 11S1W-11L3 150 X X X 11S1W-11N1 398 X X x 11S1W-11R1 220 X X X 11S1W-12K1 1020 X X x 11S1W-131 700-800 X X X 11S1W-13G1 330 X X x 11S1W-14A2 194 X X x 11S1W-151 700-800 X X x 11S1W-15A1 168 X X x 11S1W-15L1 211 X X x 11S1W-15L2 256 X X x 11S1W-16H1 101 X 11S1W-16Q1 98 X X X 11S1E-17F1 460 X X x 11S1E-18E1 214 X X x 11S1E-18F1 713 X X x 11S1E-191 700-800 X X X 11S1E-20E1 400 X X x 11S1E-20G1 495 X X x 11S1E-28D1 550 X X x 11S1E-28M1 184 X X X 11S1E-28R1 355 X X x 11S1E-28R2 290 X X x 11S1E-33J2 205 X X X
1Well to be drilled
Table 3 and figure 19 show the wells in the current observation network and the wells that could be used to expand the network for more effective monitoring Additional shallow wells that might monitor the depth interval now being intruded by seawater are 11S1W-9M2 11L3 11R1 14A2 15A1 and 16Q1 and 11S1E-28M1 and 33J2 Observations made at these wells would be most effective if made twice yearly in April when ground-water storage is highest and in September when ground-water storage is lowest Water-level measurements will show the status of ground-water storage and determination of chloride concentration and specific conductance in water samples will show changes in water quality The 15 district supply wells would also be most effectively monitored in April and September The April samples need only be analyzed for chloride and the specific conductance determined Complete chemical analyses of the September samples would be needed Water-level measurements are currently being taken at district supply wells at monthly intervals The addition of April and September water-level data from well 10S1W-27J1 would help to monitor changes in ground-water storage in the Purisima Formation in the central part of the Soquel-Aptos area
12T 00 R1 W R1 E 121deg5230
co
29 bdquo Amdash I
EXPLANATION
Soquel Creek County Water Districtbull supply-well observation network
4) Well monitored by California Depart- T10 S ment of Water Resources T11 S
3 Shallow well to be added to observation network
37-00bull Deep well to be added to observation network
bull Well to be drilled
VIt
2IO
3IIV
3 ` N
ois
nu
m u
nvm
vas
tilrrrtn Craz Harbor
(1AS -r CL AkL) -eES
Point Santa Cruz
Base from U S Geological Survey San Francisco Bay Region sheet 3 1125000 1970
apitola TAlE BF A-
uurpf ()SH(1
Rio Del Mar op Opal Cliffs au
Soquel Point
MONTEREY BAY 365615
La Selva Beach
4
0 1 2 3 MILES
CONTOUR INTERVAL 200 FEET NATIONAL GEODETIC VERTICAL DATUM OF 1929
Three new wells 700-800 ft deep and adjacent to the coast one in SWk sec 13 T 11 S R 1 W one in SEA sec 15 T 11 S R 1 W and one in SWk sec 19 T 11 S R 1 E could monitor the lower part of the Purisima Formation Data from these wells might be used to detect the advancing sea-water front at depth before it reaches the Soquel Creek County Water District wells
CONCLUSIONS
Ground-water pumpage from the Purisima Formation a confined aquifer has averaged about 5400 acre-ftyr since 1970--1000 acre-ftyr more than its potential yield of 4400 acre-ftyr This pumping has caused a decrease in freshwater head and water levels in wells along the coast have declined to below sea level Prior to the 1970s the head was sufficient to produce a seaward gradient and freshwater was discharged into the ocean at the outcrop of the aquifer maintaining the freshwater-seawater interface an unknown but probably considerable distance offshore Since the early 1970s the reduction of head has reversed the ground-water gradient in the aquifer and has brought about conditions that are favorable for migration of seawater landward Seawater intrusion has resulted and has progressed in the interval 0-100 ft below sea level to the vicinity of Capitola Intrusion has been detected in this shallow interval first probably because it crops out near shore on the floor of Monterey Bay and seawater had only a short distance to travel to reach shallow wells
It is unknown how long it will take seawater to intrude the inland parts of the deeper zones if indeed it ever does It will depend on how carefully pumpage with its effect on freshwater head is managed As the freshwater head is reduced seawater will move landward and a new freshwater-saltwater interface will be established If the interface reaches deep wells then saltwater will be pumped Conversely if the freshwater head is increased the interface will move seaward and the threat of seawater intrusion will be eliminated
Ground-water pumpage from the Aromas Sand in the vicinity of La Selva Beach (fig 14) has been near its potential yield--about 1500 acre-ftyr--since the early 1970s No changes in the quantity of ground water in storage or in water quality have been observed
An observation-well network could be established to monitor status of ground-water storage and water quality
REFERENCES CITED
Hickey J J 1968 Hydrogeologic study of the Soquel-Aptos area Santa Cruz County California US Geological Survey open-file report 48 p
Todd D K 1964 Ground water hydrology New York John Wiley 336 p
bull bull
bull bull
bull r
4 A
bull -
obdquo rtt
s bull bull
bulllsquo44
bull
mdashbull
t s
s O
t
4 lsquo-zii bullIc
44
-t- ---bull
f4 4
ibdquobull
-4
bull
- bullbull
t --bdquo
-r4
2-
bullbullbull
x bull k
4
$
bull bull
1
a
bull bull 70bull
It bullbullbull
raf 1 i
oo
- bull 4 bull
sis
bull
x bull
bdquo
s
sY
bull
1 il
rik
- tr
-bull bull
bull
1-
t
bull
os
4
to7 1
I
r bull
-~4 44
aorss i
bull Ns4
bull bullsio
mdashso
bull o
bull -4
hi
Ot i
bull
USGS LIBRARY - RESTON
Muir--SEAWATER INTRUSION SOQUEL-APTOS AREA SANTA CRUZ COUNTY CALIFORNIA--WRI 80-84
0CO
COOOOOC
O
Page 1
Page 2
Page 3
Page 4
Page 5
Page 6
Page 7
Page 8
Page 9
Page 10
Page 11
Page 12
Page 13
Page 14
Page 15
Page 16
Page 17
Page 18
Page 19
Page 20
Page 21
Page 22
Page 23
Page 24
Page 25
Page 26
Page 27
Page 28
Page 29
Page 30
Page 31
Page 32
Page 33
Page 34
Page 35
Page 36
Page 37
Page 38
Page 39
Page 40
SEAWATER INTRUSION AND POTENTIAL YIELD OF AQUIFERS IN THE SOQUEL-APTOS AREA
SANTA CRUZ COUNTY CALIFORNIA
By K S Muir
US GEOLOGICAL SURVEY
Water-Resources Investigations 80-84
Prepared in cooperation with the
Soquel Creek County Water District
Menlo Park California October 1980
UNITED STATES DEPARTMENT OF THE INTERIOR
CECIL D ANDRUS Secretary
GEOLOGICAL SURVEY
H William Menard Director
For additional information write to
District Chief Water Resources Division US Geological Survey 345 Middlefield Rd Menlo Park Calif 94025
CONTENTS
Page Conversion factors IV Abstract 1 Introduction 2
Purpose and scope 2 Location and general features 2 Acknowledgments 4 Well-numbering system 4
Seawater intrusion 5 Geologic framework 5 Indications of seawater intrusion 6 Methods for controlling seawater intrusion 16
For readers who prefer to use metric units rather than inch-pound units the conversion factors for the terms used in this report are listed below
Multiply By To obtain
acres 04047 square hectometers acre-ft (acre-feet) 0001233 cubic hectometers acre-ftyr (acre-feet 0001233 cubic hectometers per per year) year
ft (feet) 03048 meters in (inches) 254 millimeters mi (miles) 1609 kilometers mil (square miles) 259 square kilometers
National Geodetic Vertical Datum of 1929 is a geodetic datum derived from the average sea level over a period of many years at 26 tide stations along the Atlantic Gulf of Mexico and Pacific Coasts and as such does not necessarily represent local mean sea level at any particular place To establish a more precise nomenclature the term NGVD of 1929 is used in place of Sea Level Datum of 1929 or mean sea level In the text of this report the term sea level is synonymous with National Geodetic Vertical Datum of 1929
SEAWATER INTRUSION AND POTENTIAL YIELD OF AQUIFERS IN THE SOQUEL-APTOS AREA
SANTA CRUZ COUNTY CALIFORNIA
By K S Muir
ABSTRACT
Seawater has intruded the Purisima Formation in the interval 0-100 feet below sea level in the Soquel-Aptos area It occurs in the central part of the area and extends inland about half a mile
The potential yields of the two principal aquifers in the Soquel-Aptos area are 4400 acre-feet per year from the Purisima Formation and 1500 acre-feet per year from the Aromas Sand Pumping from the Purisima Formation averaging about 5400 acre-feet per year since 1970 has caused water levels along the coast to decline below sea level and has allowed seawater to enter the aquifer
Seawater intrusion and ground-water storage could be monitored in all depth zones by expanding the observation-well network to include a number of shallow wells one deep well inland from the coast and three deep wells along the coast
1
2 SEAWATER INTRUSION SOQUEL-APTOS AREA CALIFORNIA
INTRODUCTION
Purpose and Scope
This investigation was made by the US Geological Survey in cooperation with the Soquel Creek County Water District and with financial support from the city of Santa Cruz The purpose of the study is to provide information to develop plans that will insure sufficient water for future needs of an in-creasing population The district the major public water-supply agency in the Soquel-Aptos area (fig 1) obtains its supply from 15 wells in the Purisima Formation and the Aromas Sand The city of Santa Cruz Water Depart-ment also withdraws water from the Purisima Formation If ground-water sources are inadequate to supply the increasing demands projected to the year 2020 other water sources will have to be considered
The two main factors that will limit ground-water development in the Soquel-Aptos area are seawater intrusion and potential yield of the aquifers The scope of this report is to describe where and how seawater has intruded the aquifers in the Soquel-Aptos area to determine the potential ground-water yield of the Purisima Formation - and Aromas Sand and to design an observation-well network for monitoring the status of ground-water storage and seawater intrusion
Location and General Features
The Soquel-Aptos study area covers about 50 mil extending south from the Zayante fault to Monterey Bay west to Scotts Valley and east to Watsonville (fig 1) Terrain in the north is mountainous and grades to rolling hills Well-developed marine terraces along the coastline are abruptly terminated by high cliffs
Annual precipitation almost entirely in the form of rainfall ranges from 24 to 32 inches along the coast and from 40 to 50 inches at the higher altitudes along the northern boundary Approximately 80 percent of the pre-cipitation occurs between November and March The principal streams in the area are Soquel Creek and Aptos Creek
The study area is predominantly urban and is almost completely dependent on ground water for its water supply In 1977 about 30000 people used over 7000 acre-ft of ground water to supply their domestic irrigation commer-cial and industrial water needs Increases are expected in both population and water needs for many years
3 INTRODUCTION
122- 00 5230 121deg 45 37deg07 30
37deg 00
Base from U S Geological Survey San Francisco Bay Region sheet 3 1125000 1970 MI IND MM
San Francisco
bullbull
MAP AREA N N
FIGURE 1mdashLocation of study area
4 SEAWATER INTRUSION SOQUEL-APTOS AREA CALIFORNIA
Acknowledgments
Special thanks are given to Robert M Johnson Jr General Manager and Chief Engineer and Hank Dodds Assistant Chief Engineer of the Soquel Creek County Water District for supplying geologic information well data water-level measurements pumpage records and chemical analyses of ground water Appreciation is also expressed to the many residents of the Soquel-Aptos area who allowed the Geological Survey to measure and sample their wells
Well-Numbering System
Wells are numbered according to their location in the rectangular system for subdivision of public land For example in a well near the Pacific Ocean 11S1E-20El the part of the number preceding the slash indicates the township (T 11 S) the part of the number following the slash indicates the range (R 1 E) the number following the hyphen indicates the section (sec 20) the letter following the section number indicates the 40-acre subdivision within the section according to the diagram shown below and the final digit is a serial number for wells in each 40-acre subdivision All wells mentioned in this report are referenced to the Mount Diablo base line and meridian
In table 3 of this report the entire well number is given as described above on the well-location map (fig 2) only the letter and serial number are shown at the well location
D C B A
EMI
PAL K J
N P O R
5 SEAWATER INTRUSION SOQUEL-APTOS AREA CALIFORNIA
SEAWATER INTRUSION
The landward movement of seawater induced by ground-water development of coastal aquifers may be the most important element which must be considered in plans for the proper management of ground water in this area Seawater intrusion is always a votential source of contamination of aquifers in areas where water is pumped from wells along a coast This intrusion can occur by horizontal migration of a seawater wedge into the aquifer at depth or by downward movement and subsequent lateral migration of seawater through shallow deposits adjacent to the coast or streams and estuaries containing seawater Either way the ground-water level in a coastal aquifer in relation to sea level is the factor that determines if seawater intrusion can occur Under natural conditions ground-water levels near the coast are above sea level the potentiometric surface has a seaward gradient and freshwater is dis-charged into the ocean offshore If ground-water levels in the fresh part of the aquifer decline below sea level the reversal of gradient will cause seawater to migrate landward The actual seawater-freshwater front is not a sharp line of demarcation it is a zone of diffusion where the two kinds of water intermingle resulting in a transitional zone of mixed water having a composition intermediate between fresh and salt water The width of the zone depends upon the hydraulic characteristics of the aquifer the magnitude of the periodic movement of the seawater front in response to ocean tides and the rise and fall of the water table due to recharge and pumping
Another factor that determines whether seawater will intrude a coastal aquifer is the absence or presence of a ground-water barrier If a ground-water barrier separates the landward side of the basin from its seaward exten-sion seawater intrusion may be impeded in the basin The barrier could be a fault a decrease in permeability or any geologic feature that impedes the movement of water On the other hand if there are no barriers and if ground-water levels decline seawater intrusion is likely to occur
There are no vertical ground-water barriers in the coastal part of the Soquel-Aptos area Consequently the factor controlling seawater intrusion is the ground-water level at or near the coastline Because the aquifers extend under Monterey Bay they are in contact with the ocean either on the sea floor adjacent to the coast or on the sides of Monterey Submarine Canyon several miles offshore and avenues are present for the movement of seawater into the coastal aquifer
Geologic Framework
The regional geology of the Soquel-Aptos area has been described in a report by Hickey (1968) The present discussion is limited to the geology of the coastal area shown in figure 2 All the geologic units shown in figure 2 are water bearing except the igneous rocks The two principal water-bearing units are the Purisima Formation and the Aromas Sand The alluvium and the terrace deposits are thin and yield only minor quantities of ground water to wells
6 SEAWATER INTRUSION SOQUEL-APTOS AREA CALIFORNIA
The Purisima Formation of late Miocene and Pliocene age is a sequence of blue moderately to poorly consolidated silty to clean very fine to medium-grained sandstone beds interbedded with siltstone The formation underlies the entire Soquel-Aptos study area and extends southwestward under Monterey Bay It is exposed on the sea floor except in the area between about 2 mi and 7 mi offshore where bay mud overlies it (Gary Greene US Geological Survey oral commun 1978) and on the walls of Monterey Submarine Canyon The formation is predominantly of marine origin and overlies all older units unconformably In turn it is overlain unconformably by all younger units The formation has a regional dip of 3 to 5 degrees southeast In the northwestern part of the area shown in figure 2 it is about 600 ft thick near Soquel about 1000 ft thick and in the vicinity of La Selva Beach over 2000 ft thick Most of the ground water in the Purisima Formation is confined Some areas of unconfined water occur in the foothills inland from the coast It is in these inland areas that most of the recharge to the aquifer occurs The Purisima Formation is the major aquifer in the Soquel-Aptos area and the one from which most wells pump
The Aromas Sand consists of well-sorted quartzose brown-to-red sand containing lenses of silt and clay and a few lenses of gravel The sand deposited during Pleistocene time in a lagoonal shoreline environment rests unconformably on the Purisima Formation The unit crops out only in the eastern part of the area It dips about 4 degrees toward the southeast and ranges in thickness from zero near Aptos to an average of about 600 ft in the vicinity of La Selva Beach extending under Monterey Bay and exposed on the sea floor
Ground water in the Aromas Sand in general occurs under unconfined conditions but is locally confined between silty and clayey beds Recharge to the aquifer is mainly by direct infiltration of rainfall The recharge water moves southward toward the coast and toward the southeast
bull
Indications of Seawater Intrusion
One of the best indications that seawater intrusion is occurring in an aquifer is an increase in the concentration of chloride in water from wells Chloride the major constituent in seawater is relatively stable chemically and will move through an aquifer at virtually the same rate as the intruding water
Another way to recognize seawater intrusion is to compare the chloride concentrations of water from wells near the coast with those in water from wells inland If the chloride concentration of coastal well water is consid-erably higher than that of inland well water seawater intrusion is suspect
7 SEAWATER INTRUSION
12200 P1 W R1 E 121 5230
Ir I c I i I N-- 1-1
28 27 C NI
250
__ bullTp
- - 36
I
I
3Q 2-il -29
-------t2 _
4 I V
i I i 32 31 A lt-
i_ -IRmdash mdash ill
Tp
___ _
) --1 _4 -L_ _ 4_ T10 S
T11 S - 0
-bull-t I 37 00
9a1
16 15Tp TPbdquo
apitola-bdquo VIII II bull-()() ( -()IT
Qa 1 bullRio Del Mar
Tp 22pal (TiffsC ruz Tp r Tp
I rto Cr Soquel -Dint
Point Santa Cruz
MONTEREY BAY 36 5615
Ia Selva Beach 3 Qa
3
Base from U S Geological Survey 0 1 2 3 MILES Geology by John J Hickey(1968)San Francisco Bay Region sheet 3 I i 1 1125000 1970 CONTOUR INTERVAL 200 FEET
Tp and aTERTIARY Miocene CONTACTmdashApproximately located
Ki CRETACEOUS FAULTmdashApproximately locateda BOUNDARY OF STUDY AREA
A A LINE OF GEOLOGIC SECTION (Fig 9)
0M2 WELL LOCATION AND NUMBERmdashSee text for explanation of well-numbering system
FIGURE 2mdash Geology and location of wells
8 SEAWATER INTRUSION SOQUEL-APTOS AREA CALIFORNIA
Data from two principal sources were used to identify seawater intrusion in the Soquel-Aptos area (1) Long-term chemical data collected by the Soquel Creek County Water District from their supply wells (fig 3) and (2) chemical data collected by the Geological Survey in July 1978 from more than 20 private wells adjacent to the coast In addition some chemical data were available from wells owned by the city of Santa Cruz (fig 3)
Seawater intrusion is occurring in the vicinity of Capitola in the upper part of the Purisima Formation 0-100 ft below sea level It is evidenced by a concentration of chloride in well water exceeding 100 mgL (milligrams per liter) which the author considers an indicator of seawater intrusion in the Soquel-Aptos area In unintruded parts of the Soquel-Aptos area the chloride concentration in ground water from the Purisima Formation ranges from about 20 to 80 mgL and in the Aromas Sand it is about 20 mgL (fig 3) Figure 3 shows the extent of the intrusion It appears that intrusion has been pro-gressing since 1959 or earlier This is illustrated by figure 4 the 1959-78 plot of the chloride concentration of water from well 11S1W-15L1 which obtains most of its water from the interval 0-100 ft below sea level In 1959 the chloride concentration was about 45 mgL--by 1978 it had increased to 90 mgL Seawater intrusion is also indicated by statements of some residents in the Capitola area who say that water from their shallow wells has over the past few years become salty to taste and unusable for garden and lawn irrigation
Water pumped from intervals deeper than 100 ft below sea level shows little or no increase in chloride concentration as illustrated by the plots shown in figures 5-8 These plots are for Soquel Creek County Water District supply wells in the Capitola-La Selva Beach area (fig 3) all of which pump from the deeper intervals No seawater intrusion is indicated in spite of the fact that the nonpumping water levels in most of the wells have been below sea level since the early 1970s Probably the freshwater-seawater interface is advancing landward but still lies at some distance offshore or at depth
Figure 9 is a diagrammatic geologic section showing how seawater may be intruding in the Soquel-Aptos area The interval 0-100 ft below sea level is being intruded by seawater moving into deposits exposed on the sea floor near the shoreline and then landward The seaward end of the Purisima Formation probably contains seawater that enters through the wall of Monterey Submarine Canyon and through the sea floor
Seawater intrusion is occurring because since the early 1970s ground-water pumpage which is concentrated in an area from the shoreline inland about 1 mi has reduced the head in the Purisima Formation and caused ground-water levels near the coast to decline and lie below sea level (figs 4-8) Thus a landward ground-water gradient has developed in the aquifer allowing seawater to move shoreward (fig 10)
12200 R1 W R1 E 121deg5230
EXPLANATION
APPROXIMATE LIMIT OF SEAWATER WELLS IN THE PURISIMA FORMATION INTRUSION IN THE INTERVAL Upper number is chloride concentration 0 mdash 100 FEET BELOW SEA LEVEL in milligrams per liter lower two numbers JULY 1978 are altitudes of top and bottom of perfo-
rated interval in feet below or above (+) National Geodetic Vertical Datum of 1929
36 Lower single number is altitude of well bottom in feet where perforated interval is not known T10 S
T11 S33 Soquel Creek County Water District 270-810 January 1979
_47__ Privately owned July 197815-71 3700
City of Santa Cruz April 197864111
Box indicates well is perforated in the Aromas Sand
22
Si oto Horbor
APO
23 100140
36deg5615
34
Oft
moi
SfIE
LN
I 111
1V
ti VaS
Base from U S Geological Survey 0 2 3 MILES San Francisco Bay Region sheet 3 1125000 1970
CONTOUR INTERVAL 200 FEET NATIONAL GEODETIC VERTICAL DATUM OF 1929
FIGURE 3 mdash Chloride concentration of water from wells altitudes of perforated intervals and approximate landward limit of seawater intrusion July 1978
10 SEAWATER INTRUSION SOQUEL-APTOS AREA CALIFORNIA C
HL
OR
IDE
IN
MIL
LIG
RA
MS
PE
R L
ITE
R
70
60
50
40
30
20
50
Imdash w w u_
25Z
_i w gt Ill_j SEA LEVEL tx w Imdash lt
-25 u 0 w 0 D -50Imdash i=_1Q
-75
Well 11S1W-15L1 Depth 211 feet perforations 136-211 feet Land-surface altitude 75 feet Data from Soquel Creek County Water District
DISTANCE IN MILES FROM SHORELINE VERTICAL EXAGGERATION X 26
EXPLANATION
BAY MUD APPROXIMATE LIMIT OF SEAWATER INTRUSION
O 0 GRAVEL AND SAND (Terrace deposits) ARROW INDICATES DIRECTION OF FLOW
bull SAND SILT AND CLAY (Purisirna Formation) MEM+ Seawater
bull bull bull
bull bull bull CONSOLIDATED ROCK (Igneous rocks) Freshwater
NO
ISIP
1IN
IH
ILVM
VH
S
FIGURE 9mdashGeneralized geologic section showing zones intruded by seawater (see fig 2 for location of section) Ln
16 SEAWATER INTRUSION SOQUEL-APTOS AREA CALIFORNIA
Methods for Controlling Seawater Intrusion
The following discussion of methods for controlling seawater intrusion is intended only as general background on the subject Schematic diagrams are included to illustrate principles (figs 10-13)
Seawater intrusion might be controlled by one or more of the following actions (1) Reduce ground-water pumping in the coastal area (2) artifi-cially recharge the aquifers (3) modify the pumping pattern (4) maintain a pressure ridge of fresh ground water above sea level in the intruded aquifers along the coast or (5) establish a pumping trough in the seawater adjacent to the coastline The first four methods control the intrusion by maintaining the inland potentiometric surface above sea level The fifth removes the seawater before it can migrate inland
Pumping could be reduced by changing to crops requiring less water by having only one harvest per year or by taking some lands out of production Pumping in coastal areas could be reduced by importing supplemental water Artificial recharge could be implemented by using either this supplemental water or reclaimed wastewater
Changing the pumping pattern would help to keep intrusion from advancing inland Pumping wells near the coast causes seawater intrusion because seawater moves inland when the potentiometric surface seaward of the pumping wells is below sea level (fig 10) If the wells adjacent to the coast were abandoned and the pumping centers were shifted farther inland the potentio-metric surface would be above sea level and the pressure gradient would be toward the ocean (fig 11) Careful regulation of the pumpage would be necessary to prevent a return to the conditions shown in figure 10
A pumping trough parallel to the coast could be developed to control seawater intrusion A line of pumping wells along the coast stabilizes the seawater wedge near the trough if the amount of water pumped is carefully regulated (fig 12) The disadvantage of this method is that it wastes a large amount of freshwater
A ground-water pressure ridge parallel to the coast controls seawater intrusion by keeping the potentiometric surface above sea level and maintain-ing the seaward flow of fresh ground water (fig 13) This method requires a line of recharge wells along the coast and a supplemental water supply to create the freshwater barrier unless some pumpage from the aquifer inland is used for recharge
Many factors must be considered in developing plans far controlling seawater intrusion These factors include capital outlay and recurring costs of the required physical works (for example wells pumps distribution lines and treatment facilities) legal aspects (for example water rights and rights of way) availability and cost of supplemental water physical aspects of the aquifer system and overlying soils and the chemistry of the different kinds of water in the system
17 SEAWATER INTRUS ION
Bra
ckis
h w
ate
r
LAND SURFACPumping wells POTENTIOMETRIC SURFACE
SEA LEVEL
onfming be
Perforated interval
AQUIFER SEAWATER WEDGE
Fresh ground water
ARROWSmdashIndicate direction of water flow
FIGURE 10mdashSchematic section at coast showing influence of coastal pumping on seawater intrusion
POTENTIOMETRIC SURFACE A Pumping
wells
SEA LEVEL
SEAWATER WEDGE
ARROWS mdashIndicate direction of water flow
FIGURE 11mdashSchematic section at coast showing influence of inland pumping on seawater intrusion
18 SEAWATER INTRUSION SOQUELmdashAPTOS AREA CALIFORNIA
Fres
hwat
er
POTENTIOMETRIC SURFACE A Pumping well
Line of pumping wells
LAND SURFACESEA LEVEL
-4mdash7mdash AQUIFER ----411- _AmdashN
SEAWATER WEDGE Fresh ground water _
Stable seawater wedgeARROWS-Indicate direction of water flow
FIGURE 12-Schematic section at coast showing effects of a pumping trough on seawater intrusion
Fre
shw
ater
POTENTIOMETRIC SURFACE Pumping well
LAND SURFACELine of recharging wells
SEA LEVEL
SEAWATER WEDGE
ARROWS-Indicate direction of water flow
FIGURE 13mdashSchematic section at coast showing effects of a pressure ridge on seawater intrusion
19 SEAWATER INTRUSION SOQUEL-APTOS AREA CALIFORNIA
POTENTIAL AQUIFER YIELD
In this report the potential aquifer yield in the Soquel-Aptos area is defined as the long-term average inflow to the ground-water reservoir minus unrecoverable water lost to evapotranspiration and the quantity of underflow to the ocean necessary to maintain a barrier against seawater intrusion
The Soquel Creek County Water District and city of Santa Cruz Water Department pump water from the Purisima Formation which is the main aquifer in the area The Soquel Creek County Water District also pumps from the Aromas Sand located in the vicinity of La Selva Beach (fig 14) A separate potential yield value was determined for each of the aquifers
The techniques used to estimate potential ground-water yield for this report have been used by many investigators (see Todd 1964 p 206-208) Those used to determine the yield for the Purisima Formation and Aromas Sand although not specifying an item-by-item evaluation of inflow and outflow are based on the general equation of hydrologic equilibrium
Surface inflow Surface outflow + Subsurface inflow + Subsurface outflow + Precipitation = + Consumptive use + Imported water + Exported water + Decrease in surface storage + Increase in surface storage + Decrease in ground-water storage + Increase in ground-water storage
Purisima Formation
The potential yield of the Purisima Formation is shown by the relation between average annual pumpage and the corresponding average annual net change of ground water in storage for a base period in which climatic conditions approximate the long-term average For simplicity the base period spring 1962 to spring 1975 was selected because ground-water storage was the same at the end of the period as it was at the beginning Therefore average inflow was equal to average outflow and potential yield was equal to the average pump-age The hydrograph for well 11S1W-10C1 has water-level fluctuations con-sidered representative of those in the Purisima Formation and was used to make the estimates of potential yield (fig 15)
On the cumulative departure curve (fig 16) a line joining the beginning and end of the period 1962-1975 would be nearly horizontal indicating that the average rainfall for that period was close to the long-term average In fact rainfall was 98 percent of the 100-year average To be representative climatically a base period should include a wet period and a dry period The base period spring 1962 to spring 1975 includes parts of two dry periods and a complete wet period It is important also to select a period that does not begin after or end with an extremely wet year because of the water-in-transit problem It may take a year or more for the water levels to fully reflect recharge from a wet year Figure 16 indicates that neither the 1960-61 or 1974-75 rainfall years were wet years
20 SEAWATER INTRUSION SOQUEL-APTOS AREA CALIFORNIA
122deg00 5230 121deg45 37deg0730
37deg00
Sibnr Cr
La Selva Beach
I 0 A 7 4
R
0 1 2 3 4 5 MILESI I I
Base from U S Geological Survey San Francisco Bay Region sheet 3 1125000 1970
EXPLANATION
PURISIMA FORMATION
AROMAS SAND Ammorilormarmmomm
FAULT mdash Approximately located
FIGURE I4mdashAreas for which potential aquifer yield was determined
21 POTENTIAL AQUIFER YIELD
AL
TIT
UD
EO
F W
AT
ER
LE
VE
L I
N F
EE
T
Well 11S1W-10C1 Depth 350 feet perforations unknown Land-surface altitude 90 feet Data from California Department of Water Resources
FIGURE 15mdashFluctuation of water level in well 1151 W-10C1
The 1962-75 period fits the required criteria for a valid base period Therefore the potential ground-water yield of the Purisima Formation in the Soquel-Aptos area based on 1962-75 conditions and on average annual pumpage (4400 acre-ft) as determined from table 1 is about 4400 acre-ftyr
The estimated yield value was checked by plotting the annual average change in ground-water levels in all wells measured against annual pumpage (fig 17) If inflow to the aquifer is reasonably constant the points can be fitted to a straight line and pumpage corresponding to zero change in water level equals the potential yield The zero change in water level in figure 17 is at a point corresponding to 4100 acre-ft a quantity which agrees reasonably well with the yield figure determined in the previous paragraph
PR
EC
IPIT
AT
ION
IN
IN
CH
ES
C
UM
UL
AT
IVE
DE
PA
RT
UR
E O
F P
RE
CIP
ITA
TIO
N IN
IN
CH
ES
n
) CJ
it
(
71
6)
Ja
eJ
43
N3
C1
0
8 0
0
0
0
0
0
0
0
8 8
0
0
I I
I 1
I 1
I
FIGU RE 16 -1956-77 Santa Cruzprecipatationand cumulative departurecurve
1 OC 3N1 111--IAinr 1IV3A 011V141 110
1956
-57
1957
-58
1958
-59
1959
-60
1960
-61
1961
-62
1962
-63
1963
-64
1964
-65
1965
-66
1966
-67
1967
-68
1968
-69
1969
-70
1970
-71
1971
-72
1972
-73
1973
-74
1974
-75
1975
-76
D 33 m II
1976
-77
1977
-78
I
VINTIIWD yaw samv-ianOos Noisnalsi aummvas
ZZ
AV
ER
AG
E A
NN
UA
L C
HA
NG
E IN
GR
OU
ND
- WA
TE
R L
EV
EL
IN
FE
ET
mu
uaai
rew avimagm
14
12
10
1964 0
491969 01970 1974
o
1962 euro
01)1963 euro01967 1965 01966 1973
611968 6)1971
1972e-4 mdash
POTENTIAL YIELD --- -6 --
-10
-12 3000
I 4000
I 5000
I 6000
ANNUAL PUMPAGE IN ACRE-FEET
FIGURE 17mdashAnnual pumpage versus average annual change in ground-water level
24 SEAWATER INTRUSION SOQUEL-APTOS AREA CALIFORNIA
TABLE 1 - Pumpage in acre-feet from Purisima Formation 1962-74
CentralSoquel Miscel-
City Santa Miscel-Creek laneous
Agri- of Indus- Cruz laneousCounty water
Year cul- Santa trial3 County domestic TotalWater pur-
Metered 2Agriculture pumpage was computed from total electrical energy used for
pumping water and the electrical energy required to pump a unit volume of water 3Estimated
Aromas Sand
The potential yield of the Aromas Sand was estimated by comparing the average annual pumpage with the corresponding average annual net change of ground water in storage The estimate does not have the same degree of accu-racy as that determined for the Purisima Formation because long-term water-level fluctuations are available only for the coastal part of the aquifer and not for the large part of the recharge area several miles inland The hydro-graphs of wells 11S1E-28D1 and 11S1E-28R2 (fig 18) indicate that ground-water storage in 1977 was about the same as in 1966 Therefore average
25 POTENTIAL AQUIFER YIELD
AL
TIT
UD
E O
F W
AT
ER
LE
VE
L I
NF
EE
T
Well 11S1E-28R2 Depth 290 feet perforations 250-290 feet Land-surface altitude 150 feet Well 11S1E-28D1 Depth 550 feet perforations 310-550 feet Land-surface altitude 120 feet Data from Soquel Creek County Water District
FIGURE 18mdashFluctuation of water level in wells 11S1E-28D1 and 28R2
inflow for the 1966-77 period was equal to average outflow and ground-water yield is equal to average annual pumpage The period includes a wet cycle (fig 16) and 3 years of a dry cycle including the drought years 1975-76 and 1976-77 Neither the 1964-65 nor the 1976-77 rainfall year was extremely wet so there is no water-in-transit problem with the base period Average rainfall for the 1966-77 base period was 2946 inches about 94 percent of the 100-year average This means that inflow to the ground-water reservoir for the 1966-77 period was slightly less than the long-term average and an esti-mate of ground-water yield based on average annual pumpage for this period is probably conservative The ground-water yield of the Aromas Sand in the Soquel-Aptos area based on 1966-76 conditions and on average pumpage as determined from table 2 is about 1500 acre-ftyr
26 SEAWATER INTRUSION SOQUEL-APTOS AREA CALIFORNIA
TABLE 2 - Pumpage in acre-feet from Aromas Sand 1966-77
Metered 2Agriculture pumpage was computed from total electricalenergy used for
pumping water and the electrical energy required to pump a unit volume of water 3Estimated
OBSERVATION-WELL NETWORK
The objective of an observation-well network in the Soquel-Aptos area is to function as an early warning system to alert those responsible for managing and protecting the ground-water resources of the area from adverse changes Water-level measurements in wells are necessary to indicate the effects of pumping on the ground-water system and the status of ground-water storage Ground-water sample analyses are needed to monitor seawater intrusion and other water-quality changes
At the present time the Soquel Creek County Water District makes monthly pumping and nonpumping water-level measurements in 15 supply wells The same wells are sampled every autumn and analyzed for major-ion concentration including total alkalinity (as CaCO3) bicarbonate boron calcium chloride specific conductance dissolved solids fluoride iron magnesium potassium silica sodium sulfate and nitrate plus nitrite as nitrogen The California Department of Water Resources measures water levels in wells 11S1W-10C1 and 15E2 (USGS 16H1) at monthly intervals
27 OBSERVATION-WELL NETWORK
TABLE 3 - Potential observation-well network
Type of data and frequency of collection
Water level Water quality Well Depth
April Chloride and specific conductance Major ionsNo (ft)
Monthly and April September September
September
10S1W-27J1 238 X 11S1W-9M2 110 X X X 11S1W-10C1 350 X X X 11S1W-11L1 628 X X x 11S1W-11L2 650 X X x 11S1W-11L3 150 X X X 11S1W-11N1 398 X X x 11S1W-11R1 220 X X X 11S1W-12K1 1020 X X x 11S1W-131 700-800 X X X 11S1W-13G1 330 X X x 11S1W-14A2 194 X X x 11S1W-151 700-800 X X x 11S1W-15A1 168 X X x 11S1W-15L1 211 X X x 11S1W-15L2 256 X X x 11S1W-16H1 101 X 11S1W-16Q1 98 X X X 11S1E-17F1 460 X X x 11S1E-18E1 214 X X x 11S1E-18F1 713 X X x 11S1E-191 700-800 X X X 11S1E-20E1 400 X X x 11S1E-20G1 495 X X x 11S1E-28D1 550 X X x 11S1E-28M1 184 X X X 11S1E-28R1 355 X X x 11S1E-28R2 290 X X x 11S1E-33J2 205 X X X
1Well to be drilled
Table 3 and figure 19 show the wells in the current observation network and the wells that could be used to expand the network for more effective monitoring Additional shallow wells that might monitor the depth interval now being intruded by seawater are 11S1W-9M2 11L3 11R1 14A2 15A1 and 16Q1 and 11S1E-28M1 and 33J2 Observations made at these wells would be most effective if made twice yearly in April when ground-water storage is highest and in September when ground-water storage is lowest Water-level measurements will show the status of ground-water storage and determination of chloride concentration and specific conductance in water samples will show changes in water quality The 15 district supply wells would also be most effectively monitored in April and September The April samples need only be analyzed for chloride and the specific conductance determined Complete chemical analyses of the September samples would be needed Water-level measurements are currently being taken at district supply wells at monthly intervals The addition of April and September water-level data from well 10S1W-27J1 would help to monitor changes in ground-water storage in the Purisima Formation in the central part of the Soquel-Aptos area
12T 00 R1 W R1 E 121deg5230
co
29 bdquo Amdash I
EXPLANATION
Soquel Creek County Water Districtbull supply-well observation network
4) Well monitored by California Depart- T10 S ment of Water Resources T11 S
3 Shallow well to be added to observation network
37-00bull Deep well to be added to observation network
bull Well to be drilled
VIt
2IO
3IIV
3 ` N
ois
nu
m u
nvm
vas
tilrrrtn Craz Harbor
(1AS -r CL AkL) -eES
Point Santa Cruz
Base from U S Geological Survey San Francisco Bay Region sheet 3 1125000 1970
apitola TAlE BF A-
uurpf ()SH(1
Rio Del Mar op Opal Cliffs au
Soquel Point
MONTEREY BAY 365615
La Selva Beach
4
0 1 2 3 MILES
CONTOUR INTERVAL 200 FEET NATIONAL GEODETIC VERTICAL DATUM OF 1929
Three new wells 700-800 ft deep and adjacent to the coast one in SWk sec 13 T 11 S R 1 W one in SEA sec 15 T 11 S R 1 W and one in SWk sec 19 T 11 S R 1 E could monitor the lower part of the Purisima Formation Data from these wells might be used to detect the advancing sea-water front at depth before it reaches the Soquel Creek County Water District wells
CONCLUSIONS
Ground-water pumpage from the Purisima Formation a confined aquifer has averaged about 5400 acre-ftyr since 1970--1000 acre-ftyr more than its potential yield of 4400 acre-ftyr This pumping has caused a decrease in freshwater head and water levels in wells along the coast have declined to below sea level Prior to the 1970s the head was sufficient to produce a seaward gradient and freshwater was discharged into the ocean at the outcrop of the aquifer maintaining the freshwater-seawater interface an unknown but probably considerable distance offshore Since the early 1970s the reduction of head has reversed the ground-water gradient in the aquifer and has brought about conditions that are favorable for migration of seawater landward Seawater intrusion has resulted and has progressed in the interval 0-100 ft below sea level to the vicinity of Capitola Intrusion has been detected in this shallow interval first probably because it crops out near shore on the floor of Monterey Bay and seawater had only a short distance to travel to reach shallow wells
It is unknown how long it will take seawater to intrude the inland parts of the deeper zones if indeed it ever does It will depend on how carefully pumpage with its effect on freshwater head is managed As the freshwater head is reduced seawater will move landward and a new freshwater-saltwater interface will be established If the interface reaches deep wells then saltwater will be pumped Conversely if the freshwater head is increased the interface will move seaward and the threat of seawater intrusion will be eliminated
Ground-water pumpage from the Aromas Sand in the vicinity of La Selva Beach (fig 14) has been near its potential yield--about 1500 acre-ftyr--since the early 1970s No changes in the quantity of ground water in storage or in water quality have been observed
An observation-well network could be established to monitor status of ground-water storage and water quality
REFERENCES CITED
Hickey J J 1968 Hydrogeologic study of the Soquel-Aptos area Santa Cruz County California US Geological Survey open-file report 48 p
Todd D K 1964 Ground water hydrology New York John Wiley 336 p
bull bull
bull bull
bull r
4 A
bull -
obdquo rtt
s bull bull
bulllsquo44
bull
mdashbull
t s
s O
t
4 lsquo-zii bullIc
44
-t- ---bull
f4 4
ibdquobull
-4
bull
- bullbull
t --bdquo
-r4
2-
bullbullbull
x bull k
4
$
bull bull
1
a
bull bull 70bull
It bullbullbull
raf 1 i
oo
- bull 4 bull
sis
bull
x bull
bdquo
s
sY
bull
1 il
rik
- tr
-bull bull
bull
1-
t
bull
os
4
to7 1
I
r bull
-~4 44
aorss i
bull Ns4
bull bullsio
mdashso
bull o
bull -4
hi
Ot i
bull
USGS LIBRARY - RESTON
Muir--SEAWATER INTRUSION SOQUEL-APTOS AREA SANTA CRUZ COUNTY CALIFORNIA--WRI 80-84
0CO
COOOOOC
O
Page 1
Page 2
Page 3
Page 4
Page 5
Page 6
Page 7
Page 8
Page 9
Page 10
Page 11
Page 12
Page 13
Page 14
Page 15
Page 16
Page 17
Page 18
Page 19
Page 20
Page 21
Page 22
Page 23
Page 24
Page 25
Page 26
Page 27
Page 28
Page 29
Page 30
Page 31
Page 32
Page 33
Page 34
Page 35
Page 36
Page 37
Page 38
Page 39
Page 40
IV CONTENTS
Page Figures 10-13 Schematic sections at the coast showing--
10 Influence of coastal pumping on seawater intrusion 17
11 Influence of inland pumping on seawater intrusion 17
12 Effects of a pumping trough on seawater intrusion 18
13 Effects of a pressure ridge on seawater intrusion 18
14 Map showing areas for which potential aquifer yield was determined 20
15-18 Graphs showing--15 Fluctuation of water level in well
11S1W-10C1 21 16 1956-77 Santa Cruz precipitation and
cumulative departure curve 22 17 Annual pumpage versus average annual change
in ground-water level 23 18 Fluctuation of water level in wells
For readers who prefer to use metric units rather than inch-pound units the conversion factors for the terms used in this report are listed below
Multiply By To obtain
acres 04047 square hectometers acre-ft (acre-feet) 0001233 cubic hectometers acre-ftyr (acre-feet 0001233 cubic hectometers per per year) year
ft (feet) 03048 meters in (inches) 254 millimeters mi (miles) 1609 kilometers mil (square miles) 259 square kilometers
National Geodetic Vertical Datum of 1929 is a geodetic datum derived from the average sea level over a period of many years at 26 tide stations along the Atlantic Gulf of Mexico and Pacific Coasts and as such does not necessarily represent local mean sea level at any particular place To establish a more precise nomenclature the term NGVD of 1929 is used in place of Sea Level Datum of 1929 or mean sea level In the text of this report the term sea level is synonymous with National Geodetic Vertical Datum of 1929
SEAWATER INTRUSION AND POTENTIAL YIELD OF AQUIFERS IN THE SOQUEL-APTOS AREA
SANTA CRUZ COUNTY CALIFORNIA
By K S Muir
ABSTRACT
Seawater has intruded the Purisima Formation in the interval 0-100 feet below sea level in the Soquel-Aptos area It occurs in the central part of the area and extends inland about half a mile
The potential yields of the two principal aquifers in the Soquel-Aptos area are 4400 acre-feet per year from the Purisima Formation and 1500 acre-feet per year from the Aromas Sand Pumping from the Purisima Formation averaging about 5400 acre-feet per year since 1970 has caused water levels along the coast to decline below sea level and has allowed seawater to enter the aquifer
Seawater intrusion and ground-water storage could be monitored in all depth zones by expanding the observation-well network to include a number of shallow wells one deep well inland from the coast and three deep wells along the coast
1
2 SEAWATER INTRUSION SOQUEL-APTOS AREA CALIFORNIA
INTRODUCTION
Purpose and Scope
This investigation was made by the US Geological Survey in cooperation with the Soquel Creek County Water District and with financial support from the city of Santa Cruz The purpose of the study is to provide information to develop plans that will insure sufficient water for future needs of an in-creasing population The district the major public water-supply agency in the Soquel-Aptos area (fig 1) obtains its supply from 15 wells in the Purisima Formation and the Aromas Sand The city of Santa Cruz Water Depart-ment also withdraws water from the Purisima Formation If ground-water sources are inadequate to supply the increasing demands projected to the year 2020 other water sources will have to be considered
The two main factors that will limit ground-water development in the Soquel-Aptos area are seawater intrusion and potential yield of the aquifers The scope of this report is to describe where and how seawater has intruded the aquifers in the Soquel-Aptos area to determine the potential ground-water yield of the Purisima Formation - and Aromas Sand and to design an observation-well network for monitoring the status of ground-water storage and seawater intrusion
Location and General Features
The Soquel-Aptos study area covers about 50 mil extending south from the Zayante fault to Monterey Bay west to Scotts Valley and east to Watsonville (fig 1) Terrain in the north is mountainous and grades to rolling hills Well-developed marine terraces along the coastline are abruptly terminated by high cliffs
Annual precipitation almost entirely in the form of rainfall ranges from 24 to 32 inches along the coast and from 40 to 50 inches at the higher altitudes along the northern boundary Approximately 80 percent of the pre-cipitation occurs between November and March The principal streams in the area are Soquel Creek and Aptos Creek
The study area is predominantly urban and is almost completely dependent on ground water for its water supply In 1977 about 30000 people used over 7000 acre-ft of ground water to supply their domestic irrigation commer-cial and industrial water needs Increases are expected in both population and water needs for many years
3 INTRODUCTION
122- 00 5230 121deg 45 37deg07 30
37deg 00
Base from U S Geological Survey San Francisco Bay Region sheet 3 1125000 1970 MI IND MM
San Francisco
bullbull
MAP AREA N N
FIGURE 1mdashLocation of study area
4 SEAWATER INTRUSION SOQUEL-APTOS AREA CALIFORNIA
Acknowledgments
Special thanks are given to Robert M Johnson Jr General Manager and Chief Engineer and Hank Dodds Assistant Chief Engineer of the Soquel Creek County Water District for supplying geologic information well data water-level measurements pumpage records and chemical analyses of ground water Appreciation is also expressed to the many residents of the Soquel-Aptos area who allowed the Geological Survey to measure and sample their wells
Well-Numbering System
Wells are numbered according to their location in the rectangular system for subdivision of public land For example in a well near the Pacific Ocean 11S1E-20El the part of the number preceding the slash indicates the township (T 11 S) the part of the number following the slash indicates the range (R 1 E) the number following the hyphen indicates the section (sec 20) the letter following the section number indicates the 40-acre subdivision within the section according to the diagram shown below and the final digit is a serial number for wells in each 40-acre subdivision All wells mentioned in this report are referenced to the Mount Diablo base line and meridian
In table 3 of this report the entire well number is given as described above on the well-location map (fig 2) only the letter and serial number are shown at the well location
D C B A
EMI
PAL K J
N P O R
5 SEAWATER INTRUSION SOQUEL-APTOS AREA CALIFORNIA
SEAWATER INTRUSION
The landward movement of seawater induced by ground-water development of coastal aquifers may be the most important element which must be considered in plans for the proper management of ground water in this area Seawater intrusion is always a votential source of contamination of aquifers in areas where water is pumped from wells along a coast This intrusion can occur by horizontal migration of a seawater wedge into the aquifer at depth or by downward movement and subsequent lateral migration of seawater through shallow deposits adjacent to the coast or streams and estuaries containing seawater Either way the ground-water level in a coastal aquifer in relation to sea level is the factor that determines if seawater intrusion can occur Under natural conditions ground-water levels near the coast are above sea level the potentiometric surface has a seaward gradient and freshwater is dis-charged into the ocean offshore If ground-water levels in the fresh part of the aquifer decline below sea level the reversal of gradient will cause seawater to migrate landward The actual seawater-freshwater front is not a sharp line of demarcation it is a zone of diffusion where the two kinds of water intermingle resulting in a transitional zone of mixed water having a composition intermediate between fresh and salt water The width of the zone depends upon the hydraulic characteristics of the aquifer the magnitude of the periodic movement of the seawater front in response to ocean tides and the rise and fall of the water table due to recharge and pumping
Another factor that determines whether seawater will intrude a coastal aquifer is the absence or presence of a ground-water barrier If a ground-water barrier separates the landward side of the basin from its seaward exten-sion seawater intrusion may be impeded in the basin The barrier could be a fault a decrease in permeability or any geologic feature that impedes the movement of water On the other hand if there are no barriers and if ground-water levels decline seawater intrusion is likely to occur
There are no vertical ground-water barriers in the coastal part of the Soquel-Aptos area Consequently the factor controlling seawater intrusion is the ground-water level at or near the coastline Because the aquifers extend under Monterey Bay they are in contact with the ocean either on the sea floor adjacent to the coast or on the sides of Monterey Submarine Canyon several miles offshore and avenues are present for the movement of seawater into the coastal aquifer
Geologic Framework
The regional geology of the Soquel-Aptos area has been described in a report by Hickey (1968) The present discussion is limited to the geology of the coastal area shown in figure 2 All the geologic units shown in figure 2 are water bearing except the igneous rocks The two principal water-bearing units are the Purisima Formation and the Aromas Sand The alluvium and the terrace deposits are thin and yield only minor quantities of ground water to wells
6 SEAWATER INTRUSION SOQUEL-APTOS AREA CALIFORNIA
The Purisima Formation of late Miocene and Pliocene age is a sequence of blue moderately to poorly consolidated silty to clean very fine to medium-grained sandstone beds interbedded with siltstone The formation underlies the entire Soquel-Aptos study area and extends southwestward under Monterey Bay It is exposed on the sea floor except in the area between about 2 mi and 7 mi offshore where bay mud overlies it (Gary Greene US Geological Survey oral commun 1978) and on the walls of Monterey Submarine Canyon The formation is predominantly of marine origin and overlies all older units unconformably In turn it is overlain unconformably by all younger units The formation has a regional dip of 3 to 5 degrees southeast In the northwestern part of the area shown in figure 2 it is about 600 ft thick near Soquel about 1000 ft thick and in the vicinity of La Selva Beach over 2000 ft thick Most of the ground water in the Purisima Formation is confined Some areas of unconfined water occur in the foothills inland from the coast It is in these inland areas that most of the recharge to the aquifer occurs The Purisima Formation is the major aquifer in the Soquel-Aptos area and the one from which most wells pump
The Aromas Sand consists of well-sorted quartzose brown-to-red sand containing lenses of silt and clay and a few lenses of gravel The sand deposited during Pleistocene time in a lagoonal shoreline environment rests unconformably on the Purisima Formation The unit crops out only in the eastern part of the area It dips about 4 degrees toward the southeast and ranges in thickness from zero near Aptos to an average of about 600 ft in the vicinity of La Selva Beach extending under Monterey Bay and exposed on the sea floor
Ground water in the Aromas Sand in general occurs under unconfined conditions but is locally confined between silty and clayey beds Recharge to the aquifer is mainly by direct infiltration of rainfall The recharge water moves southward toward the coast and toward the southeast
bull
Indications of Seawater Intrusion
One of the best indications that seawater intrusion is occurring in an aquifer is an increase in the concentration of chloride in water from wells Chloride the major constituent in seawater is relatively stable chemically and will move through an aquifer at virtually the same rate as the intruding water
Another way to recognize seawater intrusion is to compare the chloride concentrations of water from wells near the coast with those in water from wells inland If the chloride concentration of coastal well water is consid-erably higher than that of inland well water seawater intrusion is suspect
7 SEAWATER INTRUSION
12200 P1 W R1 E 121 5230
Ir I c I i I N-- 1-1
28 27 C NI
250
__ bullTp
- - 36
I
I
3Q 2-il -29
-------t2 _
4 I V
i I i 32 31 A lt-
i_ -IRmdash mdash ill
Tp
___ _
) --1 _4 -L_ _ 4_ T10 S
T11 S - 0
-bull-t I 37 00
9a1
16 15Tp TPbdquo
apitola-bdquo VIII II bull-()() ( -()IT
Qa 1 bullRio Del Mar
Tp 22pal (TiffsC ruz Tp r Tp
I rto Cr Soquel -Dint
Point Santa Cruz
MONTEREY BAY 36 5615
Ia Selva Beach 3 Qa
3
Base from U S Geological Survey 0 1 2 3 MILES Geology by John J Hickey(1968)San Francisco Bay Region sheet 3 I i 1 1125000 1970 CONTOUR INTERVAL 200 FEET
Tp and aTERTIARY Miocene CONTACTmdashApproximately located
Ki CRETACEOUS FAULTmdashApproximately locateda BOUNDARY OF STUDY AREA
A A LINE OF GEOLOGIC SECTION (Fig 9)
0M2 WELL LOCATION AND NUMBERmdashSee text for explanation of well-numbering system
FIGURE 2mdash Geology and location of wells
8 SEAWATER INTRUSION SOQUEL-APTOS AREA CALIFORNIA
Data from two principal sources were used to identify seawater intrusion in the Soquel-Aptos area (1) Long-term chemical data collected by the Soquel Creek County Water District from their supply wells (fig 3) and (2) chemical data collected by the Geological Survey in July 1978 from more than 20 private wells adjacent to the coast In addition some chemical data were available from wells owned by the city of Santa Cruz (fig 3)
Seawater intrusion is occurring in the vicinity of Capitola in the upper part of the Purisima Formation 0-100 ft below sea level It is evidenced by a concentration of chloride in well water exceeding 100 mgL (milligrams per liter) which the author considers an indicator of seawater intrusion in the Soquel-Aptos area In unintruded parts of the Soquel-Aptos area the chloride concentration in ground water from the Purisima Formation ranges from about 20 to 80 mgL and in the Aromas Sand it is about 20 mgL (fig 3) Figure 3 shows the extent of the intrusion It appears that intrusion has been pro-gressing since 1959 or earlier This is illustrated by figure 4 the 1959-78 plot of the chloride concentration of water from well 11S1W-15L1 which obtains most of its water from the interval 0-100 ft below sea level In 1959 the chloride concentration was about 45 mgL--by 1978 it had increased to 90 mgL Seawater intrusion is also indicated by statements of some residents in the Capitola area who say that water from their shallow wells has over the past few years become salty to taste and unusable for garden and lawn irrigation
Water pumped from intervals deeper than 100 ft below sea level shows little or no increase in chloride concentration as illustrated by the plots shown in figures 5-8 These plots are for Soquel Creek County Water District supply wells in the Capitola-La Selva Beach area (fig 3) all of which pump from the deeper intervals No seawater intrusion is indicated in spite of the fact that the nonpumping water levels in most of the wells have been below sea level since the early 1970s Probably the freshwater-seawater interface is advancing landward but still lies at some distance offshore or at depth
Figure 9 is a diagrammatic geologic section showing how seawater may be intruding in the Soquel-Aptos area The interval 0-100 ft below sea level is being intruded by seawater moving into deposits exposed on the sea floor near the shoreline and then landward The seaward end of the Purisima Formation probably contains seawater that enters through the wall of Monterey Submarine Canyon and through the sea floor
Seawater intrusion is occurring because since the early 1970s ground-water pumpage which is concentrated in an area from the shoreline inland about 1 mi has reduced the head in the Purisima Formation and caused ground-water levels near the coast to decline and lie below sea level (figs 4-8) Thus a landward ground-water gradient has developed in the aquifer allowing seawater to move shoreward (fig 10)
12200 R1 W R1 E 121deg5230
EXPLANATION
APPROXIMATE LIMIT OF SEAWATER WELLS IN THE PURISIMA FORMATION INTRUSION IN THE INTERVAL Upper number is chloride concentration 0 mdash 100 FEET BELOW SEA LEVEL in milligrams per liter lower two numbers JULY 1978 are altitudes of top and bottom of perfo-
rated interval in feet below or above (+) National Geodetic Vertical Datum of 1929
36 Lower single number is altitude of well bottom in feet where perforated interval is not known T10 S
T11 S33 Soquel Creek County Water District 270-810 January 1979
_47__ Privately owned July 197815-71 3700
City of Santa Cruz April 197864111
Box indicates well is perforated in the Aromas Sand
22
Si oto Horbor
APO
23 100140
36deg5615
34
Oft
moi
SfIE
LN
I 111
1V
ti VaS
Base from U S Geological Survey 0 2 3 MILES San Francisco Bay Region sheet 3 1125000 1970
CONTOUR INTERVAL 200 FEET NATIONAL GEODETIC VERTICAL DATUM OF 1929
FIGURE 3 mdash Chloride concentration of water from wells altitudes of perforated intervals and approximate landward limit of seawater intrusion July 1978
10 SEAWATER INTRUSION SOQUEL-APTOS AREA CALIFORNIA C
HL
OR
IDE
IN
MIL
LIG
RA
MS
PE
R L
ITE
R
70
60
50
40
30
20
50
Imdash w w u_
25Z
_i w gt Ill_j SEA LEVEL tx w Imdash lt
-25 u 0 w 0 D -50Imdash i=_1Q
-75
Well 11S1W-15L1 Depth 211 feet perforations 136-211 feet Land-surface altitude 75 feet Data from Soquel Creek County Water District
DISTANCE IN MILES FROM SHORELINE VERTICAL EXAGGERATION X 26
EXPLANATION
BAY MUD APPROXIMATE LIMIT OF SEAWATER INTRUSION
O 0 GRAVEL AND SAND (Terrace deposits) ARROW INDICATES DIRECTION OF FLOW
bull SAND SILT AND CLAY (Purisirna Formation) MEM+ Seawater
bull bull bull
bull bull bull CONSOLIDATED ROCK (Igneous rocks) Freshwater
NO
ISIP
1IN
IH
ILVM
VH
S
FIGURE 9mdashGeneralized geologic section showing zones intruded by seawater (see fig 2 for location of section) Ln
16 SEAWATER INTRUSION SOQUEL-APTOS AREA CALIFORNIA
Methods for Controlling Seawater Intrusion
The following discussion of methods for controlling seawater intrusion is intended only as general background on the subject Schematic diagrams are included to illustrate principles (figs 10-13)
Seawater intrusion might be controlled by one or more of the following actions (1) Reduce ground-water pumping in the coastal area (2) artifi-cially recharge the aquifers (3) modify the pumping pattern (4) maintain a pressure ridge of fresh ground water above sea level in the intruded aquifers along the coast or (5) establish a pumping trough in the seawater adjacent to the coastline The first four methods control the intrusion by maintaining the inland potentiometric surface above sea level The fifth removes the seawater before it can migrate inland
Pumping could be reduced by changing to crops requiring less water by having only one harvest per year or by taking some lands out of production Pumping in coastal areas could be reduced by importing supplemental water Artificial recharge could be implemented by using either this supplemental water or reclaimed wastewater
Changing the pumping pattern would help to keep intrusion from advancing inland Pumping wells near the coast causes seawater intrusion because seawater moves inland when the potentiometric surface seaward of the pumping wells is below sea level (fig 10) If the wells adjacent to the coast were abandoned and the pumping centers were shifted farther inland the potentio-metric surface would be above sea level and the pressure gradient would be toward the ocean (fig 11) Careful regulation of the pumpage would be necessary to prevent a return to the conditions shown in figure 10
A pumping trough parallel to the coast could be developed to control seawater intrusion A line of pumping wells along the coast stabilizes the seawater wedge near the trough if the amount of water pumped is carefully regulated (fig 12) The disadvantage of this method is that it wastes a large amount of freshwater
A ground-water pressure ridge parallel to the coast controls seawater intrusion by keeping the potentiometric surface above sea level and maintain-ing the seaward flow of fresh ground water (fig 13) This method requires a line of recharge wells along the coast and a supplemental water supply to create the freshwater barrier unless some pumpage from the aquifer inland is used for recharge
Many factors must be considered in developing plans far controlling seawater intrusion These factors include capital outlay and recurring costs of the required physical works (for example wells pumps distribution lines and treatment facilities) legal aspects (for example water rights and rights of way) availability and cost of supplemental water physical aspects of the aquifer system and overlying soils and the chemistry of the different kinds of water in the system
17 SEAWATER INTRUS ION
Bra
ckis
h w
ate
r
LAND SURFACPumping wells POTENTIOMETRIC SURFACE
SEA LEVEL
onfming be
Perforated interval
AQUIFER SEAWATER WEDGE
Fresh ground water
ARROWSmdashIndicate direction of water flow
FIGURE 10mdashSchematic section at coast showing influence of coastal pumping on seawater intrusion
POTENTIOMETRIC SURFACE A Pumping
wells
SEA LEVEL
SEAWATER WEDGE
ARROWS mdashIndicate direction of water flow
FIGURE 11mdashSchematic section at coast showing influence of inland pumping on seawater intrusion
18 SEAWATER INTRUSION SOQUELmdashAPTOS AREA CALIFORNIA
Fres
hwat
er
POTENTIOMETRIC SURFACE A Pumping well
Line of pumping wells
LAND SURFACESEA LEVEL
-4mdash7mdash AQUIFER ----411- _AmdashN
SEAWATER WEDGE Fresh ground water _
Stable seawater wedgeARROWS-Indicate direction of water flow
FIGURE 12-Schematic section at coast showing effects of a pumping trough on seawater intrusion
Fre
shw
ater
POTENTIOMETRIC SURFACE Pumping well
LAND SURFACELine of recharging wells
SEA LEVEL
SEAWATER WEDGE
ARROWS-Indicate direction of water flow
FIGURE 13mdashSchematic section at coast showing effects of a pressure ridge on seawater intrusion
19 SEAWATER INTRUSION SOQUEL-APTOS AREA CALIFORNIA
POTENTIAL AQUIFER YIELD
In this report the potential aquifer yield in the Soquel-Aptos area is defined as the long-term average inflow to the ground-water reservoir minus unrecoverable water lost to evapotranspiration and the quantity of underflow to the ocean necessary to maintain a barrier against seawater intrusion
The Soquel Creek County Water District and city of Santa Cruz Water Department pump water from the Purisima Formation which is the main aquifer in the area The Soquel Creek County Water District also pumps from the Aromas Sand located in the vicinity of La Selva Beach (fig 14) A separate potential yield value was determined for each of the aquifers
The techniques used to estimate potential ground-water yield for this report have been used by many investigators (see Todd 1964 p 206-208) Those used to determine the yield for the Purisima Formation and Aromas Sand although not specifying an item-by-item evaluation of inflow and outflow are based on the general equation of hydrologic equilibrium
Surface inflow Surface outflow + Subsurface inflow + Subsurface outflow + Precipitation = + Consumptive use + Imported water + Exported water + Decrease in surface storage + Increase in surface storage + Decrease in ground-water storage + Increase in ground-water storage
Purisima Formation
The potential yield of the Purisima Formation is shown by the relation between average annual pumpage and the corresponding average annual net change of ground water in storage for a base period in which climatic conditions approximate the long-term average For simplicity the base period spring 1962 to spring 1975 was selected because ground-water storage was the same at the end of the period as it was at the beginning Therefore average inflow was equal to average outflow and potential yield was equal to the average pump-age The hydrograph for well 11S1W-10C1 has water-level fluctuations con-sidered representative of those in the Purisima Formation and was used to make the estimates of potential yield (fig 15)
On the cumulative departure curve (fig 16) a line joining the beginning and end of the period 1962-1975 would be nearly horizontal indicating that the average rainfall for that period was close to the long-term average In fact rainfall was 98 percent of the 100-year average To be representative climatically a base period should include a wet period and a dry period The base period spring 1962 to spring 1975 includes parts of two dry periods and a complete wet period It is important also to select a period that does not begin after or end with an extremely wet year because of the water-in-transit problem It may take a year or more for the water levels to fully reflect recharge from a wet year Figure 16 indicates that neither the 1960-61 or 1974-75 rainfall years were wet years
20 SEAWATER INTRUSION SOQUEL-APTOS AREA CALIFORNIA
122deg00 5230 121deg45 37deg0730
37deg00
Sibnr Cr
La Selva Beach
I 0 A 7 4
R
0 1 2 3 4 5 MILESI I I
Base from U S Geological Survey San Francisco Bay Region sheet 3 1125000 1970
EXPLANATION
PURISIMA FORMATION
AROMAS SAND Ammorilormarmmomm
FAULT mdash Approximately located
FIGURE I4mdashAreas for which potential aquifer yield was determined
21 POTENTIAL AQUIFER YIELD
AL
TIT
UD
EO
F W
AT
ER
LE
VE
L I
N F
EE
T
Well 11S1W-10C1 Depth 350 feet perforations unknown Land-surface altitude 90 feet Data from California Department of Water Resources
FIGURE 15mdashFluctuation of water level in well 1151 W-10C1
The 1962-75 period fits the required criteria for a valid base period Therefore the potential ground-water yield of the Purisima Formation in the Soquel-Aptos area based on 1962-75 conditions and on average annual pumpage (4400 acre-ft) as determined from table 1 is about 4400 acre-ftyr
The estimated yield value was checked by plotting the annual average change in ground-water levels in all wells measured against annual pumpage (fig 17) If inflow to the aquifer is reasonably constant the points can be fitted to a straight line and pumpage corresponding to zero change in water level equals the potential yield The zero change in water level in figure 17 is at a point corresponding to 4100 acre-ft a quantity which agrees reasonably well with the yield figure determined in the previous paragraph
PR
EC
IPIT
AT
ION
IN
IN
CH
ES
C
UM
UL
AT
IVE
DE
PA
RT
UR
E O
F P
RE
CIP
ITA
TIO
N IN
IN
CH
ES
n
) CJ
it
(
71
6)
Ja
eJ
43
N3
C1
0
8 0
0
0
0
0
0
0
0
8 8
0
0
I I
I 1
I 1
I
FIGU RE 16 -1956-77 Santa Cruzprecipatationand cumulative departurecurve
1 OC 3N1 111--IAinr 1IV3A 011V141 110
1956
-57
1957
-58
1958
-59
1959
-60
1960
-61
1961
-62
1962
-63
1963
-64
1964
-65
1965
-66
1966
-67
1967
-68
1968
-69
1969
-70
1970
-71
1971
-72
1972
-73
1973
-74
1974
-75
1975
-76
D 33 m II
1976
-77
1977
-78
I
VINTIIWD yaw samv-ianOos Noisnalsi aummvas
ZZ
AV
ER
AG
E A
NN
UA
L C
HA
NG
E IN
GR
OU
ND
- WA
TE
R L
EV
EL
IN
FE
ET
mu
uaai
rew avimagm
14
12
10
1964 0
491969 01970 1974
o
1962 euro
01)1963 euro01967 1965 01966 1973
611968 6)1971
1972e-4 mdash
POTENTIAL YIELD --- -6 --
-10
-12 3000
I 4000
I 5000
I 6000
ANNUAL PUMPAGE IN ACRE-FEET
FIGURE 17mdashAnnual pumpage versus average annual change in ground-water level
24 SEAWATER INTRUSION SOQUEL-APTOS AREA CALIFORNIA
TABLE 1 - Pumpage in acre-feet from Purisima Formation 1962-74
CentralSoquel Miscel-
City Santa Miscel-Creek laneous
Agri- of Indus- Cruz laneousCounty water
Year cul- Santa trial3 County domestic TotalWater pur-
Metered 2Agriculture pumpage was computed from total electrical energy used for
pumping water and the electrical energy required to pump a unit volume of water 3Estimated
Aromas Sand
The potential yield of the Aromas Sand was estimated by comparing the average annual pumpage with the corresponding average annual net change of ground water in storage The estimate does not have the same degree of accu-racy as that determined for the Purisima Formation because long-term water-level fluctuations are available only for the coastal part of the aquifer and not for the large part of the recharge area several miles inland The hydro-graphs of wells 11S1E-28D1 and 11S1E-28R2 (fig 18) indicate that ground-water storage in 1977 was about the same as in 1966 Therefore average
25 POTENTIAL AQUIFER YIELD
AL
TIT
UD
E O
F W
AT
ER
LE
VE
L I
NF
EE
T
Well 11S1E-28R2 Depth 290 feet perforations 250-290 feet Land-surface altitude 150 feet Well 11S1E-28D1 Depth 550 feet perforations 310-550 feet Land-surface altitude 120 feet Data from Soquel Creek County Water District
FIGURE 18mdashFluctuation of water level in wells 11S1E-28D1 and 28R2
inflow for the 1966-77 period was equal to average outflow and ground-water yield is equal to average annual pumpage The period includes a wet cycle (fig 16) and 3 years of a dry cycle including the drought years 1975-76 and 1976-77 Neither the 1964-65 nor the 1976-77 rainfall year was extremely wet so there is no water-in-transit problem with the base period Average rainfall for the 1966-77 base period was 2946 inches about 94 percent of the 100-year average This means that inflow to the ground-water reservoir for the 1966-77 period was slightly less than the long-term average and an esti-mate of ground-water yield based on average annual pumpage for this period is probably conservative The ground-water yield of the Aromas Sand in the Soquel-Aptos area based on 1966-76 conditions and on average pumpage as determined from table 2 is about 1500 acre-ftyr
26 SEAWATER INTRUSION SOQUEL-APTOS AREA CALIFORNIA
TABLE 2 - Pumpage in acre-feet from Aromas Sand 1966-77
Metered 2Agriculture pumpage was computed from total electricalenergy used for
pumping water and the electrical energy required to pump a unit volume of water 3Estimated
OBSERVATION-WELL NETWORK
The objective of an observation-well network in the Soquel-Aptos area is to function as an early warning system to alert those responsible for managing and protecting the ground-water resources of the area from adverse changes Water-level measurements in wells are necessary to indicate the effects of pumping on the ground-water system and the status of ground-water storage Ground-water sample analyses are needed to monitor seawater intrusion and other water-quality changes
At the present time the Soquel Creek County Water District makes monthly pumping and nonpumping water-level measurements in 15 supply wells The same wells are sampled every autumn and analyzed for major-ion concentration including total alkalinity (as CaCO3) bicarbonate boron calcium chloride specific conductance dissolved solids fluoride iron magnesium potassium silica sodium sulfate and nitrate plus nitrite as nitrogen The California Department of Water Resources measures water levels in wells 11S1W-10C1 and 15E2 (USGS 16H1) at monthly intervals
27 OBSERVATION-WELL NETWORK
TABLE 3 - Potential observation-well network
Type of data and frequency of collection
Water level Water quality Well Depth
April Chloride and specific conductance Major ionsNo (ft)
Monthly and April September September
September
10S1W-27J1 238 X 11S1W-9M2 110 X X X 11S1W-10C1 350 X X X 11S1W-11L1 628 X X x 11S1W-11L2 650 X X x 11S1W-11L3 150 X X X 11S1W-11N1 398 X X x 11S1W-11R1 220 X X X 11S1W-12K1 1020 X X x 11S1W-131 700-800 X X X 11S1W-13G1 330 X X x 11S1W-14A2 194 X X x 11S1W-151 700-800 X X x 11S1W-15A1 168 X X x 11S1W-15L1 211 X X x 11S1W-15L2 256 X X x 11S1W-16H1 101 X 11S1W-16Q1 98 X X X 11S1E-17F1 460 X X x 11S1E-18E1 214 X X x 11S1E-18F1 713 X X x 11S1E-191 700-800 X X X 11S1E-20E1 400 X X x 11S1E-20G1 495 X X x 11S1E-28D1 550 X X x 11S1E-28M1 184 X X X 11S1E-28R1 355 X X x 11S1E-28R2 290 X X x 11S1E-33J2 205 X X X
1Well to be drilled
Table 3 and figure 19 show the wells in the current observation network and the wells that could be used to expand the network for more effective monitoring Additional shallow wells that might monitor the depth interval now being intruded by seawater are 11S1W-9M2 11L3 11R1 14A2 15A1 and 16Q1 and 11S1E-28M1 and 33J2 Observations made at these wells would be most effective if made twice yearly in April when ground-water storage is highest and in September when ground-water storage is lowest Water-level measurements will show the status of ground-water storage and determination of chloride concentration and specific conductance in water samples will show changes in water quality The 15 district supply wells would also be most effectively monitored in April and September The April samples need only be analyzed for chloride and the specific conductance determined Complete chemical analyses of the September samples would be needed Water-level measurements are currently being taken at district supply wells at monthly intervals The addition of April and September water-level data from well 10S1W-27J1 would help to monitor changes in ground-water storage in the Purisima Formation in the central part of the Soquel-Aptos area
12T 00 R1 W R1 E 121deg5230
co
29 bdquo Amdash I
EXPLANATION
Soquel Creek County Water Districtbull supply-well observation network
4) Well monitored by California Depart- T10 S ment of Water Resources T11 S
3 Shallow well to be added to observation network
37-00bull Deep well to be added to observation network
bull Well to be drilled
VIt
2IO
3IIV
3 ` N
ois
nu
m u
nvm
vas
tilrrrtn Craz Harbor
(1AS -r CL AkL) -eES
Point Santa Cruz
Base from U S Geological Survey San Francisco Bay Region sheet 3 1125000 1970
apitola TAlE BF A-
uurpf ()SH(1
Rio Del Mar op Opal Cliffs au
Soquel Point
MONTEREY BAY 365615
La Selva Beach
4
0 1 2 3 MILES
CONTOUR INTERVAL 200 FEET NATIONAL GEODETIC VERTICAL DATUM OF 1929
Three new wells 700-800 ft deep and adjacent to the coast one in SWk sec 13 T 11 S R 1 W one in SEA sec 15 T 11 S R 1 W and one in SWk sec 19 T 11 S R 1 E could monitor the lower part of the Purisima Formation Data from these wells might be used to detect the advancing sea-water front at depth before it reaches the Soquel Creek County Water District wells
CONCLUSIONS
Ground-water pumpage from the Purisima Formation a confined aquifer has averaged about 5400 acre-ftyr since 1970--1000 acre-ftyr more than its potential yield of 4400 acre-ftyr This pumping has caused a decrease in freshwater head and water levels in wells along the coast have declined to below sea level Prior to the 1970s the head was sufficient to produce a seaward gradient and freshwater was discharged into the ocean at the outcrop of the aquifer maintaining the freshwater-seawater interface an unknown but probably considerable distance offshore Since the early 1970s the reduction of head has reversed the ground-water gradient in the aquifer and has brought about conditions that are favorable for migration of seawater landward Seawater intrusion has resulted and has progressed in the interval 0-100 ft below sea level to the vicinity of Capitola Intrusion has been detected in this shallow interval first probably because it crops out near shore on the floor of Monterey Bay and seawater had only a short distance to travel to reach shallow wells
It is unknown how long it will take seawater to intrude the inland parts of the deeper zones if indeed it ever does It will depend on how carefully pumpage with its effect on freshwater head is managed As the freshwater head is reduced seawater will move landward and a new freshwater-saltwater interface will be established If the interface reaches deep wells then saltwater will be pumped Conversely if the freshwater head is increased the interface will move seaward and the threat of seawater intrusion will be eliminated
Ground-water pumpage from the Aromas Sand in the vicinity of La Selva Beach (fig 14) has been near its potential yield--about 1500 acre-ftyr--since the early 1970s No changes in the quantity of ground water in storage or in water quality have been observed
An observation-well network could be established to monitor status of ground-water storage and water quality
REFERENCES CITED
Hickey J J 1968 Hydrogeologic study of the Soquel-Aptos area Santa Cruz County California US Geological Survey open-file report 48 p
Todd D K 1964 Ground water hydrology New York John Wiley 336 p
bull bull
bull bull
bull r
4 A
bull -
obdquo rtt
s bull bull
bulllsquo44
bull
mdashbull
t s
s O
t
4 lsquo-zii bullIc
44
-t- ---bull
f4 4
ibdquobull
-4
bull
- bullbull
t --bdquo
-r4
2-
bullbullbull
x bull k
4
$
bull bull
1
a
bull bull 70bull
It bullbullbull
raf 1 i
oo
- bull 4 bull
sis
bull
x bull
bdquo
s
sY
bull
1 il
rik
- tr
-bull bull
bull
1-
t
bull
os
4
to7 1
I
r bull
-~4 44
aorss i
bull Ns4
bull bullsio
mdashso
bull o
bull -4
hi
Ot i
bull
USGS LIBRARY - RESTON
Muir--SEAWATER INTRUSION SOQUEL-APTOS AREA SANTA CRUZ COUNTY CALIFORNIA--WRI 80-84
0CO
COOOOOC
O
Page 1
Page 2
Page 3
Page 4
Page 5
Page 6
Page 7
Page 8
Page 9
Page 10
Page 11
Page 12
Page 13
Page 14
Page 15
Page 16
Page 17
Page 18
Page 19
Page 20
Page 21
Page 22
Page 23
Page 24
Page 25
Page 26
Page 27
Page 28
Page 29
Page 30
Page 31
Page 32
Page 33
Page 34
Page 35
Page 36
Page 37
Page 38
Page 39
Page 40
11 SEAWATER INTRUSION A
LT
ITU
DE
OF
WA
TE
RL
EV
EL
IN
FE
ET
C
HL
OR
IDE
IN
MIL
LIG
RA
MS
PER
LIT
ER
Well 11S1W-11N1Depth 398 feet perforations unknown Land-surface altitude 110 feet Data from Soquel Creek County Water District
90
80
70
60
50
40
30
20
50 I I I I I I I I I I I 1 I I I 1 I 1 I
25 111Voo
_ No data 4lsquotbdquoSEA LEVEL 1
VV4lsquoP
-25
I -50
1 I I 1 1 1 I 1 I I I I I-75 1959 60 61 62 63 64 65 66 67 68 69 70 71 72 73 74 75 76 77 1978
FIGURE 5mdashFluctuations of chloride and water level in well 11S1W-11N1
12 SEAWATER INTRUSION SOQUEL-APTOS AREA CALIFORNIA A
LT
ITU
DE
OF
WA
TE
R L
EV
EL
IN
FE
ET
C
HL
OR
IDE
IN
MIL
LIG
RA
MS
PE
R L
ITE
R
Well 11S1W-13G1 Depth 330 feet perforations 200-330 feet Land-surface altitude 130 feet Data from Soquel Creek County Water District
DISTANCE IN MILES FROM SHORELINE VERTICAL EXAGGERATION X 26
EXPLANATION
BAY MUD APPROXIMATE LIMIT OF SEAWATER INTRUSION
O 0 GRAVEL AND SAND (Terrace deposits) ARROW INDICATES DIRECTION OF FLOW
bull SAND SILT AND CLAY (Purisirna Formation) MEM+ Seawater
bull bull bull
bull bull bull CONSOLIDATED ROCK (Igneous rocks) Freshwater
NO
ISIP
1IN
IH
ILVM
VH
S
FIGURE 9mdashGeneralized geologic section showing zones intruded by seawater (see fig 2 for location of section) Ln
16 SEAWATER INTRUSION SOQUEL-APTOS AREA CALIFORNIA
Methods for Controlling Seawater Intrusion
The following discussion of methods for controlling seawater intrusion is intended only as general background on the subject Schematic diagrams are included to illustrate principles (figs 10-13)
Seawater intrusion might be controlled by one or more of the following actions (1) Reduce ground-water pumping in the coastal area (2) artifi-cially recharge the aquifers (3) modify the pumping pattern (4) maintain a pressure ridge of fresh ground water above sea level in the intruded aquifers along the coast or (5) establish a pumping trough in the seawater adjacent to the coastline The first four methods control the intrusion by maintaining the inland potentiometric surface above sea level The fifth removes the seawater before it can migrate inland
Pumping could be reduced by changing to crops requiring less water by having only one harvest per year or by taking some lands out of production Pumping in coastal areas could be reduced by importing supplemental water Artificial recharge could be implemented by using either this supplemental water or reclaimed wastewater
Changing the pumping pattern would help to keep intrusion from advancing inland Pumping wells near the coast causes seawater intrusion because seawater moves inland when the potentiometric surface seaward of the pumping wells is below sea level (fig 10) If the wells adjacent to the coast were abandoned and the pumping centers were shifted farther inland the potentio-metric surface would be above sea level and the pressure gradient would be toward the ocean (fig 11) Careful regulation of the pumpage would be necessary to prevent a return to the conditions shown in figure 10
A pumping trough parallel to the coast could be developed to control seawater intrusion A line of pumping wells along the coast stabilizes the seawater wedge near the trough if the amount of water pumped is carefully regulated (fig 12) The disadvantage of this method is that it wastes a large amount of freshwater
A ground-water pressure ridge parallel to the coast controls seawater intrusion by keeping the potentiometric surface above sea level and maintain-ing the seaward flow of fresh ground water (fig 13) This method requires a line of recharge wells along the coast and a supplemental water supply to create the freshwater barrier unless some pumpage from the aquifer inland is used for recharge
Many factors must be considered in developing plans far controlling seawater intrusion These factors include capital outlay and recurring costs of the required physical works (for example wells pumps distribution lines and treatment facilities) legal aspects (for example water rights and rights of way) availability and cost of supplemental water physical aspects of the aquifer system and overlying soils and the chemistry of the different kinds of water in the system
17 SEAWATER INTRUS ION
Bra
ckis
h w
ate
r
LAND SURFACPumping wells POTENTIOMETRIC SURFACE
SEA LEVEL
onfming be
Perforated interval
AQUIFER SEAWATER WEDGE
Fresh ground water
ARROWSmdashIndicate direction of water flow
FIGURE 10mdashSchematic section at coast showing influence of coastal pumping on seawater intrusion
POTENTIOMETRIC SURFACE A Pumping
wells
SEA LEVEL
SEAWATER WEDGE
ARROWS mdashIndicate direction of water flow
FIGURE 11mdashSchematic section at coast showing influence of inland pumping on seawater intrusion
18 SEAWATER INTRUSION SOQUELmdashAPTOS AREA CALIFORNIA
Fres
hwat
er
POTENTIOMETRIC SURFACE A Pumping well
Line of pumping wells
LAND SURFACESEA LEVEL
-4mdash7mdash AQUIFER ----411- _AmdashN
SEAWATER WEDGE Fresh ground water _
Stable seawater wedgeARROWS-Indicate direction of water flow
FIGURE 12-Schematic section at coast showing effects of a pumping trough on seawater intrusion
Fre
shw
ater
POTENTIOMETRIC SURFACE Pumping well
LAND SURFACELine of recharging wells
SEA LEVEL
SEAWATER WEDGE
ARROWS-Indicate direction of water flow
FIGURE 13mdashSchematic section at coast showing effects of a pressure ridge on seawater intrusion
19 SEAWATER INTRUSION SOQUEL-APTOS AREA CALIFORNIA
POTENTIAL AQUIFER YIELD
In this report the potential aquifer yield in the Soquel-Aptos area is defined as the long-term average inflow to the ground-water reservoir minus unrecoverable water lost to evapotranspiration and the quantity of underflow to the ocean necessary to maintain a barrier against seawater intrusion
The Soquel Creek County Water District and city of Santa Cruz Water Department pump water from the Purisima Formation which is the main aquifer in the area The Soquel Creek County Water District also pumps from the Aromas Sand located in the vicinity of La Selva Beach (fig 14) A separate potential yield value was determined for each of the aquifers
The techniques used to estimate potential ground-water yield for this report have been used by many investigators (see Todd 1964 p 206-208) Those used to determine the yield for the Purisima Formation and Aromas Sand although not specifying an item-by-item evaluation of inflow and outflow are based on the general equation of hydrologic equilibrium
Surface inflow Surface outflow + Subsurface inflow + Subsurface outflow + Precipitation = + Consumptive use + Imported water + Exported water + Decrease in surface storage + Increase in surface storage + Decrease in ground-water storage + Increase in ground-water storage
Purisima Formation
The potential yield of the Purisima Formation is shown by the relation between average annual pumpage and the corresponding average annual net change of ground water in storage for a base period in which climatic conditions approximate the long-term average For simplicity the base period spring 1962 to spring 1975 was selected because ground-water storage was the same at the end of the period as it was at the beginning Therefore average inflow was equal to average outflow and potential yield was equal to the average pump-age The hydrograph for well 11S1W-10C1 has water-level fluctuations con-sidered representative of those in the Purisima Formation and was used to make the estimates of potential yield (fig 15)
On the cumulative departure curve (fig 16) a line joining the beginning and end of the period 1962-1975 would be nearly horizontal indicating that the average rainfall for that period was close to the long-term average In fact rainfall was 98 percent of the 100-year average To be representative climatically a base period should include a wet period and a dry period The base period spring 1962 to spring 1975 includes parts of two dry periods and a complete wet period It is important also to select a period that does not begin after or end with an extremely wet year because of the water-in-transit problem It may take a year or more for the water levels to fully reflect recharge from a wet year Figure 16 indicates that neither the 1960-61 or 1974-75 rainfall years were wet years
20 SEAWATER INTRUSION SOQUEL-APTOS AREA CALIFORNIA
122deg00 5230 121deg45 37deg0730
37deg00
Sibnr Cr
La Selva Beach
I 0 A 7 4
R
0 1 2 3 4 5 MILESI I I
Base from U S Geological Survey San Francisco Bay Region sheet 3 1125000 1970
EXPLANATION
PURISIMA FORMATION
AROMAS SAND Ammorilormarmmomm
FAULT mdash Approximately located
FIGURE I4mdashAreas for which potential aquifer yield was determined
21 POTENTIAL AQUIFER YIELD
AL
TIT
UD
EO
F W
AT
ER
LE
VE
L I
N F
EE
T
Well 11S1W-10C1 Depth 350 feet perforations unknown Land-surface altitude 90 feet Data from California Department of Water Resources
FIGURE 15mdashFluctuation of water level in well 1151 W-10C1
The 1962-75 period fits the required criteria for a valid base period Therefore the potential ground-water yield of the Purisima Formation in the Soquel-Aptos area based on 1962-75 conditions and on average annual pumpage (4400 acre-ft) as determined from table 1 is about 4400 acre-ftyr
The estimated yield value was checked by plotting the annual average change in ground-water levels in all wells measured against annual pumpage (fig 17) If inflow to the aquifer is reasonably constant the points can be fitted to a straight line and pumpage corresponding to zero change in water level equals the potential yield The zero change in water level in figure 17 is at a point corresponding to 4100 acre-ft a quantity which agrees reasonably well with the yield figure determined in the previous paragraph
PR
EC
IPIT
AT
ION
IN
IN
CH
ES
C
UM
UL
AT
IVE
DE
PA
RT
UR
E O
F P
RE
CIP
ITA
TIO
N IN
IN
CH
ES
n
) CJ
it
(
71
6)
Ja
eJ
43
N3
C1
0
8 0
0
0
0
0
0
0
0
8 8
0
0
I I
I 1
I 1
I
FIGU RE 16 -1956-77 Santa Cruzprecipatationand cumulative departurecurve
1 OC 3N1 111--IAinr 1IV3A 011V141 110
1956
-57
1957
-58
1958
-59
1959
-60
1960
-61
1961
-62
1962
-63
1963
-64
1964
-65
1965
-66
1966
-67
1967
-68
1968
-69
1969
-70
1970
-71
1971
-72
1972
-73
1973
-74
1974
-75
1975
-76
D 33 m II
1976
-77
1977
-78
I
VINTIIWD yaw samv-ianOos Noisnalsi aummvas
ZZ
AV
ER
AG
E A
NN
UA
L C
HA
NG
E IN
GR
OU
ND
- WA
TE
R L
EV
EL
IN
FE
ET
mu
uaai
rew avimagm
14
12
10
1964 0
491969 01970 1974
o
1962 euro
01)1963 euro01967 1965 01966 1973
611968 6)1971
1972e-4 mdash
POTENTIAL YIELD --- -6 --
-10
-12 3000
I 4000
I 5000
I 6000
ANNUAL PUMPAGE IN ACRE-FEET
FIGURE 17mdashAnnual pumpage versus average annual change in ground-water level
24 SEAWATER INTRUSION SOQUEL-APTOS AREA CALIFORNIA
TABLE 1 - Pumpage in acre-feet from Purisima Formation 1962-74
CentralSoquel Miscel-
City Santa Miscel-Creek laneous
Agri- of Indus- Cruz laneousCounty water
Year cul- Santa trial3 County domestic TotalWater pur-
Metered 2Agriculture pumpage was computed from total electrical energy used for
pumping water and the electrical energy required to pump a unit volume of water 3Estimated
Aromas Sand
The potential yield of the Aromas Sand was estimated by comparing the average annual pumpage with the corresponding average annual net change of ground water in storage The estimate does not have the same degree of accu-racy as that determined for the Purisima Formation because long-term water-level fluctuations are available only for the coastal part of the aquifer and not for the large part of the recharge area several miles inland The hydro-graphs of wells 11S1E-28D1 and 11S1E-28R2 (fig 18) indicate that ground-water storage in 1977 was about the same as in 1966 Therefore average
25 POTENTIAL AQUIFER YIELD
AL
TIT
UD
E O
F W
AT
ER
LE
VE
L I
NF
EE
T
Well 11S1E-28R2 Depth 290 feet perforations 250-290 feet Land-surface altitude 150 feet Well 11S1E-28D1 Depth 550 feet perforations 310-550 feet Land-surface altitude 120 feet Data from Soquel Creek County Water District
FIGURE 18mdashFluctuation of water level in wells 11S1E-28D1 and 28R2
inflow for the 1966-77 period was equal to average outflow and ground-water yield is equal to average annual pumpage The period includes a wet cycle (fig 16) and 3 years of a dry cycle including the drought years 1975-76 and 1976-77 Neither the 1964-65 nor the 1976-77 rainfall year was extremely wet so there is no water-in-transit problem with the base period Average rainfall for the 1966-77 base period was 2946 inches about 94 percent of the 100-year average This means that inflow to the ground-water reservoir for the 1966-77 period was slightly less than the long-term average and an esti-mate of ground-water yield based on average annual pumpage for this period is probably conservative The ground-water yield of the Aromas Sand in the Soquel-Aptos area based on 1966-76 conditions and on average pumpage as determined from table 2 is about 1500 acre-ftyr
26 SEAWATER INTRUSION SOQUEL-APTOS AREA CALIFORNIA
TABLE 2 - Pumpage in acre-feet from Aromas Sand 1966-77
Metered 2Agriculture pumpage was computed from total electricalenergy used for
pumping water and the electrical energy required to pump a unit volume of water 3Estimated
OBSERVATION-WELL NETWORK
The objective of an observation-well network in the Soquel-Aptos area is to function as an early warning system to alert those responsible for managing and protecting the ground-water resources of the area from adverse changes Water-level measurements in wells are necessary to indicate the effects of pumping on the ground-water system and the status of ground-water storage Ground-water sample analyses are needed to monitor seawater intrusion and other water-quality changes
At the present time the Soquel Creek County Water District makes monthly pumping and nonpumping water-level measurements in 15 supply wells The same wells are sampled every autumn and analyzed for major-ion concentration including total alkalinity (as CaCO3) bicarbonate boron calcium chloride specific conductance dissolved solids fluoride iron magnesium potassium silica sodium sulfate and nitrate plus nitrite as nitrogen The California Department of Water Resources measures water levels in wells 11S1W-10C1 and 15E2 (USGS 16H1) at monthly intervals
27 OBSERVATION-WELL NETWORK
TABLE 3 - Potential observation-well network
Type of data and frequency of collection
Water level Water quality Well Depth
April Chloride and specific conductance Major ionsNo (ft)
Monthly and April September September
September
10S1W-27J1 238 X 11S1W-9M2 110 X X X 11S1W-10C1 350 X X X 11S1W-11L1 628 X X x 11S1W-11L2 650 X X x 11S1W-11L3 150 X X X 11S1W-11N1 398 X X x 11S1W-11R1 220 X X X 11S1W-12K1 1020 X X x 11S1W-131 700-800 X X X 11S1W-13G1 330 X X x 11S1W-14A2 194 X X x 11S1W-151 700-800 X X x 11S1W-15A1 168 X X x 11S1W-15L1 211 X X x 11S1W-15L2 256 X X x 11S1W-16H1 101 X 11S1W-16Q1 98 X X X 11S1E-17F1 460 X X x 11S1E-18E1 214 X X x 11S1E-18F1 713 X X x 11S1E-191 700-800 X X X 11S1E-20E1 400 X X x 11S1E-20G1 495 X X x 11S1E-28D1 550 X X x 11S1E-28M1 184 X X X 11S1E-28R1 355 X X x 11S1E-28R2 290 X X x 11S1E-33J2 205 X X X
1Well to be drilled
Table 3 and figure 19 show the wells in the current observation network and the wells that could be used to expand the network for more effective monitoring Additional shallow wells that might monitor the depth interval now being intruded by seawater are 11S1W-9M2 11L3 11R1 14A2 15A1 and 16Q1 and 11S1E-28M1 and 33J2 Observations made at these wells would be most effective if made twice yearly in April when ground-water storage is highest and in September when ground-water storage is lowest Water-level measurements will show the status of ground-water storage and determination of chloride concentration and specific conductance in water samples will show changes in water quality The 15 district supply wells would also be most effectively monitored in April and September The April samples need only be analyzed for chloride and the specific conductance determined Complete chemical analyses of the September samples would be needed Water-level measurements are currently being taken at district supply wells at monthly intervals The addition of April and September water-level data from well 10S1W-27J1 would help to monitor changes in ground-water storage in the Purisima Formation in the central part of the Soquel-Aptos area
12T 00 R1 W R1 E 121deg5230
co
29 bdquo Amdash I
EXPLANATION
Soquel Creek County Water Districtbull supply-well observation network
4) Well monitored by California Depart- T10 S ment of Water Resources T11 S
3 Shallow well to be added to observation network
37-00bull Deep well to be added to observation network
bull Well to be drilled
VIt
2IO
3IIV
3 ` N
ois
nu
m u
nvm
vas
tilrrrtn Craz Harbor
(1AS -r CL AkL) -eES
Point Santa Cruz
Base from U S Geological Survey San Francisco Bay Region sheet 3 1125000 1970
apitola TAlE BF A-
uurpf ()SH(1
Rio Del Mar op Opal Cliffs au
Soquel Point
MONTEREY BAY 365615
La Selva Beach
4
0 1 2 3 MILES
CONTOUR INTERVAL 200 FEET NATIONAL GEODETIC VERTICAL DATUM OF 1929
Three new wells 700-800 ft deep and adjacent to the coast one in SWk sec 13 T 11 S R 1 W one in SEA sec 15 T 11 S R 1 W and one in SWk sec 19 T 11 S R 1 E could monitor the lower part of the Purisima Formation Data from these wells might be used to detect the advancing sea-water front at depth before it reaches the Soquel Creek County Water District wells
CONCLUSIONS
Ground-water pumpage from the Purisima Formation a confined aquifer has averaged about 5400 acre-ftyr since 1970--1000 acre-ftyr more than its potential yield of 4400 acre-ftyr This pumping has caused a decrease in freshwater head and water levels in wells along the coast have declined to below sea level Prior to the 1970s the head was sufficient to produce a seaward gradient and freshwater was discharged into the ocean at the outcrop of the aquifer maintaining the freshwater-seawater interface an unknown but probably considerable distance offshore Since the early 1970s the reduction of head has reversed the ground-water gradient in the aquifer and has brought about conditions that are favorable for migration of seawater landward Seawater intrusion has resulted and has progressed in the interval 0-100 ft below sea level to the vicinity of Capitola Intrusion has been detected in this shallow interval first probably because it crops out near shore on the floor of Monterey Bay and seawater had only a short distance to travel to reach shallow wells
It is unknown how long it will take seawater to intrude the inland parts of the deeper zones if indeed it ever does It will depend on how carefully pumpage with its effect on freshwater head is managed As the freshwater head is reduced seawater will move landward and a new freshwater-saltwater interface will be established If the interface reaches deep wells then saltwater will be pumped Conversely if the freshwater head is increased the interface will move seaward and the threat of seawater intrusion will be eliminated
Ground-water pumpage from the Aromas Sand in the vicinity of La Selva Beach (fig 14) has been near its potential yield--about 1500 acre-ftyr--since the early 1970s No changes in the quantity of ground water in storage or in water quality have been observed
An observation-well network could be established to monitor status of ground-water storage and water quality
REFERENCES CITED
Hickey J J 1968 Hydrogeologic study of the Soquel-Aptos area Santa Cruz County California US Geological Survey open-file report 48 p
Todd D K 1964 Ground water hydrology New York John Wiley 336 p
bull bull
bull bull
bull r
4 A
bull -
obdquo rtt
s bull bull
bulllsquo44
bull
mdashbull
t s
s O
t
4 lsquo-zii bullIc
44
-t- ---bull
f4 4
ibdquobull
-4
bull
- bullbull
t --bdquo
-r4
2-
bullbullbull
x bull k
4
$
bull bull
1
a
bull bull 70bull
It bullbullbull
raf 1 i
oo
- bull 4 bull
sis
bull
x bull
bdquo
s
sY
bull
1 il
rik
- tr
-bull bull
bull
1-
t
bull
os
4
to7 1
I
r bull
-~4 44
aorss i
bull Ns4
bull bullsio
mdashso
bull o
bull -4
hi
Ot i
bull
USGS LIBRARY - RESTON
Muir--SEAWATER INTRUSION SOQUEL-APTOS AREA SANTA CRUZ COUNTY CALIFORNIA--WRI 80-84
0CO
COOOOOC
O
Page 1
Page 2
Page 3
Page 4
Page 5
Page 6
Page 7
Page 8
Page 9
Page 10
Page 11
Page 12
Page 13
Page 14
Page 15
Page 16
Page 17
Page 18
Page 19
Page 20
Page 21
Page 22
Page 23
Page 24
Page 25
Page 26
Page 27
Page 28
Page 29
Page 30
Page 31
Page 32
Page 33
Page 34
Page 35
Page 36
Page 37
Page 38
Page 39
Page 40
12 SEAWATER INTRUSION SOQUEL-APTOS AREA CALIFORNIA A
LT
ITU
DE
OF
WA
TE
R L
EV
EL
IN
FE
ET
C
HL
OR
IDE
IN
MIL
LIG
RA
MS
PE
R L
ITE
R
Well 11S1W-13G1 Depth 330 feet perforations 200-330 feet Land-surface altitude 130 feet Data from Soquel Creek County Water District
DISTANCE IN MILES FROM SHORELINE VERTICAL EXAGGERATION X 26
EXPLANATION
BAY MUD APPROXIMATE LIMIT OF SEAWATER INTRUSION
O 0 GRAVEL AND SAND (Terrace deposits) ARROW INDICATES DIRECTION OF FLOW
bull SAND SILT AND CLAY (Purisirna Formation) MEM+ Seawater
bull bull bull
bull bull bull CONSOLIDATED ROCK (Igneous rocks) Freshwater
NO
ISIP
1IN
IH
ILVM
VH
S
FIGURE 9mdashGeneralized geologic section showing zones intruded by seawater (see fig 2 for location of section) Ln
16 SEAWATER INTRUSION SOQUEL-APTOS AREA CALIFORNIA
Methods for Controlling Seawater Intrusion
The following discussion of methods for controlling seawater intrusion is intended only as general background on the subject Schematic diagrams are included to illustrate principles (figs 10-13)
Seawater intrusion might be controlled by one or more of the following actions (1) Reduce ground-water pumping in the coastal area (2) artifi-cially recharge the aquifers (3) modify the pumping pattern (4) maintain a pressure ridge of fresh ground water above sea level in the intruded aquifers along the coast or (5) establish a pumping trough in the seawater adjacent to the coastline The first four methods control the intrusion by maintaining the inland potentiometric surface above sea level The fifth removes the seawater before it can migrate inland
Pumping could be reduced by changing to crops requiring less water by having only one harvest per year or by taking some lands out of production Pumping in coastal areas could be reduced by importing supplemental water Artificial recharge could be implemented by using either this supplemental water or reclaimed wastewater
Changing the pumping pattern would help to keep intrusion from advancing inland Pumping wells near the coast causes seawater intrusion because seawater moves inland when the potentiometric surface seaward of the pumping wells is below sea level (fig 10) If the wells adjacent to the coast were abandoned and the pumping centers were shifted farther inland the potentio-metric surface would be above sea level and the pressure gradient would be toward the ocean (fig 11) Careful regulation of the pumpage would be necessary to prevent a return to the conditions shown in figure 10
A pumping trough parallel to the coast could be developed to control seawater intrusion A line of pumping wells along the coast stabilizes the seawater wedge near the trough if the amount of water pumped is carefully regulated (fig 12) The disadvantage of this method is that it wastes a large amount of freshwater
A ground-water pressure ridge parallel to the coast controls seawater intrusion by keeping the potentiometric surface above sea level and maintain-ing the seaward flow of fresh ground water (fig 13) This method requires a line of recharge wells along the coast and a supplemental water supply to create the freshwater barrier unless some pumpage from the aquifer inland is used for recharge
Many factors must be considered in developing plans far controlling seawater intrusion These factors include capital outlay and recurring costs of the required physical works (for example wells pumps distribution lines and treatment facilities) legal aspects (for example water rights and rights of way) availability and cost of supplemental water physical aspects of the aquifer system and overlying soils and the chemistry of the different kinds of water in the system
17 SEAWATER INTRUS ION
Bra
ckis
h w
ate
r
LAND SURFACPumping wells POTENTIOMETRIC SURFACE
SEA LEVEL
onfming be
Perforated interval
AQUIFER SEAWATER WEDGE
Fresh ground water
ARROWSmdashIndicate direction of water flow
FIGURE 10mdashSchematic section at coast showing influence of coastal pumping on seawater intrusion
POTENTIOMETRIC SURFACE A Pumping
wells
SEA LEVEL
SEAWATER WEDGE
ARROWS mdashIndicate direction of water flow
FIGURE 11mdashSchematic section at coast showing influence of inland pumping on seawater intrusion
18 SEAWATER INTRUSION SOQUELmdashAPTOS AREA CALIFORNIA
Fres
hwat
er
POTENTIOMETRIC SURFACE A Pumping well
Line of pumping wells
LAND SURFACESEA LEVEL
-4mdash7mdash AQUIFER ----411- _AmdashN
SEAWATER WEDGE Fresh ground water _
Stable seawater wedgeARROWS-Indicate direction of water flow
FIGURE 12-Schematic section at coast showing effects of a pumping trough on seawater intrusion
Fre
shw
ater
POTENTIOMETRIC SURFACE Pumping well
LAND SURFACELine of recharging wells
SEA LEVEL
SEAWATER WEDGE
ARROWS-Indicate direction of water flow
FIGURE 13mdashSchematic section at coast showing effects of a pressure ridge on seawater intrusion
19 SEAWATER INTRUSION SOQUEL-APTOS AREA CALIFORNIA
POTENTIAL AQUIFER YIELD
In this report the potential aquifer yield in the Soquel-Aptos area is defined as the long-term average inflow to the ground-water reservoir minus unrecoverable water lost to evapotranspiration and the quantity of underflow to the ocean necessary to maintain a barrier against seawater intrusion
The Soquel Creek County Water District and city of Santa Cruz Water Department pump water from the Purisima Formation which is the main aquifer in the area The Soquel Creek County Water District also pumps from the Aromas Sand located in the vicinity of La Selva Beach (fig 14) A separate potential yield value was determined for each of the aquifers
The techniques used to estimate potential ground-water yield for this report have been used by many investigators (see Todd 1964 p 206-208) Those used to determine the yield for the Purisima Formation and Aromas Sand although not specifying an item-by-item evaluation of inflow and outflow are based on the general equation of hydrologic equilibrium
Surface inflow Surface outflow + Subsurface inflow + Subsurface outflow + Precipitation = + Consumptive use + Imported water + Exported water + Decrease in surface storage + Increase in surface storage + Decrease in ground-water storage + Increase in ground-water storage
Purisima Formation
The potential yield of the Purisima Formation is shown by the relation between average annual pumpage and the corresponding average annual net change of ground water in storage for a base period in which climatic conditions approximate the long-term average For simplicity the base period spring 1962 to spring 1975 was selected because ground-water storage was the same at the end of the period as it was at the beginning Therefore average inflow was equal to average outflow and potential yield was equal to the average pump-age The hydrograph for well 11S1W-10C1 has water-level fluctuations con-sidered representative of those in the Purisima Formation and was used to make the estimates of potential yield (fig 15)
On the cumulative departure curve (fig 16) a line joining the beginning and end of the period 1962-1975 would be nearly horizontal indicating that the average rainfall for that period was close to the long-term average In fact rainfall was 98 percent of the 100-year average To be representative climatically a base period should include a wet period and a dry period The base period spring 1962 to spring 1975 includes parts of two dry periods and a complete wet period It is important also to select a period that does not begin after or end with an extremely wet year because of the water-in-transit problem It may take a year or more for the water levels to fully reflect recharge from a wet year Figure 16 indicates that neither the 1960-61 or 1974-75 rainfall years were wet years
20 SEAWATER INTRUSION SOQUEL-APTOS AREA CALIFORNIA
122deg00 5230 121deg45 37deg0730
37deg00
Sibnr Cr
La Selva Beach
I 0 A 7 4
R
0 1 2 3 4 5 MILESI I I
Base from U S Geological Survey San Francisco Bay Region sheet 3 1125000 1970
EXPLANATION
PURISIMA FORMATION
AROMAS SAND Ammorilormarmmomm
FAULT mdash Approximately located
FIGURE I4mdashAreas for which potential aquifer yield was determined
21 POTENTIAL AQUIFER YIELD
AL
TIT
UD
EO
F W
AT
ER
LE
VE
L I
N F
EE
T
Well 11S1W-10C1 Depth 350 feet perforations unknown Land-surface altitude 90 feet Data from California Department of Water Resources
FIGURE 15mdashFluctuation of water level in well 1151 W-10C1
The 1962-75 period fits the required criteria for a valid base period Therefore the potential ground-water yield of the Purisima Formation in the Soquel-Aptos area based on 1962-75 conditions and on average annual pumpage (4400 acre-ft) as determined from table 1 is about 4400 acre-ftyr
The estimated yield value was checked by plotting the annual average change in ground-water levels in all wells measured against annual pumpage (fig 17) If inflow to the aquifer is reasonably constant the points can be fitted to a straight line and pumpage corresponding to zero change in water level equals the potential yield The zero change in water level in figure 17 is at a point corresponding to 4100 acre-ft a quantity which agrees reasonably well with the yield figure determined in the previous paragraph
PR
EC
IPIT
AT
ION
IN
IN
CH
ES
C
UM
UL
AT
IVE
DE
PA
RT
UR
E O
F P
RE
CIP
ITA
TIO
N IN
IN
CH
ES
n
) CJ
it
(
71
6)
Ja
eJ
43
N3
C1
0
8 0
0
0
0
0
0
0
0
8 8
0
0
I I
I 1
I 1
I
FIGU RE 16 -1956-77 Santa Cruzprecipatationand cumulative departurecurve
1 OC 3N1 111--IAinr 1IV3A 011V141 110
1956
-57
1957
-58
1958
-59
1959
-60
1960
-61
1961
-62
1962
-63
1963
-64
1964
-65
1965
-66
1966
-67
1967
-68
1968
-69
1969
-70
1970
-71
1971
-72
1972
-73
1973
-74
1974
-75
1975
-76
D 33 m II
1976
-77
1977
-78
I
VINTIIWD yaw samv-ianOos Noisnalsi aummvas
ZZ
AV
ER
AG
E A
NN
UA
L C
HA
NG
E IN
GR
OU
ND
- WA
TE
R L
EV
EL
IN
FE
ET
mu
uaai
rew avimagm
14
12
10
1964 0
491969 01970 1974
o
1962 euro
01)1963 euro01967 1965 01966 1973
611968 6)1971
1972e-4 mdash
POTENTIAL YIELD --- -6 --
-10
-12 3000
I 4000
I 5000
I 6000
ANNUAL PUMPAGE IN ACRE-FEET
FIGURE 17mdashAnnual pumpage versus average annual change in ground-water level
24 SEAWATER INTRUSION SOQUEL-APTOS AREA CALIFORNIA
TABLE 1 - Pumpage in acre-feet from Purisima Formation 1962-74
CentralSoquel Miscel-
City Santa Miscel-Creek laneous
Agri- of Indus- Cruz laneousCounty water
Year cul- Santa trial3 County domestic TotalWater pur-
Metered 2Agriculture pumpage was computed from total electrical energy used for
pumping water and the electrical energy required to pump a unit volume of water 3Estimated
Aromas Sand
The potential yield of the Aromas Sand was estimated by comparing the average annual pumpage with the corresponding average annual net change of ground water in storage The estimate does not have the same degree of accu-racy as that determined for the Purisima Formation because long-term water-level fluctuations are available only for the coastal part of the aquifer and not for the large part of the recharge area several miles inland The hydro-graphs of wells 11S1E-28D1 and 11S1E-28R2 (fig 18) indicate that ground-water storage in 1977 was about the same as in 1966 Therefore average
25 POTENTIAL AQUIFER YIELD
AL
TIT
UD
E O
F W
AT
ER
LE
VE
L I
NF
EE
T
Well 11S1E-28R2 Depth 290 feet perforations 250-290 feet Land-surface altitude 150 feet Well 11S1E-28D1 Depth 550 feet perforations 310-550 feet Land-surface altitude 120 feet Data from Soquel Creek County Water District
FIGURE 18mdashFluctuation of water level in wells 11S1E-28D1 and 28R2
inflow for the 1966-77 period was equal to average outflow and ground-water yield is equal to average annual pumpage The period includes a wet cycle (fig 16) and 3 years of a dry cycle including the drought years 1975-76 and 1976-77 Neither the 1964-65 nor the 1976-77 rainfall year was extremely wet so there is no water-in-transit problem with the base period Average rainfall for the 1966-77 base period was 2946 inches about 94 percent of the 100-year average This means that inflow to the ground-water reservoir for the 1966-77 period was slightly less than the long-term average and an esti-mate of ground-water yield based on average annual pumpage for this period is probably conservative The ground-water yield of the Aromas Sand in the Soquel-Aptos area based on 1966-76 conditions and on average pumpage as determined from table 2 is about 1500 acre-ftyr
26 SEAWATER INTRUSION SOQUEL-APTOS AREA CALIFORNIA
TABLE 2 - Pumpage in acre-feet from Aromas Sand 1966-77
Metered 2Agriculture pumpage was computed from total electricalenergy used for
pumping water and the electrical energy required to pump a unit volume of water 3Estimated
OBSERVATION-WELL NETWORK
The objective of an observation-well network in the Soquel-Aptos area is to function as an early warning system to alert those responsible for managing and protecting the ground-water resources of the area from adverse changes Water-level measurements in wells are necessary to indicate the effects of pumping on the ground-water system and the status of ground-water storage Ground-water sample analyses are needed to monitor seawater intrusion and other water-quality changes
At the present time the Soquel Creek County Water District makes monthly pumping and nonpumping water-level measurements in 15 supply wells The same wells are sampled every autumn and analyzed for major-ion concentration including total alkalinity (as CaCO3) bicarbonate boron calcium chloride specific conductance dissolved solids fluoride iron magnesium potassium silica sodium sulfate and nitrate plus nitrite as nitrogen The California Department of Water Resources measures water levels in wells 11S1W-10C1 and 15E2 (USGS 16H1) at monthly intervals
27 OBSERVATION-WELL NETWORK
TABLE 3 - Potential observation-well network
Type of data and frequency of collection
Water level Water quality Well Depth
April Chloride and specific conductance Major ionsNo (ft)
Monthly and April September September
September
10S1W-27J1 238 X 11S1W-9M2 110 X X X 11S1W-10C1 350 X X X 11S1W-11L1 628 X X x 11S1W-11L2 650 X X x 11S1W-11L3 150 X X X 11S1W-11N1 398 X X x 11S1W-11R1 220 X X X 11S1W-12K1 1020 X X x 11S1W-131 700-800 X X X 11S1W-13G1 330 X X x 11S1W-14A2 194 X X x 11S1W-151 700-800 X X x 11S1W-15A1 168 X X x 11S1W-15L1 211 X X x 11S1W-15L2 256 X X x 11S1W-16H1 101 X 11S1W-16Q1 98 X X X 11S1E-17F1 460 X X x 11S1E-18E1 214 X X x 11S1E-18F1 713 X X x 11S1E-191 700-800 X X X 11S1E-20E1 400 X X x 11S1E-20G1 495 X X x 11S1E-28D1 550 X X x 11S1E-28M1 184 X X X 11S1E-28R1 355 X X x 11S1E-28R2 290 X X x 11S1E-33J2 205 X X X
1Well to be drilled
Table 3 and figure 19 show the wells in the current observation network and the wells that could be used to expand the network for more effective monitoring Additional shallow wells that might monitor the depth interval now being intruded by seawater are 11S1W-9M2 11L3 11R1 14A2 15A1 and 16Q1 and 11S1E-28M1 and 33J2 Observations made at these wells would be most effective if made twice yearly in April when ground-water storage is highest and in September when ground-water storage is lowest Water-level measurements will show the status of ground-water storage and determination of chloride concentration and specific conductance in water samples will show changes in water quality The 15 district supply wells would also be most effectively monitored in April and September The April samples need only be analyzed for chloride and the specific conductance determined Complete chemical analyses of the September samples would be needed Water-level measurements are currently being taken at district supply wells at monthly intervals The addition of April and September water-level data from well 10S1W-27J1 would help to monitor changes in ground-water storage in the Purisima Formation in the central part of the Soquel-Aptos area
12T 00 R1 W R1 E 121deg5230
co
29 bdquo Amdash I
EXPLANATION
Soquel Creek County Water Districtbull supply-well observation network
4) Well monitored by California Depart- T10 S ment of Water Resources T11 S
3 Shallow well to be added to observation network
37-00bull Deep well to be added to observation network
bull Well to be drilled
VIt
2IO
3IIV
3 ` N
ois
nu
m u
nvm
vas
tilrrrtn Craz Harbor
(1AS -r CL AkL) -eES
Point Santa Cruz
Base from U S Geological Survey San Francisco Bay Region sheet 3 1125000 1970
apitola TAlE BF A-
uurpf ()SH(1
Rio Del Mar op Opal Cliffs au
Soquel Point
MONTEREY BAY 365615
La Selva Beach
4
0 1 2 3 MILES
CONTOUR INTERVAL 200 FEET NATIONAL GEODETIC VERTICAL DATUM OF 1929
Three new wells 700-800 ft deep and adjacent to the coast one in SWk sec 13 T 11 S R 1 W one in SEA sec 15 T 11 S R 1 W and one in SWk sec 19 T 11 S R 1 E could monitor the lower part of the Purisima Formation Data from these wells might be used to detect the advancing sea-water front at depth before it reaches the Soquel Creek County Water District wells
CONCLUSIONS
Ground-water pumpage from the Purisima Formation a confined aquifer has averaged about 5400 acre-ftyr since 1970--1000 acre-ftyr more than its potential yield of 4400 acre-ftyr This pumping has caused a decrease in freshwater head and water levels in wells along the coast have declined to below sea level Prior to the 1970s the head was sufficient to produce a seaward gradient and freshwater was discharged into the ocean at the outcrop of the aquifer maintaining the freshwater-seawater interface an unknown but probably considerable distance offshore Since the early 1970s the reduction of head has reversed the ground-water gradient in the aquifer and has brought about conditions that are favorable for migration of seawater landward Seawater intrusion has resulted and has progressed in the interval 0-100 ft below sea level to the vicinity of Capitola Intrusion has been detected in this shallow interval first probably because it crops out near shore on the floor of Monterey Bay and seawater had only a short distance to travel to reach shallow wells
It is unknown how long it will take seawater to intrude the inland parts of the deeper zones if indeed it ever does It will depend on how carefully pumpage with its effect on freshwater head is managed As the freshwater head is reduced seawater will move landward and a new freshwater-saltwater interface will be established If the interface reaches deep wells then saltwater will be pumped Conversely if the freshwater head is increased the interface will move seaward and the threat of seawater intrusion will be eliminated
Ground-water pumpage from the Aromas Sand in the vicinity of La Selva Beach (fig 14) has been near its potential yield--about 1500 acre-ftyr--since the early 1970s No changes in the quantity of ground water in storage or in water quality have been observed
An observation-well network could be established to monitor status of ground-water storage and water quality
REFERENCES CITED
Hickey J J 1968 Hydrogeologic study of the Soquel-Aptos area Santa Cruz County California US Geological Survey open-file report 48 p
Todd D K 1964 Ground water hydrology New York John Wiley 336 p
bull bull
bull bull
bull r
4 A
bull -
obdquo rtt
s bull bull
bulllsquo44
bull
mdashbull
t s
s O
t
4 lsquo-zii bullIc
44
-t- ---bull
f4 4
ibdquobull
-4
bull
- bullbull
t --bdquo
-r4
2-
bullbullbull
x bull k
4
$
bull bull
1
a
bull bull 70bull
It bullbullbull
raf 1 i
oo
- bull 4 bull
sis
bull
x bull
bdquo
s
sY
bull
1 il
rik
- tr
-bull bull
bull
1-
t
bull
os
4
to7 1
I
r bull
-~4 44
aorss i
bull Ns4
bull bullsio
mdashso
bull o
bull -4
hi
Ot i
bull
USGS LIBRARY - RESTON
Muir--SEAWATER INTRUSION SOQUEL-APTOS AREA SANTA CRUZ COUNTY CALIFORNIA--WRI 80-84
0CO
COOOOOC
O
Page 1
Page 2
Page 3
Page 4
Page 5
Page 6
Page 7
Page 8
Page 9
Page 10
Page 11
Page 12
Page 13
Page 14
Page 15
Page 16
Page 17
Page 18
Page 19
Page 20
Page 21
Page 22
Page 23
Page 24
Page 25
Page 26
Page 27
Page 28
Page 29
Page 30
Page 31
Page 32
Page 33
Page 34
Page 35
Page 36
Page 37
Page 38
Page 39
Page 40
14 SEAWATER INTRUSION SOQUEL-APTOS AREA CALIFORNIA
AL
TIT
UD
E O
F W
AT
ER
LE
VE
L
IN F
EE
T
CH
LO
RID
E I
N M
ILL
IGR
AM
S P
ER
LIT
ER
Well 11S1E-20E1 Depth 400 feet perforations 194-394 feet Land-surface altitude 60 feet Data from Soquel Creek County Water District
DISTANCE IN MILES FROM SHORELINE VERTICAL EXAGGERATION X 26
EXPLANATION
BAY MUD APPROXIMATE LIMIT OF SEAWATER INTRUSION
O 0 GRAVEL AND SAND (Terrace deposits) ARROW INDICATES DIRECTION OF FLOW
bull SAND SILT AND CLAY (Purisirna Formation) MEM+ Seawater
bull bull bull
bull bull bull CONSOLIDATED ROCK (Igneous rocks) Freshwater
NO
ISIP
1IN
IH
ILVM
VH
S
FIGURE 9mdashGeneralized geologic section showing zones intruded by seawater (see fig 2 for location of section) Ln
16 SEAWATER INTRUSION SOQUEL-APTOS AREA CALIFORNIA
Methods for Controlling Seawater Intrusion
The following discussion of methods for controlling seawater intrusion is intended only as general background on the subject Schematic diagrams are included to illustrate principles (figs 10-13)
Seawater intrusion might be controlled by one or more of the following actions (1) Reduce ground-water pumping in the coastal area (2) artifi-cially recharge the aquifers (3) modify the pumping pattern (4) maintain a pressure ridge of fresh ground water above sea level in the intruded aquifers along the coast or (5) establish a pumping trough in the seawater adjacent to the coastline The first four methods control the intrusion by maintaining the inland potentiometric surface above sea level The fifth removes the seawater before it can migrate inland
Pumping could be reduced by changing to crops requiring less water by having only one harvest per year or by taking some lands out of production Pumping in coastal areas could be reduced by importing supplemental water Artificial recharge could be implemented by using either this supplemental water or reclaimed wastewater
Changing the pumping pattern would help to keep intrusion from advancing inland Pumping wells near the coast causes seawater intrusion because seawater moves inland when the potentiometric surface seaward of the pumping wells is below sea level (fig 10) If the wells adjacent to the coast were abandoned and the pumping centers were shifted farther inland the potentio-metric surface would be above sea level and the pressure gradient would be toward the ocean (fig 11) Careful regulation of the pumpage would be necessary to prevent a return to the conditions shown in figure 10
A pumping trough parallel to the coast could be developed to control seawater intrusion A line of pumping wells along the coast stabilizes the seawater wedge near the trough if the amount of water pumped is carefully regulated (fig 12) The disadvantage of this method is that it wastes a large amount of freshwater
A ground-water pressure ridge parallel to the coast controls seawater intrusion by keeping the potentiometric surface above sea level and maintain-ing the seaward flow of fresh ground water (fig 13) This method requires a line of recharge wells along the coast and a supplemental water supply to create the freshwater barrier unless some pumpage from the aquifer inland is used for recharge
Many factors must be considered in developing plans far controlling seawater intrusion These factors include capital outlay and recurring costs of the required physical works (for example wells pumps distribution lines and treatment facilities) legal aspects (for example water rights and rights of way) availability and cost of supplemental water physical aspects of the aquifer system and overlying soils and the chemistry of the different kinds of water in the system
17 SEAWATER INTRUS ION
Bra
ckis
h w
ate
r
LAND SURFACPumping wells POTENTIOMETRIC SURFACE
SEA LEVEL
onfming be
Perforated interval
AQUIFER SEAWATER WEDGE
Fresh ground water
ARROWSmdashIndicate direction of water flow
FIGURE 10mdashSchematic section at coast showing influence of coastal pumping on seawater intrusion
POTENTIOMETRIC SURFACE A Pumping
wells
SEA LEVEL
SEAWATER WEDGE
ARROWS mdashIndicate direction of water flow
FIGURE 11mdashSchematic section at coast showing influence of inland pumping on seawater intrusion
18 SEAWATER INTRUSION SOQUELmdashAPTOS AREA CALIFORNIA
Fres
hwat
er
POTENTIOMETRIC SURFACE A Pumping well
Line of pumping wells
LAND SURFACESEA LEVEL
-4mdash7mdash AQUIFER ----411- _AmdashN
SEAWATER WEDGE Fresh ground water _
Stable seawater wedgeARROWS-Indicate direction of water flow
FIGURE 12-Schematic section at coast showing effects of a pumping trough on seawater intrusion
Fre
shw
ater
POTENTIOMETRIC SURFACE Pumping well
LAND SURFACELine of recharging wells
SEA LEVEL
SEAWATER WEDGE
ARROWS-Indicate direction of water flow
FIGURE 13mdashSchematic section at coast showing effects of a pressure ridge on seawater intrusion
19 SEAWATER INTRUSION SOQUEL-APTOS AREA CALIFORNIA
POTENTIAL AQUIFER YIELD
In this report the potential aquifer yield in the Soquel-Aptos area is defined as the long-term average inflow to the ground-water reservoir minus unrecoverable water lost to evapotranspiration and the quantity of underflow to the ocean necessary to maintain a barrier against seawater intrusion
The Soquel Creek County Water District and city of Santa Cruz Water Department pump water from the Purisima Formation which is the main aquifer in the area The Soquel Creek County Water District also pumps from the Aromas Sand located in the vicinity of La Selva Beach (fig 14) A separate potential yield value was determined for each of the aquifers
The techniques used to estimate potential ground-water yield for this report have been used by many investigators (see Todd 1964 p 206-208) Those used to determine the yield for the Purisima Formation and Aromas Sand although not specifying an item-by-item evaluation of inflow and outflow are based on the general equation of hydrologic equilibrium
Surface inflow Surface outflow + Subsurface inflow + Subsurface outflow + Precipitation = + Consumptive use + Imported water + Exported water + Decrease in surface storage + Increase in surface storage + Decrease in ground-water storage + Increase in ground-water storage
Purisima Formation
The potential yield of the Purisima Formation is shown by the relation between average annual pumpage and the corresponding average annual net change of ground water in storage for a base period in which climatic conditions approximate the long-term average For simplicity the base period spring 1962 to spring 1975 was selected because ground-water storage was the same at the end of the period as it was at the beginning Therefore average inflow was equal to average outflow and potential yield was equal to the average pump-age The hydrograph for well 11S1W-10C1 has water-level fluctuations con-sidered representative of those in the Purisima Formation and was used to make the estimates of potential yield (fig 15)
On the cumulative departure curve (fig 16) a line joining the beginning and end of the period 1962-1975 would be nearly horizontal indicating that the average rainfall for that period was close to the long-term average In fact rainfall was 98 percent of the 100-year average To be representative climatically a base period should include a wet period and a dry period The base period spring 1962 to spring 1975 includes parts of two dry periods and a complete wet period It is important also to select a period that does not begin after or end with an extremely wet year because of the water-in-transit problem It may take a year or more for the water levels to fully reflect recharge from a wet year Figure 16 indicates that neither the 1960-61 or 1974-75 rainfall years were wet years
20 SEAWATER INTRUSION SOQUEL-APTOS AREA CALIFORNIA
122deg00 5230 121deg45 37deg0730
37deg00
Sibnr Cr
La Selva Beach
I 0 A 7 4
R
0 1 2 3 4 5 MILESI I I
Base from U S Geological Survey San Francisco Bay Region sheet 3 1125000 1970
EXPLANATION
PURISIMA FORMATION
AROMAS SAND Ammorilormarmmomm
FAULT mdash Approximately located
FIGURE I4mdashAreas for which potential aquifer yield was determined
21 POTENTIAL AQUIFER YIELD
AL
TIT
UD
EO
F W
AT
ER
LE
VE
L I
N F
EE
T
Well 11S1W-10C1 Depth 350 feet perforations unknown Land-surface altitude 90 feet Data from California Department of Water Resources
FIGURE 15mdashFluctuation of water level in well 1151 W-10C1
The 1962-75 period fits the required criteria for a valid base period Therefore the potential ground-water yield of the Purisima Formation in the Soquel-Aptos area based on 1962-75 conditions and on average annual pumpage (4400 acre-ft) as determined from table 1 is about 4400 acre-ftyr
The estimated yield value was checked by plotting the annual average change in ground-water levels in all wells measured against annual pumpage (fig 17) If inflow to the aquifer is reasonably constant the points can be fitted to a straight line and pumpage corresponding to zero change in water level equals the potential yield The zero change in water level in figure 17 is at a point corresponding to 4100 acre-ft a quantity which agrees reasonably well with the yield figure determined in the previous paragraph
PR
EC
IPIT
AT
ION
IN
IN
CH
ES
C
UM
UL
AT
IVE
DE
PA
RT
UR
E O
F P
RE
CIP
ITA
TIO
N IN
IN
CH
ES
n
) CJ
it
(
71
6)
Ja
eJ
43
N3
C1
0
8 0
0
0
0
0
0
0
0
8 8
0
0
I I
I 1
I 1
I
FIGU RE 16 -1956-77 Santa Cruzprecipatationand cumulative departurecurve
1 OC 3N1 111--IAinr 1IV3A 011V141 110
1956
-57
1957
-58
1958
-59
1959
-60
1960
-61
1961
-62
1962
-63
1963
-64
1964
-65
1965
-66
1966
-67
1967
-68
1968
-69
1969
-70
1970
-71
1971
-72
1972
-73
1973
-74
1974
-75
1975
-76
D 33 m II
1976
-77
1977
-78
I
VINTIIWD yaw samv-ianOos Noisnalsi aummvas
ZZ
AV
ER
AG
E A
NN
UA
L C
HA
NG
E IN
GR
OU
ND
- WA
TE
R L
EV
EL
IN
FE
ET
mu
uaai
rew avimagm
14
12
10
1964 0
491969 01970 1974
o
1962 euro
01)1963 euro01967 1965 01966 1973
611968 6)1971
1972e-4 mdash
POTENTIAL YIELD --- -6 --
-10
-12 3000
I 4000
I 5000
I 6000
ANNUAL PUMPAGE IN ACRE-FEET
FIGURE 17mdashAnnual pumpage versus average annual change in ground-water level
24 SEAWATER INTRUSION SOQUEL-APTOS AREA CALIFORNIA
TABLE 1 - Pumpage in acre-feet from Purisima Formation 1962-74
CentralSoquel Miscel-
City Santa Miscel-Creek laneous
Agri- of Indus- Cruz laneousCounty water
Year cul- Santa trial3 County domestic TotalWater pur-
Metered 2Agriculture pumpage was computed from total electrical energy used for
pumping water and the electrical energy required to pump a unit volume of water 3Estimated
Aromas Sand
The potential yield of the Aromas Sand was estimated by comparing the average annual pumpage with the corresponding average annual net change of ground water in storage The estimate does not have the same degree of accu-racy as that determined for the Purisima Formation because long-term water-level fluctuations are available only for the coastal part of the aquifer and not for the large part of the recharge area several miles inland The hydro-graphs of wells 11S1E-28D1 and 11S1E-28R2 (fig 18) indicate that ground-water storage in 1977 was about the same as in 1966 Therefore average
25 POTENTIAL AQUIFER YIELD
AL
TIT
UD
E O
F W
AT
ER
LE
VE
L I
NF
EE
T
Well 11S1E-28R2 Depth 290 feet perforations 250-290 feet Land-surface altitude 150 feet Well 11S1E-28D1 Depth 550 feet perforations 310-550 feet Land-surface altitude 120 feet Data from Soquel Creek County Water District
FIGURE 18mdashFluctuation of water level in wells 11S1E-28D1 and 28R2
inflow for the 1966-77 period was equal to average outflow and ground-water yield is equal to average annual pumpage The period includes a wet cycle (fig 16) and 3 years of a dry cycle including the drought years 1975-76 and 1976-77 Neither the 1964-65 nor the 1976-77 rainfall year was extremely wet so there is no water-in-transit problem with the base period Average rainfall for the 1966-77 base period was 2946 inches about 94 percent of the 100-year average This means that inflow to the ground-water reservoir for the 1966-77 period was slightly less than the long-term average and an esti-mate of ground-water yield based on average annual pumpage for this period is probably conservative The ground-water yield of the Aromas Sand in the Soquel-Aptos area based on 1966-76 conditions and on average pumpage as determined from table 2 is about 1500 acre-ftyr
26 SEAWATER INTRUSION SOQUEL-APTOS AREA CALIFORNIA
TABLE 2 - Pumpage in acre-feet from Aromas Sand 1966-77
Metered 2Agriculture pumpage was computed from total electricalenergy used for
pumping water and the electrical energy required to pump a unit volume of water 3Estimated
OBSERVATION-WELL NETWORK
The objective of an observation-well network in the Soquel-Aptos area is to function as an early warning system to alert those responsible for managing and protecting the ground-water resources of the area from adverse changes Water-level measurements in wells are necessary to indicate the effects of pumping on the ground-water system and the status of ground-water storage Ground-water sample analyses are needed to monitor seawater intrusion and other water-quality changes
At the present time the Soquel Creek County Water District makes monthly pumping and nonpumping water-level measurements in 15 supply wells The same wells are sampled every autumn and analyzed for major-ion concentration including total alkalinity (as CaCO3) bicarbonate boron calcium chloride specific conductance dissolved solids fluoride iron magnesium potassium silica sodium sulfate and nitrate plus nitrite as nitrogen The California Department of Water Resources measures water levels in wells 11S1W-10C1 and 15E2 (USGS 16H1) at monthly intervals
27 OBSERVATION-WELL NETWORK
TABLE 3 - Potential observation-well network
Type of data and frequency of collection
Water level Water quality Well Depth
April Chloride and specific conductance Major ionsNo (ft)
Monthly and April September September
September
10S1W-27J1 238 X 11S1W-9M2 110 X X X 11S1W-10C1 350 X X X 11S1W-11L1 628 X X x 11S1W-11L2 650 X X x 11S1W-11L3 150 X X X 11S1W-11N1 398 X X x 11S1W-11R1 220 X X X 11S1W-12K1 1020 X X x 11S1W-131 700-800 X X X 11S1W-13G1 330 X X x 11S1W-14A2 194 X X x 11S1W-151 700-800 X X x 11S1W-15A1 168 X X x 11S1W-15L1 211 X X x 11S1W-15L2 256 X X x 11S1W-16H1 101 X 11S1W-16Q1 98 X X X 11S1E-17F1 460 X X x 11S1E-18E1 214 X X x 11S1E-18F1 713 X X x 11S1E-191 700-800 X X X 11S1E-20E1 400 X X x 11S1E-20G1 495 X X x 11S1E-28D1 550 X X x 11S1E-28M1 184 X X X 11S1E-28R1 355 X X x 11S1E-28R2 290 X X x 11S1E-33J2 205 X X X
1Well to be drilled
Table 3 and figure 19 show the wells in the current observation network and the wells that could be used to expand the network for more effective monitoring Additional shallow wells that might monitor the depth interval now being intruded by seawater are 11S1W-9M2 11L3 11R1 14A2 15A1 and 16Q1 and 11S1E-28M1 and 33J2 Observations made at these wells would be most effective if made twice yearly in April when ground-water storage is highest and in September when ground-water storage is lowest Water-level measurements will show the status of ground-water storage and determination of chloride concentration and specific conductance in water samples will show changes in water quality The 15 district supply wells would also be most effectively monitored in April and September The April samples need only be analyzed for chloride and the specific conductance determined Complete chemical analyses of the September samples would be needed Water-level measurements are currently being taken at district supply wells at monthly intervals The addition of April and September water-level data from well 10S1W-27J1 would help to monitor changes in ground-water storage in the Purisima Formation in the central part of the Soquel-Aptos area
12T 00 R1 W R1 E 121deg5230
co
29 bdquo Amdash I
EXPLANATION
Soquel Creek County Water Districtbull supply-well observation network
4) Well monitored by California Depart- T10 S ment of Water Resources T11 S
3 Shallow well to be added to observation network
37-00bull Deep well to be added to observation network
bull Well to be drilled
VIt
2IO
3IIV
3 ` N
ois
nu
m u
nvm
vas
tilrrrtn Craz Harbor
(1AS -r CL AkL) -eES
Point Santa Cruz
Base from U S Geological Survey San Francisco Bay Region sheet 3 1125000 1970
apitola TAlE BF A-
uurpf ()SH(1
Rio Del Mar op Opal Cliffs au
Soquel Point
MONTEREY BAY 365615
La Selva Beach
4
0 1 2 3 MILES
CONTOUR INTERVAL 200 FEET NATIONAL GEODETIC VERTICAL DATUM OF 1929
Three new wells 700-800 ft deep and adjacent to the coast one in SWk sec 13 T 11 S R 1 W one in SEA sec 15 T 11 S R 1 W and one in SWk sec 19 T 11 S R 1 E could monitor the lower part of the Purisima Formation Data from these wells might be used to detect the advancing sea-water front at depth before it reaches the Soquel Creek County Water District wells
CONCLUSIONS
Ground-water pumpage from the Purisima Formation a confined aquifer has averaged about 5400 acre-ftyr since 1970--1000 acre-ftyr more than its potential yield of 4400 acre-ftyr This pumping has caused a decrease in freshwater head and water levels in wells along the coast have declined to below sea level Prior to the 1970s the head was sufficient to produce a seaward gradient and freshwater was discharged into the ocean at the outcrop of the aquifer maintaining the freshwater-seawater interface an unknown but probably considerable distance offshore Since the early 1970s the reduction of head has reversed the ground-water gradient in the aquifer and has brought about conditions that are favorable for migration of seawater landward Seawater intrusion has resulted and has progressed in the interval 0-100 ft below sea level to the vicinity of Capitola Intrusion has been detected in this shallow interval first probably because it crops out near shore on the floor of Monterey Bay and seawater had only a short distance to travel to reach shallow wells
It is unknown how long it will take seawater to intrude the inland parts of the deeper zones if indeed it ever does It will depend on how carefully pumpage with its effect on freshwater head is managed As the freshwater head is reduced seawater will move landward and a new freshwater-saltwater interface will be established If the interface reaches deep wells then saltwater will be pumped Conversely if the freshwater head is increased the interface will move seaward and the threat of seawater intrusion will be eliminated
Ground-water pumpage from the Aromas Sand in the vicinity of La Selva Beach (fig 14) has been near its potential yield--about 1500 acre-ftyr--since the early 1970s No changes in the quantity of ground water in storage or in water quality have been observed
An observation-well network could be established to monitor status of ground-water storage and water quality
REFERENCES CITED
Hickey J J 1968 Hydrogeologic study of the Soquel-Aptos area Santa Cruz County California US Geological Survey open-file report 48 p
Todd D K 1964 Ground water hydrology New York John Wiley 336 p
bull bull
bull bull
bull r
4 A
bull -
obdquo rtt
s bull bull
bulllsquo44
bull
mdashbull
t s
s O
t
4 lsquo-zii bullIc
44
-t- ---bull
f4 4
ibdquobull
-4
bull
- bullbull
t --bdquo
-r4
2-
bullbullbull
x bull k
4
$
bull bull
1
a
bull bull 70bull
It bullbullbull
raf 1 i
oo
- bull 4 bull
sis
bull
x bull
bdquo
s
sY
bull
1 il
rik
- tr
-bull bull
bull
1-
t
bull
os
4
to7 1
I
r bull
-~4 44
aorss i
bull Ns4
bull bullsio
mdashso
bull o
bull -4
hi
Ot i
bull
USGS LIBRARY - RESTON
Muir--SEAWATER INTRUSION SOQUEL-APTOS AREA SANTA CRUZ COUNTY CALIFORNIA--WRI 80-84
0CO
COOOOOC
O
Page 1
Page 2
Page 3
Page 4
Page 5
Page 6
Page 7
Page 8
Page 9
Page 10
Page 11
Page 12
Page 13
Page 14
Page 15
Page 16
Page 17
Page 18
Page 19
Page 20
Page 21
Page 22
Page 23
Page 24
Page 25
Page 26
Page 27
Page 28
Page 29
Page 30
Page 31
Page 32
Page 33
Page 34
Page 35
Page 36
Page 37
Page 38
Page 39
Page 40
29 REFERENCES CITED
Three new wells 700-800 ft deep and adjacent to the coast one in SWk sec 13 T 11 S R 1 W one in SEA sec 15 T 11 S R 1 W and one in SWk sec 19 T 11 S R 1 E could monitor the lower part of the Purisima Formation Data from these wells might be used to detect the advancing sea-water front at depth before it reaches the Soquel Creek County Water District wells
CONCLUSIONS
Ground-water pumpage from the Purisima Formation a confined aquifer has averaged about 5400 acre-ftyr since 1970--1000 acre-ftyr more than its potential yield of 4400 acre-ftyr This pumping has caused a decrease in freshwater head and water levels in wells along the coast have declined to below sea level Prior to the 1970s the head was sufficient to produce a seaward gradient and freshwater was discharged into the ocean at the outcrop of the aquifer maintaining the freshwater-seawater interface an unknown but probably considerable distance offshore Since the early 1970s the reduction of head has reversed the ground-water gradient in the aquifer and has brought about conditions that are favorable for migration of seawater landward Seawater intrusion has resulted and has progressed in the interval 0-100 ft below sea level to the vicinity of Capitola Intrusion has been detected in this shallow interval first probably because it crops out near shore on the floor of Monterey Bay and seawater had only a short distance to travel to reach shallow wells
It is unknown how long it will take seawater to intrude the inland parts of the deeper zones if indeed it ever does It will depend on how carefully pumpage with its effect on freshwater head is managed As the freshwater head is reduced seawater will move landward and a new freshwater-saltwater interface will be established If the interface reaches deep wells then saltwater will be pumped Conversely if the freshwater head is increased the interface will move seaward and the threat of seawater intrusion will be eliminated
Ground-water pumpage from the Aromas Sand in the vicinity of La Selva Beach (fig 14) has been near its potential yield--about 1500 acre-ftyr--since the early 1970s No changes in the quantity of ground water in storage or in water quality have been observed
An observation-well network could be established to monitor status of ground-water storage and water quality
REFERENCES CITED
Hickey J J 1968 Hydrogeologic study of the Soquel-Aptos area Santa Cruz County California US Geological Survey open-file report 48 p
Todd D K 1964 Ground water hydrology New York John Wiley 336 p
bull bull
bull bull
bull r
4 A
bull -
obdquo rtt
s bull bull
bulllsquo44
bull
mdashbull
t s
s O
t
4 lsquo-zii bullIc
44
-t- ---bull
f4 4
ibdquobull
-4
bull
- bullbull
t --bdquo
-r4
2-
bullbullbull
x bull k
4
$
bull bull
1
a
bull bull 70bull
It bullbullbull
raf 1 i
oo
- bull 4 bull
sis
bull
x bull
bdquo
s
sY
bull
1 il
rik
- tr
-bull bull
bull
1-
t
bull
os
4
to7 1
I
r bull
-~4 44
aorss i
bull Ns4
bull bullsio
mdashso
bull o
bull -4
hi
Ot i
bull
USGS LIBRARY - RESTON
Muir--SEAWATER INTRUSION SOQUEL-APTOS AREA SANTA CRUZ COUNTY CALIFORNIA--WRI 80-84
0CO
COOOOOC
O
Page 1
Page 2
Page 3
Page 4
Page 5
Page 6
Page 7
Page 8
Page 9
Page 10
Page 11
Page 12
Page 13
Page 14
Page 15
Page 16
Page 17
Page 18
Page 19
Page 20
Page 21
Page 22
Page 23
Page 24
Page 25
Page 26
Page 27
Page 28
Page 29
Page 30
Page 31
Page 32
Page 33
Page 34
Page 35
Page 36
Page 37
Page 38
Page 39
Page 40
bull bull
bull bull
bull r
4 A
bull -
obdquo rtt
s bull bull
bulllsquo44
bull
mdashbull
t s
s O
t
4 lsquo-zii bullIc
44
-t- ---bull
f4 4
ibdquobull
-4
bull
- bullbull
t --bdquo
-r4
2-
bullbullbull
x bull k
4
$
bull bull
1
a
bull bull 70bull
It bullbullbull
raf 1 i
oo
- bull 4 bull
sis
bull
x bull
bdquo
s
sY
bull
1 il
rik
- tr
-bull bull
bull
1-
t
bull
os
4
to7 1
I
r bull
-~4 44
aorss i
bull Ns4
bull bullsio
mdashso
bull o
bull -4
hi
Ot i
bull
USGS LIBRARY - RESTON
Muir--SEAWATER INTRUSION SOQUEL-APTOS AREA SANTA CRUZ COUNTY CALIFORNIA--WRI 80-84
0CO
COOOOOC
O
Page 1
Page 2
Page 3
Page 4
Page 5
Page 6
Page 7
Page 8
Page 9
Page 10
Page 11
Page 12
Page 13
Page 14
Page 15
Page 16
Page 17
Page 18
Page 19
Page 20
Page 21
Page 22
Page 23
Page 24
Page 25
Page 26
Page 27
Page 28
Page 29
Page 30
Page 31
Page 32
Page 33
Page 34
Page 35
Page 36
Page 37
Page 38
Page 39
Page 40
USGS LIBRARY - RESTON
Muir--SEAWATER INTRUSION SOQUEL-APTOS AREA SANTA CRUZ COUNTY CALIFORNIA--WRI 80-84