SECA Core Program– Recent Development of Modeling Activities at PNNL SECA Core Program SECA Core Program – – Recent Development of Modeling Recent Development of Modeling Activities at PNNL Activities at PNNL MA Khaleel Email: [email protected]Phone: (509) 375-2438 KP Recknagle, JS Vetrano, X Sun, BJ Koeppel, KI Johnson, VN Korolev, BN Nguyen, AM Tartakovsky, and P Singh Pacific Northwest National Laboratory Richland, WA 99352 Travis Shultz, Wayne Surdoval, Don Collins National Energy Technology Laboratory SECA Core Technology Program Peer Review Lakewood, CO October 25-26, 2005
Transcript
SECA Core Program–Recent Development of Modeling
Activities at PNNL
SECA Core ProgramSECA Core Program––Recent Development of Modeling Recent Development of Modeling
Evaluate the tightly coupled multi-physical phenomena in SOFCsAllow SOFC manufacturers to numerically test changes in stack design and performance to meet DOE technical targets
Approach: Finite element-based analysis tools:Mentat-FC: Easy-to-use pre- and post-processor to construct a complete analytical model from generic geometry or templatesSOFC-MP: A multi-physics solver that quickly computes the coupled flow-thermal-electrochemical response for multi-cell SOFC stacksProbabilistic-based design methodology to assess system performance and component reliability against DOE technical targetsTargeted evaluation tools for eminent engineering challenges:
Interface and coating durabilityReliable sealingOn-cell reformation for thermal managementStructural integrity under thermal cyclingTime dependent material degradation
3
AccomplishmentsAccomplishmentsAccomplishmentsStack Design Tool Available: PNNL and MSC-Software combined efforts to develop and release a user-friendly electrochemical-thermal-structural stack design software package (consortium available). Design tool capability includes import of planar and non-planar SOFC stack designsProbabilistic-Based Design Methodology: Methodology developed in which probability of failure of stack components can be made uniform for a proposed stack designGlass-Ceramic Seal Damage Characterized: Experimentally-based model enables prediction of damage accumulation and failure in steady and thermally cycled stacksCharacterization of On-Cell Reformation in Stacks: Experimentally- based reformation model enables prediction of the effects of on-cell steam-methane reformation under variable stack operating conditionsExperiments Provide Critical Properties: Testing has provided fundamental material properties enabling model development
4
Teaming and CollaborationsTeaming and CollaborationsTeaming and Collaborations
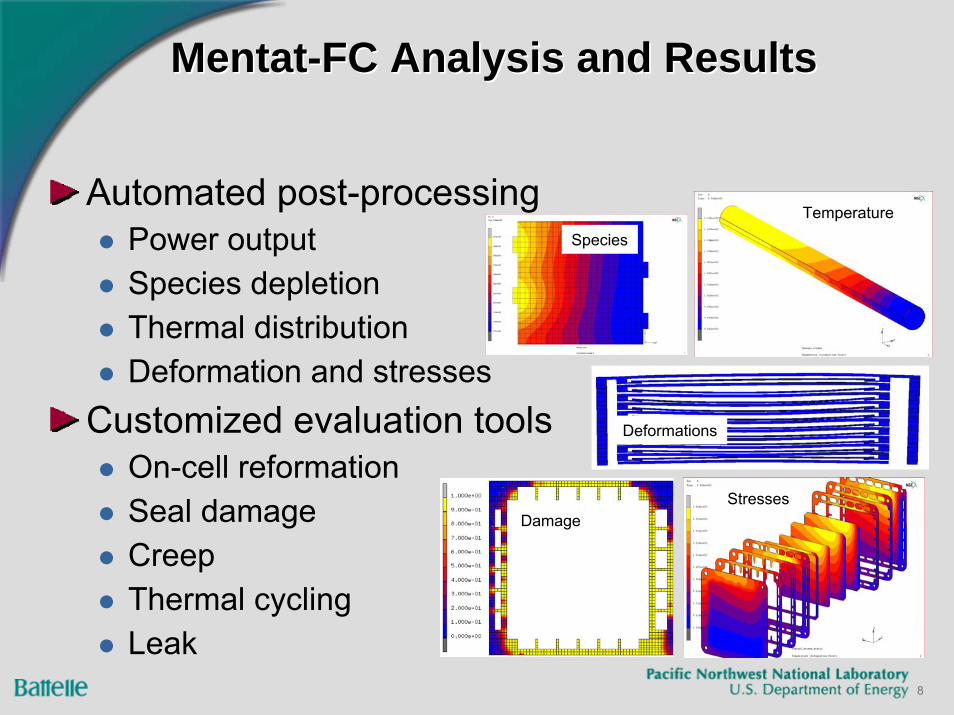
Mentat-FC Analysis and ResultsMentatMentat--FC Analysis and ResultsFC Analysis and Results
Damage
Temperature
Deformations
Stresses
Species
9
On-Cell Reforming:Manipulation of Conversion Activity
OnOn--Cell Reforming:Cell Reforming:Manipulation of Conversion ActivityManipulation of Conversion Activity
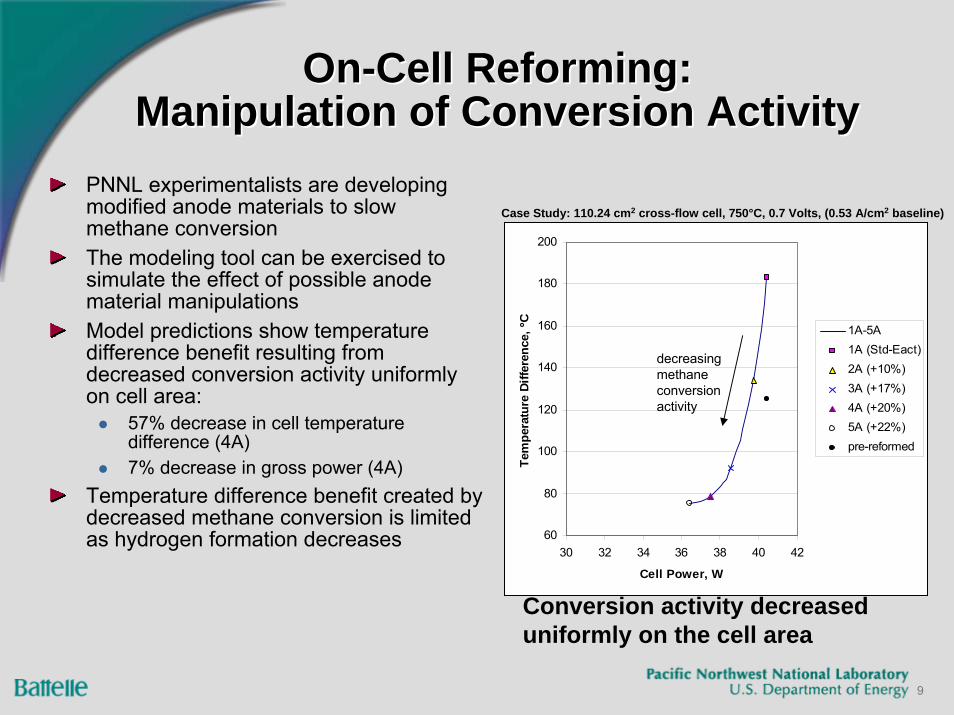
PNNL experimentalists are developing modified anode materials to slow methane conversionThe modeling tool can be exercised to simulate the effect of possible anode material manipulationsModel predictions show temperature difference benefit resulting from decreased conversion activity uniformly on cell area:
57% decrease in cell temperature difference (4A)7% decrease in gross power (4A)
Temperature difference benefit created by decreased methane conversion is limited as hydrogen formation decreases 60
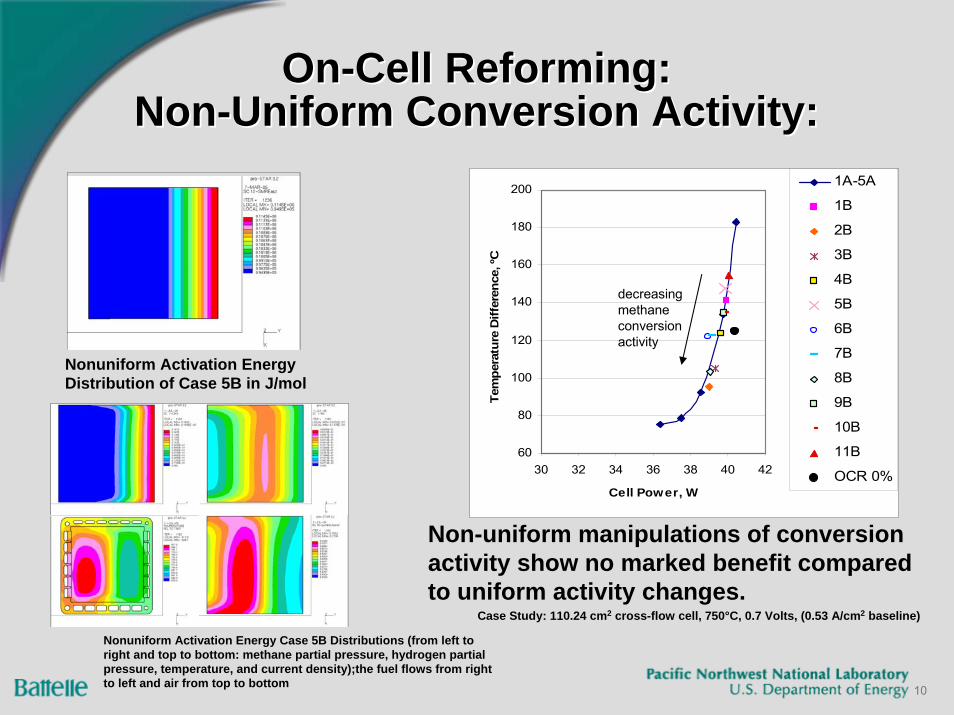
Nonuniform Activation Energy Distribution of Case 5B in J/mol
Nonuniform Activation Energy Case 5B Distributions (from left to right and top to bottom: methane partial pressure, hydrogen partial pressure, temperature, and current density);the fuel flows from right to left and air from top to bottom
60
80
100
120
140
160
180
200
30 32 34 36 38 40 42
Cell Power, WTe
mpe
ratu
re D
iffer
ence
, ºC
1A-5A
1B
2B
3B
4B
5B
6B
7B
8B
9B
10B
11B
OCR 0%
Non-uniform manipulations of conversion activity show no marked benefit compared to uniform activity changes.
Maximizing Power:Cell Voltage and Uniform Activity
Maximizing Power:Maximizing Power:Cell Voltage and Uniform ActivityCell Voltage and Uniform Activity
Cases expanded to include range of cell voltagesAt each voltage, the cell temperature difference decreases with methane conversionFor a chosen acceptable temperature difference, the power can be maximized by proper choice of voltage and conversion activity
OnOn--Cell Reforming:Cell Reforming:SimulationsSimulations in in MentatMentat--FCFC
2 - Standard RateOn-Cell Reforming
Case Temperature, °C Min Max
S1max. MPa Anode
S1max. MPa Seal
S1max. MPa Picture Frame
1 – No CH4 720 821 9.7 6.6 98.1 2 – Standard
Rate 684 793 5.0 7.6 99.7
1 - H2 fuel (No CH4)
FuelIN
Air IN
FuelIN
Air IN
13
Probabilistic Based ‘Coarse Design Methodology’ for SOFC Stacks
Probabilistic Based Probabilistic Based ‘‘Coarse Design Coarse Design MethodologyMethodology’’ for SOFC Stacksfor SOFC Stacks
FY05 AccomplishmentsPerformed cell maximum principal stress sensitivity study under start-up/cool-down condition and operating condition.A probabilistic-based component design methodology is developed for solid oxide fuel cell (SOFC) stack. Component failure probabilities for any particular design can becalculated as a function of operating conditions. Procedures for calculating the safety indices for anode and sealhave been demonstrated such that uniform failure probability of the components can be achieved. Documented analyses results and procedure in PNNL Topical Report.
14
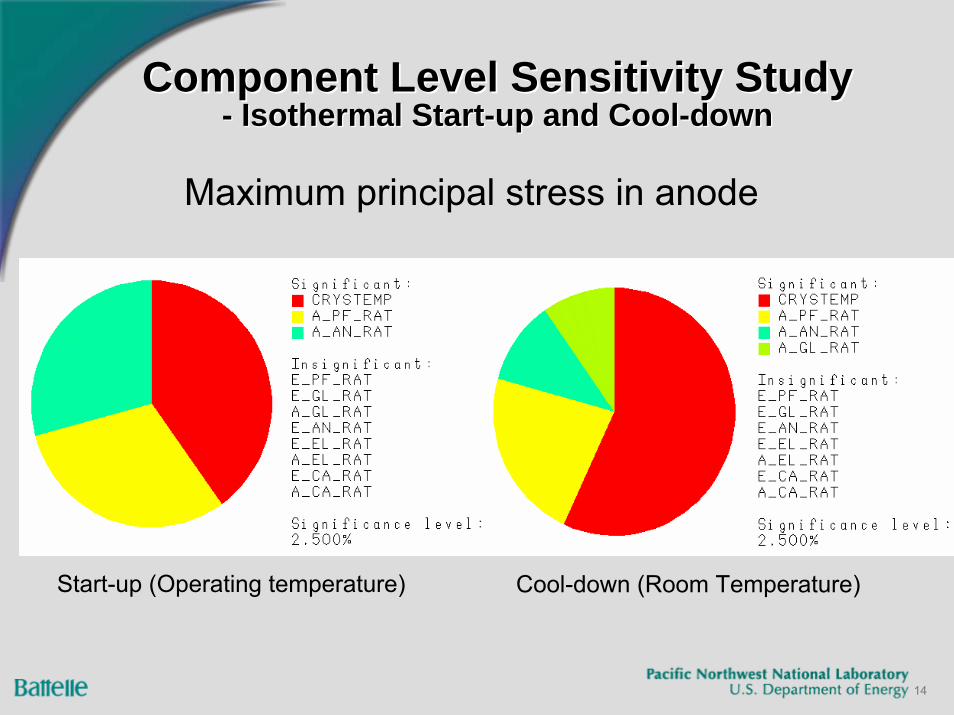
Component Level Sensitivity Study- Isothermal Start-up and Cool-down
Component Level Sensitivity StudyComponent Level Sensitivity Study-- Isothermal StartIsothermal Start--up and Coolup and Cool--downdown
Design variables considered:(a) Increase seal width from 0.5mm to 0.55mm.(b) Increase all PEN layer thicknesses by 10%.(c) Decrease stainless steel CTE to the weighted average of the PEN
layer CTEs.(d) Increase width of the cell active area by 10%.
First order terms
abcd
Effects of couplinga+ba+ca+db+cb+dc+d
Component Level Sensitivity Study- Operating Condition, example 2
Component Level Sensitivity StudyComponent Level Sensitivity Study-- Operating Condition, example 2Operating Condition, example 2
Influence of different parameters on anode maximum principal stress
17
Probabilistic Based ‘Coarse Design Methodology’
Probabilistic Based Probabilistic Based ‘‘Coarse Design Coarse Design MethodologyMethodology’’
Example design target: uniform component failure probability Pf=0.0014, safe index β=3.
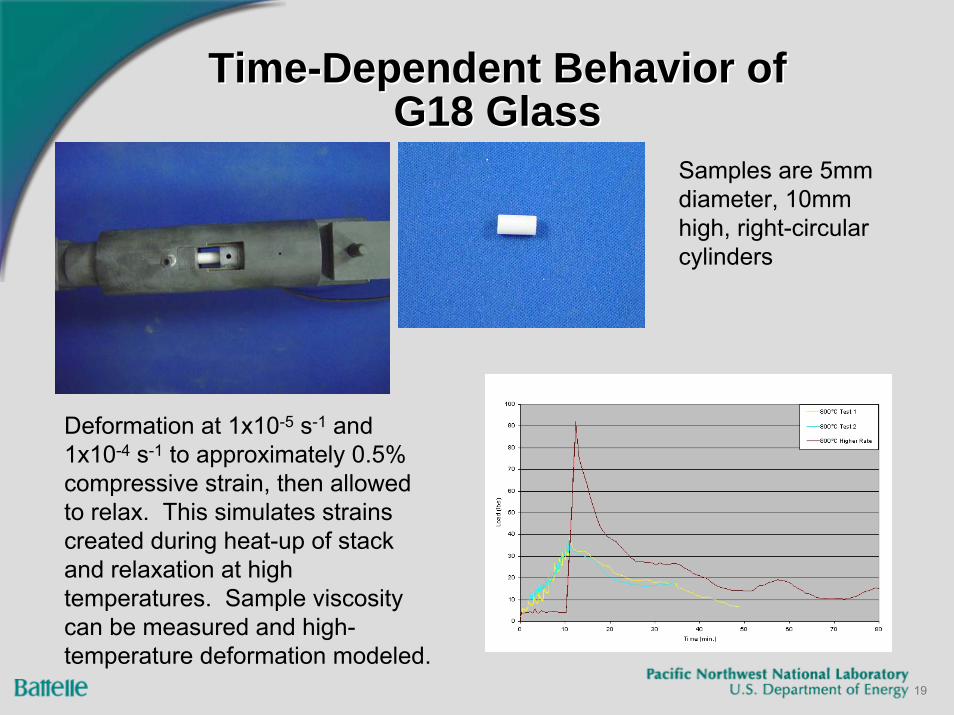
Samples are 5mm diameter, 10mm high, right-circular cylinders
Deformation at 1x10⁻⁵ s-1 and 1x10⁻⁴ s-1 to approximately 0.5% compressive strain, then allowed to relax. This simulates strains created during heat-up of stack and relaxation at high temperatures. Sample viscosity can be measured and high-temperature deformation modeled.
20
Data From Seal Assembly Analogs Data From Seal Assembly Analogs Data From Seal Assembly Analogs
Thin-film analogs to test the entire seal assembly. These complement the previous tests in bulk glass.
Failure is generally interfacial rather than in the glass itself indicating that the interface needs further development.
430 SS
Dispensed Glass
0.020” Crofer 22 APU washer (Ni brazed to 430) on both sides
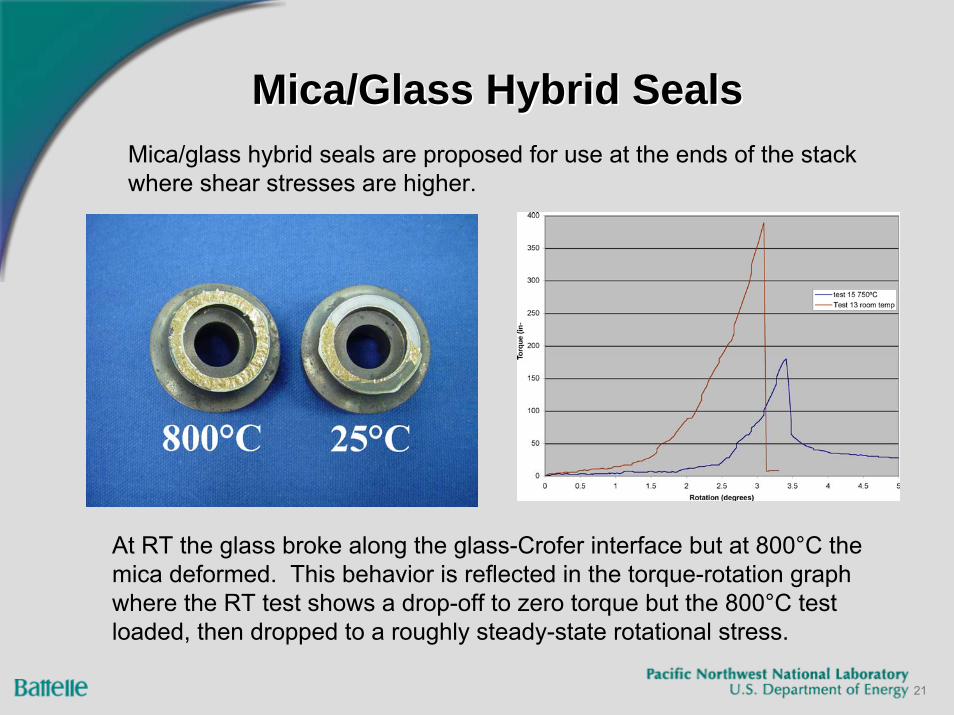
At RT the glass broke along the glass-Crofer interface but at 800°C the mica deformed. This behavior is reflected in the torque-rotation graph where the RT test shows a drop-off to zero torque but the 800°C test loaded, then dropped to a roughly steady-state rotational stress.
Mica/glass hybrid seals are proposed for use at the ends of the stack where shear stresses are higher.
22
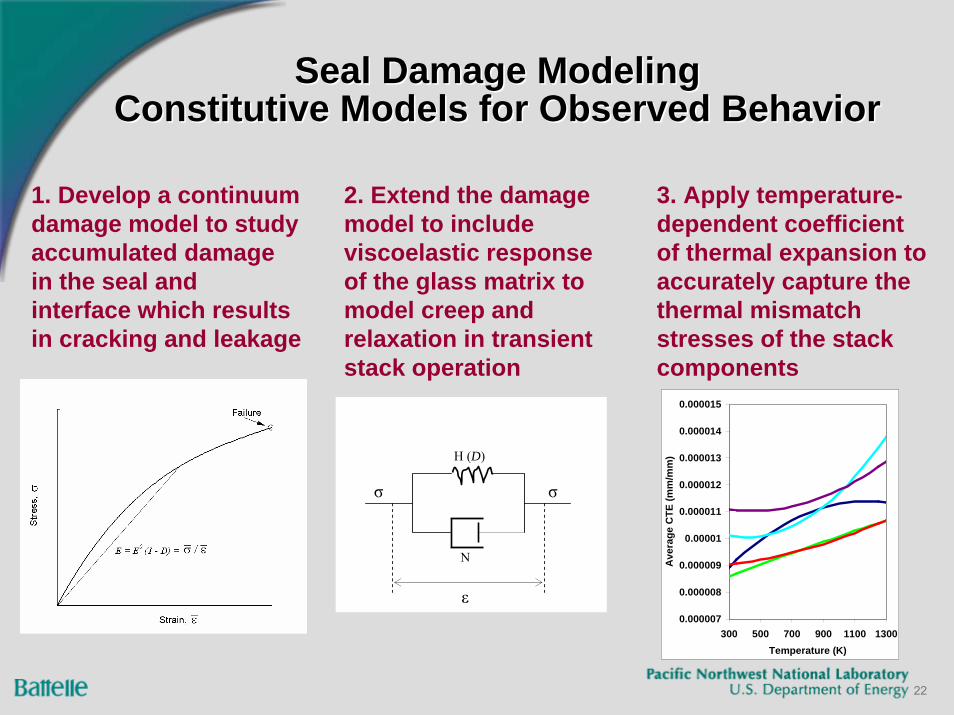
1. Develop a continuum damage model to study accumulated damage in the seal and interface which results in cracking and leakage
H (D)
N
ε
σ σ
0.000007
0.000008
0.000009
0.00001
0.000011
0.000012
0.000013
0.000014
0.000015
300 500 700 900 1100 1300Temperature (K)
Ave
rage
CTE
(mm
/mm
)
Seal Damage ModelingConstitutive Models for Observed Behavior
Seal Damage ModelingSeal Damage ModelingConstitutive Models for Observed BehaviorConstitutive Models for Observed Behavior
2. Extend the damage model to include viscoelastic response of the glass matrix to model creep and relaxation in transient stack operation
3. Apply temperature-dependent coefficient of thermal expansion to accurately capture the thermal mismatch stresses of the stack components
23
Conclusions
• Damage beginsin first cycle
• Bottom seal failsfirst0
200
400
600
800
1000
1200
0 10000 20000 30000 40000 50000 60000Time (s)
Tem
pera
ture
(K)
Oven temp Cycle
3. Track stresses and damage during the thermal transient
2. Impose a desired thermal load cycle on the stack via temperature history of inlet flows and surroundings. Include EC heat generation during “operation”
ElectrolyteStress
24
Activities for the Next 6 MonthsActivities for the Next 6 MonthsActivities for the Next 6 Months
Model improvement/calibration:Interface modelingTime dependent property incorporationViscoelastic damage modeling of seals
Parametric studies on material properties and design parameters to guide material development activitiesElectrochemical degradation modelingEffects of on-cell reformation on stack thermal and electrochemical performanceAutomation of the reliability-based design framework for easy executionMeasurement of mechanical degradation of seals and other interfaces
25
Looking Forward- Phase IILooking ForwardLooking Forward-- Phase IIPhase II
Degradation modeling and life predictionSealInterconnectCellInterfaces
Scale up within SECA goalVirtual feasibility study on
Stack EC performance Stack structural reliability
System integrationStack thermal management and cell thermal profilesIntegration with other components