46
MACQUARIE PRIME REIT Second Quarter 2008 Financial Results 30 July 2008 1
| Date post: | 15-Jun-2018 |
| Category: |
Documents |
| Upload: | doankhuong |
| View: | 215 times |
| Download: | 0 times |
MACQUARIE PRIME REIT
Second Quarter 2008 Financial Results
30 July 2008
1
30 July 2008
Agenda
Financial Highlights
Portfolio Performance Update– Singapore– Tokyo– Chengdu
Growth Strategies– Asset Enhancements
Macquarie Prime REIT 2
30 July 2008 Macquarie Prime REIT 3
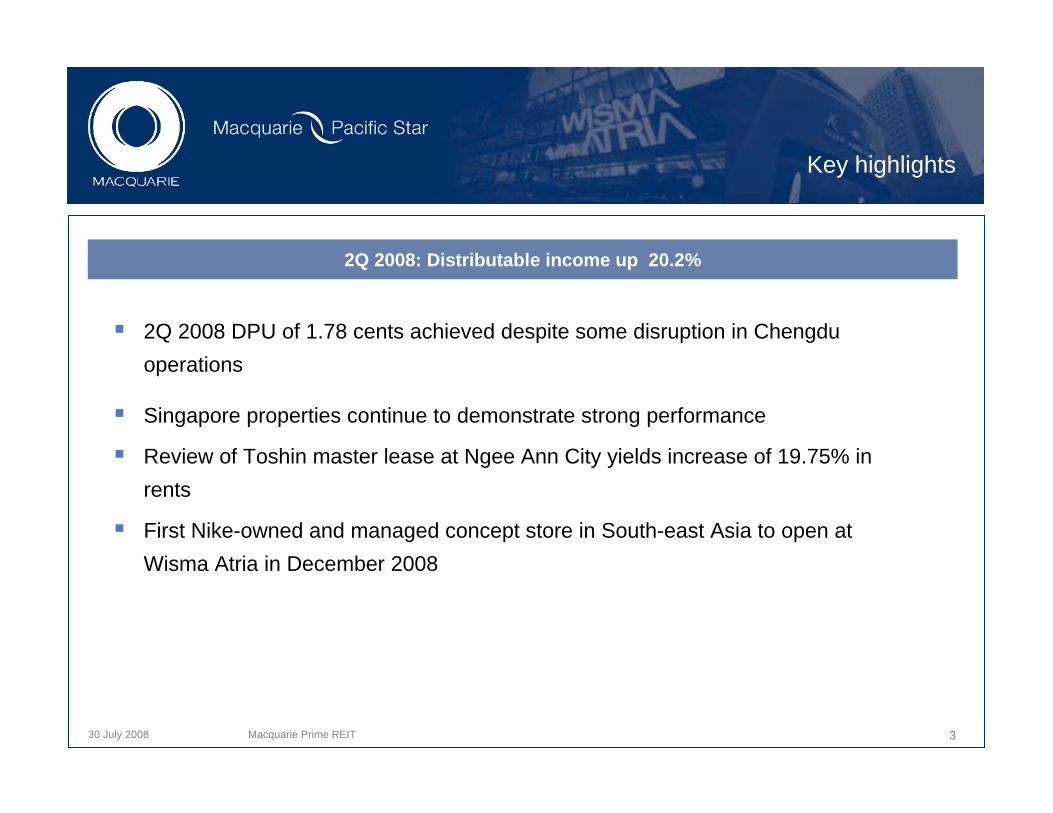
2Q 2008 DPU of 1.78 cents achieved despite some disruption in Chengdu operations
Singapore properties continue to demonstrate strong performance
Review of Toshin master lease at Ngee Ann City yields increase of 19.75% in rents
First Nike-owned and managed concept store in South-east Asia to open at Wisma Atria in December 2008
Key highlights
2Q 2008: Distributable income up 20.2%
30 July 2008 Macquarie Prime REIT 4
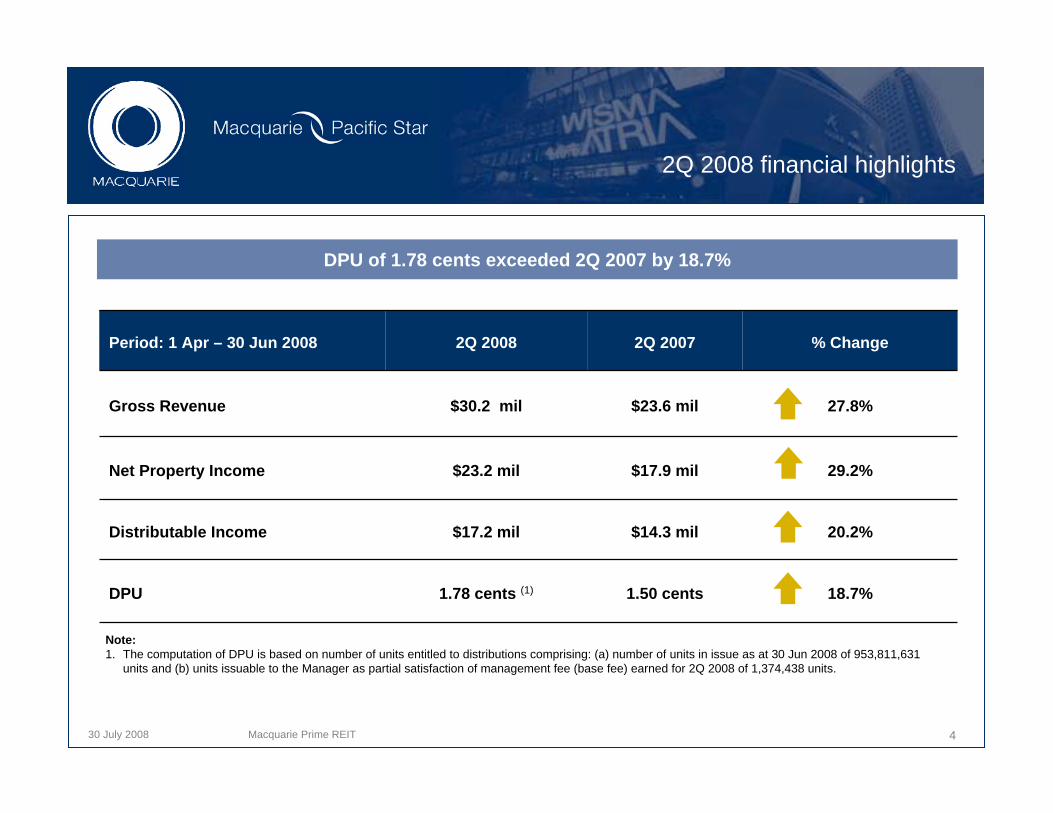
Period: 1 Apr – 30 Jun 2008 2Q 2008 2Q 2007 % Change
Gross Revenue $30.2 mil $23.6 mil 27.8%
Net Property Income $23.2 mil $17.9 mil 29.2%
Distributable Income $17.2 mil $14.3 mil 20.2%
DPU 1.78 cents (1) 1.50 cents 18.7%
2Q 2008 financial highlights
Note: 1. The computation of DPU is based on number of units entitled to distributions comprising: (a) number of units in issue as at 30 Jun 2008 of 953,811,631
units and (b) units issuable to the Manager as partial satisfaction of management fee (base fee) earned for 2Q 2008 of 1,374,438 units.
DPU of 1.78 cents exceeded 2Q 2007 by 18.7%
30 July 2008 Macquarie MEAG Prime REIT 5
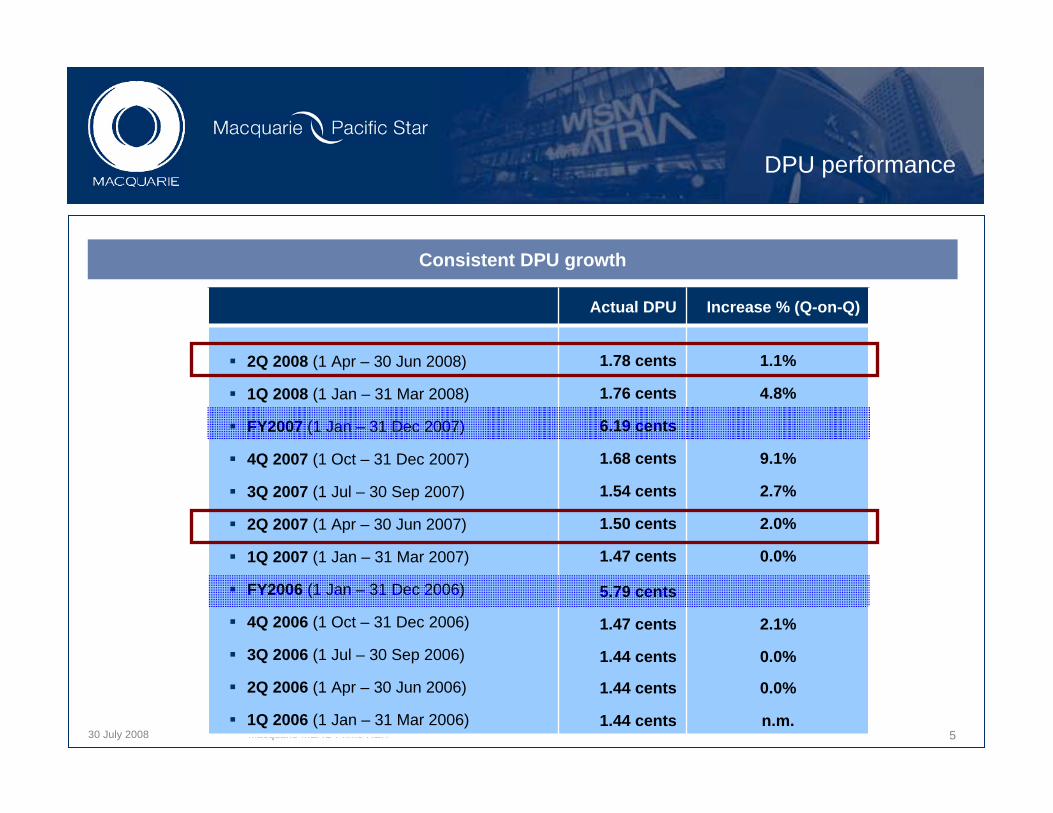
DPU performance
Actual DPU Increase % (Q-on-Q)
2Q 2008 (1 Apr – 30 Jun 2008)
1Q 2008 (1 Jan – 31 Mar 2008)
FY2007 (1 Jan – 31 Dec 2007)
4Q 2007 (1 Oct – 31 Dec 2007)
3Q 2007 (1 Jul – 30 Sep 2007)
2Q 2007 (1 Apr – 30 Jun 2007)
1Q 2007 (1 Jan – 31 Mar 2007)
FY2006 (1 Jan – 31 Dec 2006)
4Q 2006 (1 Oct – 31 Dec 2006)
3Q 2006 (1 Jul – 30 Sep 2006)
2Q 2006 (1 Apr – 30 Jun 2006)
1Q 2006 (1 Jan – 31 Mar 2006)
1.78 cents
1.76 cents
6.19 cents
1.68 cents
1.54 cents
1.50 cents
1.47 cents
5.79 cents
1.47 cents
1.44 cents
1.44 cents
1.44 cents
1.1%
4.8%
9.1%
2.7%
2.0%
0.0%
2.1%
0.0%
0.0%
n.m.
Consistent DPU growth
30 July 2008 Macquarie MEAG Prime REIT
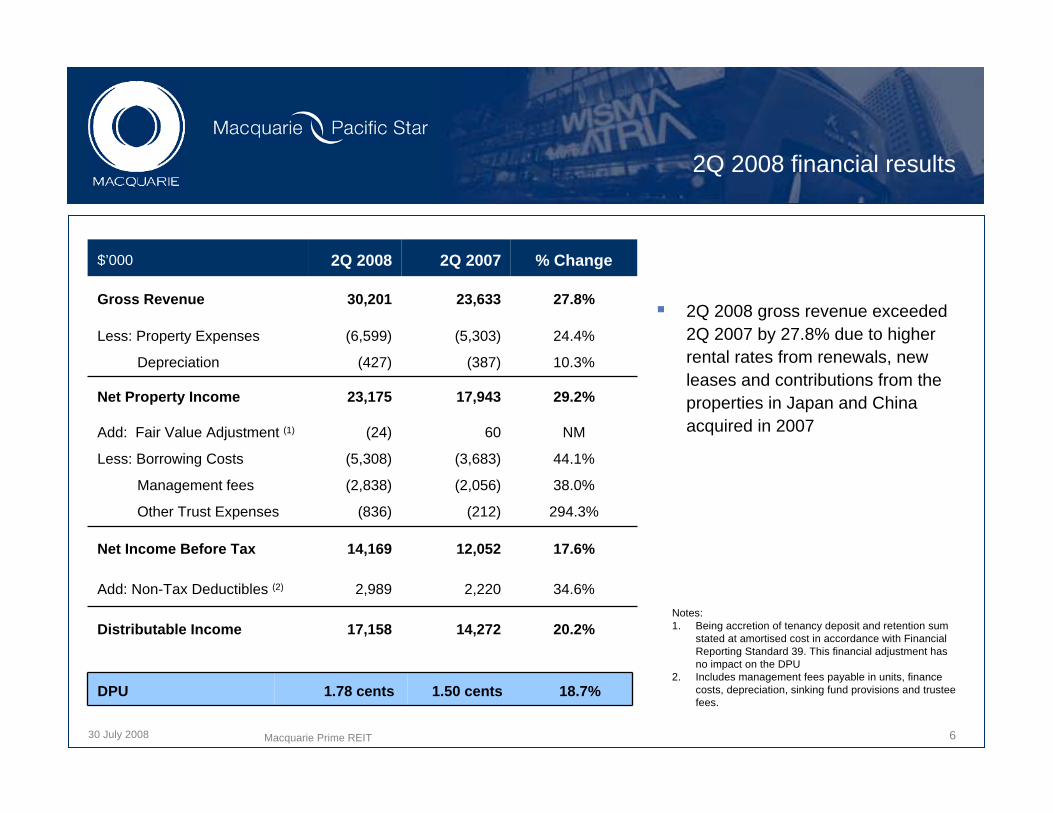
2Q 2008 financial results
2Q 2008 gross revenue exceeded 2Q 2007 by 27.8% due to higher rental rates from renewals, new leases and contributions from the properties in Japan and China acquired in 2007
$’000 2Q 2008 2Q 2007 % Change
Gross Revenue 30,201 23,633 27.8%
Less: Property Expenses
Depreciation
(6,599)
(427)
(5,303)
(387)
24.4%
10.3%
Net Property Income 23,175 17,943 29.2%
Add: Fair Value Adjustment (1)
Less: Borrowing Costs
Management fees
Other Trust Expenses
(24)
(5,308)
(2,838)
(836)
60
(3,683)
(2,056)
(212)
NM
44.1%
38.0%
294.3%
Net Income Before Tax 14,169 12,052 17.6%
Add: Non-Tax Deductibles (2) 2,989 2,220 34.6%
Distributable Income 17,158 14,272 20.2%
DPU 1.78 cents 1.50 cents 18.7%
Notes: 1. Being accretion of tenancy deposit and retention sum
stated at amortised cost in accordance with Financial Reporting Standard 39. This financial adjustment has no impact on the DPU
2. Includes management fees payable in units, finance costs, depreciation, sinking fund provisions and trustee fees.
Macquarie Prime REIT 6
30 July 2008
7.50
6.95
3.59
2.64 2.50
0.93
-
1
2
3
4
5
6
7
8
Average S-Reityield
MMP REITFY2008 yield
10-Year SporeGovt Bond
5-Year SporeGovt Bond
CPF OrdinaryAcount
Bank FixedDeposit Rate (12
Month)
7
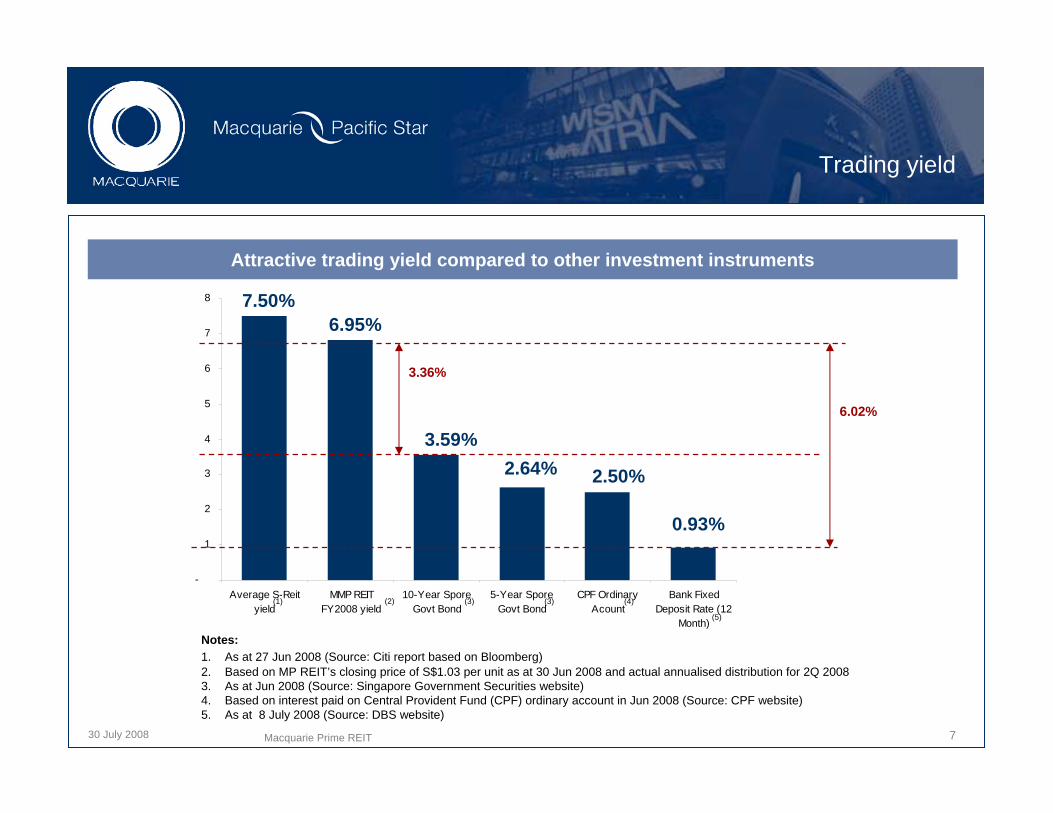
Trading yield
Notes: 1. As at 27 Jun 2008 (Source: Citi report based on Bloomberg)2. Based on MP REIT’s closing price of S$1.03 per unit as at 30 Jun 2008 and actual annualised distribution for 2Q 20083. As at Jun 2008 (Source: Singapore Government Securities website)4. Based on interest paid on Central Provident Fund (CPF) ordinary account in Jun 2008 (Source: CPF website)5. As at 8 July 2008 (Source: DBS website)
2.50%
6.95%
3.59%
0.93%
6.02%
(4)(3)(2)(1)
(5)
7.50%
3.36%
Attractive trading yield compared to other investment instruments
2.64%
Macquarie Prime REIT
(3)
30 July 2008 Macquarie Prime REIT 8
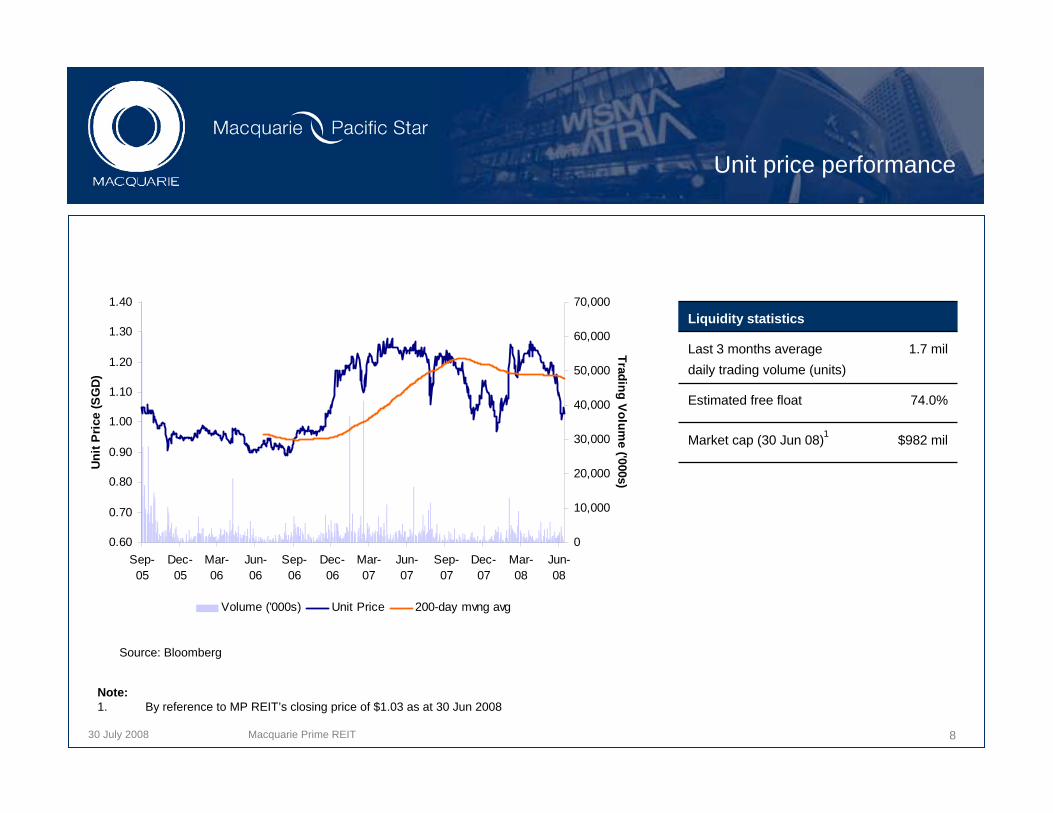
Unit price performance
Liquidity statistics
Last 3 months average daily trading volume (units)
1.7 mil
Estimated free float 74.0%
Market cap (30 Jun 08) $982 mil1
Source: Bloomberg
Note: 1. By reference to MP REIT’s closing price of $1.03 as at 30 Jun 2008
0.60
0.70
0.80
0.90
1.00
1.10
1.20
1.30
1.40
Sep-05
Dec-05
Mar-06
Jun-06
Sep-06
Dec-06
Mar-07
Jun-07
Sep-07
Dec-07
Mar-08
Jun-08
Uni
t Pric
e (S
GD)
0
10,000
20,000
30,000
40,000
50,000
60,000
70,000
Trading Volume ('000s)
Volume ('000s) Unit Price 200-day mvng avg
30 July 2008 Macquarie Prime REIT 9
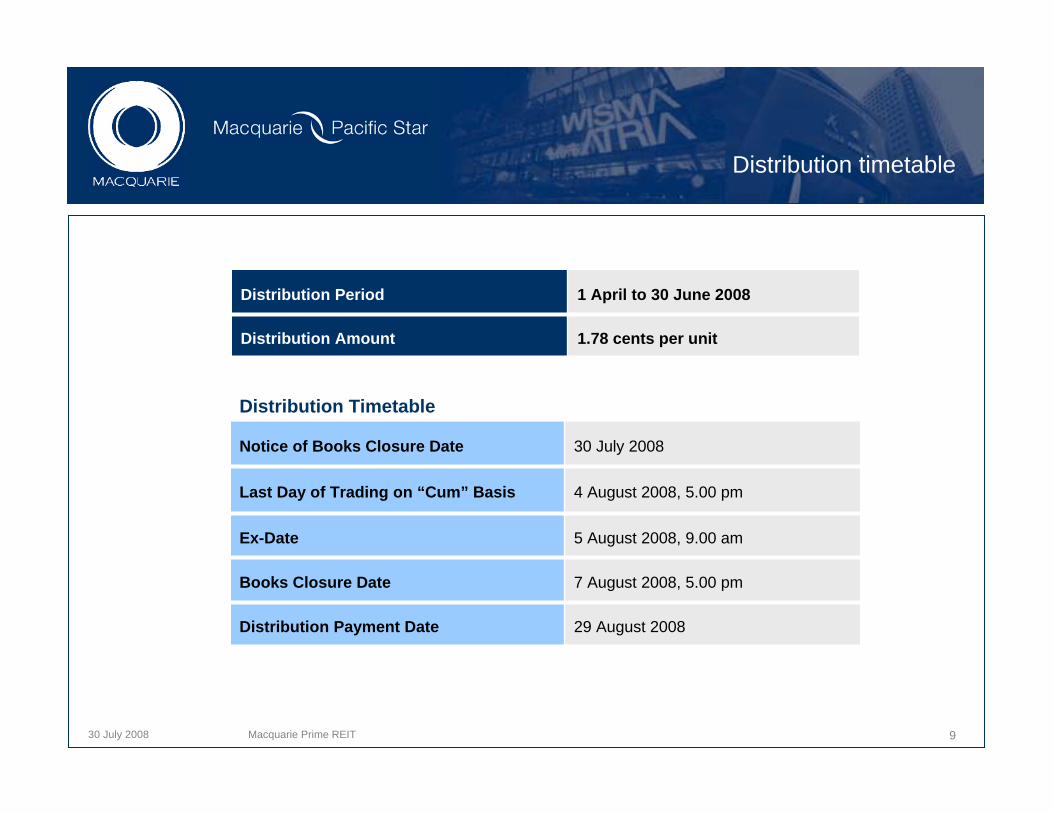
Distribution timetable
Notice of Books Closure Date 30 July 2008
Last Day of Trading on “Cum” Basis 4 August 2008, 5.00 pm
Ex-Date 5 August 2008, 9.00 am
Books Closure Date 7 August 2008, 5.00 pm
Distribution Payment Date 29 August 2008
Distribution Period 1 April to 30 June 2008
Distribution Amount 1.78 cents per unit
Distribution Timetable
30 July 2008 Macquarie Prime REIT 10
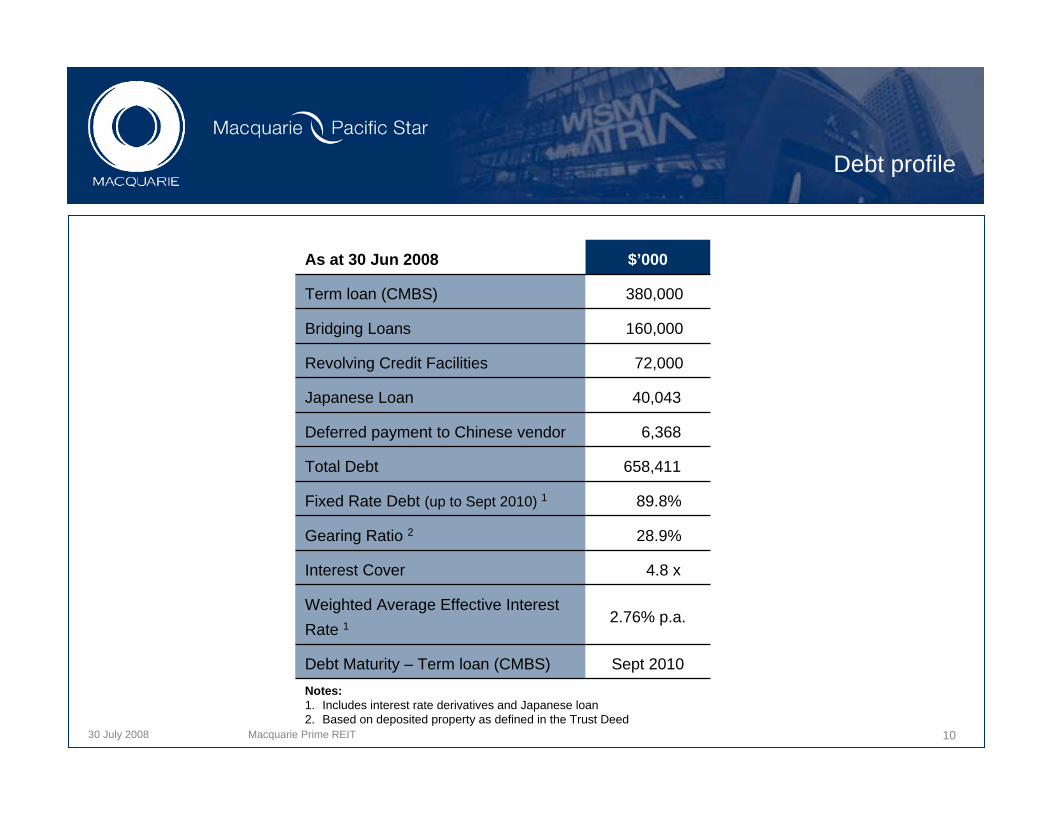
Debt profile
As at 30 Jun 2008 $’000
Term loan (CMBS) 380,000
Bridging Loans 160,000
Revolving Credit Facilities 72,000
Japanese Loan 40,043
Deferred payment to Chinese vendor 6,368
Total Debt 658,411
Fixed Rate Debt (up to Sept 2010) 1 89.8%
Gearing Ratio 2 28.9%
Interest Cover 4.8 x
Weighted Average Effective Interest Rate 1
2.76% p.a.
Debt Maturity – Term loan (CMBS) Sept 2010Notes:1. Includes interest rate derivatives and Japanese loan2. Based on deposited property as defined in the Trust Deed
30 July 2008 Macquarie Prime REIT 11
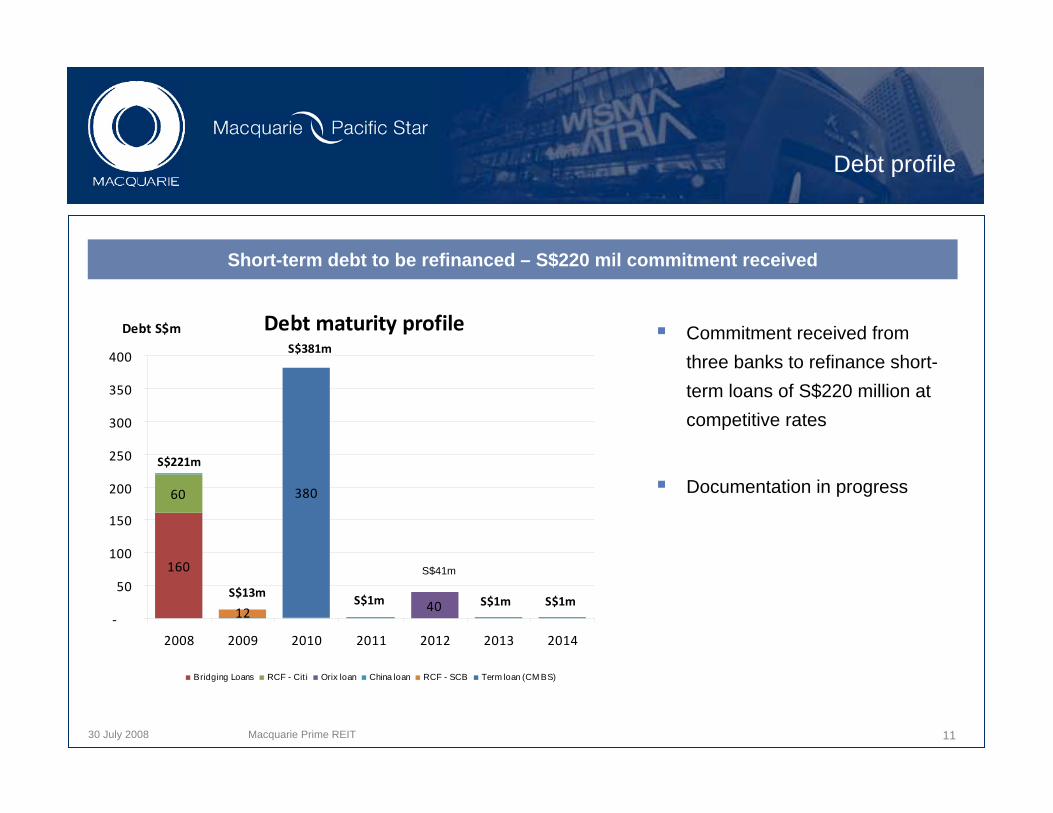
Debt profile
Short-term debt to be refinanced – S$220 mil commitment received
Commitment received from three banks to refinance short-term loans of S$220 million at competitive rates
Documentation in progress
Debt maturity profile
160
60
40
380
12‐
50
100
150
200
250
300
350
400
2008 2009 2010 2011 2012 2013 2014
Debt S$m
Bridging Loans RCF - Cit i Orix loan China loan RCF - SCB Term loan (CM BS)
S$13m
S$221m
S$1m
S$381m
S$1mS$1m
S$40mS$41m
30 July 2008 Macquarie Prime REIT 12
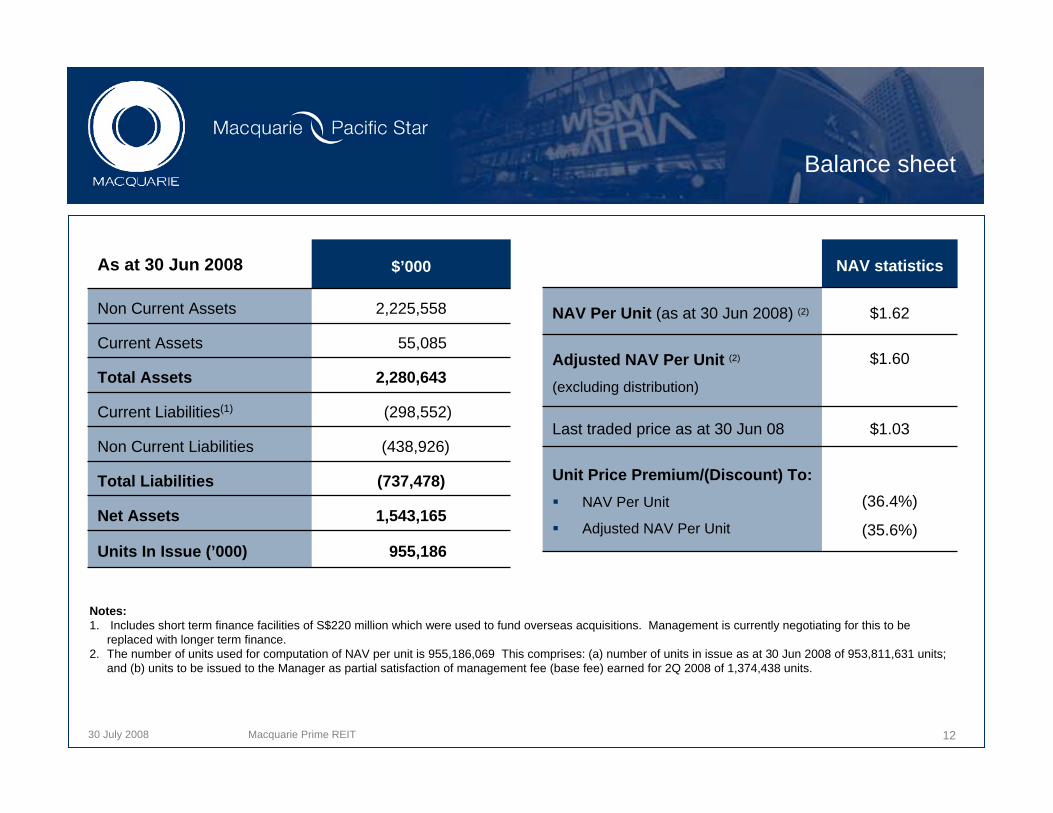
Balance sheet
As at 30 Jun 2008 $’000
Non Current Assets 2,225,558
Current Assets 55,085
Total Assets 2,280,643
Current Liabilities(1) (298,552)
Non Current Liabilities (438,926)
Total Liabilities (737,478)
Net Assets 1,543,165
Units In Issue (’000) 955,186
NAV statistics
NAV Per Unit (as at 30 Jun 2008) (2) $1.62
Adjusted NAV Per Unit (2)
(excluding distribution)
$1.60
Last traded price as at 30 Jun 08 $1.03
Unit Price Premium/(Discount) To:NAV Per Unit
Adjusted NAV Per Unit
(36.4%)
(35.6%)
Notes:1. Includes short term finance facilities of S$220 million which were used to fund overseas acquisitions. Management is currently negotiating for this to be
replaced with longer term finance.2. The number of units used for computation of NAV per unit is 955,186,069 This comprises: (a) number of units in issue as at 30 Jun 2008 of 953,811,631 units;
and (b) units to be issued to the Manager as partial satisfaction of management fee (base fee) earned for 2Q 2008 of 1,374,438 units.
30 July 2008
Agenda
Financial Highlights
Portfolio Performance Update– Singapore– Tokyo– Chengdu
Growth Strategies– Asset Enhancements
Macquarie Prime REIT 13
30 July 2008
Portfolio summary
Macquarie Prime REIT 14
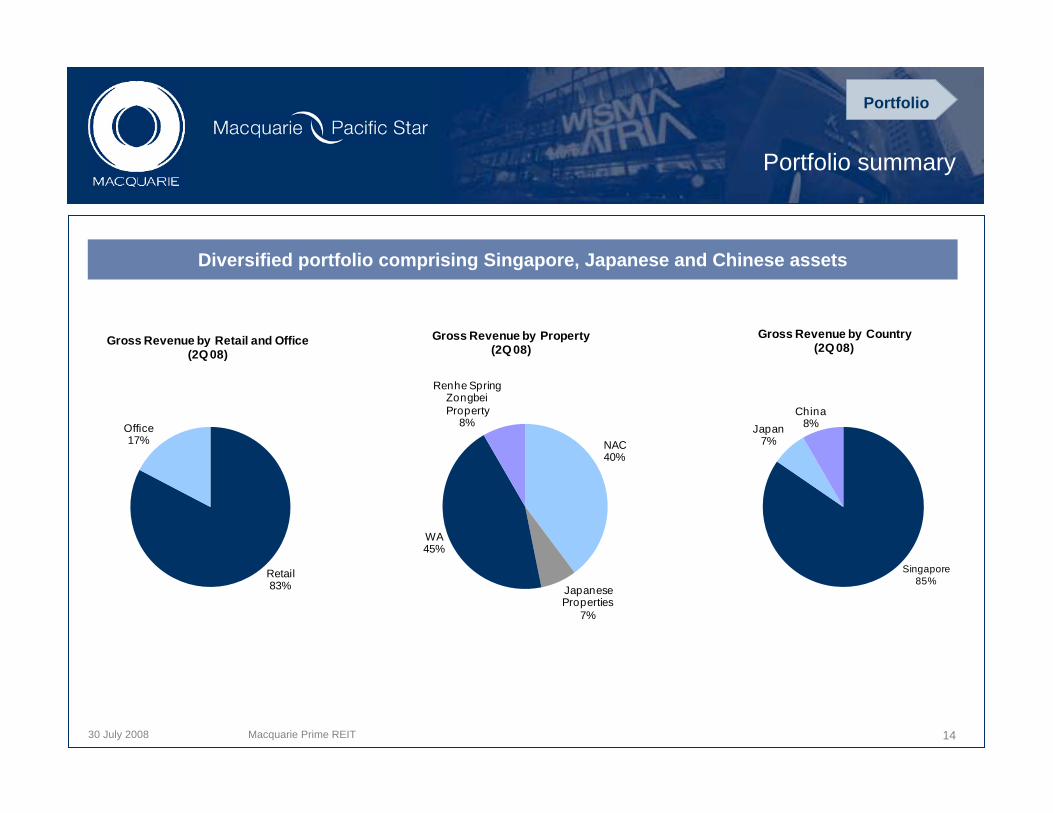
Diversified portfolio comprising Singapore, Japanese and Chinese assets
Portfolio
Retail83%
Office17%
Gross Revenue by Retail and Office(2Q 08)
NAC40%
Japanese Properties
7%
WA45%
Renhe Spring Zongbei Property
8%
Gross Revenue by Property(2Q 08)
Singapore85%
Japan7%
China8%
Gross Revenue by Country(2Q 08)
30 July 2008
Portfolio lease expiry
Macquarie Prime REIT 15
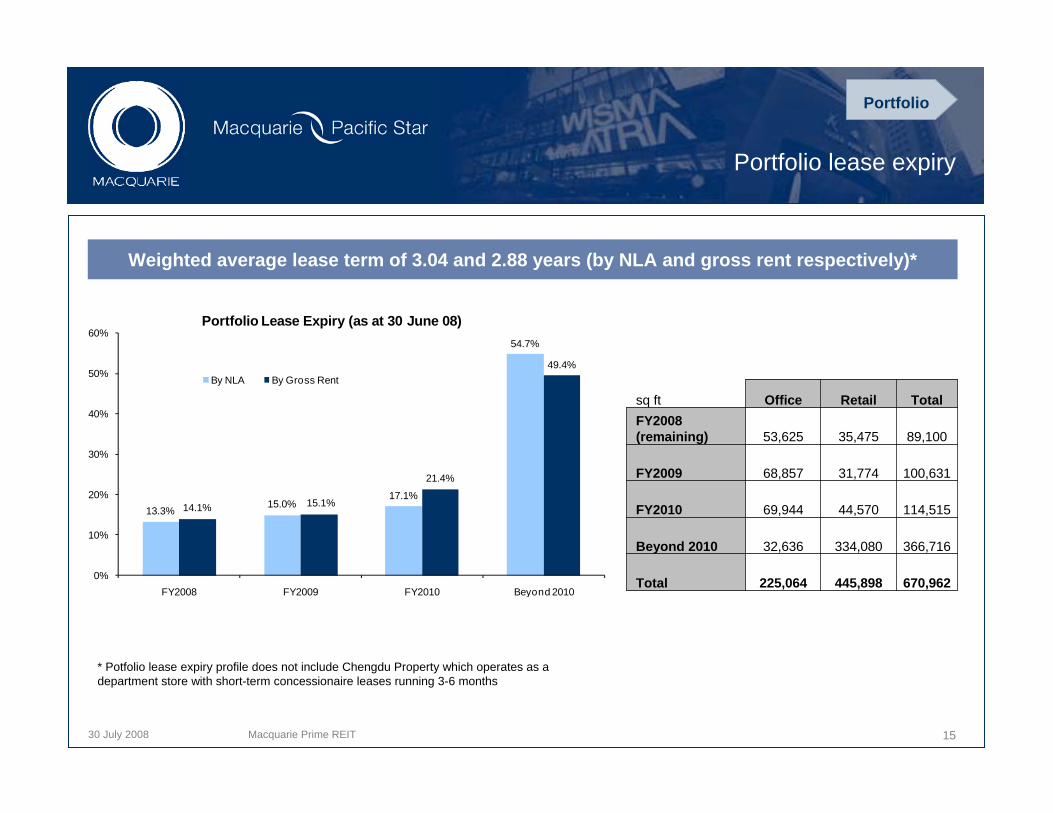
Weighted average lease term of 3.04 and 2.88 years (by NLA and gross rent respectively)*
* Potfolio lease expiry profile does not include Chengdu Property which operates as a department store with short-term concessionaire leases running 3-6 months
Portfolio
sq ft Office Retail TotalFY2008 (remaining) 53,625 35,475 89,100
FY2009 68,857 31,774 100,631
FY2010 69,944 44,570 114,515
Beyond 2010 32,636 334,080 366,716
Total 225,064 445,898 670,962
13.3%15.0%
17.1%
54.7%
14.1% 15.1%
21.4%
49.4%
0%
10%
20%
30%
40%
50%
60%
FY2008 FY2009 FY2010 Beyond 2010
Portfolio Lease Expiry (as at 30 June 08)
By NLA By Gross Rent
30 July 2008
Portfolio lease expiry profile by year
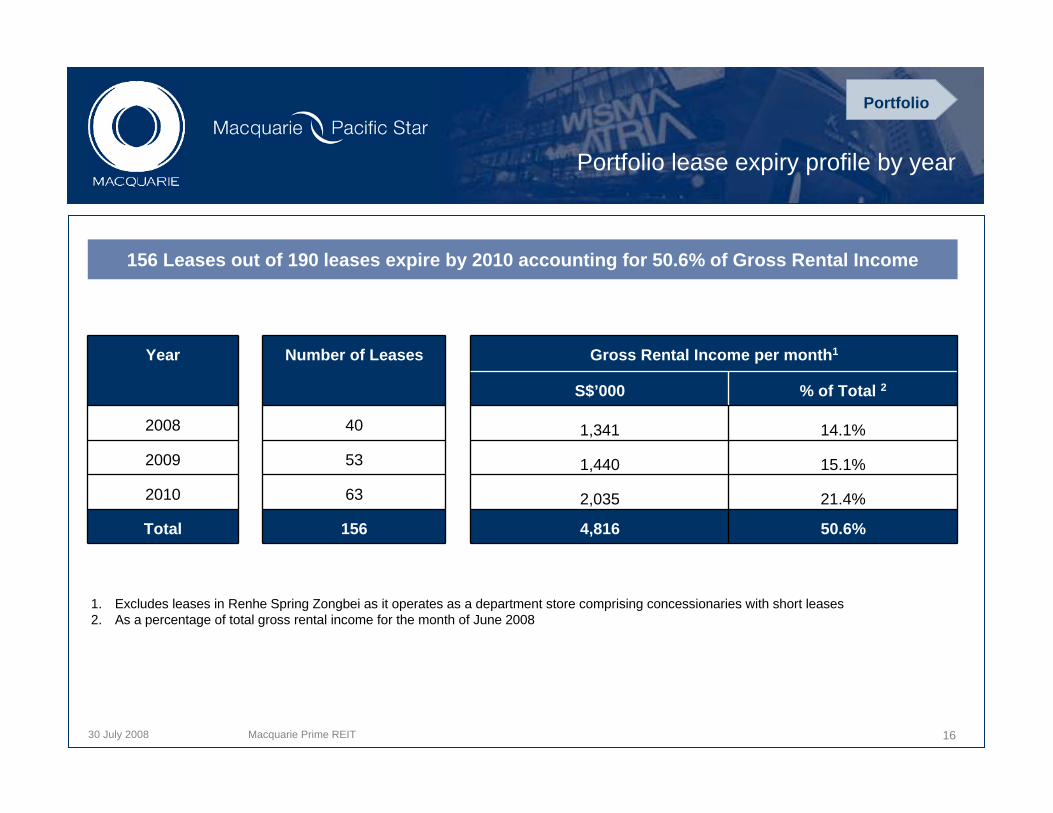
Year Number of Leases Gross Rental Income per month1
S$’000 % of Total 2
2008 40 1,341 14.1%
2009 53 1,440 15.1%
2010 63 2,035 21.4%
Total 156 4,816 50.6%
Macquarie Prime REIT 16
156 Leases out of 190 leases expire by 2010 accounting for 50.6% of Gross Rental Income
1. Excludes leases in Renhe Spring Zongbei as it operates as a department store comprising concessionaries with short leases2. As a percentage of total gross rental income for the month of June 2008
Portfolio
30 July 2008
Portfolio top 10 tenants
Macquarie Prime REIT 17
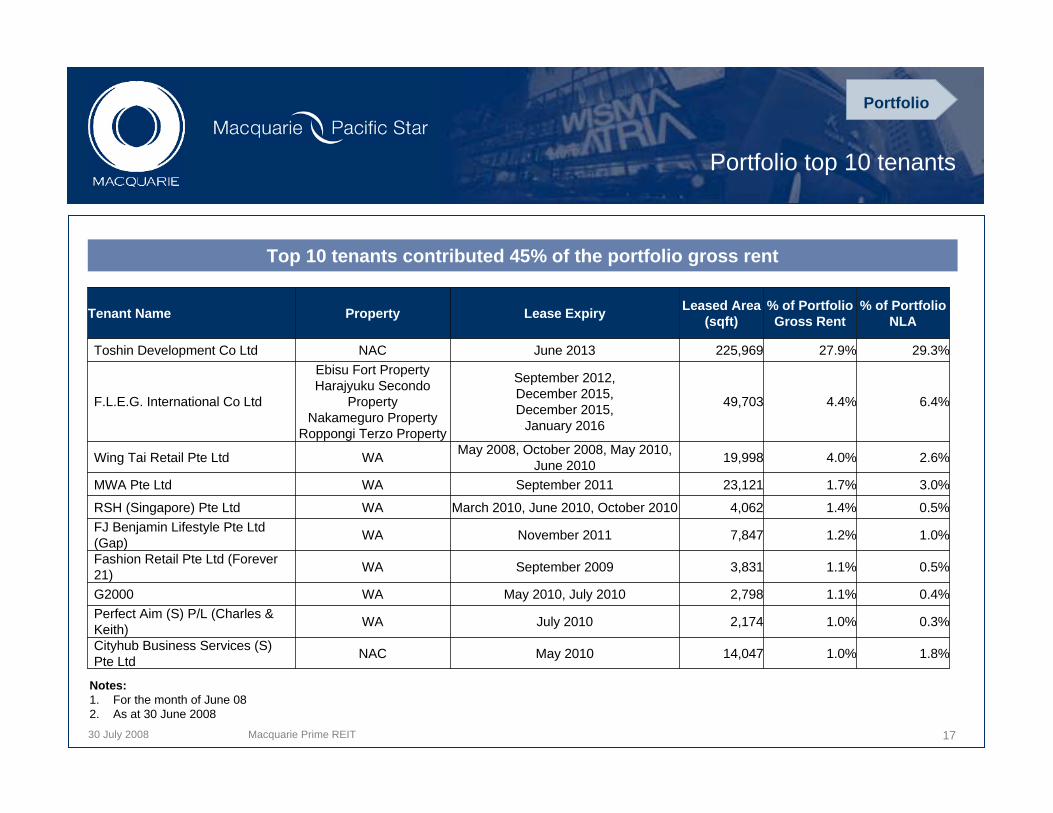
Top 10 tenants contributed 45% of the portfolio gross rent
Notes: 1. For the month of June 082. As at 30 June 2008
Portfolio
Tenant Name Property Lease Expiry Leased Area (sqft)
% of Portfolio Gross Rent
% of Portfolio NLA
Toshin Development Co Ltd NAC June 2013 225,969 27.9% 29.3%
F.L.E.G. International Co Ltd
Ebisu Fort PropertyHarajyuku Secondo
Property Nakameguro Property
Roppongi Terzo Property
September 2012, December 2015,December 2015,
January 2016
49,703 4.4% 6.4%
Wing Tai Retail Pte Ltd WA May 2008, October 2008, May 2010, June 2010 19,998 4.0% 2.6%
MWA Pte Ltd WA September 2011 23,121 1.7% 3.0%
RSH (Singapore) Pte Ltd WA March 2010, June 2010, October 2010 4,062 1.4% 0.5%FJ Benjamin Lifestyle Pte Ltd (Gap) WA November 2011 7,847 1.2% 1.0%
Fashion Retail Pte Ltd (Forever 21) WA September 2009 3,831 1.1% 0.5%
G2000 WA May 2010, July 2010 2,798 1.1% 0.4%Perfect Aim (S) P/L (Charles & Keith) WA July 2010 2,174 1.0% 0.3%
Cityhub Business Services (S) Pte Ltd NAC May 2010 14,047 1.0% 1.8%
30 July 2008
Singapore - Pro-active office leasing
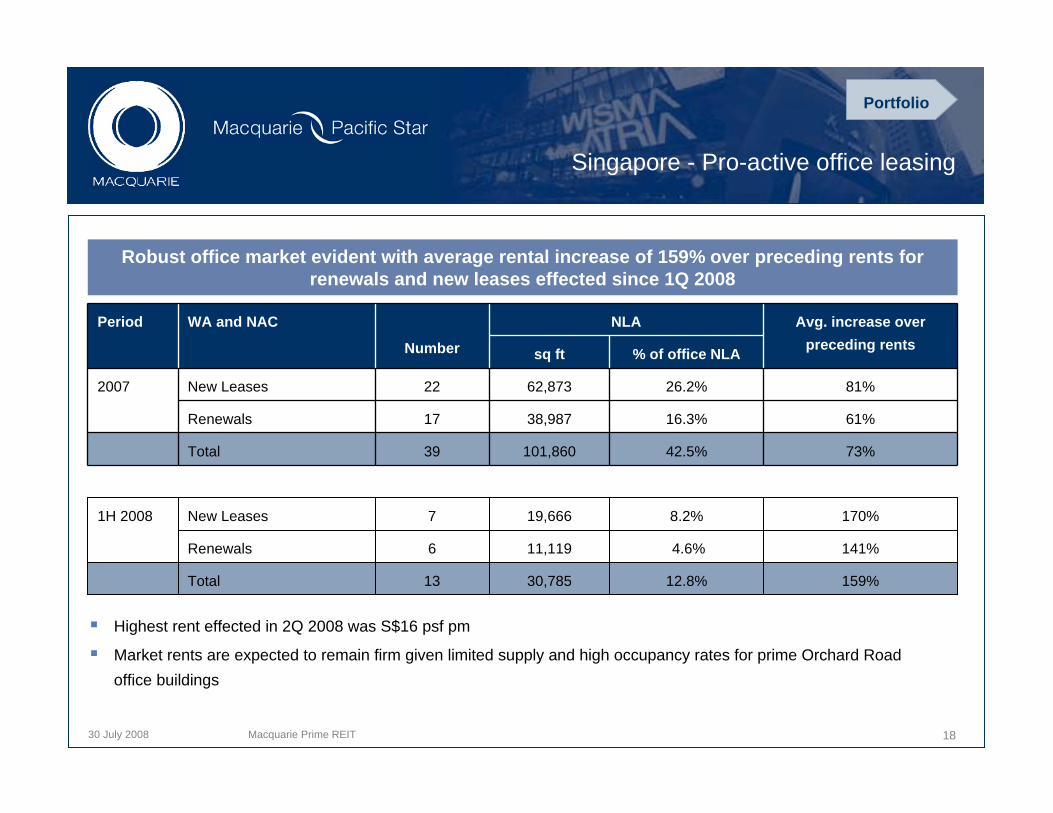
Period WA and NAC
Number
NLA Avg. increase over preceding rentssq ft % of office NLA
2007 New Leases 22 62,873 26.2% 81%
Renewals 17 38,987 16.3% 61%
Total 39 101,860 42.5% 73%
1H 2008 New Leases 7 19,666 8.2% 170%
Renewals 6 11,119 4.6% 141%
Total 13 30,785 12.8% 159%
Macquarie Prime REIT 18
Robust office market evident with average rental increase of 159% over preceding rents for renewals and new leases effected since 1Q 2008
Highest rent effected in 2Q 2008 was S$16 psf pm
Market rents are expected to remain firm given limited supply and high occupancy rates for prime Orchard Road office buildings
Portfolio
30 July 2008 Macquarie Prime REIT 19
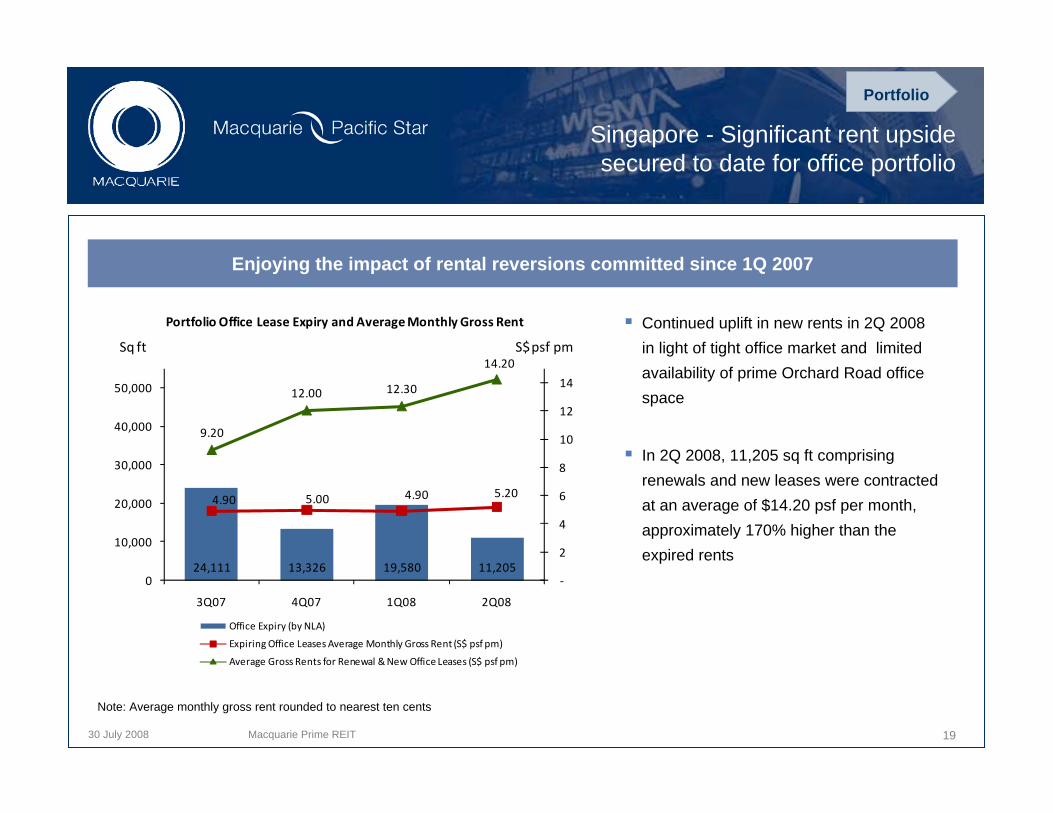
Continued uplift in new rents in 2Q 2008 in light of tight office market and limited availability of prime Orchard Road office space
In 2Q 2008, 11,205 sq ft comprising renewals and new leases were contracted at an average of $14.20 psf per month, approximately 170% higher than the expired rents
Enjoying the impact of rental reversions committed since 1Q 2007
Note: Average monthly gross rent rounded to nearest ten cents
Singapore - Significant rent upsidesecured to date for office portfolio
Portfolio
24,111 13,326 19,580 11,205
4.90 5.00 4.90 5.20
9.20
12.00 12.30
14.20
‐
2
4
6
8
10
12
14
0
10,000
20,000
30,000
40,000
50,000
3Q07 4Q07 1Q08 2Q08
Portfolio Office Lease Expiry and Average Monthly Gross Rent
Office Expiry (by NLA)
Expiring Office Leases Average Monthly Gross Rent (S$ psf pm)
Average Gross Rents for Renewal & New Office Leases (S$ psf pm)
Sq ft S$ psf pm
30 July 2008 Macquarie Prime REIT 20
Rental reversions:Robust office rent contribution expected
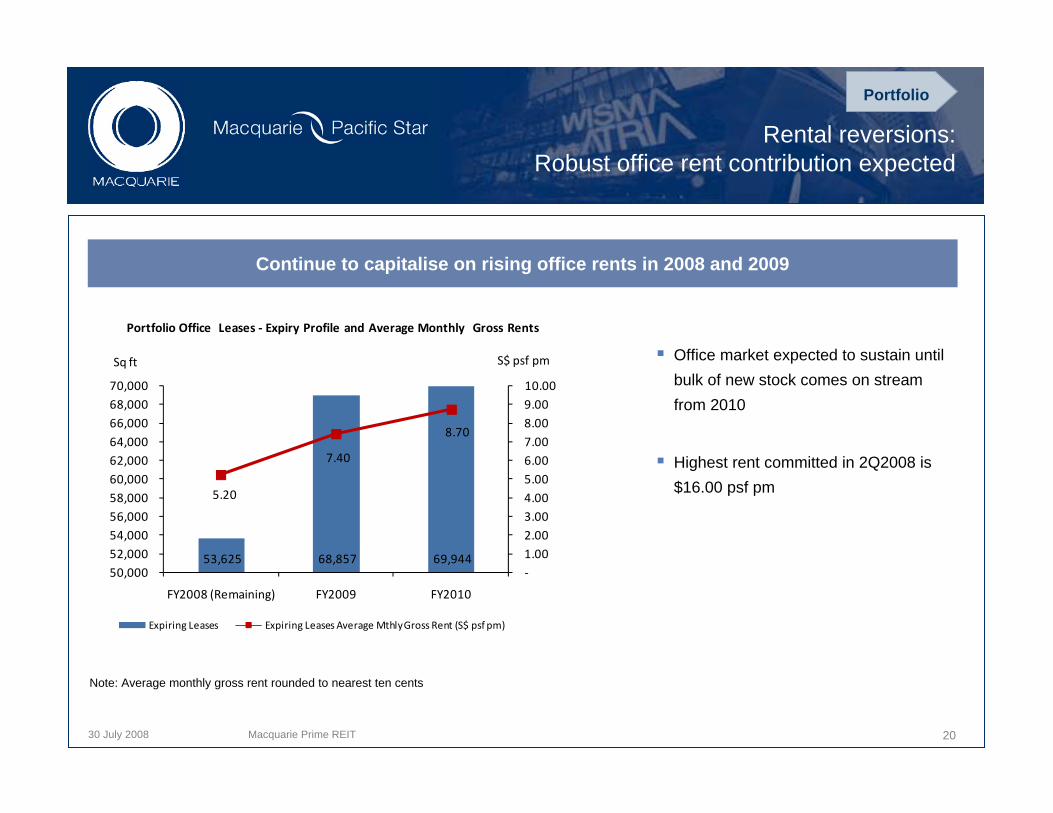
Office market expected to sustain until bulk of new stock comes on stream from 2010
Highest rent committed in 2Q2008 is $16.00 psf pm
Note: Average monthly gross rent rounded to nearest ten cents
Continue to capitalise on rising office rents in 2008 and 2009
Portfolio
53,625 68,857 69,944
5.20
7.40
8.70
‐1.00 2.00 3.00 4.00 5.00 6.00 7.00 8.00 9.00 10.00
50,000 52,000 54,000 56,000 58,000 60,000 62,000 64,000 66,000 68,000 70,000
FY2008 (Remaining) FY2009 FY2010
Expiring Leases Expiring Leases Average Mthly Gross Rent (S$ psf pm)
S$ psf pmSq ft
Portfolio Office Leases ‐ Expiry Profile and Average Monthly Gross Rents
30 July 2008
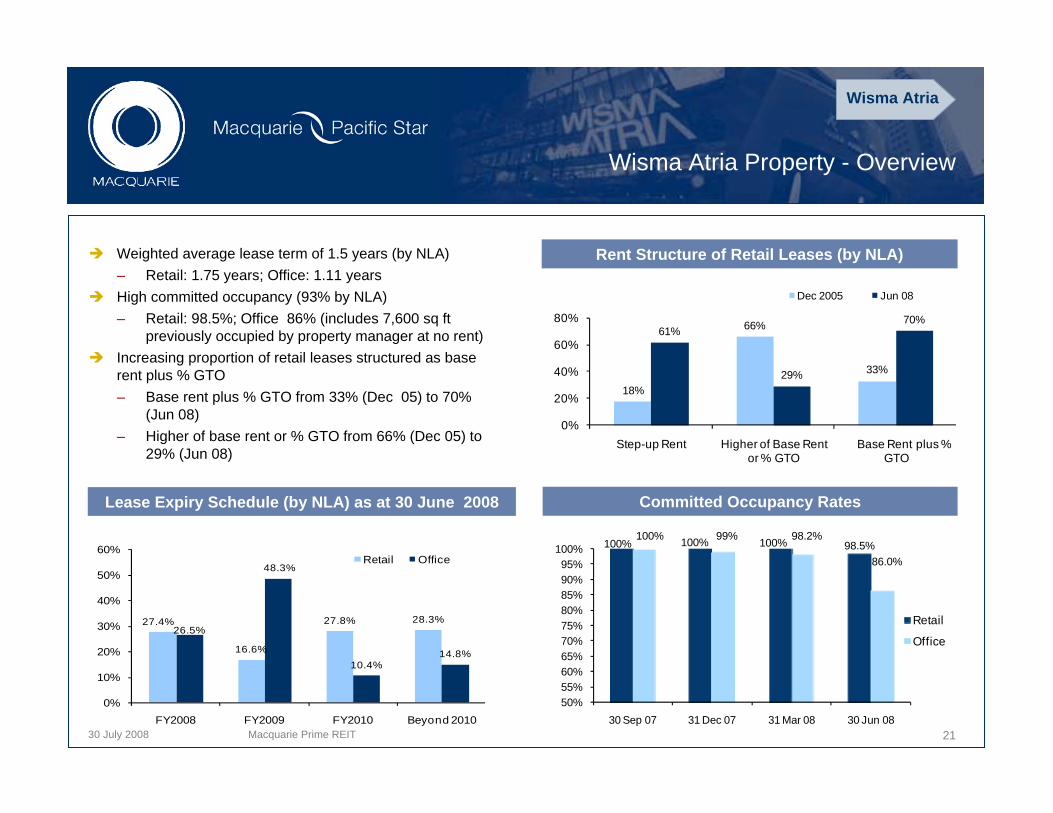
Wisma Atria Property - Overview
Committed Occupancy RatesLease Expiry Schedule (by NLA) as at 30 June 2008
Weighted average lease term of 1.5 years (by NLA)– Retail: 1.75 years; Office: 1.11 yearsHigh committed occupancy (93% by NLA) – Retail: 98.5%; Office 86% (includes 7,600 sq ft
previously occupied by property manager at no rent)Increasing proportion of retail leases structured as base rent plus % GTO– Base rent plus % GTO from 33% (Dec 05) to 70%
(Jun 08)– Higher of base rent or % GTO from 66% (Dec 05) to
29% (Jun 08)
Rent Structure of Retail Leases (by NLA)
Wisma Atria
21Macquarie Prime REIT
27.4%
16.6%
27.8% 28.3%26.5%
48.3%
10.4%14.8%
0%
10%
20%
30%
40%
50%
60%
FY2008 FY2009 FY2010 Beyond 2010
Retail Office
18%
66%
33%
61%
29%
70%
0%
20%
40%
60%
80%
Step-up Rent Higher of Base Rent or % GTO
Base Rent plus % GTO
Dec 2005 Jun 08
100% 100% 100% 98.5%100% 99% 98.2%
86.0%
50%55%60%65%70%75%80%85%90%95%
100%
30 Sep 07 31 Dec 07 31 Mar 08 30 Jun 08
Retail
Office
30 July 2008 22
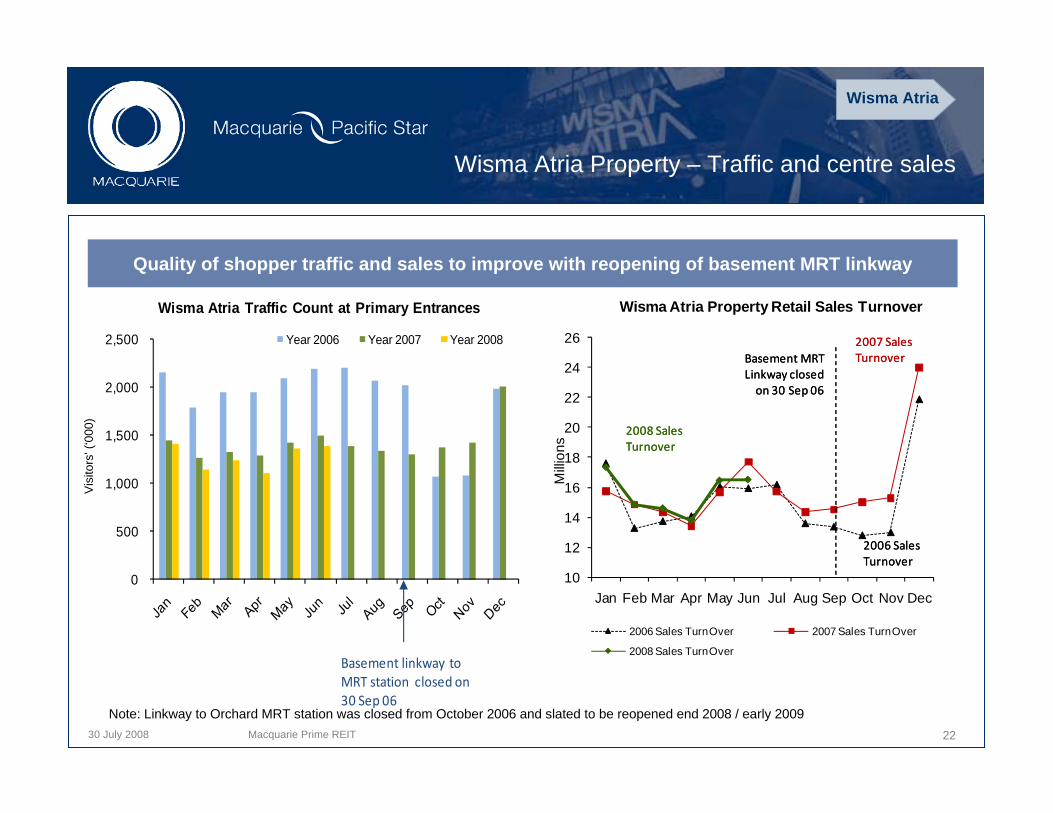
Wisma Atria Property – Traffic and centre sales
Note: Linkway to Orchard MRT station was closed from October 2006 and slated to be reopened end 2008 / early 2009
Wisma Atria
Macquarie Prime REIT
Vis
itors
' (‘0
00)
0
500
1,000
1,500
2,000
2,500
Wisma Atria Traffic Count at Primary Entrances
Year 2006 Year 2007 Year 2008
Basement linkway to MRT station closed on 30 Sep 06
10
12
14
16
18
20
22
24
26
Jan Feb Mar Apr May Jun Jul Aug Sep Oct Nov Dec
Milli
ons
Wisma Atria Property Retail Sales Turnover
2006 Sales TurnOver 2007 Sales TurnOver
2008 Sales TurnOver
2007 Sales Turnover
2006 Sales Turnover
2008 Sales Turnover
Basement MRT Linkway closed on 30 Sep 06
2007 Sales Turnover
2006 Sales Turnover
2008 Sales Turnover
Basement MRT Linkway closed on 30 Sep 06
Quality of shopper traffic and sales to improve with reopening of basement MRT linkway
30 July 2008
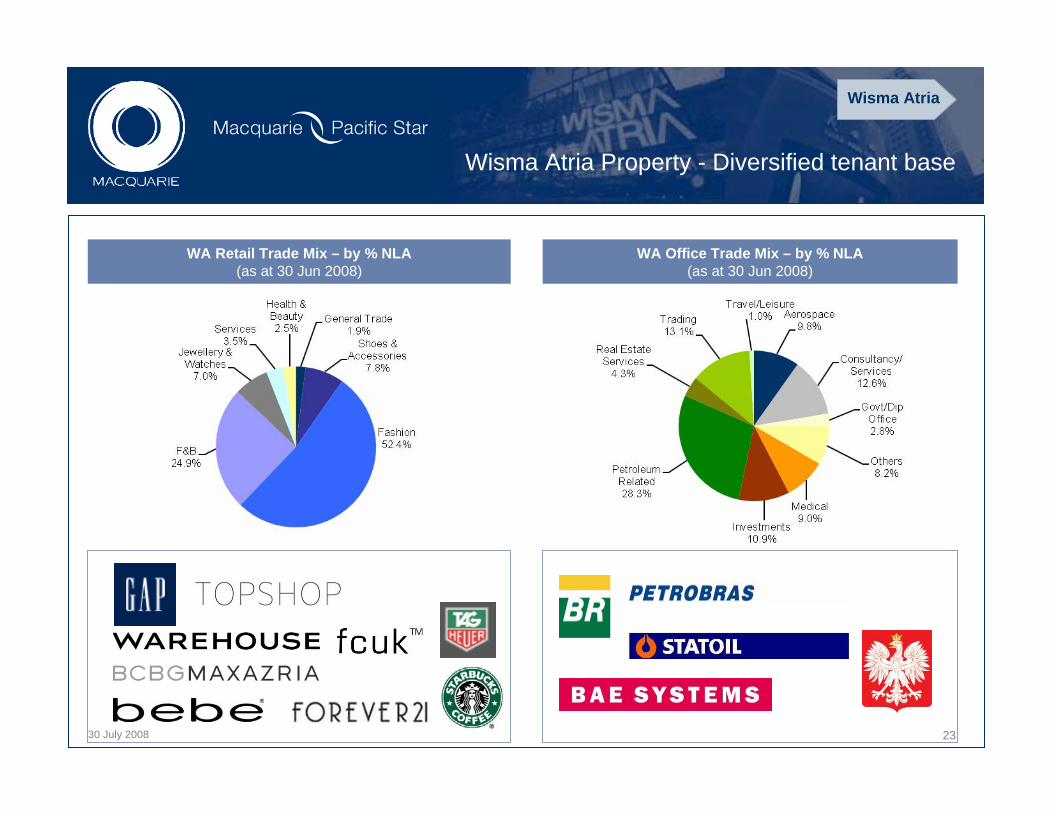
Wisma Atria Property - Diversified tenant base
WA Office Trade Mix – by % NLA(as at 30 Jun 2008)
WA Retail Trade Mix – by % NLA(as at 30 Jun 2008)
Wisma Atria
23
30 July 2008
0% 0% 0%
78%
5%
78%
0%10%20%30%40%50%60%70%80%90%
Step-up Rent Higher of Base Rent or % GTO
Base Rent plus % GTO
Dec 2005 Jun 2008
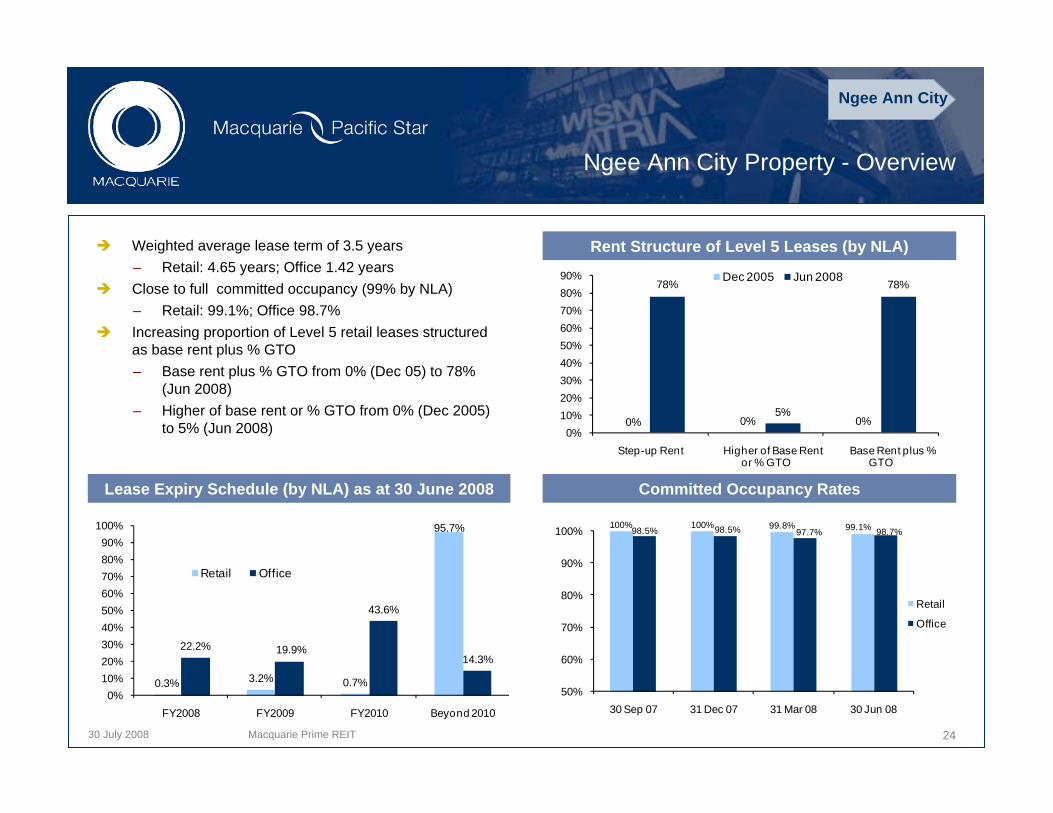
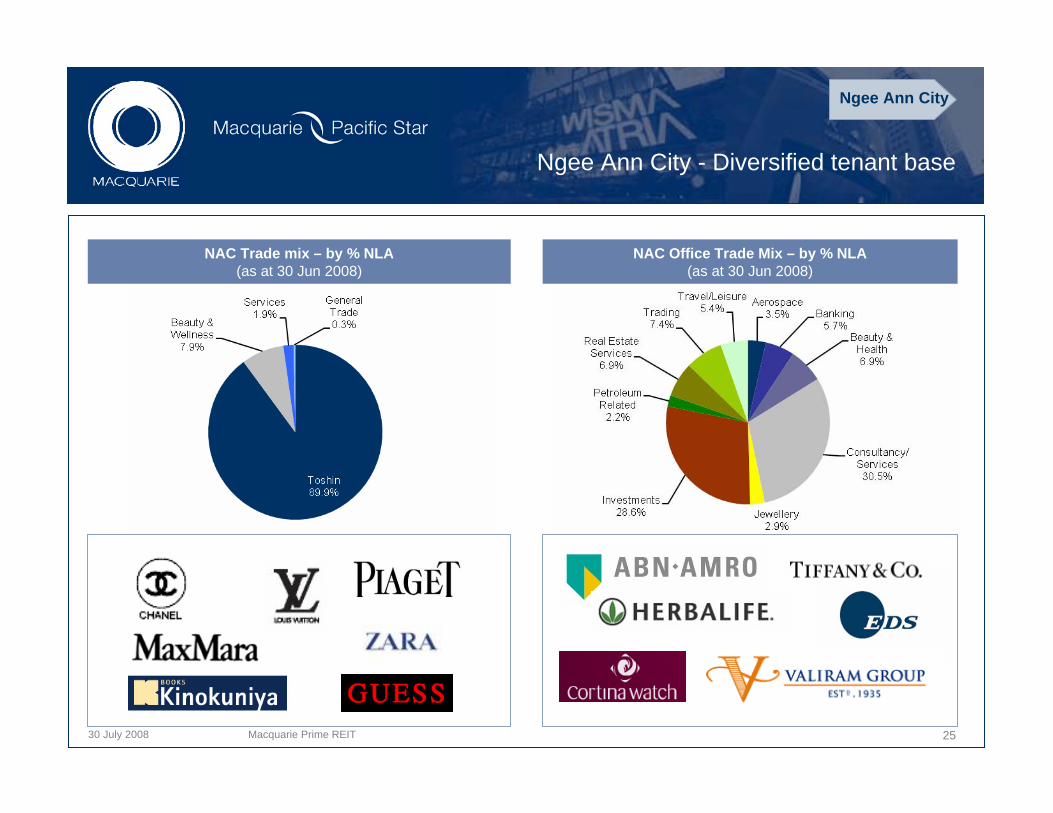
Ngee Ann City Property - Overview
Committed Occupancy RatesLease Expiry Schedule (by NLA) as at 30 June 2008
Weighted average lease term of 3.5 years – Retail: 4.65 years; Office 1.42 yearsClose to full committed occupancy (99% by NLA) – Retail: 99.1%; Office 98.7%Increasing proportion of Level 5 retail leases structured as base rent plus % GTO– Base rent plus % GTO from 0% (Dec 05) to 78%
(Jun 2008)– Higher of base rent or % GTO from 0% (Dec 2005)
to 5% (Jun 2008)
Rent Structure of Level 5 Leases (by NLA)
Ngee Ann City
24Macquarie Prime REIT
0.3% 3.2% 0.7%
95.7%
22.2% 19.9%
43.6%
14.3%
0%10%20%30%40%50%60%70%80%90%
100%
FY2008 FY2009 FY2010 Beyond 2010
Retail Office
100% 100% 99.8% 99.1%98.5% 98.5% 97.7% 98.7%
50%
60%
70%
80%
90%
100%
30 Sep 07 31 Dec 07 31 Mar 08 30 Jun 08
Retail
Office
30 July 2008
Ngee Ann City - Diversified tenant base
NAC Trade mix – by % NLA(as at 30 Jun 2008)
Ngee Ann City
NAC Office Trade Mix – by % NLA(as at 30 Jun 2008)
25Macquarie Prime REIT
30 July 2008
Japan Properties - Overview
100% 100% 100% 100% 100% 100% 100%
0%10%20%30%40%50%60%70%80%90%
100%
Hol
on L
Har
ajyu
ku
Rop
pong
iTe
rzo
Rop
pong
iP
rimo
Nak
a-m
egur
o
Dai
kan-
yam
a
Ebi
su F
ort
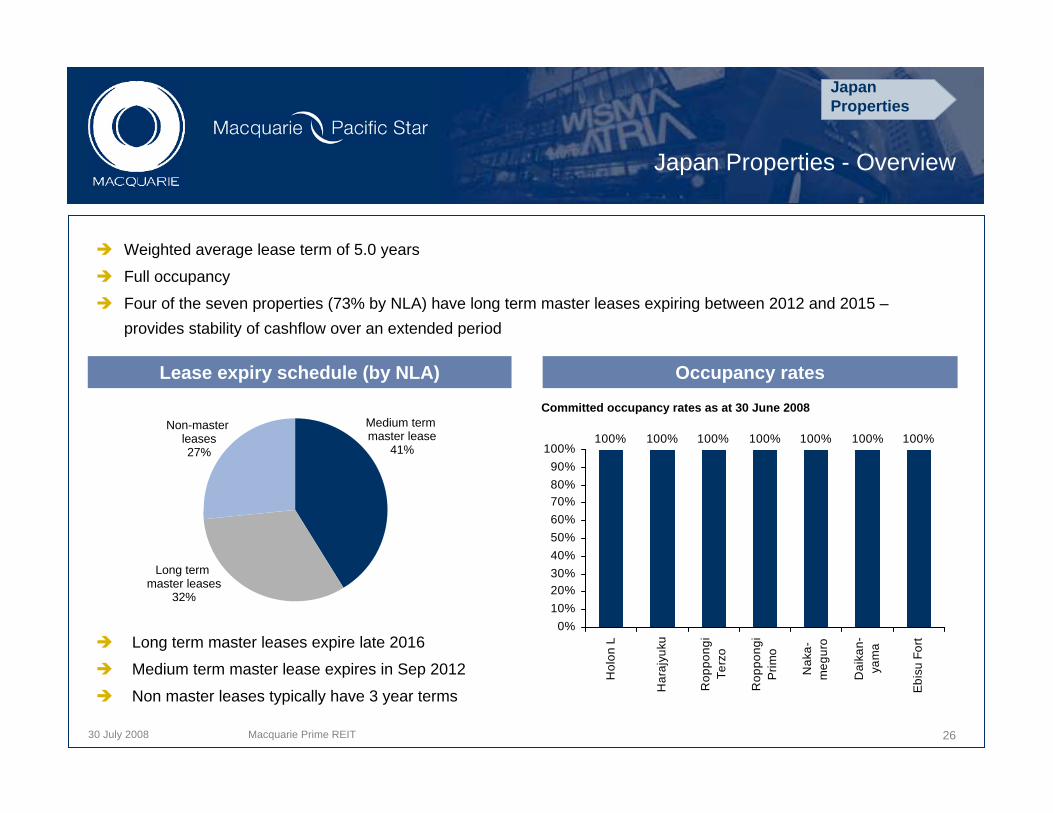
Occupancy ratesLease expiry schedule (by NLA)
Weighted average lease term of 5.0 years
Full occupancy
Four of the seven properties (73% by NLA) have long term master leases expiring between 2012 and 2015 –provides stability of cashflow over an extended period
Committed occupancy rates as at 30 June 2008
Long term master leases expire late 2016
Medium term master lease expires in Sep 2012
Non master leases typically have 3 year terms
Medium term master lease
41%
Non-master leases27%
Long term master leases
32%
Japan Properties
26Macquarie Prime REIT
30 July 2008
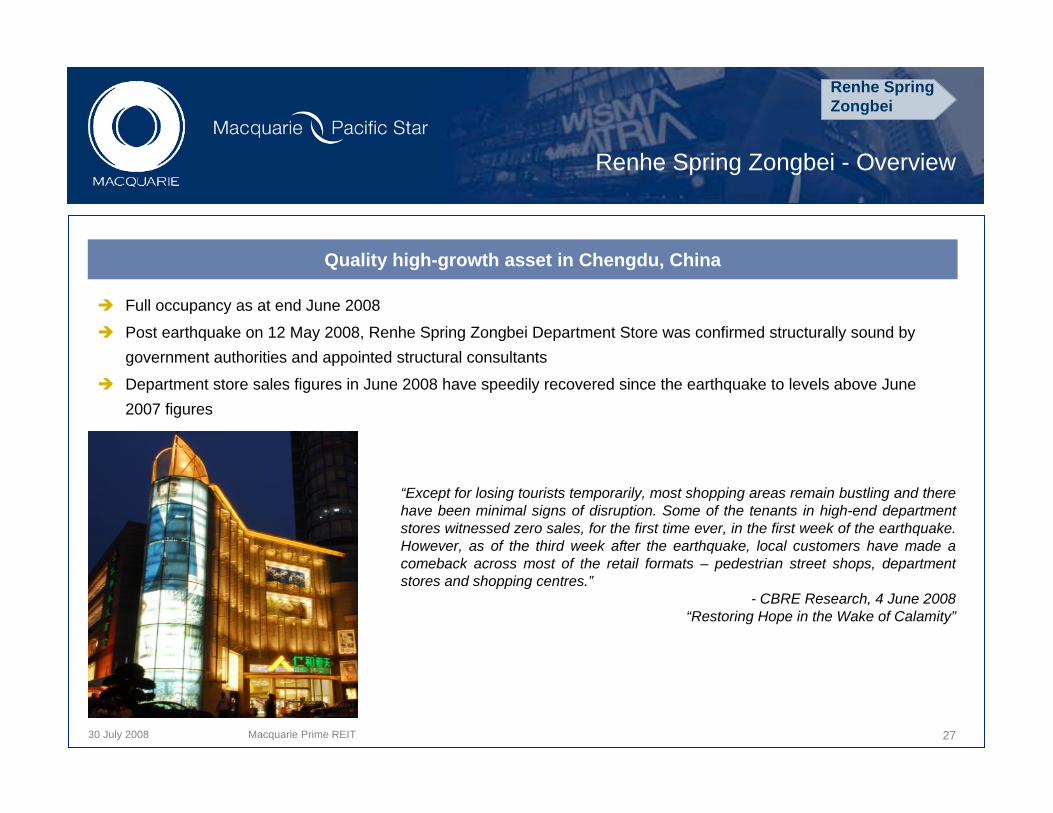
Full occupancy as at end June 2008
Post earthquake on 12 May 2008, Renhe Spring Zongbei Department Store was confirmed structurally sound by government authorities and appointed structural consultants
Department store sales figures in June 2008 have speedily recovered since the earthquake to levels above June 2007 figures
27Macquarie Prime REIT
“Except for losing tourists temporarily, most shopping areas remain bustling and there have been minimal signs of disruption. Some of the tenants in high-end department stores witnessed zero sales, for the first time ever, in the first week of the earthquake. However, as of the third week after the earthquake, local customers have made a comeback across most of the retail formats – pedestrian street shops, department stores and shopping centres.”
- CBRE Research, 4 June 2008 “Restoring Hope in the Wake of Calamity”
Quality high-growth asset in Chengdu, China
Renhe Spring Zongbei - Overview
Renhe Spring Zongbei
30 July 2008
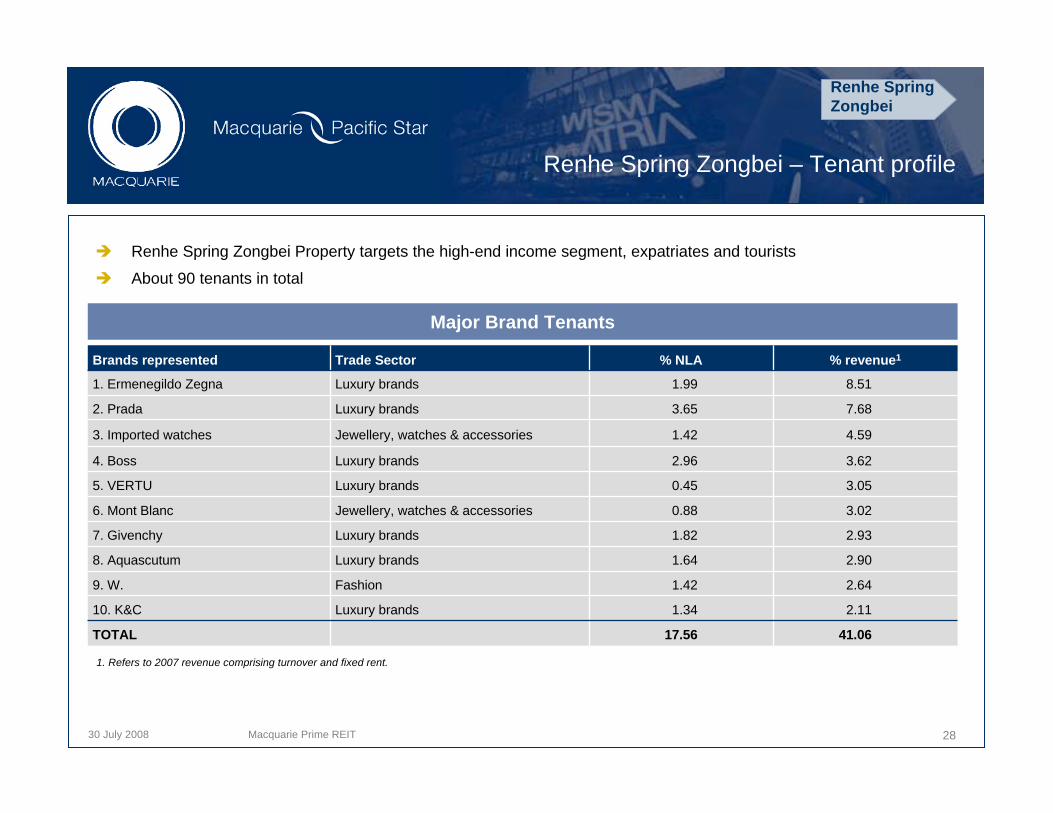
Renhe Spring Zongbei – Tenant profile
Renhe Spring Zongbei Property targets the high-end income segment, expatriates and tourists
About 90 tenants in total
Brands represented Trade Sector % NLA % revenue1
1. Ermenegildo Zegna Luxury brands 1.99 8.51
2. Prada Luxury brands 3.65 7.68
3. Imported watches Jewellery, watches & accessories 1.42 4.59
4. Boss Luxury brands 2.96 3.62
5. VERTU Luxury brands 0.45 3.05
6. Mont Blanc Jewellery, watches & accessories 0.88 3.02
7. Givenchy Luxury brands 1.82 2.93
8. Aquascutum Luxury brands 1.64 2.90
9. W. Fashion 1.42 2.64
10. K&C Luxury brands 1.34 2.11
TOTAL 17.56 41.06
1. Refers to 2007 revenue comprising turnover and fixed rent.
Major Brand Tenants
Renhe Spring Zongbei
28Macquarie Prime REIT
30 July 2008
Agenda
Financial Highlights
Portfolio Performance Update– Singapore– Tokyo
Growth Strategies– Asset Enhancements
29Macquarie Prime REIT
30 July 2008
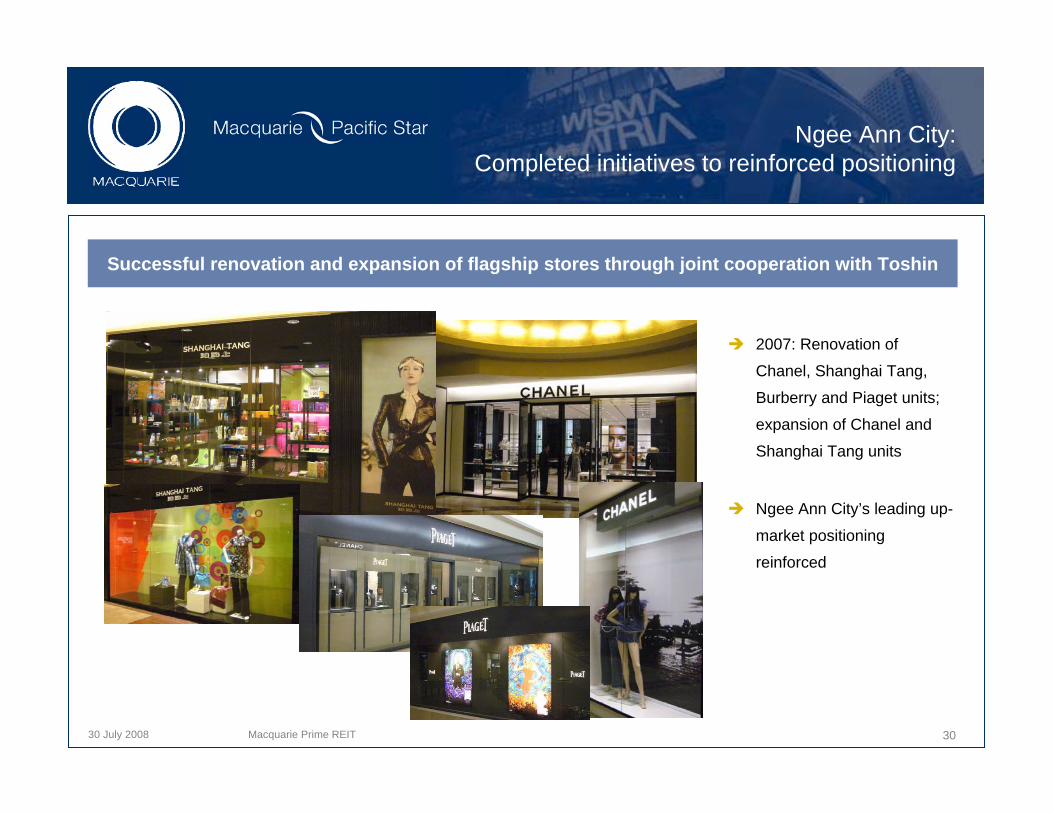
Ngee Ann City:Completed initiatives to reinforced positioning
Successful renovation and expansion of flagship stores through joint cooperation with Toshin
2007: Renovation of
Chanel, Shanghai Tang,
Burberry and Piaget units;
expansion of Chanel and
Shanghai Tang units
Ngee Ann City’s leading up-
market positioning
reinforced
30Macquarie Prime REIT

30 July 2008
Ngee Ann City:Toshin’s new tenants
Ngee Ann City positioning strengthened by new concept stores brought in by Toshin
31Macquarie Prime REIT
30 July 2008
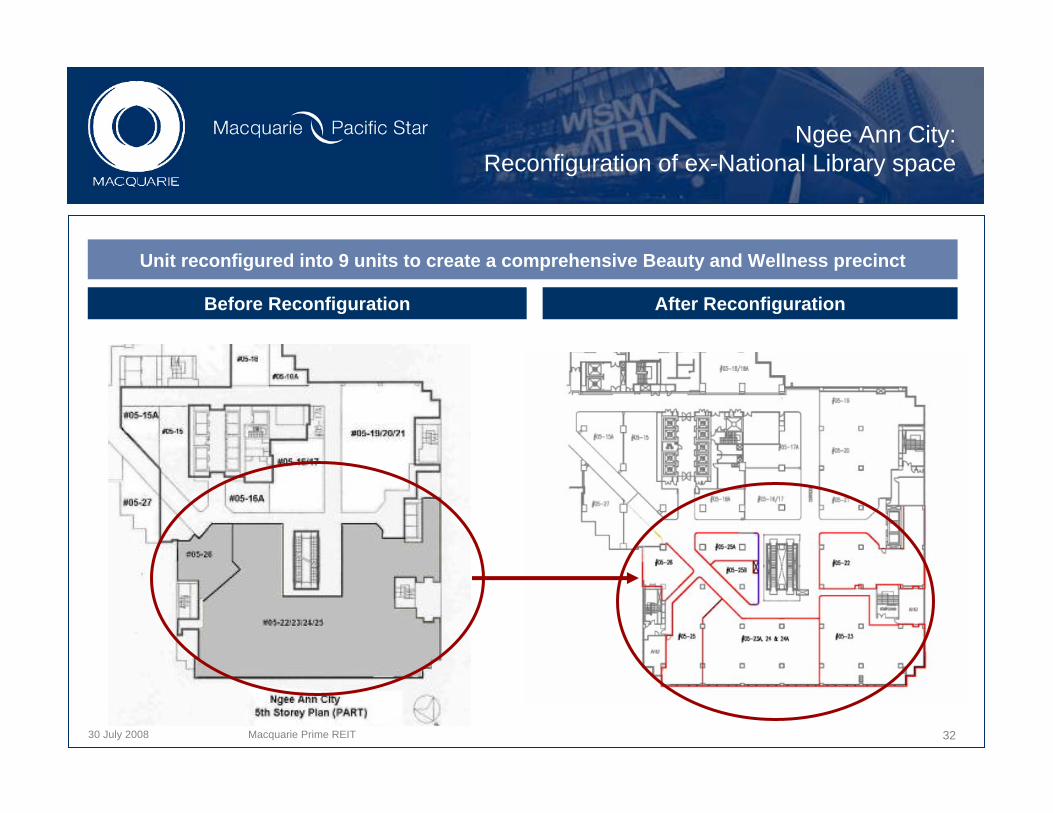
Ngee Ann City:Reconfiguration of ex-National Library space
Unit reconfigured into 9 units to create a comprehensive Beauty and Wellness precinct
After ReconfigurationBefore Reconfiguration
Macquarie Prime REIT 32

30 July 2008 33
Ngee Ann City:Level 5 trade mix after reconfiguration of ex-NLB space
Creating a comprehensive beauty and wellness precinct
Macquarie Prime REIT
30 July 2008
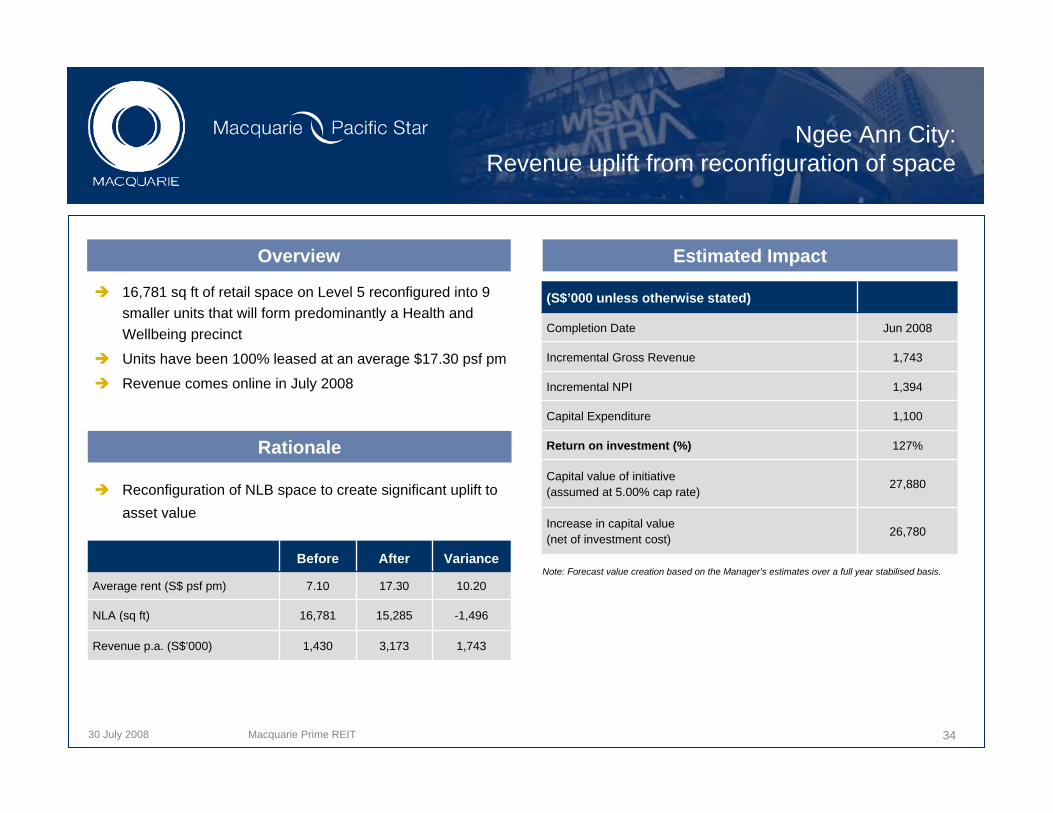
Ngee Ann City:Revenue uplift from reconfiguration of space
(S$’000 unless otherwise stated)
Completion Date Jun 2008
Incremental Gross Revenue 1,743
Incremental NPI 1,394
Capital Expenditure 1,100
Return on investment (%) 127%
Capital value of initiative (assumed at 5.00% cap rate)
27,880
Increase in capital value (net of investment cost) 26,780
Before After Variance
Average rent (S$ psf pm) 7.10 17.30 10.20
NLA (sq ft) 16,781 15,285 -1,496
Revenue p.a. (S$’000) 1,430 3,173 1,743
16,781 sq ft of retail space on Level 5 reconfigured into 9 smaller units that will form predominantly a Health and Wellbeing precinct
Units have been 100% leased at an average $17.30 psf pm
Revenue comes online in July 2008
Reconfiguration of NLB space to create significant uplift to asset value
Note: Forecast value creation based on the Manager’s estimates over a full year stabilised basis.
Overview
Rationale
Estimated Impact
Macquarie Prime REIT 34

30 July 2008
Wisma Atria:Continuing tenant remix to enhance positioning
Select new concept stores in 2007
Dorothy Perkins
SINO London
TOUGHJeansmith
Beijaflor
35
New stores in 1Q 2008
Jayson Brunsdon
TROIS + INCH
Levi’s® LadyMacquarie Prime REIT
30 July 2008
Wisma Atria:Continuing tenant remix to enhance positioning
and increase revenues
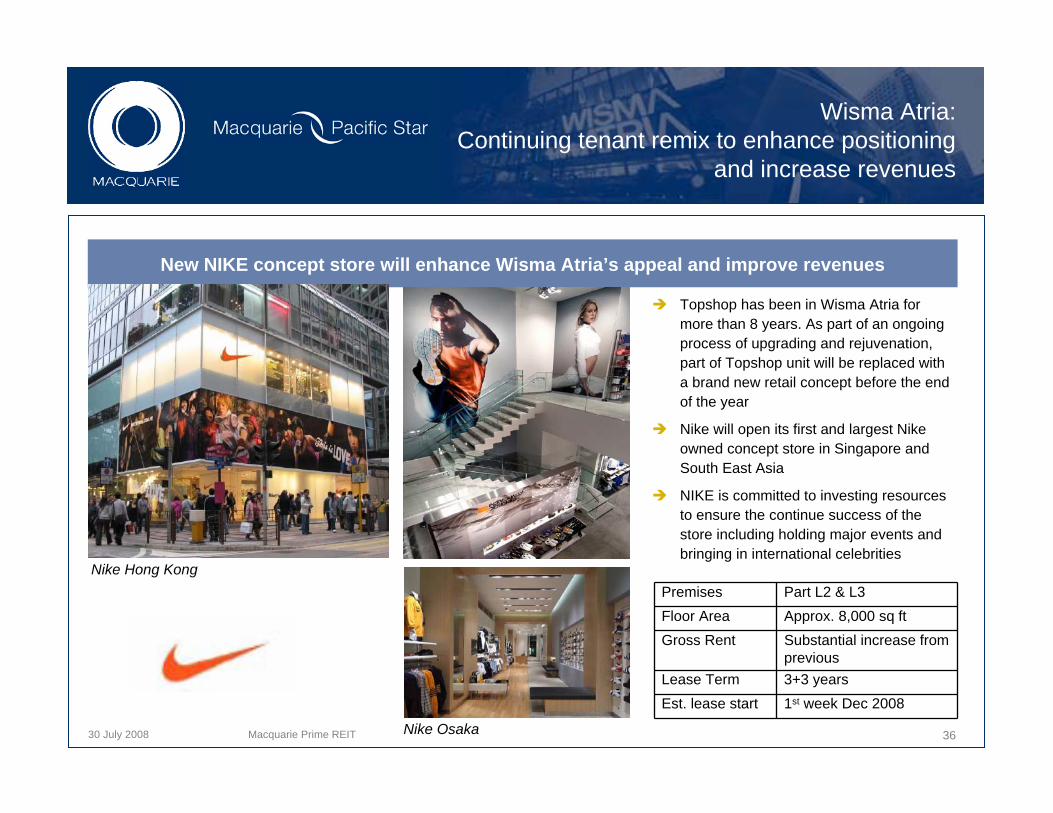
New NIKE concept store will enhance Wisma Atria’s appeal and improve revenues
Nike Hong Kong
Nike Osaka
Topshop has been in Wisma Atria for more than 8 years. As part of an ongoing process of upgrading and rejuvenation, part of Topshop unit will be replaced with a brand new retail concept before the end of the year
Nike will open its first and largest Nike owned concept store in Singapore and South East Asia
NIKE is committed to investing resources to ensure the continue success of the store including holding major events and bringing in international celebrities
Premises Part L2 & L3 Floor Area Approx. 8,000 sq ftGross Rent Substantial increase from
previousLease Term 3+3 yearsEst. lease start 1st week Dec 2008
Macquarie Prime REIT 36
30 July 2008 37
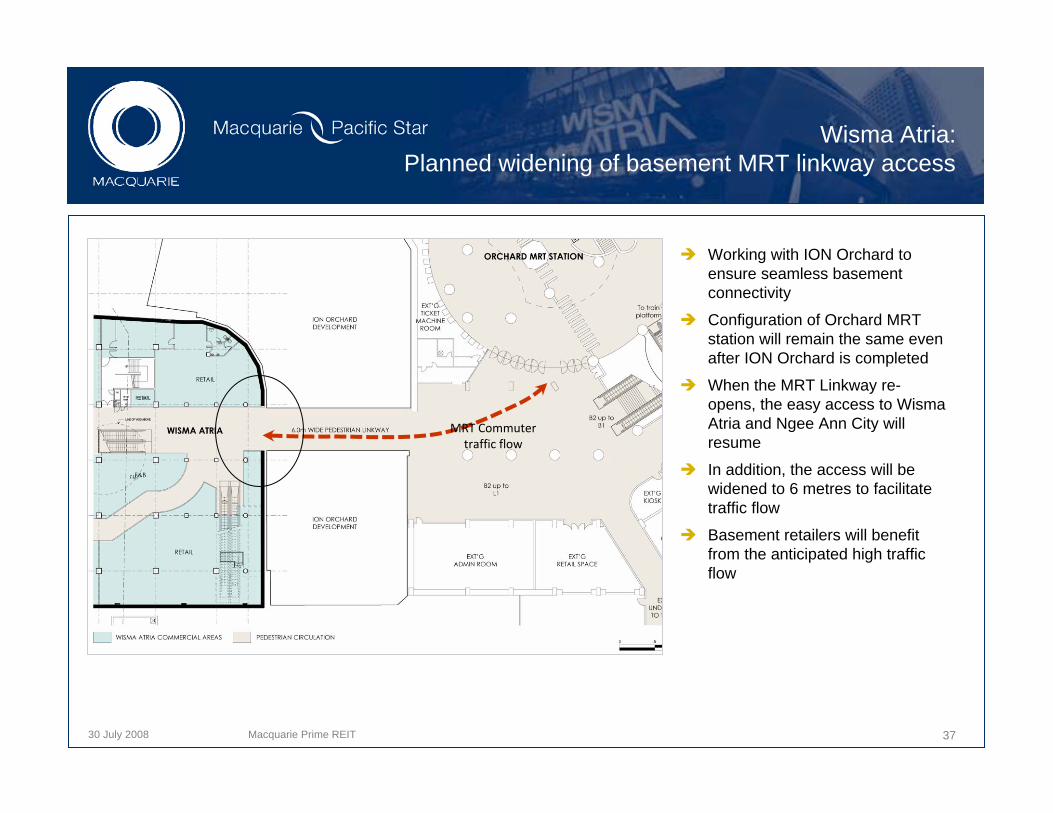
MRT Commuter traffic flow
Working with ION Orchard to ensure seamless basement connectivity
Configuration of Orchard MRT station will remain the same even after ION Orchard is completed
When the MRT Linkway re-opens, the easy access to Wisma Atria and Ngee Ann City will resume
In addition, the access will be widened to 6 metres to facilitate traffic flow
Basement retailers will benefit from the anticipated high traffic flow
Wisma Atria:Planned widening of basement MRT linkway access
Macquarie Prime REIT
30 July 2008
Wisma Atria:Expected uplift when MRT linkway re-opens
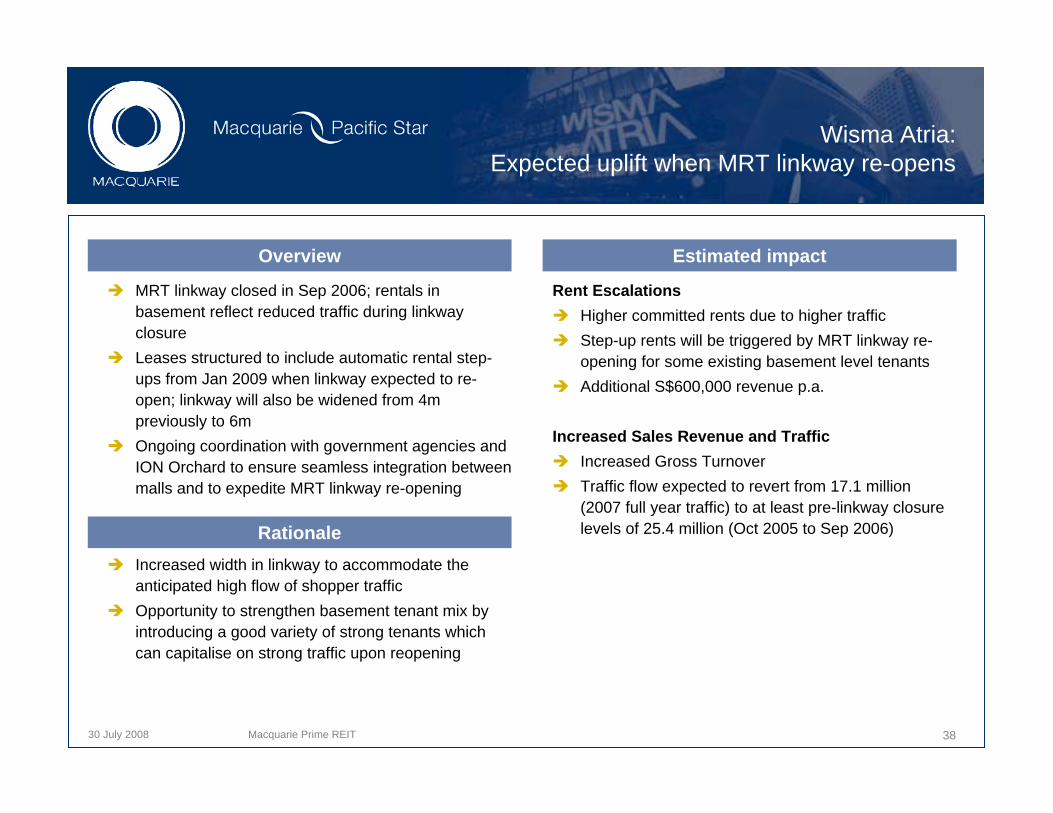
MRT linkway closed in Sep 2006; rentals in basement reflect reduced traffic during linkway closureLeases structured to include automatic rental step-ups from Jan 2009 when linkway expected to re-open; linkway will also be widened from 4m previously to 6mOngoing coordination with government agencies and ION Orchard to ensure seamless integration between malls and to expedite MRT linkway re-opening
Overview
Rationale
Estimated impact
Rent Escalations Higher committed rents due to higher trafficStep-up rents will be triggered by MRT linkway re-opening for some existing basement level tenantsAdditional S$600,000 revenue p.a.
Increased Sales Revenue and Traffic Increased Gross TurnoverTraffic flow expected to revert from 17.1 million (2007 full year traffic) to at least pre-linkway closure levels of 25.4 million (Oct 2005 to Sep 2006)
Increased width in linkway to accommodate the anticipated high flow of shopper traffic Opportunity to strengthen basement tenant mix by introducing a good variety of strong tenants which can capitalise on strong traffic upon reopening
38Macquarie Prime REIT
30 July 2008
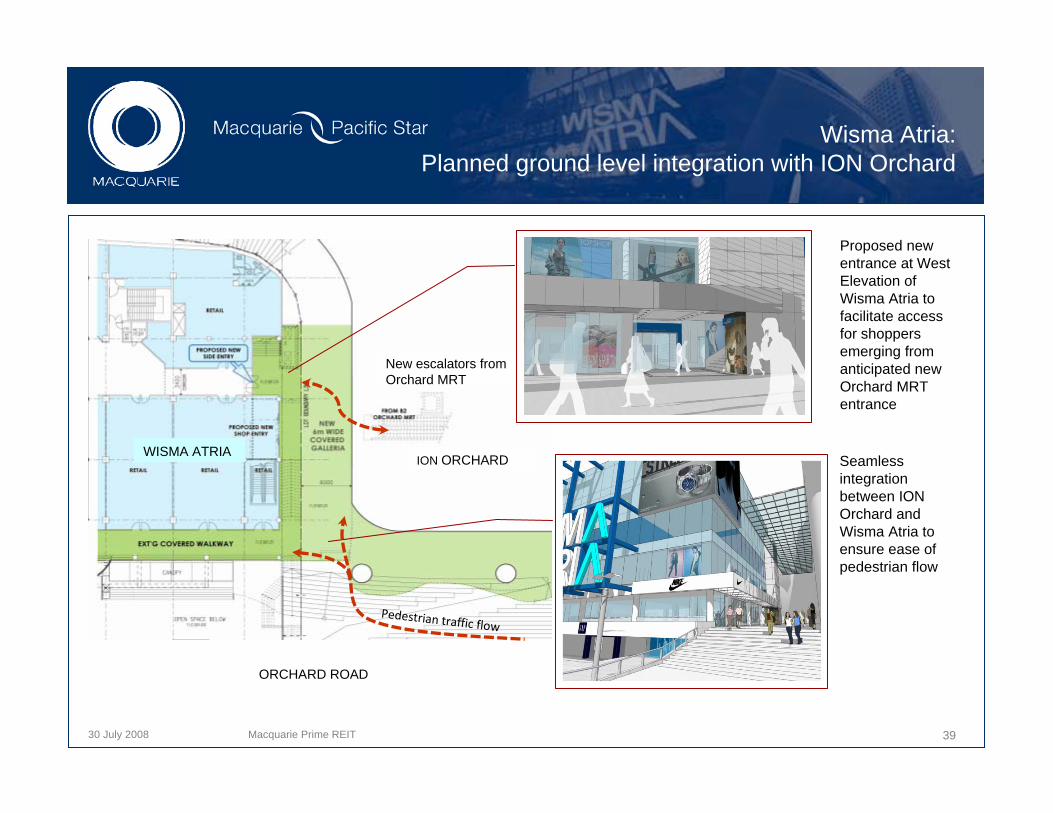
Wisma Atria:Planned ground level integration with ION Orchard
ORCHARD ROAD
ION ORCHARDWISMA ATRIA
New escalators from Orchard MRT
Proposed new entrance at West Elevation of Wisma Atria to facilitate access for shoppers emerging from anticipated new Orchard MRT entrance
Seamless integration between ION Orchard and Wisma Atria to ensure ease of pedestrian flow
Pedestrian traffic flow
Macquarie Prime REIT 39
30 July 2008
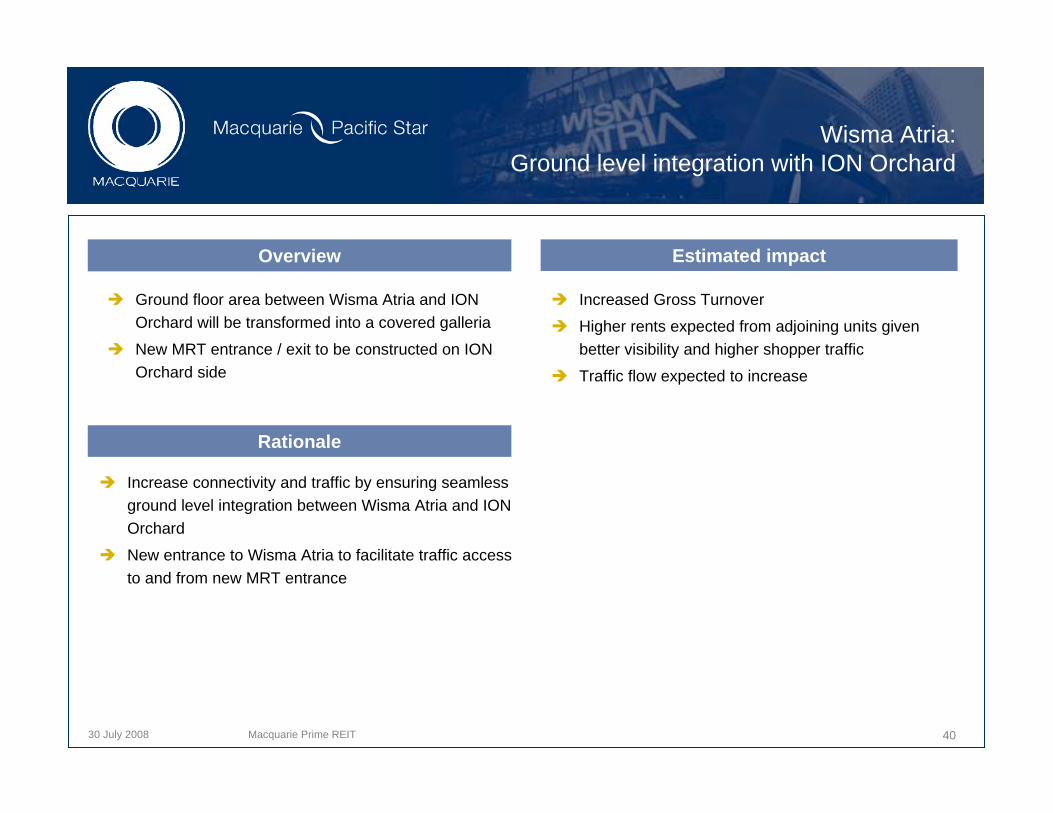
Wisma Atria:Ground level integration with ION Orchard
Ground floor area between Wisma Atria and ION Orchard will be transformed into a covered galleria
New MRT entrance / exit to be constructed on ION Orchard side
Overview
Rationale
Estimated impact
Increased Gross Turnover
Higher rents expected from adjoining units given better visibility and higher shopper traffic
Traffic flow expected to increase
Increase connectivity and traffic by ensuring seamless ground level integration between Wisma Atria and ION Orchard
New entrance to Wisma Atria to facilitate traffic access to and from new MRT entrance
40Macquarie Prime REIT
30 July 2008
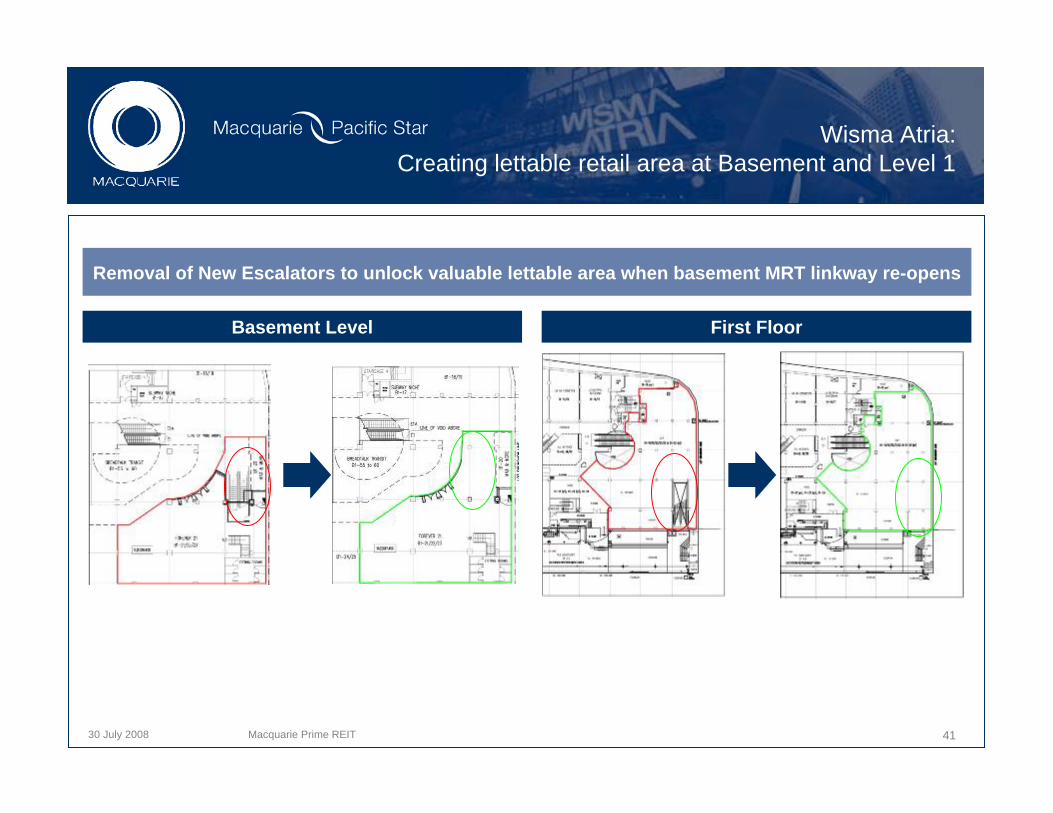
First FloorBasement Level
Wisma Atria:Creating lettable retail area at Basement and Level 1
Removal of New Escalators to unlock valuable lettable area when basement MRT linkway re-opens
41Macquarie Prime REIT
30 July 2008
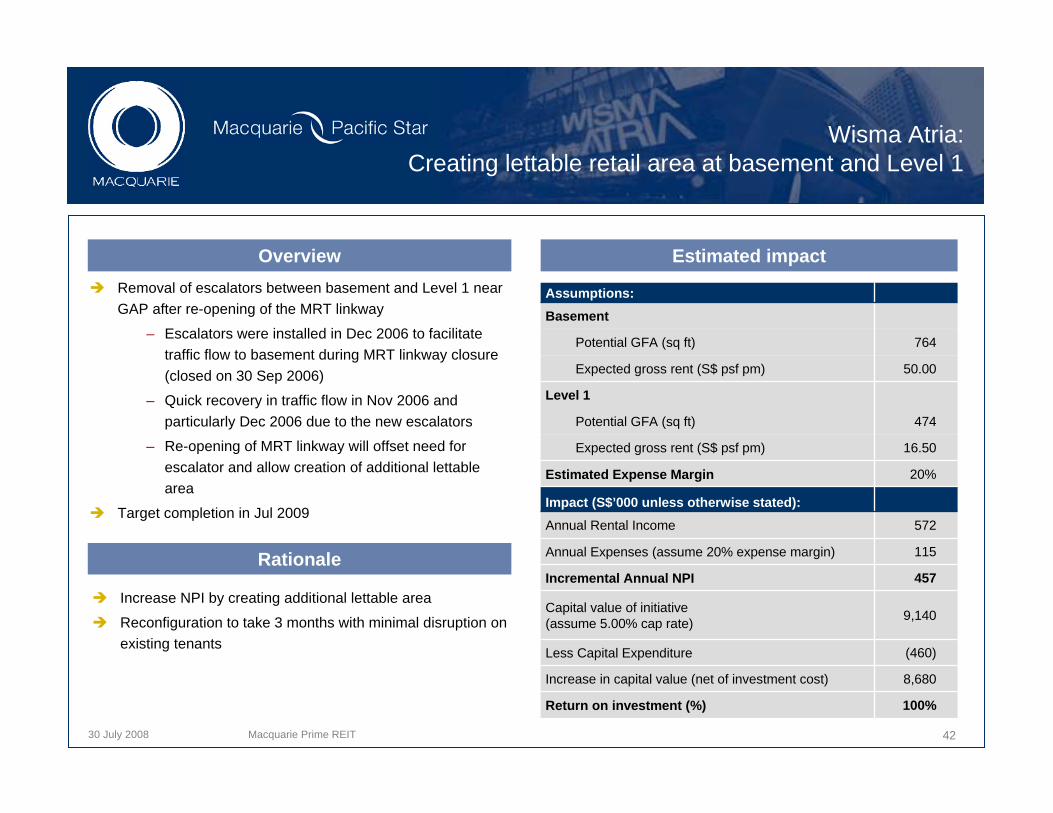
Assumptions:Basement
Potential GFA (sq ft) 764
Expected gross rent (S$ psf pm) 50.00
Level 1
Potential GFA (sq ft) 474
Expected gross rent (S$ psf pm) 16.50
Estimated Expense Margin 20%
Impact (S$’000 unless otherwise stated):Annual Rental Income 572
Annual Expenses (assume 20% expense margin) 115
Incremental Annual NPI 457
Capital value of initiative (assume 5.00% cap rate) 9,140
Less Capital Expenditure (460)
Increase in capital value (net of investment cost) 8,680
Return on investment (%) 100%
Removal of escalators between basement and Level 1 near GAP after re-opening of the MRT linkway
– Escalators were installed in Dec 2006 to facilitate traffic flow to basement during MRT linkway closure (closed on 30 Sep 2006)
– Quick recovery in traffic flow in Nov 2006 and particularly Dec 2006 due to the new escalators
– Re-opening of MRT linkway will offset need for escalator and allow creation of additional lettable area
Target completion in Jul 2009
Increase NPI by creating additional lettable area
Reconfiguration to take 3 months with minimal disruption on existing tenants
Wisma Atria:Creating lettable retail area at basement and Level 1
Overview
Rationale
Estimated impact
Macquarie Prime REIT 42
30 July 2008
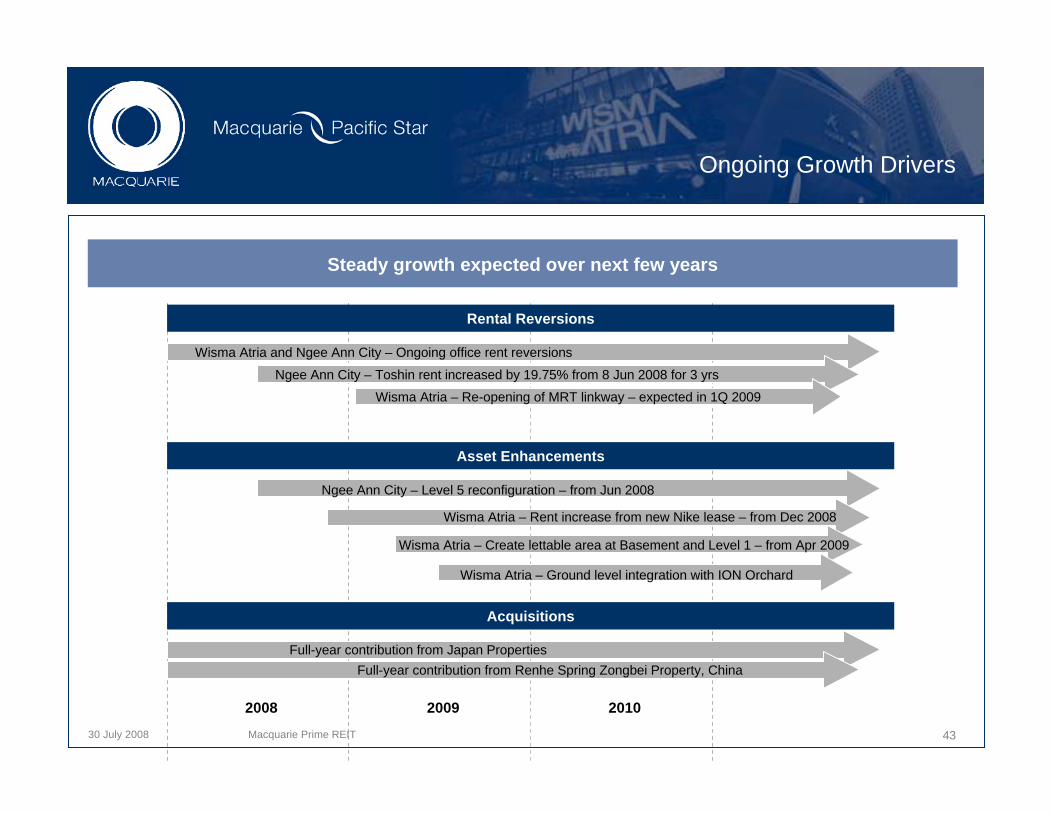
Ongoing Growth Drivers
2008 2009 2010
Acquisitions
CompletionFull-year contribution from Japan Properties
Full-year contribution from Renhe Spring Zongbei Property, China
Ngee Ann City – Toshin rent increased by 19.75% from 8 Jun 2008 for 3 yrs
Wisma Atria and Ngee Ann City – Ongoing office rent reversions
Wisma Atria – Re-opening of MRT linkway – expected in 1Q 2009
Rental Reversions
Asset Enhancements
Ngee Ann City – Level 5 reconfiguration – from Jun 2008
Wisma Atria – Create lettable area at Basement and Level 1 – from Apr 2009
Wisma Atria – Ground level integration with ION Orchard
Wisma Atria – Rent increase from new Nike lease – from Dec 2008
Steady growth expected over next few years
43Macquarie Prime REIT
30 July 2008 44
References used in this presentation
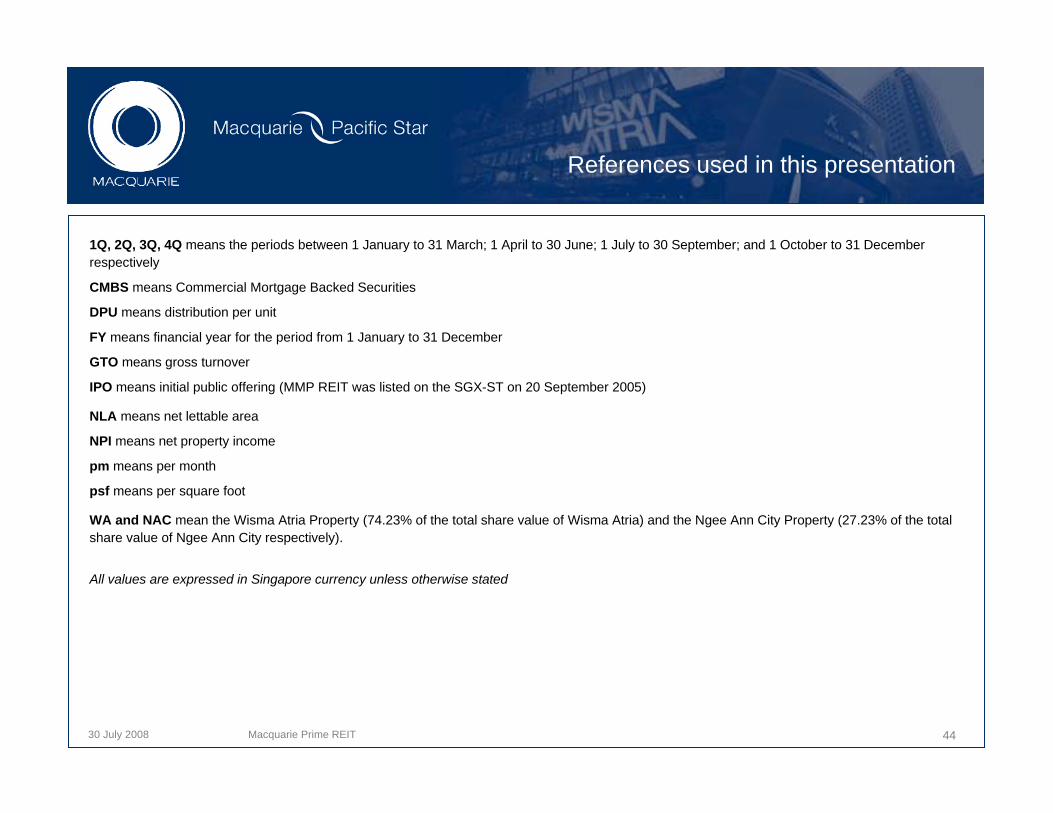
1Q, 2Q, 3Q, 4Q means the periods between 1 January to 31 March; 1 April to 30 June; 1 July to 30 September; and 1 October to 31 December respectively
CMBS means Commercial Mortgage Backed Securities
DPU means distribution per unit
FY means financial year for the period from 1 January to 31 December
GTO means gross turnover
IPO means initial public offering (MMP REIT was listed on the SGX-ST on 20 September 2005)
NLA means net lettable area
NPI means net property income
pm means per month
psf means per square foot
WA and NAC mean the Wisma Atria Property (74.23% of the total share value of Wisma Atria) and the Ngee Ann City Property (27.23% of the total share value of Ngee Ann City respectively).
All values are expressed in Singapore currency unless otherwise stated
Macquarie Prime REIT
30 July 2008
Disclaimer
This presentation has been prepared by Macquarie Pacific Star Prime REIT Management Limited (the “Manager”), solely in its capacity as Manager of Macquarie Prime Real Estate Investment Trust (“MP REIT”). A press release has been made by the Manager and posted on SGXNET on 26 July 2007 (the “Announcements”). This presentation is qualified in its entirety by, and should be read in conjunction with the Announcement posted on SGXNET. Terms not defined in this document adopt the same meanings in the Announcements.
The information contained in this presentation has been compiled from sources believed to be reliable. Whilst every effort has been made to ensure the accuracy of this presentation, no warranty is given or implied. This presentation has been prepared without taking into account the personal objectives, financial situation or needs of any particular party. It is for information only and does not contain investment advice or constitute an invitation or offer to acquire, purchase or subscribe for MP REIT units (“Units”). Potential investors should consult their own financial and/or other professional advisers.
This document may contain forward-looking statements that involve risks and uncertainties. Actual future performance, outcomes and results may differ materially from those expressed in forward-looking statements as a result of a number of risks, uncertainties and assumptions.
Representative examples of these factors include (without limitation) general industry and economic conditions, interest rate trends, cost of capital and capital availability, competition from similar developments, shifts in expected levels of property rental income, changes in operating expenses (including employee wages, benefits and training costs), property expenses and governmental and public policy changes. Investors are cautioned not to place undue reliance on these forward-looking statements, which are based on the Manager’s view of future events.
The past performance of MP REIT is not necessarily indicative of the future performance of MP REIT. The value of Units and the income derived from them may fall as well as rise. The Units are not obligations of deposits in, or guaranteed by, the Manager or any of its affiliates. An investment in Units is subject to investment risks, including the possible loss of the principal amount invested. Investors have no right to request that the Manager redeem their Units while the Units are listed. It is intended that unitholders of MP REIT may only deal in their Units through trading on the SGX-ST. Listing of the Units on the SGX-ST does not guarantee a liquid market for the Units.
Macquarie Bank Limited ABN 46 008 583 542 (“MBL”) holds a 50% indirect interest in the Manager. MBL is authorised by The Australian Prudential Regulation Authority in the Commonwealth of Australia and The Financial Services Authority in the United Kingdom, to carry out banking business or to accept deposits in those respective jurisdictions. Members of the Macquarie Bank Group are not otherwise currently authorised to carry out banking business or to accept deposits in any other country. Other than Macquarie Bank Limited ABN 46 008 583 542 (MBL), any Macquarie Group Limited entity or REIT noted on this page is not an authorised deposit taking institution for the purposes of the Banking Act 1959 (Commonwealth of Australia) and that entity's obligations do not represent deposits or other liabilities of Macquarie Bank Limited ABN 46 008 583 542 (MBL). Neither MBL nor any other Macquarie Group entity guarantees or provides assurance in respect of the obligations of any of these entities, unless noted otherwise. MBL does not carry on banking business in Singapore. MBL does not hold a license under the Banking Act (Cap. 19) of Singapore and is therefore not subject to the supervision of the Monetary Authority of Singapore.
45Macquarie Prime REIT

30 July 2008 Macquarie MEAG Prime REIT 46
Macquarie Pacific Star Prime REIT Management Limited391B Orchard Road #21-08 Ngee Ann City Tower B
Singapore 238874
Investor, Analyst and Media Contact:Ms Mok Lai Siong
Senior Vice PresidentTel : +65 6835 8633
Email : [email protected] us at : www.mpreit.com.sg
End of Presentation
46


