36
SECOND QUARTER FINANCIAL REPORT JUNE 30, 2019

SECOND QUARTER FINANCIAL REPORT
JUNE 30, 2019

TORONTO HYDRO CORPORATION
TABLE OF CONTENTS
Glossary 3 Management’s Discussion and Analysis 4
Executive Summary 5 Introduction 5 Business of Toronto Hydro Corporation 6 Results of Operations 7 Summary of Quarterly Results of Operations 13 Financial Position 14 Liquidity and Capital Resources 15
Corporate Developments 19
Controls and Procedures 20
Risk Management and Risk Factors 20
Critical Accounting Estimates 20
Future Accounting Pronouncements 20
Forward-Looking Information 20
Additional Information 22
Unaudited Condensed Interim Consolidated Finanical Statements 23
Notes to the Unaudited Condensed Interim Consolidated Financial Statements 27

3
GLOSSARY
CDM – Conservation and Demand Management
CIR – Custom Incentive Rate-setting
City – City of Toronto
Copeland Station – The Clare R. Copeland
transformer station, formerly called “Bremner
Station”
Corporation – Toronto Hydro Corporation
ECA – Energy Conservation Agreement
Electricity Act – Electricity Act, 1998 (Ontario), as
amended
ERP – Enterprise resource planning
HONI – Hydro One Networks Inc.
IAS – International Accounting Standard
IASB – International Accounting Standards Board
IESO – Independent Electricity System Operator
IFRS – International Financial Reporting Standards
kW – Kilowatt
LDC – Toronto Hydro-Electric System Limited
LRAM – Lost revenue adjustment mechanism
MD&A – Management's Discussion and Analysis
OEB – Ontario Energy Board
PP&E – Property, plant and equipment
TH Energy – Toronto Hydro Energy Services Inc.
WMS – Wholesale Market Service
MANAGEMENT’S DISCUSSION AND ANALYSIS
FOR THE THREE AND SIX MONTHS ENDED JUNE 30, 2019 AND 2018

5
Executive Summary
Net income after net movements in regulatory balances for the three and six months ended June 30, 2019 was
$46.1 million and $88.7 million, respectively, compared to $42.5 million and $85.0 million for the comparable
periods in 2018;
Capital expenditures were primarily related to the renewal of the electricity infrastructure of LDC and were
$135.5 million and $233.7 million for the three and six months ended June 30, 2019, respectively, compared to
$118.1 million and $227.6 million for the comparable periods in 2018;
On July 30, 2019, the Corporation filed a base shelf prospectus with the securities commissions or similar
regulatory authorities in each of the provinces of Canada. These filings allow the Corporation to make offerings
of unsecured debt securities of up to $1.0 billion during the 25-month period following the date of the
prospectus; and
On August 21, 2019, the Board of Directors of the Corporation declared dividends in the amount of $25.1
million with respect to the third quarter of 2019 (third quarter of 2018 - $23.5 million), payable to the City by
September 30, 2019.
Introduction
This MD&A should be read in conjunction with:
the Corporation’s unaudited condensed interim consolidated financial statements and accompanying notes as at
and for the three and six months ended June 30, 2019 and 2018 (the “Interim Financial Statements”), which
were prepared in accordance with IAS 34 Interim Financial Reporting. The Interim Financial Statements have
been prepared following the same accounting policies and methods of computation as described in note 25 to
the Corporation’s audited consolidated financial statements as at and for the years ended December 31, 2018
and 2017 (the “2018 Annual Financial Statements”);
2018 Annual Financial Statements; and
the Corporation’s MD&A for the years ended December 31, 2018 and 2017 (the “2018 Annual MD&A”)
including the sections titled “Electricity Distribution – Industry Overview”, “Legal Proceedings”, “Share
Capital”, and “Transactions with Related Parties”, which remain substantially unchanged as at the date hereof,
except as may be noted below or as updated in the Corporation’s Interim Financial Statements.
Copies of these documents are available on the System for Electronic Document Analysis and Retrieval website at
www.sedar.com.
6
Business of Toronto Hydro Corporation
The Corporation is a holding company which wholly owns two subsidiaries:
LDC - distributes electricity; and
TH Energy - provides street lighting and expressway lighting services in the City.
The Corporation supervises the operations of, and provides corporate, management services and strategic direction to
its subsidiaries. The City is the sole shareholder of the Corporation.
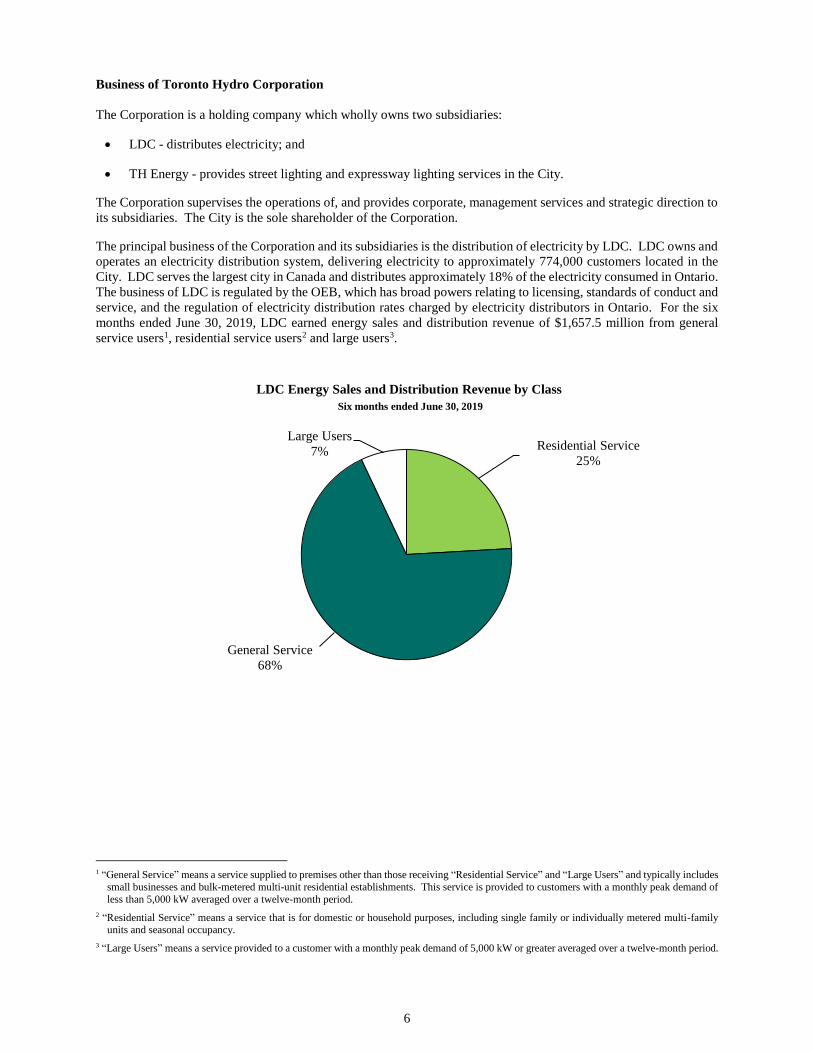
The principal business of the Corporation and its subsidiaries is the distribution of electricity by LDC. LDC owns and
operates an electricity distribution system, delivering electricity to approximately 774,000 customers located in the
City. LDC serves the largest city in Canada and distributes approximately 18% of the electricity consumed in Ontario.
The business of LDC is regulated by the OEB, which has broad powers relating to licensing, standards of conduct and
service, and the regulation of electricity distribution rates charged by electricity distributors in Ontario. For the six
months ended June 30, 2019, LDC earned energy sales and distribution revenue of $1,657.5 million from general
service users1, residential service users2 and large users3.
1 “General Service” means a service supplied to premises other than those receiving “Residential Service” and “Large Users” and typically includes
small businesses and bulk-metered multi-unit residential establishments. This service is provided to customers with a monthly peak demand of
less than 5,000 kW averaged over a twelve-month period.
2 “Residential Service” means a service that is for domestic or household purposes, including single family or individually metered multi-family units and seasonal occupancy.
3 “Large Users” means a service provided to a customer with a monthly peak demand of 5,000 kW or greater averaged over a twelve-month period.
Residential Service
25%
Large Users
7%
LDC Energy Sales and Distribution Revenue by Class
Six months ended June 30, 2019
General Service
68%
7
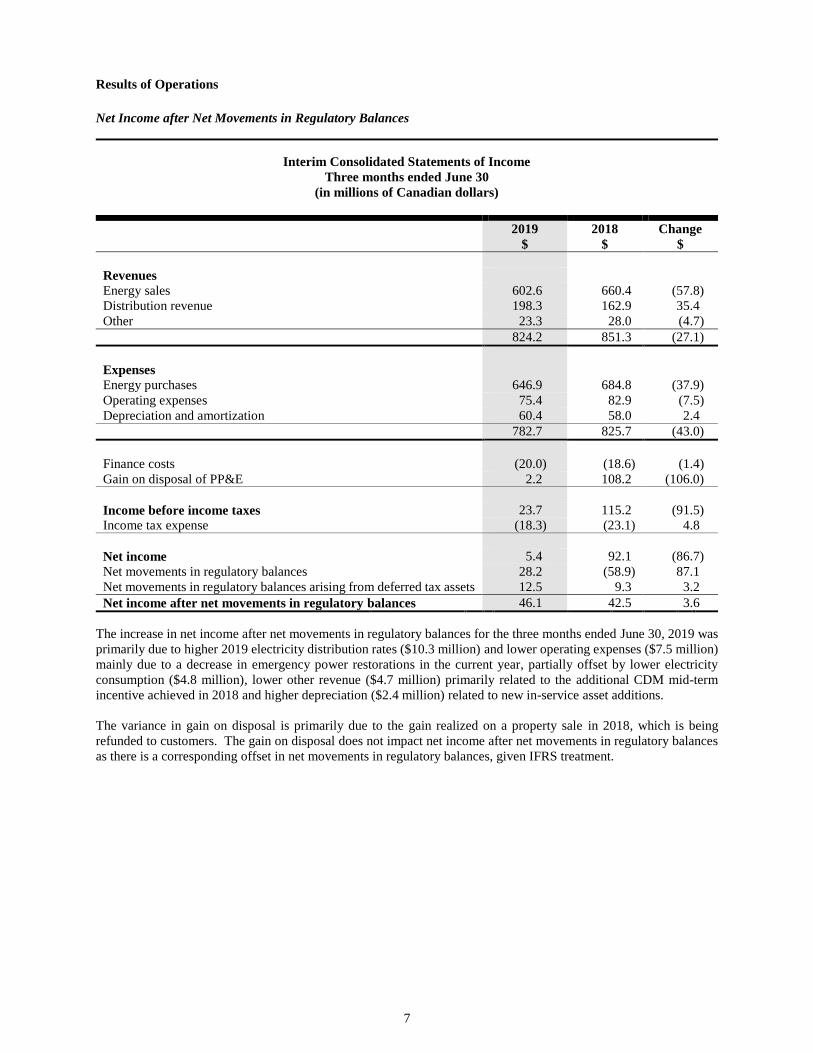
Results of Operations
Net Income after Net Movements in Regulatory Balances
Interim Consolidated Statements of Income Three months ended June 30
(in millions of Canadian dollars)
2019
$
2018
$
Change
$
Revenues
Energy sales 602.6 660.4 (57.8)
Distribution revenue 198.3 162.9 35.4
Other 23.3 28.0 (4.7)
824.2 851.3 (27.1)
Expenses
Energy purchases 646.9 684.8 (37.9)
Operating expenses 75.4 82.9 (7.5)
Depreciation and amortization 60.4 58.0 2.4
782.7 825.7 (43.0)
Finance costs (20.0) (18.6) (1.4)
Gain on disposal of PP&E 2.2 108.2 (106.0)
Income before income taxes 23.7 115.2 (91.5)
Income tax expense (18.3) (23.1) 4.8
Net income 5.4 92.1 (86.7)
Net movements in regulatory balances 28.2 (58.9) 87.1
Net movements in regulatory balances arising from deferred tax assets 12.5 9.3 3.2
Net income after net movements in regulatory balances 46.1 42.5 3.6
The increase in net income after net movements in regulatory balances for the three months ended June 30, 2019 was
primarily due to higher 2019 electricity distribution rates ($10.3 million) and lower operating expenses ($7.5 million)
mainly due to a decrease in emergency power restorations in the current year, partially offset by lower electricity
consumption ($4.8 million), lower other revenue ($4.7 million) primarily related to the additional CDM mid-term
incentive achieved in 2018 and higher depreciation ($2.4 million) related to new in-service asset additions.
The variance in gain on disposal is primarily due to the gain realized on a property sale in 2018, which is being
refunded to customers. The gain on disposal does not impact net income after net movements in regulatory balances
as there is a corresponding offset in net movements in regulatory balances, given IFRS treatment.
8
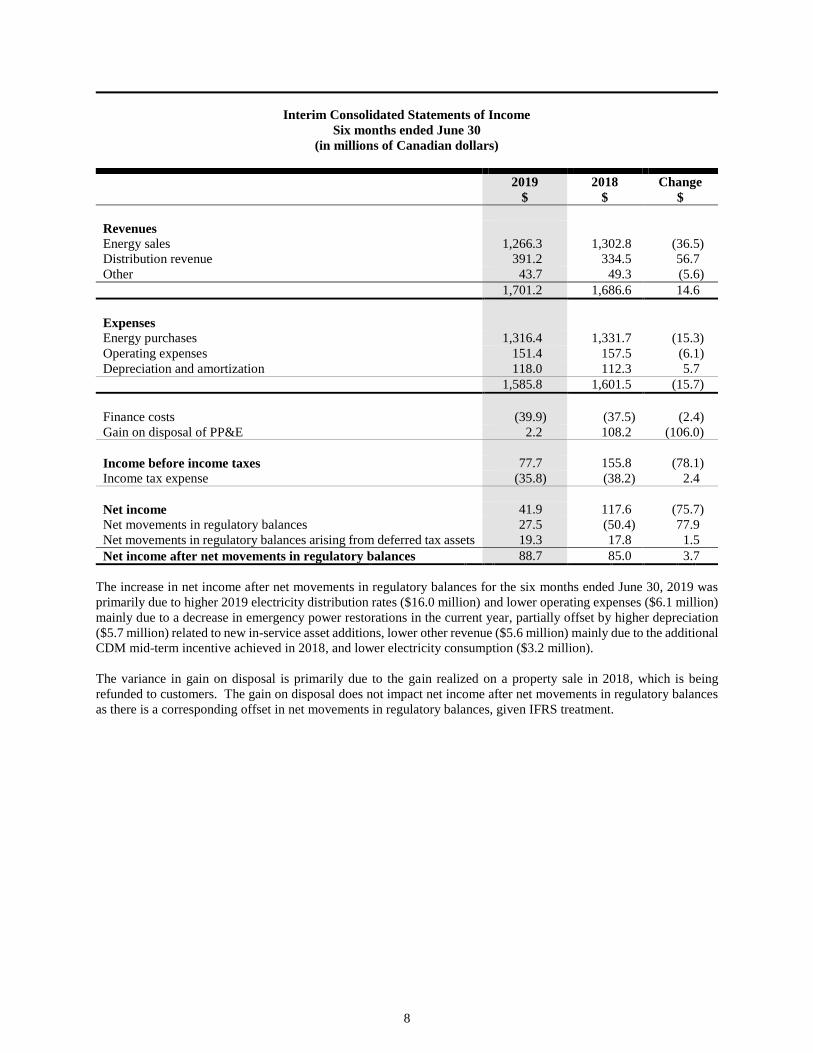
Interim Consolidated Statements of Income Six months ended June 30
(in millions of Canadian dollars)
2019
$
2018
$
Change
$
Revenues
Energy sales 1,266.3 1,302.8 (36.5)
Distribution revenue 391.2 334.5 56.7
Other 43.7 49.3 (5.6)
1,701.2 1,686.6 14.6
Expenses
Energy purchases 1,316.4 1,331.7 (15.3)
Operating expenses 151.4 157.5 (6.1)
Depreciation and amortization 118.0 112.3 5.7
1,585.8 1,601.5 (15.7)
Finance costs (39.9) (37.5) (2.4)
Gain on disposal of PP&E 2.2 108.2 (106.0)
Income before income taxes 77.7 155.8 (78.1)
Income tax expense (35.8) (38.2) 2.4
Net income 41.9 117.6 (75.7)
Net movements in regulatory balances 27.5 (50.4) 77.9
Net movements in regulatory balances arising from deferred tax assets 19.3 17.8 1.5
Net income after net movements in regulatory balances 88.7 85.0 3.7
The increase in net income after net movements in regulatory balances for the six months ended June 30, 2019 was
primarily due to higher 2019 electricity distribution rates ($16.0 million) and lower operating expenses ($6.1 million)
mainly due to a decrease in emergency power restorations in the current year, partially offset by higher depreciation
($5.7 million) related to new in-service asset additions, lower other revenue ($5.6 million) mainly due to the additional
CDM mid-term incentive achieved in 2018, and lower electricity consumption ($3.2 million).
The variance in gain on disposal is primarily due to the gain realized on a property sale in 2018, which is being
refunded to customers. The gain on disposal does not impact net income after net movements in regulatory balances
as there is a corresponding offset in net movements in regulatory balances, given IFRS treatment.
9
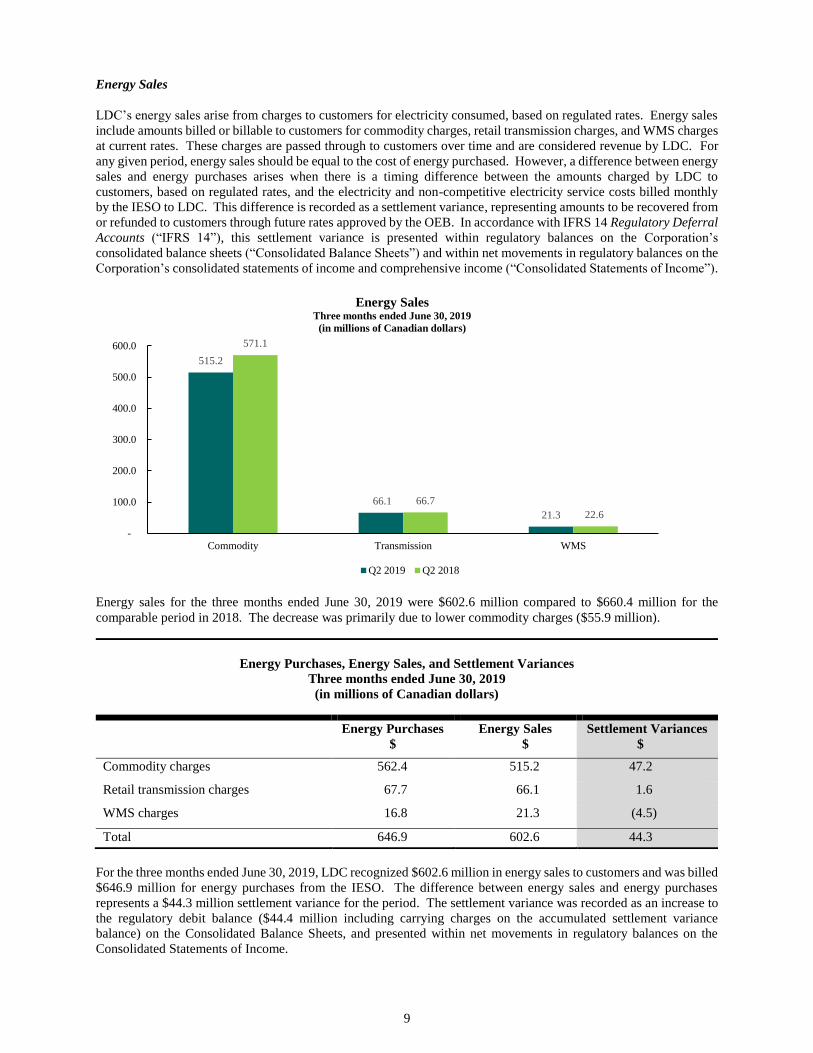
Energy Sales
LDC’s energy sales arise from charges to customers for electricity consumed, based on regulated rates. Energy sales
include amounts billed or billable to customers for commodity charges, retail transmission charges, and WMS charges
at current rates. These charges are passed through to customers over time and are considered revenue by LDC. For
any given period, energy sales should be equal to the cost of energy purchased. However, a difference between energy
sales and energy purchases arises when there is a timing difference between the amounts charged by LDC to
customers, based on regulated rates, and the electricity and non-competitive electricity service costs billed monthly
by the IESO to LDC. This difference is recorded as a settlement variance, representing amounts to be recovered from
or refunded to customers through future rates approved by the OEB. In accordance with IFRS 14 Regulatory Deferral
Accounts (“IFRS 14”), this settlement variance is presented within regulatory balances on the Corporation’s
consolidated balance sheets (“Consolidated Balance Sheets”) and within net movements in regulatory balances on the
Corporation’s consolidated statements of income and comprehensive income (“Consolidated Statements of Income”).
Energy sales for the three months ended June 30, 2019 were $602.6 million compared to $660.4 million for the
comparable period in 2018. The decrease was primarily due to lower commodity charges ($55.9 million).
Energy Purchases, Energy Sales, and Settlement Variances Three months ended June 30, 2019 (in millions of Canadian dollars)
Energy Purchases
$
Energy Sales
$
Settlement Variances
$
Commodity charges 562.4 515.2 47.2
Retail transmission charges 67.7 66.1 1.6
WMS charges 16.8 21.3 (4.5)
Total 646.9 602.6 44.3
For the three months ended June 30, 2019, LDC recognized $602.6 million in energy sales to customers and was billed
$646.9 million for energy purchases from the IESO. The difference between energy sales and energy purchases
represents a $44.3 million settlement variance for the period. The settlement variance was recorded as an increase to
the regulatory debit balance ($44.4 million including carrying charges on the accumulated settlement variance
balance) on the Consolidated Balance Sheets, and presented within net movements in regulatory balances on the
Consolidated Statements of Income.
515.2
66.1
21.3
571.1
66.7
22.6
-
100.0
200.0
300.0
400.0
500.0
600.0
Commodity Transmission WMS
Energy SalesThree months ended June 30, 2019
(in millions of Canadian dollars)
Q2 2019 Q2 2018
10
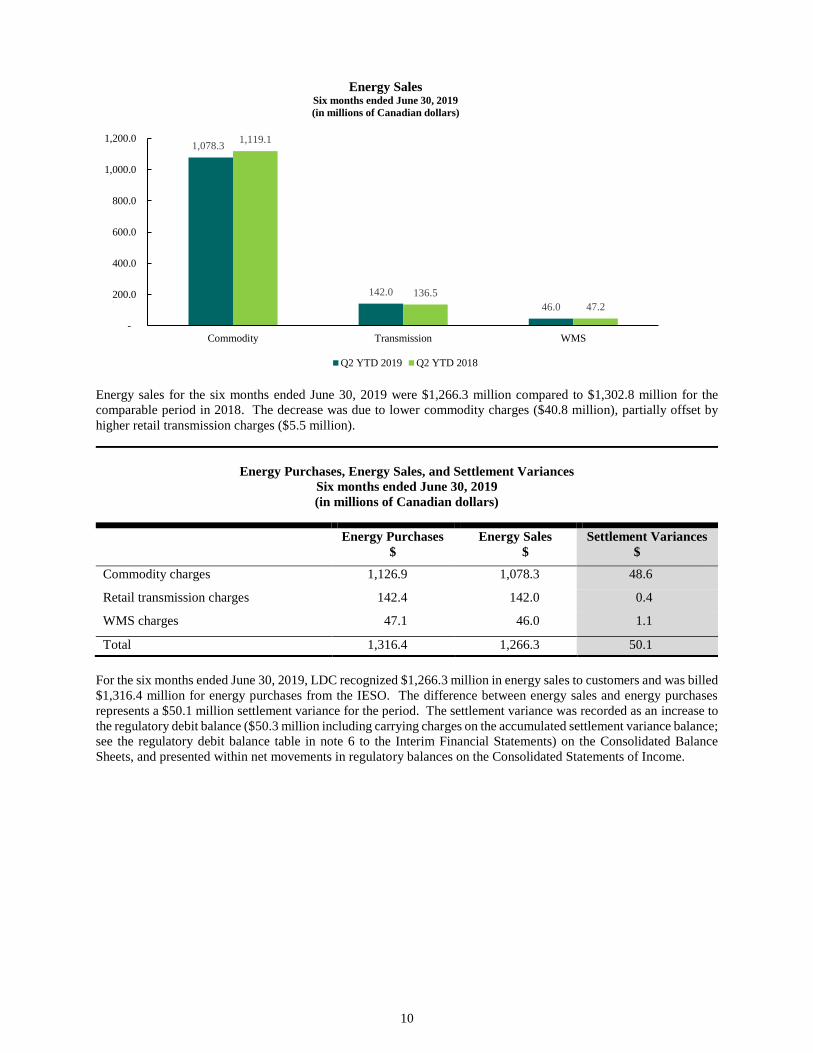
Energy sales for the six months ended June 30, 2019 were $1,266.3 million compared to $1,302.8 million for the
comparable period in 2018. The decrease was due to lower commodity charges ($40.8 million), partially offset by
higher retail transmission charges ($5.5 million).
Energy Purchases, Energy Sales, and Settlement Variances Six months ended June 30, 2019 (in millions of Canadian dollars)
Energy Purchases
$
Energy Sales
$
Settlement Variances
$
Commodity charges 1,126.9 1,078.3 48.6
Retail transmission charges 142.4 142.0 0.4
WMS charges 47.1 46.0 1.1
Total 1,316.4 1,266.3 50.1
For the six months ended June 30, 2019, LDC recognized $1,266.3 million in energy sales to customers and was billed
$1,316.4 million for energy purchases from the IESO. The difference between energy sales and energy purchases
represents a $50.1 million settlement variance for the period. The settlement variance was recorded as an increase to
the regulatory debit balance ($50.3 million including carrying charges on the accumulated settlement variance balance;
see the regulatory debit balance table in note 6 to the Interim Financial Statements) on the Consolidated Balance
Sheets, and presented within net movements in regulatory balances on the Consolidated Statements of Income.
1,078.3
142.0
46.0
1,119.1
136.5
47.2
-
200.0
400.0
600.0
800.0
1,000.0
1,200.0
Commodity Transmission WMS
Energy SalesSix months ended June 30, 2019
(in millions of Canadian dollars)
Q2 YTD 2019 Q2 YTD 2018
11
Distribution Revenue
Distribution revenue is recorded based on OEB-approved distribution rates to recover the costs incurred by LDC in
delivering electricity to customers and includes revenue collected through OEB-approved rate riders.
Distribution revenue for the three and six months ended June 30, 2019 was $198.3 million and $391.2 million,
respectively, compared to $162.9 million and $334.5 million for the comparable periods in 2018.
The net increase in distribution revenue for the three months ended June 30, 2019 was primarily due to higher revenue
collected through OEB-approved rate riders ($29.8 million) and higher 2019 electricity distribution rates ($10.3
million), partially offset by lower electricity consumption ($4.8 million).
The net increase in distribution revenue for the six months ended June 30, 2019 was primarily due to higher revenue
collected through OEB-approved rate riders ($43.6 million) and higher 2019 electricity distribution rates ($16.0
million), partially offset by lower electricity consumption ($3.2 million).
Other Revenue
Other revenue includes revenue from services ancillary to electricity distribution, delivery of street lighting services,
pole and duct rentals, other regulatory service charges and capital contributions.
Other revenue for the three and six months ended June 30, 2019 was $23.3 million and $43.7 million, respectively,
compared to $28.0 million and $49.3 million for the comparable periods in 2018.
The decrease in other revenue for the three and six months ended June 30, 2019 was primarily due to lower revenue
from ancillary services and the additional CDM mid-term incentive achieved in 2018.
Operating Expenses
Operating expenses for the three and six months ended June 30, 2019 were $75.4 million and $151.4 million,
respectively, compared to $82.9 million and $157.5 million for the comparable periods in 2018.
The decrease in operating expenses for the three and six months ended June 30, 2019 was primarily due to lower costs
related to emergency power restorations and lower ancillary service costs, partially offset by higher costs associated
with the maintenance and post go-live support of the ERP system implemented in late 2018.
Depreciation and Amortization
Depreciation and amortization expense for the three and six months ended June 30, 2019 was $60.4 million and $118.0
million, respectively, compared to $58.0 million and $112.3 million for the comparable periods in 2018. The increase
was primarily due to new in-service asset additions, partially offset by certain assets being fully depreciated and lower
derecognition of assets removed from service.
Finance Costs
Finance costs for the three and six months ended June 30, 2019 were $20.0 million and $39.9 million, respectively,
compared to $18.6 million and $37.5 million for the comparable periods in 2018. The increase was primarily due to
lower capitalized borrowing costs in 2019.
Gain on Disposals of PP&E
Gain on disposals of PP&E for the three and six months ended June 30, 2019 was $2.2 million compared to $108.2
million for the comparable periods in 2018.
The decrease in gain on disposals of PP&E for the three and six months ended June 30, 2019 was primarily due to a
higher gain realized in connection with the disposal of a property in the second quarter of 2018 which is being refunded
to customers.

12
Income Tax Expense and Income Tax Recorded in Net Movements in Regulatory Balances
Income tax expense and income tax recorded in net movements in regulatory balances for the three and six months
ended June 30, 2019 was $5.8 million and $16.5 million, respectively, compared to $13.8 million and $20.4 million
for the comparable periods in 2018. The favourable variance was primarily due to lower tax recognized on property
dispositions compared to 2018, offset by lower net deductions for permanent and temporary differences between
accounting and tax treatments.
Net Movements in Regulatory Balances
In accordance with IFRS 14, the Corporation separately presents regulatory balances and related net movements on
the Consolidated Balance Sheets and Consolidated Statements of Income.
The increase in the regulatory debit ($46.2 million) and decrease in the regulatory credit ($0.6 million) balances for
the six months ended June 30, 2019 equals the sum ($46.8 million) of net movements in regulatory balances and net
movements in regulatory balances arising from deferred tax assets for the period (see “Financial Position” below).
Energy purchases record the actual cost of power purchased which varies from month to month. Since the selling
price of power within energy sales is fixed for set periods of time, a gain or loss usually results, and is part of the
calculation of net income. However, per OEB regulations, such gains or losses on energy sales are deferred within
balance sheet regulatory variance accounts for later disposition to or from rate payers via rate riders after approval by
the OEB. Deferrals of gains or losses on energy sales (see discussion on settlement variance under “Results of
Operations” above), or disposition of past deferrals in electricity rates will usually represent the largest single element
of the net movements in regulatory balances for a given period.
Net movements in regulatory balances for the three and six months ended June 30, 2019 was a recovery of $28.2
million and $27.5 million, respectively, compared to a charge of $58.9 million and $50.4 million for the comparable
periods in 2018. The recovery of $28.2 million and $27.5 million for the three and six months ended June 30, 2019
was primarily due to the timing difference between the electricity costs billed monthly by the IESO and LDC’s billing
to customers and LRAM, partially offset by amounts being deferred into capital-related regulatory accounts for future
refunds to customers and amounts disposed through OEB-approved rate riders. The charge of $58.9 million and $50.4
million for the three and six months ended June 30, 2018 was primarily due to the gain realized on disposal of a
property in the second quarter of 2018, partially offset by amounts disposed through OEB-approved rate riders and
the timing difference between the electricity costs billed monthly by the IESO and LDC’s billing to customers.

13
Summary of Quarterly Results of Operations
The table below presents a summary of the Corporation’s results of operations for eight quarters including and
immediately preceding June 30, 2019.
Summary of Quarterly Results of Operations
(in millions of Canadian dollars)
June 30,
2019
$
March 31,
2019
$
December 31,
2018
$
September 30,
2018
$
Energy sales 602.6 663.7 660.2 741.1
Distribution revenue 198.3 192.9 163.9 175.8
Other 23.3 20.4 23.4 21.7
Revenues 824.2 877.0 847.5 938.6
Net income after net movements
in regulatory balances
46.1
42.6
31.9
50.4
June 30,
2018
$
March 31,
2018
$
December 31,
2017
$
September 30,
2017
$
[Restated] 1
[Restated] 1
Energy sales 660.4 642.4 638.9 738.4
Distribution revenue 162.9 171.6 181.7 186.1
Other 28.0 21.3 27.7 36.6
Revenues 851.3 835.3 848.3 961.1
Net income after net movements
in regulatory balances
42.5 42.5 35.1 46.8
1 These numbers have been restated to account for the impact of adopting IFRS 15 Revenue from Contracts with Customers (“IFRS 15”). Additional details on IFRS 15 were discussed in note 25(q) to the 2018 Annual Financial Statements.
The Corporation’s revenues, all other things being equal, are impacted by temperature fluctuations and unexpected
weather conditions. Revenues would tend to be higher in the first quarter as a result of higher energy consumption
for winter heating, and in the third quarter due to air conditioning/cooling. The Corporation’s results are also impacted
by fluctuations in electricity prices and the timing and recognition of regulatory decisions. The variation from the
seasonal trend for the second quarter of 2018 was due to higher commodity charges charged by the IESO, partially
offset by lower distribution revenue due to amounts disposed through OEB approved rate riders.
14
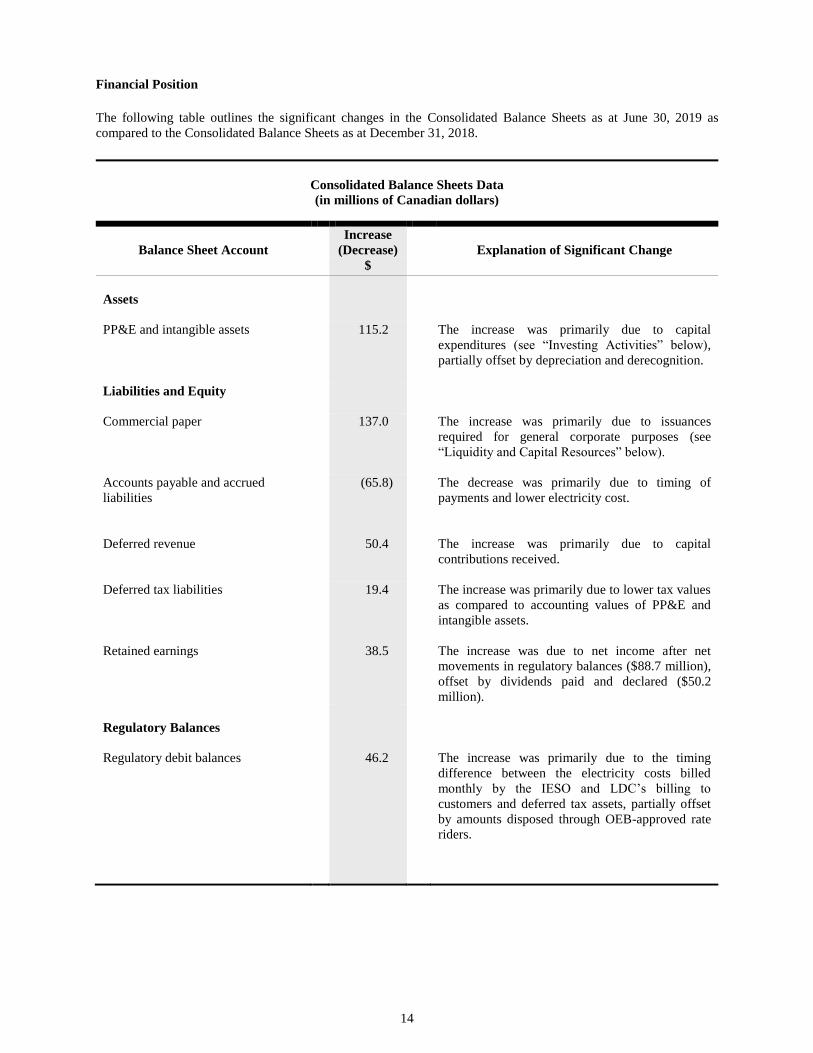
Financial Position
The following table outlines the significant changes in the Consolidated Balance Sheets as at June 30, 2019 as
compared to the Consolidated Balance Sheets as at December 31, 2018.
Consolidated Balance Sheets Data
(in millions of Canadian dollars)
Balance Sheet Account Increase
(Decrease)
Explanation of Significant Change $
Assets
PP&E and intangible assets
115.2 The increase was primarily due to capital
expenditures (see “Investing Activities” below),
partially offset by depreciation and derecognition.
Liabilities and Equity
Commercial paper 137.0 The increase was primarily due to issuances
required for general corporate purposes (see
“Liquidity and Capital Resources” below).
Accounts payable and accrued
liabilities
(65.8) The decrease was primarily due to timing of
payments and lower electricity cost.
Deferred revenue 50.4 The increase was primarily due to capital
contributions received.
Deferred tax liabilities 19.4 The increase was primarily due to lower tax values
as compared to accounting values of PP&E and
intangible assets.
Retained earnings 38.5 The increase was due to net income after net
movements in regulatory balances ($88.7 million),
offset by dividends paid and declared ($50.2
million).
Regulatory Balances
Regulatory debit balances
46.2
The increase was primarily due to the timing
difference between the electricity costs billed
monthly by the IESO and LDC’s billing to
customers and deferred tax assets, partially offset
by amounts disposed through OEB-approved rate
riders.

15
Liquidity and Capital Resources
The Corporation's current assets and current liabilities amounted to $523.5 million and $1,042.5 million, respectively,
as at June 30, 2019, resulting in a working capital deficit of $519.0 million. The deficit is attributable to the
Corporation’s preference for utilizing its Commercial Paper Program and Working Capital Facility (both defined in
“Financing Activities” below) before issuing additional debentures to fulfill the Corporation’s ongoing liquidity
requirements, including funding of significant capital spending in the current year. The Corporation seeks to maintain
an optimal mix of short-term and long-term debt in order to lower overall financing costs and to enhance borrowing
flexibility.
The Corporation’s primary sources of liquidity and capital resources are cash provided by operating activities, issuance
of commercial paper, amounts available to be drawn against its credit facilities, and borrowings from debt capital
markets. The Corporation’s liquidity and capital resource requirements are mainly for capital expenditures to maintain
and improve the electricity distribution system of LDC, for energy purchases and to meet financing obligations.
The amount available under the Revolving Credit Facility (defined in “Financing Activities” below) and the
outstanding borrowings under the Revolving Credit Facility and Commercial Paper Program are as follows:
Revolving
Credit Facility
Limit
Revolving
Credit Facility
Borrowings
Commercial
Paper
Outstanding
Revolving
Credit Facility
Availability
(in millions of Canadian dollars) $ $ $ $
June 30, 2019 800.0 - 250.0 550.0
December 31, 2018 800.0 - 113.0 687.0
The Corporation is a party to a $20.0 million demand facility with a Canadian chartered bank for the purpose of
working capital management (“Working Capital Facility”). As at June 30, 2019, $2.0 million had been drawn under
the Working Capital Facility, compared to $12.6 million as at December 31, 2018.
Consolidated Statements of Cash Flow Data
(in millions of Canadian dollars)
Three months
ended June 30,
Six months
ended June 30,
2019
$
2018
$
2019
$
2018
$
Working capital facility, beginning of period
(5.8)
(4.8)
(12.6) (11.7)
Net cash provided by operating activities 128.1 119.9 236.4 250.0
Net cash used in investing activities (131.2) (8.4) (269.9) (141.0)
Net cash provided by (used in) financing activities 6.9 (81.9) 44.1 (72.5)
Cash and cash equivalents (Working capital
facility), end of period
(2.0) 24.8 (2.0) 24.8
Operating Activities
Net cash provided by operating activities for the three and six months ended June 30, 2019 was $128.1 million and
$236.4 million, respectively, compared to $119.9 million and $250.0 million for the comparable periods in 2018.
The increase in net cash provided by operating activities for the three months ended June 30, 2019 was primarily due
to changes in net income before net movements in regulatory balances and timing differences in the settlement of
receivables and payables, partially offset by lower customer deposits.
The decrease in net cash provided by operating activities for the six months ended June 30, 2019 was primarily due
to lower customer deposits and timing differences in the settlement of receivables, partially offset by changes in net
income before net movements in regulatory balances.
16
Investing Activities
Net cash used in investing activities for the three and six months ended June 30, 2019 was $131.2 million and $269.9
million, respectively, compared to $8.4 million and $141.0 million for the comparable periods in 2018. The increase
was primarily related to proceeds received on the disposition of a property in 2018.
Electricity distribution is a capital-intensive business. As the municipal electricity distribution company serving the
largest city in Canada, LDC continues to invest in the renewal of existing aging infrastructure to address safety,
reliability and customer service requirements.
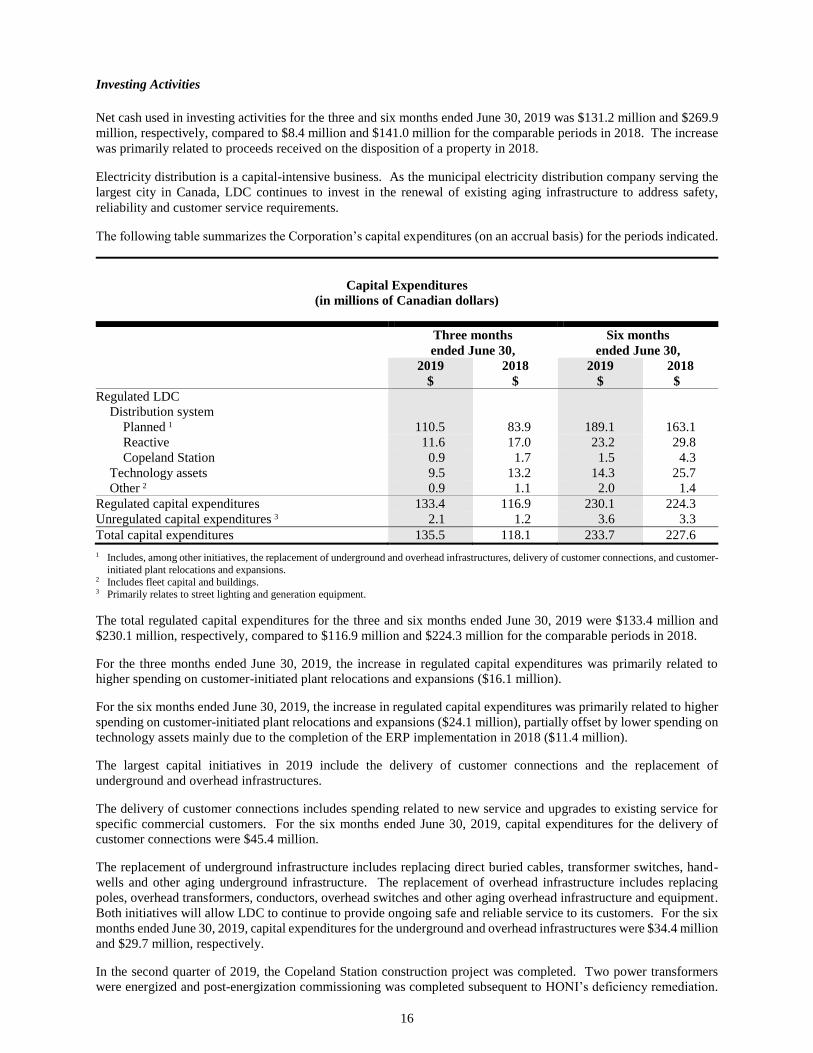
The following table summarizes the Corporation’s capital expenditures (on an accrual basis) for the periods indicated.
Capital Expenditures
(in millions of Canadian dollars)
Three months
ended June 30,
Six months
ended June 30,
2019
$
2018
$
2019
$
2018
$
Regulated LDC
Distribution system
Planned 1 110.5 83.9 189.1 163.1
Reactive 11.6 17.0 23.2 29.8
Copeland Station 0.9 1.7 1.5 4.3
Technology assets 9.5 13.2 14.3 25.7
Other 2 0.9 1.1 2.0 1.4
Regulated capital expenditures 133.4 116.9 230.1 224.3
Unregulated capital expenditures 3 2.1 1.2 3.6 3.3
Total capital expenditures 135.5 118.1 233.7 227.6
1 Includes, among other initiatives, the replacement of underground and overhead infrastructures, delivery of customer connections, and customer-
initiated plant relocations and expansions. 2 Includes fleet capital and buildings. 3 Primarily relates to street lighting and generation equipment.
The total regulated capital expenditures for the three and six months ended June 30, 2019 were $133.4 million and
$230.1 million, respectively, compared to $116.9 million and $224.3 million for the comparable periods in 2018.
For the three months ended June 30, 2019, the increase in regulated capital expenditures was primarily related to
higher spending on customer-initiated plant relocations and expansions ($16.1 million).
For the six months ended June 30, 2019, the increase in regulated capital expenditures was primarily related to higher
spending on customer-initiated plant relocations and expansions ($24.1 million), partially offset by lower spending on
technology assets mainly due to the completion of the ERP implementation in 2018 ($11.4 million).
The largest capital initiatives in 2019 include the delivery of customer connections and the replacement of
underground and overhead infrastructures.
The delivery of customer connections includes spending related to new service and upgrades to existing service for
specific commercial customers. For the six months ended June 30, 2019, capital expenditures for the delivery of
customer connections were $45.4 million.
The replacement of underground infrastructure includes replacing direct buried cables, transformer switches, hand-
wells and other aging underground infrastructure. The replacement of overhead infrastructure includes replacing
poles, overhead transformers, conductors, overhead switches and other aging overhead infrastructure and equipment.
Both initiatives will allow LDC to continue to provide ongoing safe and reliable service to its customers. For the six
months ended June 30, 2019, capital expenditures for the underground and overhead infrastructures were $34.4 million
and $29.7 million, respectively.
In the second quarter of 2019, the Copeland Station construction project was completed. Two power transformers
were energized and post-energization commissioning was completed subsequent to HONI’s deficiency remediation.
17
Load transfers and customer connections have commenced. As at June 30, 2019, the total cumulative capital
expenditures on the Copeland Station project amounted to $204.0 million, plus capitalized borrowing costs. Copeland
Station is the first transformer station built in downtown Toronto since the 1960’s and is the second underground
transformer station in Canada. The station provides electricity to buildings and neighbourhoods in the central-
southwest area of Toronto.
On January 25, 2018, the Corporation was informed that Carillion Construction Inc., the general contractor for the
Copeland Station project, filed for creditor protection under the Companies’ Creditors Arrangement Act after its
affiliate, Carillion plc, went into compulsory liquidation in the United Kingdom. Other contractors had taken on part
of the remaining work to contribute to the completion of the project. See “Risk Management and Risk Factors” in the
2018 Annual MD&A for further information on the Copeland Station project.
Financing Activities
Net cash provided by (used in) financing activities for the three and six months ended June 30, 2019 was $6.9 million
and $44.1 million, respectively, compared to ($81.9) million and ($72.5) million for the comparable periods in 2018.
The increase was primarily due to an increase in commercial paper issued in 2019.
The Corporation is a party to a credit agreement with a syndicate of Canadian chartered banks which established a
revolving credit facility expiring on October 10, 2023 (“Revolving Credit Facility”), pursuant to which it may borrow
up to $800.0 million, of which up to $210.0 million is available in the form of letters of credit. As at June 30, 2019,
the Corporation was in compliance with all covenants included in its Revolving Credit Facility agreement.
The Corporation has a commercial paper program allowing up to $600.0 million of unsecured short-term promissory
notes (“Commercial Paper Program”) to be issued in various maturities of no more than one year. The Commercial
Paper Program is backstopped by the Revolving Credit Facility; hence, available borrowing under the Revolving
Credit Facility is reduced by the amount of commercial paper outstanding at any point in time. Proceeds from the
Commercial Paper Program are used for general corporate purposes. Borrowings under the Commercial Paper
Program bear interest based on the prevailing market conditions at the time of issuance.
Additionally, the Corporation is a party to a $75.0 million demand facility with a Canadian chartered bank for the
purpose of issuing letters of credit mainly to support LDC’s prudential requirements with the IESO (“Prudential
Facility”). As at June 30, 2019, $33.3 million of letters of credit had been issued against the Prudential Facility.
The Corporation filed a base shelf prospectus dated July 30, 2019 with the securities commissions or similar regulatory
authorities in each of the provinces of Canada. These filings allow the Corporation to make offerings of unsecured
debt securities of up to $1.0 billion during the 25-month period following the date of the prospectus. The full amount
of the debenture offering capacity remains available to the Corporation under the base shelf prospectus.
As at June 30, 2019, the Corporation had debentures outstanding in the principal amount of $2.0 billion. These
debentures will mature between November 2019 and 2063. As at June 30, 2019, the Corporation was in compliance
with all covenants included in its trust indenture and supplemental trust indentures.
18
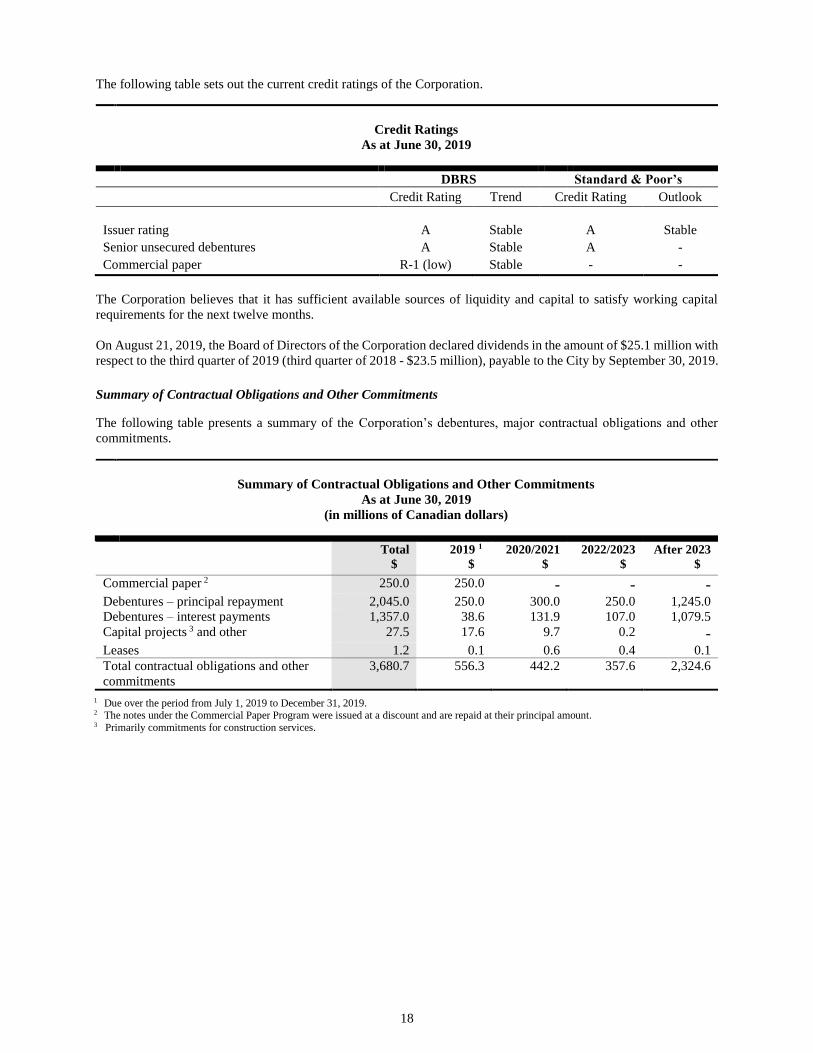
The following table sets out the current credit ratings of the Corporation.
Credit Ratings
As at June 30, 2019
DBRS Standard & Poor’s
Credit Rating Trend Credit Rating Outlook
Issuer rating A Stable A Stable
Senior unsecured debentures A Stable A -
Commercial paper R-1 (low) Stable - -
The Corporation believes that it has sufficient available sources of liquidity and capital to satisfy working capital
requirements for the next twelve months.
On August 21, 2019, the Board of Directors of the Corporation declared dividends in the amount of $25.1 million with
respect to the third quarter of 2019 (third quarter of 2018 - $23.5 million), payable to the City by September 30, 2019.
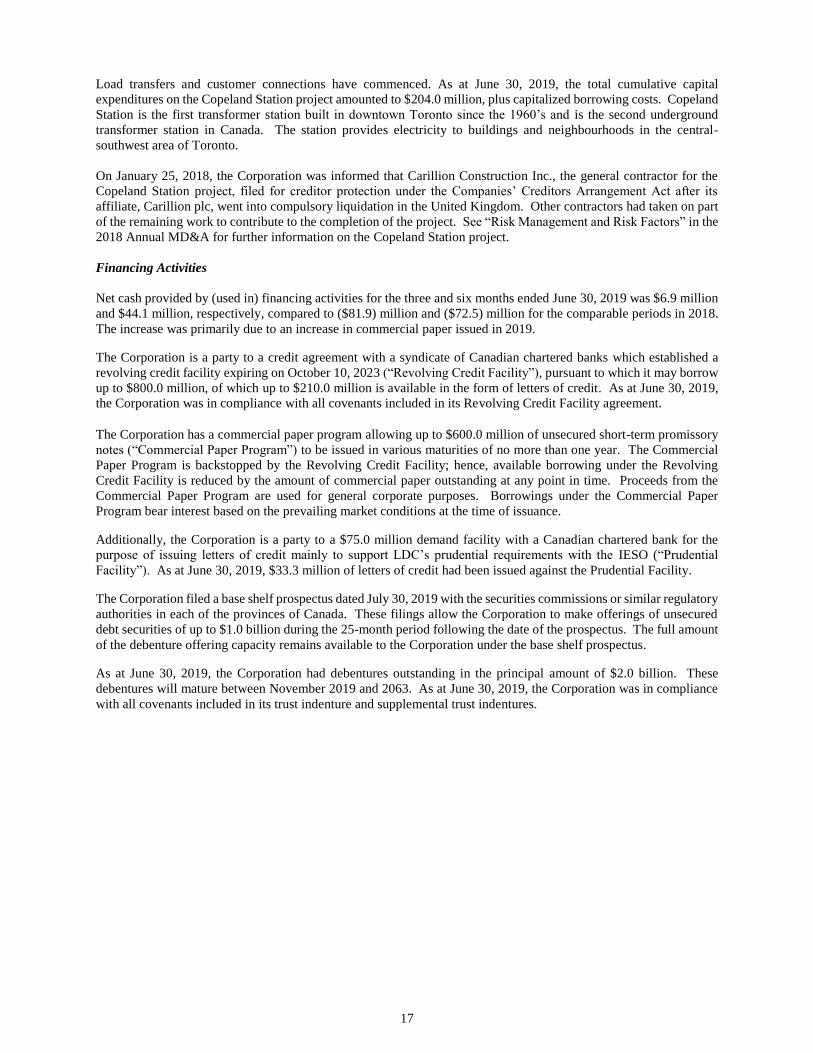
Summary of Contractual Obligations and Other Commitments
The following table presents a summary of the Corporation’s debentures, major contractual obligations and other
commitments.
Summary of Contractual Obligations and Other Commitments
As at June 30, 2019 (in millions of Canadian dollars)
Total
$
2019 1
$
2020/2021
$
2022/2023
$
After 2023
$
Commercial paper 2 250.0 250.0 - - -
Debentures – principal repayment 2,045.0 250.0 300.0 250.0 1,245.0
Debentures – interest payments 1,357.0 38.6 131.9 107.0 1,079.5
Capital projects 3 and other 27.5 17.6 9.7 0.2 -
Leases 1.2 0.1 0.6 0.4 0.1
Total contractual obligations and other
commitments
3,680.7 556.3 442.2 357.6 2,324.6
1 Due over the period from July 1, 2019 to December 31, 2019. 2 The notes under the Commercial Paper Program were issued at a discount and are repaid at their principal amount. 3 Primarily commitments for construction services.
19
Corporate Developments
Fixing the Hydro Mess Act
On May 9, 2019, the Government of Ontario enacted Bill 87, the Fixing the Hydro Mess Act, 2019. The legislation,
however, is not yet fully in force as there are varying commencement provisions for different schedules of the Fixing
the Hydro Mess Act. Once proclaimed in its entirety the legislation will amend the Electricity Act, the Ontario Energy
Board Act, 1998, the Energy Consumer Protection Act, 2010, the Ontario Rebate for Electricity Consumers Act, 2016,
and the Ontario Fair Hydro Plan Act, 2017.
Included among the amendments most relevant to the Corporation are those related to changing the governance of the
OEB. These amendments will come into force on a date to be named by proclamation of the Lieutenant Governor of
Ontario. Once that occurs the OEB will have a board of directors, the roles of Chair and CEO will be bifurcated, and
a new position called Chief Commissioner will be established. As a general protocol the administrative and rule-
making functions of the OEB will be managed by the board of directors and CEO, and the adjudicative functions of
the OEB will be performed by the commissioners.
In addition, the Fixing the Hydro Mess Act will revise the mechanism by which customers currently receive credits
on their bills through the Fair Hydro Plan and Ontario Rebate for Electricity Consumers. Included among the revisions
most relevant to the Corporation are those that change the display of the credit on the bill, and that reduce potential
liability associated with billing and settlement activities associated with the credit. These changes will come into force
November 1, 2019.
CDM Activities
On March 21, 2019, the Government of Ontario issued Ministerial Directives to the IESO and the effect of this action
includes changing the delivery of CDM programs. Previously, LDC and other distributors delivered the CDM
programs; under the new method, the IESO will be responsible for delivering the CDM programs.
Under its ECA with the IESO, LDC had a joint CDM plan with Oakville Hydro Electricity Distribution Inc. for the
delivery of CDM programs over the 2015-2020 period. As part of implementing its new mandate, the IESO terminated
the ECA effective June 20, 2019. LDC was required to cease marketing and business development for all CDM
programs immediately and make commercially reasonable efforts to wind down the delivery of programs. The
termination of the ECA also eliminated end of term cost efficiency incentives available to LDC if it met or exceeded
its electricity savings plan targets for programs under the full cost recovery funding method. Participant agreements
with customers for many of the CDM programs that were in effect before April 1, 2019 will remain in effect
notwithstanding the termination of the ECA and LDC will remain responsible for its obligations under such
agreements. Participants will have until December 31, 2020 to complete the projects. The IESO has published a
Conservation First Framework program wind-down guideline on the process for reimbursement of eligible expenses
and administrative costs relating to the wind-down of the local distribution companies’ role in the CDM programs.
Amounts received from the IESO for the funding of the projects under the participant agreements but not yet spent,
are presented on the Consolidated Balance Sheets under current liabilities as deferred conservation credit. Settlement
will continue with the IESO until all projects are completed and a finance and compliance audit will be completed
thereafter.
Electricity Distribution Rates
On August 31, 2018, LDC filed its 2019 rate application seeking the OEB’s approval to finalize distribution rates and
other charges for the period commencing on January 1, 2019 and ending on December 31, 2019. On December 13,
2018, the OEB issued a decision and rate order approving LDC’s 2019 rates and providing for other deferral and
variance account dispositions.
On August 15, 2018, LDC filed a CIR application seeking approval of LDC’s 2020 test-year revenue requirement on
a cost of service basis and the corresponding electricity distribution rates effective January 1, 2020, and the subsequent
annual rate adjustments based on a custom index specific to LDC for the period commencing on January 1, 2021 and
ending on December 31, 2024. The rate application requests approvals to fund capital expenditures of approximately
$2.8 billion over the 2020-2024 period. The rate application also seeks approval to include in LDC’s rate base capital
amounts that were incurred prior to 2020.
20
Controls and Procedures
For purposes of certain Canadian securities regulations, the Corporation is a “Venture Issuer”. As such, it is exempt
from certain requirements of National Instrument 52-109 Certification of Disclosure in Issuers’ Annual and Interim
Filings. The Chief Executive Officer and Chief Financial Officer have reviewed the Interim Financial Statements and
the MD&A for the three and six months ended June 30, 2019 and 2018. Based on their knowledge and exercise of
reasonable diligence, they have concluded that these documents fairly present in all material respects the financial
condition, financial performance and cash flows of the Corporation as at the date of and for the period presented.
Risk Management and Risk Factors
As part of ongoing risk management practices, the Corporation reviews current and proposed transactions to consider
their impact on its risk profile. There have been no material changes to the risk profile or risk management practices
as described in the Corporation’s 2018 Annual MD&A.
Critical Accounting Estimates
The preparation of the Corporation’s Interim Financial Statements requires management to make judgments, estimates
and assumptions which affect the application of accounting policies, reported assets, liabilities and regulatory
balances, and the disclosure of contingent assets and liabilities at the date of the Interim Financial Statements, and the
reported revenues and expenses for the period. The estimates are based on historical experience, current conditions
and various other assumptions that are believed to be reasonable under the circumstances, the results of which form
the basis for making judgments about the carrying values of assets and liabilities as well as for identifying and
assessing the accounting treatment with respect to commitments and contingencies. Actual results could differ from
those estimates, including changes as a result of future decisions made by the OEB, the IESO, the Ontario Ministry of
Energy or the Ontario Ministry of Finance. Estimates and underlying assumptions are reviewed on an ongoing basis.
Revisions to estimates are recognized prospectively.
Future Accounting Pronouncements
Definition of Material (Amendments to IAS 1 Presentation of Financial Statements and IAS 8 Accounting
Policies, Changes in Accounting Estimates and Errors)
On October 31, 2018, the IASB issued amendments to IAS 1 and IAS 8 – the amendments clarify the definition of
‘material’ and align the definition used in the Conceptual Framework for Financial Reporting and the standards
themselves. The amendments are effective for annual reporting periods beginning on or after January 1, 2020. Earlier
adoption is permitted.
Management anticipates that the adoption of these amendments will not have a material impact on the Corporation’s
consolidated financial statements, if any.
Forward-Looking Information
Certain information included in this MD&A constitutes “forward-looking information” within the meaning of
applicable securities legislation. The purpose of the forward-looking information is to provide the Corporation's
current expectations regarding future results of operations, performance, business prospects and opportunities and
may not be appropriate for other purposes. All information, other than statements of historical fact, which address
activities, events or developments that we expect or anticipate may or will occur in the future, are forward-looking
information. The words “anticipates”, “believes”, “budgets”, “committed”, “can”, “could”, “estimates”, “expects”,
“focus”, “forecasts”, “future”, “intends”, “may”, “might”, “plans”, “propose”, “projects”, “schedule”, “seek”,
“should”, “trend”, “will”, “would”, “objective”, “outlook” or the negative or other variations of these words or other
comparable words or phrases, are intended to identify forward-looking information, although not all forward-looking
information contains these identifying words. The forward-looking information reflects the Corporation's current
beliefs and is based on information currently available to the Corporation.
Specific forward-looking information in the MD&A includes, but is not limited to, the statements regarding the
settlement variance and other regulatory balance variances as described in the section entitled “Results of Operations”;
the effect of changes in energy consumption on future revenue as described in the section entitled “Summary of
Quarterly Results of Operations”; the Corporation’s plans to lower overall financing costs and enhance borrowing

21
flexibility as described in the section entitled “Liquidity and Capital Resources”; the Corporation’s available sources
of liquidity and capital resources and the sufficiency thereof to satisfy working capital requirements for the next twelve
months as described in the section entitled “Liquidity and Capital Resources”; the anticipated contractual obligations
and other commitments of the Corporation over the next five years as set out in the section entitled “Liquidity and
Capital Resources”; the payment of dividends as described in the section entitled “Liquidity and Capital Resources”;
the termination of the ECA, and the continuance of participant agreements that were in effect before April 1, 2019
and LDC’s continued responsibility for its obligations thereunder as described in the section entitled “Corporate
Developments”; the continued settlement with the IESO until all continued projects are completed and the completion
of a finance and compliance audit thereafter as described in the section entitled “Corporate Developments”; the effects
of the Fixing the Hydro Mess Act on the Corporation’s business as described in the section entitled “Corporate
Developments”; and the expectation that the adoption of the amendments to IAS 1 and IAS 8 will not have a material
impact on the Corporation’s consolidated financial statements, if any.
The forward-looking information is based on estimates and assumptions made by the Corporation's management in
light of past experience and perception of historical trends, current conditions and expected future developments, as
well as other factors that management believes to be reasonable in the circumstances, including, but not limited to, the
amount of indebtedness of the Corporation, changes in funding requirements, no unforeseen changes in the demand
for energy consumption, the future course of the economy and financial markets, no unforeseen delays and costs in
the Corporation’s capital projects, no unforeseen changes to project plans, no significant changes in weather compared
to historical seasonal trends, no unforeseen changes in the legislative and operating framework for electricity
distribution in Ontario, no unforeseen changes in public policy, the receipt of applicable regulatory approvals and
requested rate orders, no unexpected delays in obtaining required approvals, the ability of the Corporation to obtain
and retain qualified staff, materials, equipment and services in a timely and cost efficient manner, continued contractor
performance, compliance with covenants, the receipt of favourable judgments, no unforeseen changes in electricity
distribution rate orders or rate setting methodologies, no unfavourable changes in environmental regulation, the ratings
issued by credit rating agencies, the level of interest rates and the Corporation's ability to borrow and assumptions
regarding general business and economic conditions.
The forward-looking information is subject to risks, uncertainties and other factors that could cause actual results to
differ materially from historical results or results anticipated by the forward-looking information. The factors which
could cause results or events to differ from current expectations include, but are not limited to, risks associated with
the execution of LDC’s capital and maintenance programs necessary to maintain the performance of aging distribution
assets and make required infrastructure improvements; risks associated with capital projects, including Copeland
Station; risks associated with electricity industry regulatory developments and other governmental policy changes,
including factors relating to LDC’s distribution activities; risks associated with increased competition from regulated
and unregulated entities; risks associated with the timing and results of regulatory decisions regarding LDC’s revenue
requirements, cost recovery and rates; risks associated with information system security and with maintaining complex
information technology systems; risks associated with maintaining the security of the Corporation’s information
assets; risks associated with failure of the newly implemented ERP system; risk of external threats to LDC’s facilities
and operations posed by unexpected weather conditions caused by climate change and other factors, terrorism and
pandemics and LDC’s limited insurance coverage for losses resulting from these events; risk to the Corporation’s
employees and the general public of serious/fatal injuries and illnesses relating to or impacting upon its activities;
risks of municipal government activity, including the risk that the City could introduce rules, policies or directives
that can potentially limit the Corporation’s ability to meet its business objectives as laid out in the Shareholder
Direction principles; risks related to LDC’s work force demographic and its potential inability to train and retain
skilled employees; risks of being unable to retain necessary qualified external contracting forces relating to its capital,
maintenance and reactive infrastructure program; risks associated with possible labour disputes and LDC’s ability to
negotiate appropriate collective agreements; risk that the Corporation may fail to monitor the external environment
and or develop and pursue strategies through appropriate business models, thus failing to gain a strategic advantage;
risk that Toronto Hydro is not able to arrange sufficient and cost-effective debt financing to repay maturing debt and
to fund capital expenditures and other obligations; risk that the Corporation is unable to maintain its financial health
and performance at acceptable levels; risk that insufficient debt or equity financing will be available to meet the
Corporation’s requirements, objectives, or strategic opportunities; risk of downgrades to the Corporation’s credit
rating; risks related to the timing and extent of changes in prevailing interest rates and discounts rates and their effect
on future revenue requirements and future post-employment benefit obligations; risk associated with the impairment
to the Corporation’s image in the community, public confidence or brand; risk associated with the Corporation failing
to meet its material compliance obligations under legal and regulatory instruments; risk of substantial and currently
undetermined or underestimated environmental costs and liabilities; risk that assumptions that form the basis of LDC’s
recorded environmental liabilities and related regulatory balances may change; risk that the presence or release of
hazardous or harmful substances could lead to claims by third parties and/or governmental orders and other factors

22
which are discussed in more detail under the section entitled “Risk Management and Risk Factors” in this MD&A and
in the 2018 Annual MD&A. Please review the section “Risk Management and Risk Factors” in this MD&A and in
the 2018 Annual MD&A in detail. All of the forward-looking information included in this MD&A is qualified by the
cautionary statements in this “Forward-Looking Information” section and the “Risk Management and Risk Factors”
section in this MD&A and in the 2018 Annual MD&A. These factors are not intended to represent a complete list of
the factors that could affect the Corporation; however, these factors should be considered carefully and readers should
not place undue reliance on forward-looking information made herein. Furthermore, the forward-looking information
contained herein is dated as of the date of this MD&A or as of the date specified in this MD&A, as the case may be,
and the Corporation has no intention and undertakes no obligation to update or revise any forward-looking
information, whether as a result of new information, future events or otherwise, except as required by law.
Additional Information
Additional information with respect to the Corporation (including its annual information form) is available on the
System for Electronic Document Analysis and Retrieval website at www.sedar.com.
Toronto, Canada
August 21, 2019
See Second Quarter Financial Report for abbreviations and defined termsused in the unaudited condensed interim consolidated financial statements.
UNAUDITED CONDENSED INTERIM CONSOLIDATED FINANCIAL STATEMENTSFOR THE THREE AND SIX MONTHS ENDED JUNE 30, 2019 AND 2018
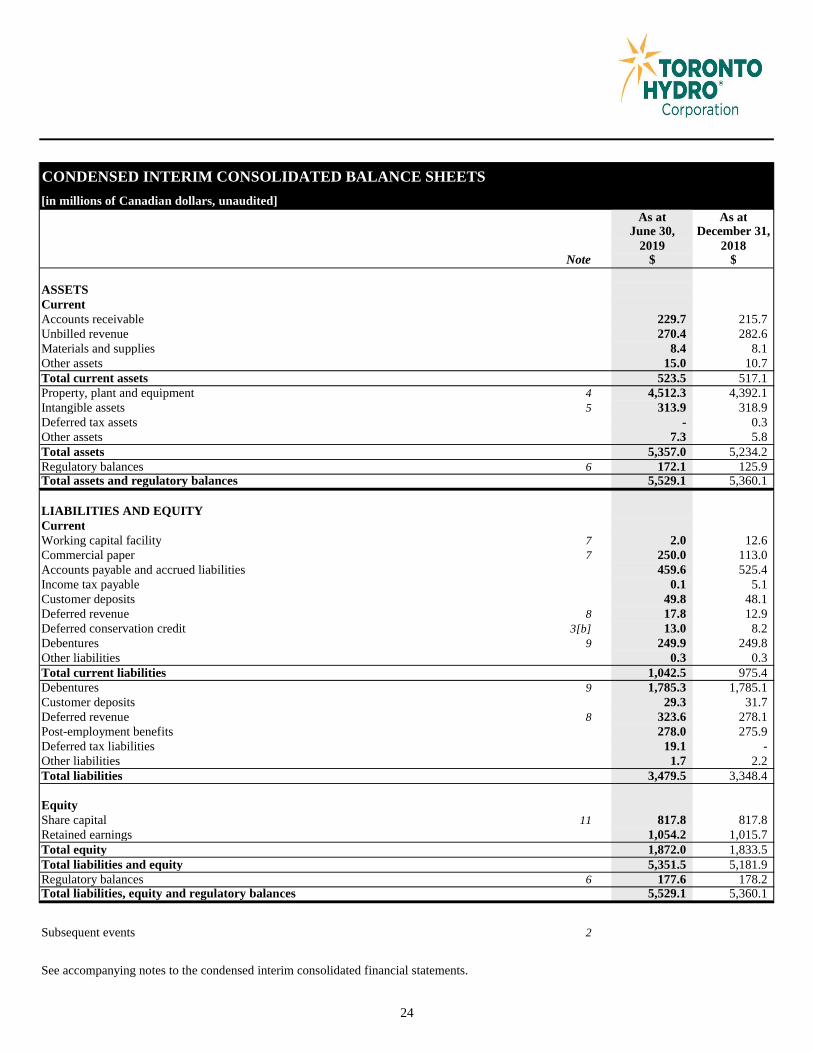
CONDENSED INTERIM CONSOLIDATED BALANCE SHEETS[in millions of Canadian dollars, unaudited]
As at As atJune 30, December 31,
2019 2018Note $ $
[note 26]ASSETSCurrentAccounts receivable [notes 4 and 15[b]] 229.7 215.7Unbilled revenue [note 15[b]] 270.4 282.6Materials and supplies [note 5] 8.4 8.1Other assets [note 5] 15.0 10.7Total current assets 523.5 517.1Property, plant and equipment [note 4] 4 4,512.3 4,392.1Intangible assets [note 5] 5 313.9 318.9Deferred tax assets [note 20] - 0.3Other assets [note 5] 7.3 5.8Total assets 5,357.0 5,234.2Regulatory balances [note 6] 6 172.1 125.9Total assets and regulatory balances 5,529.1 5,360.1
LIABILITIES AND EQUITYCurrentWorking capital facility [note 7] 7 2.0 12.6Commercial paper [note 7] 7 250.0 113.0Accounts payable and accrued liabilities [note 10] 459.6 525.4Income tax payable 0.1 5.1Customer deposits 49.8 48.1Deferred revenue [note 8] 8 17.8 12.9Deferred conservation credit [note 3[b]] 3[b] 13.0 8.2Debentures [note 12] 9 249.9 249.8Other liabilities [note 23] 0.3 0.3Total current liabilities 1,042.5 975.4Debentures [note 12] 9 1,785.3 1,785.1Customer deposits 29.3 31.7Deferred revenue [note 8] 8 323.6 278.1Post-employment benefits [note 13] 278.0 275.9Deferred tax liabilities 19.1 -Other liabilities [note 23] 1.7 2.2Total liabilities 3,479.5 3,348.4
EquityShare capital [note 10] 11 817.8 817.8Retained earnings 1,054.2 1,015.7Total equity 1,872.0 1,833.5Total liabilities and equity 5,351.5 5,181.9Regulatory balances [note 6] 6 177.6 178.2Total liabilities, equity and regulatory balances 5,529.1 5,360.1
Subsequent events [note 2] 2
See accompanying notes to the condensed interim consolidated financial statements.
24
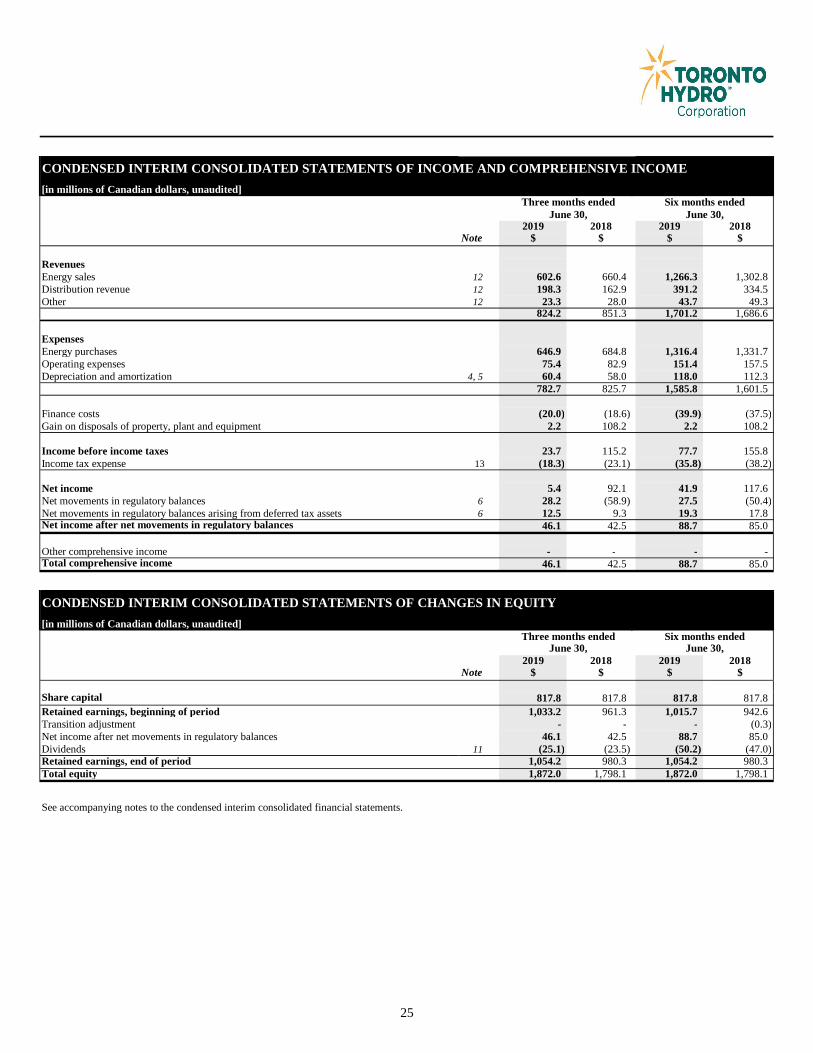
CONDENSED INTERIM CONSOLIDATED STATEMENTS OF INCOME AND COMPREHENSIVE INCOME[in millions of Canadian dollars, unaudited]
Three months ended Six months endedJune 30, June 30,
2019 2018 2019 2018Note $ $ $ $
[note 14] [note 25[q]]RevenuesEnergy sales [note 11] 12 602.6 660.4 1,266.3 1,302.8Distribution revenue [note 11] 12 198.3 162.9 391.2 334.5Other [note 11] 12 23.3 28.0 43.7 49.3
824.2 851.3 1,701.2 1,686.6
ExpensesEnergy purchases 646.9 684.8 1,316.4 1,331.7Operating expenses [note 18] 75.4 82.9 151.4 157.5Depreciation and amortization [notes 4 and 5] 4, 5 60.4 58.0 118.0 112.3
782.7 825.7 1,585.8 1,601.5
Finance costs [note 19] (20.0) (18.6) (39.9) (37.5)Gain on disposals of property, plant and equipment \ 2.2 108.2 2.2 108.2
Income before income taxes 23.7 115.2 77.7 155.8Income tax expense [note 12] 13 (18.3) (23.1) (35.8) (38.2)
Net income 5.4 92.1 41.9 117.6Net movements in regulatory balances [note 6] 6 28.2 (58.9) 27.5 (50.4)Net movements in regulatory balances arising from deferred tax assets [note 6] 6 12.5 9.3 19.3 17.8Net income after net movements in regulatory balances 46.1 42.5 88.7 85.0
Other comprehensive income - - - -Total comprehensive income 46.1 42.5 88.7 85.0
CONDENSED INTERIM CONSOLIDATED STATEMENTS OF CHANGES IN EQUITY[in millions of Canadian dollars, unaudited]
Three months ended Six months endedJune 30, June 30,
2019 2018 2019 2018Note $ $ $ $
[note 23] [note 25[q]]Share capital [note 17] 817.8 817.8 817.8 817.8Retained earnings, beginning of period 1,033.2 961.3 1,015.7 942.6Transition adjustment [note 14[d]] - - - (0.3)Net income after net movements in regulatory balances 46.1 42.5 88.7 85.0Dividends [note 10] 11 (25.1) (23.5) (50.2) (47.0)Retained earnings, end of period 1,054.2 980.3 1,054.2 980.3Total equity 1,872.0 1,798.1 1,872.0 1,798.1
See accompanying notes to the condensed interim consolidated financial statements.
25
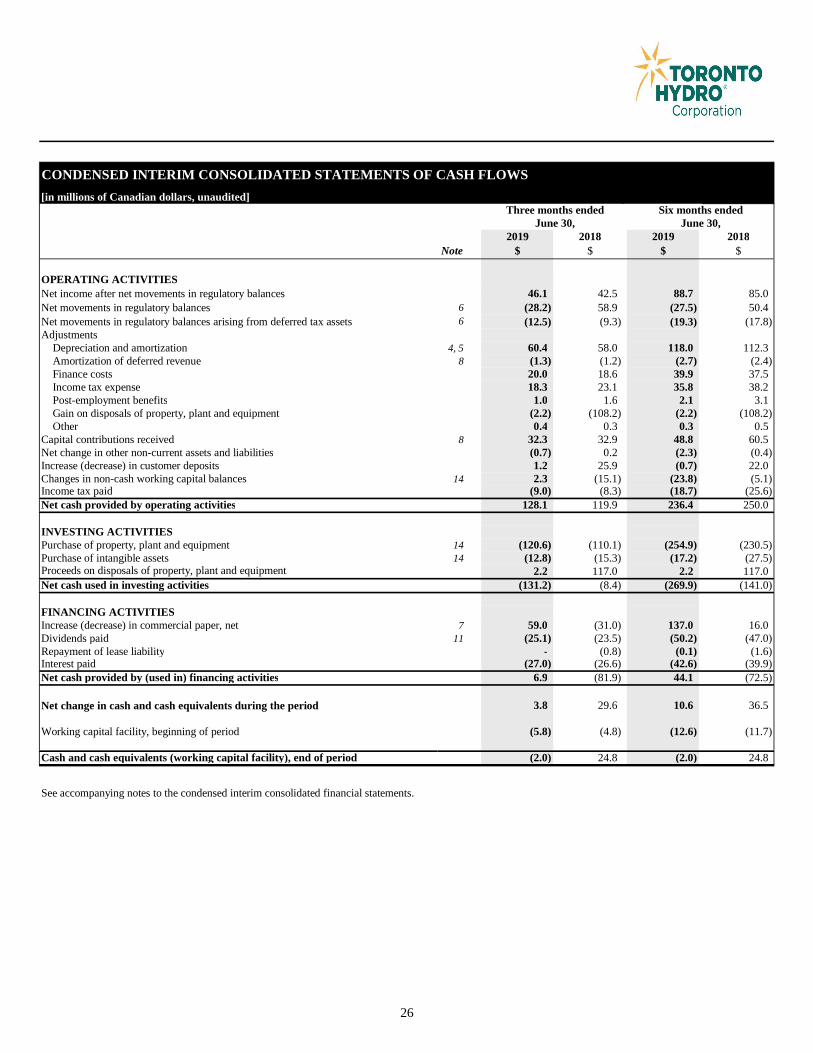
CONDENSED INTERIM CONSOLIDATED STATEMENTS OF CASH FLOWS
Three months ended Six months endedJune 30, June 30,
2019 2018 2019 2018Note $ $ $ $
[note 23] [note 26]OPERATING ACTIVITIESNet income after net movements in regulatory balances 46.1 42.5 88.7 85.0Net movements in regulatory balances [note 6] 6 (28.2) 58.9 (27.5) 50.4Net movements in regulatory balances arising from deferred tax assets [note 6] 6 (12.5) (9.3) (19.3) (17.8)Adjustments Depreciation and amortization [notes 4 and 5] 4, 5 60.4 58.0 118.0 112.3 Amortization of deferred revenue [note 8] 8 (1.3) (1.2) (2.7) (2.4) Finance costs 20.0 18.6 39.9 37.5 Income tax expense 18.3 23.1 35.8 38.2 Post-employment benefits 1.0 1.6 2.1 3.1 Gain on disposals of property, plant and equipment [note 6[a]] (2.2) (108.2) (2.2) (108.2) Other 0.4 0.3 0.3 0.5Capital contributions received [note 8] 8 32.3 32.9 48.8 60.5Net change in other non-current assets and liabilities (0.7) 0.2 (2.3) (0.4)Increase (decrease) in customer deposits 1.2 25.9 (0.7) 22.0Changes in non-cash working capital balances [note 13] 14 2.3 (15.1) (23.8) (5.1)Income tax paid (9.0) (8.3) (18.7) (25.6)Net cash provided by operating activities 128.1 119.9 236.4 250.0
INVESTING ACTIVITIESPurchase of property, plant and equipment [note 13] 14 (120.6) (110.1) (254.9) (230.5)Purchase of intangible assets [note 13] 14 (12.8) (15.3) (17.2) (27.5)Proceeds on disposals of property, plant and equipment [note 6[a]] 2.2 117.0 2.2 117.0Net cash used in investing activities (131.2) (8.4) (269.9) (141.0)
FINANCING ACTIVITIESIncrease (decrease) in commercial paper, net [note 7] 7 59.0 (31.0) 137.0 16.0Dividends paid [note 10] 11 (25.1) (23.5) (50.2) (47.0)Repayment of lease liability - (0.8) (0.1) (1.6)Interest paid (27.0) (26.6) (42.6) (39.9)Net cash provided by (used in) financing activities 6.9 (81.9) 44.1 (72.5)
Net change in cash and cash equivalents during the period 3.8 29.6 10.6 36.5
Working capital facility, beginning of period (5.8) (4.8) (12.6) (11.7)
Cash and cash equivalents (working capital facility), end of period (2.0) 24.8 (2.0) 24.8
See accompanying notes to the condensed interim consolidated financial statements.
[in millions of Canadian dollars, unaudited]
26

NOTES TO THE CONDENSED INTERIM CONSOLIDATED FINANCIAL STATEMENTS For the three and six months ended June 30, 2019 and 2018
[Unaudited; all tabular amounts in millions of Canadian dollars]
27
1. NATURE OF BUSINESS
The Corporation was incorporated on June 23, 1999 under the Business Corporations Act (Ontario) in accordance with the
Electricity Act. The Corporation is wholly owned by the City and is domiciled in Canada, with its registered office located
at 14 Carlton Street, Toronto, Ontario, M5B 1K5. The Corporation and its subsidiaries distribute electricity to customers
and provide street lighting and expressway lighting services in the City.
2. BASIS OF PRESENTATION
The Corporation’s unaudited condensed interim consolidated financial statements as at and for the three and six months
ended June 30, 2019 and 2018 [“Interim Financial Statements”] have been prepared in accordance with IAS 34 Interim
Financial Reporting. The notes presented in these Interim Financial Statements include only significant transactions and
changes occurring for the six months since the year-end of December 31, 2018. The disclosures in these Interim Financial
Statements do not conform in all respects to the IFRS requirements for annual consolidated financial statements. These
Interim Financial Statements have been prepared following the same accounting policies and methods of computation as
described in note 25 to the Corporation’s audited consolidated financial statements for the year ended December 31, 2018
[“2018 Annual Financial Statements”]. Accordingly, they should be read in conjunction with the Corporation’s 2018
Annual Financial Statements.
These Interim Financial Statements are presented in Canadian dollars, the Corporation’s functional currency, and have
been prepared on the historical cost basis, except for post-employment benefits which are recorded at actuarial value.
The Corporation’s revenues, all other things being equal, are impacted by temperature fluctuations and unexpected weather
conditions. Revenues would tend to be higher in the first quarter as a result of higher energy consumption for winter
heating, and in the third quarter due to air conditioning/cooling. The Corporation’s results are also impacted by fluctuations
in electricity prices and the timing and recognition of regulatory decisions.
The Corporation has evaluated the events and transactions occurring after the condensed interim consolidated balance sheet
date through August 21, 2019 when the Corporation’s Interim Financial Statements were authorized for issuance by the
Corporation’s Board of Directors, and identified the events and transactions which required recognition in the Interim
Financial Statements and/or disclosure in the notes to the Interim Financial Statements [notes 9 and 11].
3. REGULATION
a) Fixing the Hydro Mess Act
On May 9, 2019, the Government of Ontario enacted Bill 87, the Fixing the Hydro Mess Act, 2019. The legislation,
however, is not yet fully in force as there are varying commencement provisions for different schedules of the Fixing the
Hydro Mess Act. Once proclaimed in its entirety, the legislation will amend the Electricity Act, the Ontario Energy Board
Act, 1998, the Energy Consumer Protection Act, 2010, the Ontario Rebate for Electricity Consumers Act, 2016, and the
Ontario Fair Hydro Plan Act, 2017.
Included among the amendments most relevant to the Corporation are those related to changing the governance of the
OEB. These amendments will come into force on a date to be named by proclamation of the Lieutenant Governor of
Ontario. Once that occurs, the OEB will have a board of directors, the roles of Chair and CEO will be bifurcated, and a
new position called Chief Commissioner will be established. As a general protocol the administrative and rule-making
NOTES TO THE CONDENSED INTERIM CONSOLIDATED FINANCIAL STATEMENTS For the three and six months ended June 30, 2019 and 2018
[Unaudited; all tabular amounts in millions of Canadian dollars]
28
functions of the OEB will be managed by the board of directors and CEO, and the adjudicative functions of the OEB will
be performed by the commissioners.
In addition, the Fixing the Hydro Mess Act will revise the mechanism by which customers currently receive credits on
their bills through the Fair Hydro Plan and Ontario Rebate for Electricity Consumers. Included among the revisions most
relevant to the Corporation are those that change the display of the credit on the bill, and that reduce potential liability
associated with billing and settlement activities associated with the credit. These changes will come into force November
1, 2019.
b) CDM Activities
On March 21, 2019, the Government of Ontario issued Ministerial Directives to the IESO and the effect of this action
includes changing the delivery of CDM programs. Previously, LDC and other distributors delivered the CDM programs;
under the new method, the IESO will be responsible for delivering the CDM programs.
Under its ECA with the IESO, LDC had a joint CDM plan with Oakville Hydro Electricity Distribution Inc. for the delivery
of CDM programs over the 2015-2020 period. As part of implementing its new mandate, the IESO terminated the ECA
effective June 20, 2019. LDC was required to cease marketing and business development for all CDM programs
immediately and make commercially reasonable efforts to wind down the delivery of programs. Participant agreements
with customers for many of the CDM programs that were in effect before April 1, 2019 will remain in effect
notwithstanding the termination of the ECA and LDC will remain responsible for its obligations under such agreements.
Participants will have until December 31, 2020 to complete the projects. Amounts received from the IESO for the funding
of the projects under the participant agreements, but not yet spent, are presented on the Corporation’s Consolidated Balance
Sheets under current liabilities as deferred conservation credit.
c) Electricity Distribution Rates
On August 31, 2018, LDC filed its 2019 rate application seeking the OEB’s approval to finalize distribution rates and other
charges for the period commencing on January 1, 2019 and ending on December 31, 2019. On December 13, 2018, the
OEB issued a decision and rate order approving LDC’s 2019 rates and providing for other deferral and variance account
dispositions.
On August 15, 2018, LDC filed a CIR application seeking approval of LDC’s 2020 test-year revenue requirement on a cost
of service basis and the corresponding electricity distribution rates effective January 1, 2020, and the subsequent annual
rate adjustments based on a custom index specific to LDC for the period commencing on January 1, 2021 and ending on
December 31, 2024. The rate application requests approvals to fund capital expenditures of approximately $2.8 billion
over the 2020-2024 period. The rate application also seeks approval to include in LDC’s rate base capital amounts that
were incurred prior to 2020.
NOTES TO THE CONDENSED INTERIM CONSOLIDATED FINANCIAL STATEMENTS For the three and six months ended June 30, 2019 and 2018
[Unaudited; all tabular amounts in millions of Canadian dollars]
29
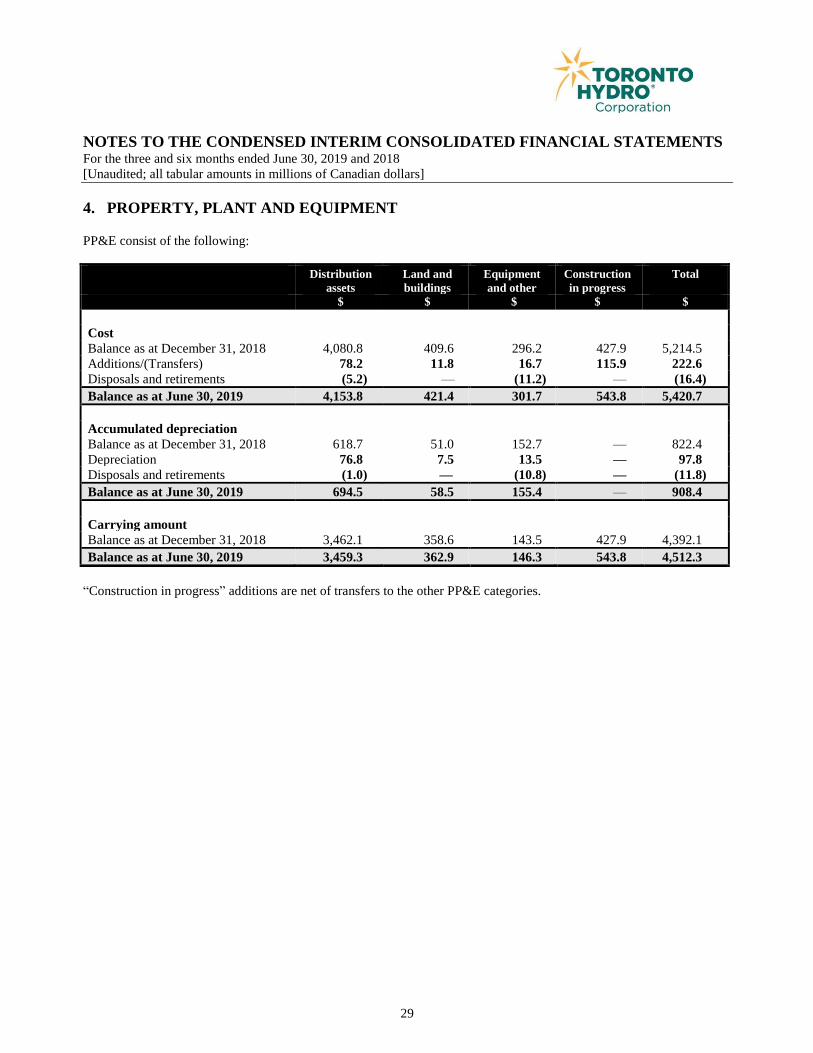
4. PROPERTY, PLANT AND EQUIPMENT
PP&E consist of the following:
“Construction in progress” additions are net of transfers to the other PP&E categories.
Distribution
assets
Land and
buildings
Equipment
and other
Construction
in progress
Total
$ $ $ $ $
Cost
Balance as at December 31, 2018 4,080.8 409.6 296.2 427.9 5,214.5
Additions/(Transfers) 78.2 11.8 16.7 115.9 222.6
Disposals and retirements (5.2) — (11.2) — (16.4)
Balance as at June 30, 2019 4,153.8 421.4 301.7 543.8 5,420.7
Accumulated depreciation
Balance as at December 31, 2018 618.7 51.0 152.7 — 822.4
Depreciation 76.8 7.5 13.5 — 97.8
Disposals and retirements (1.0) — (10.8) — (11.8)
Balance as at June 30, 2019 694.5 58.5 155.4 — 908.4
Carrying amount
Balance as at December 31, 2018 3,462.1 358.6 143.5 427.9 4,392.1
Balance as at June 30, 2019 3,459.3 362.9 146.3 543.8 4,512.3
NOTES TO THE CONDENSED INTERIM CONSOLIDATED FINANCIAL STATEMENTS For the three and six months ended June 30, 2019 and 2018
[Unaudited; all tabular amounts in millions of Canadian dollars]
30
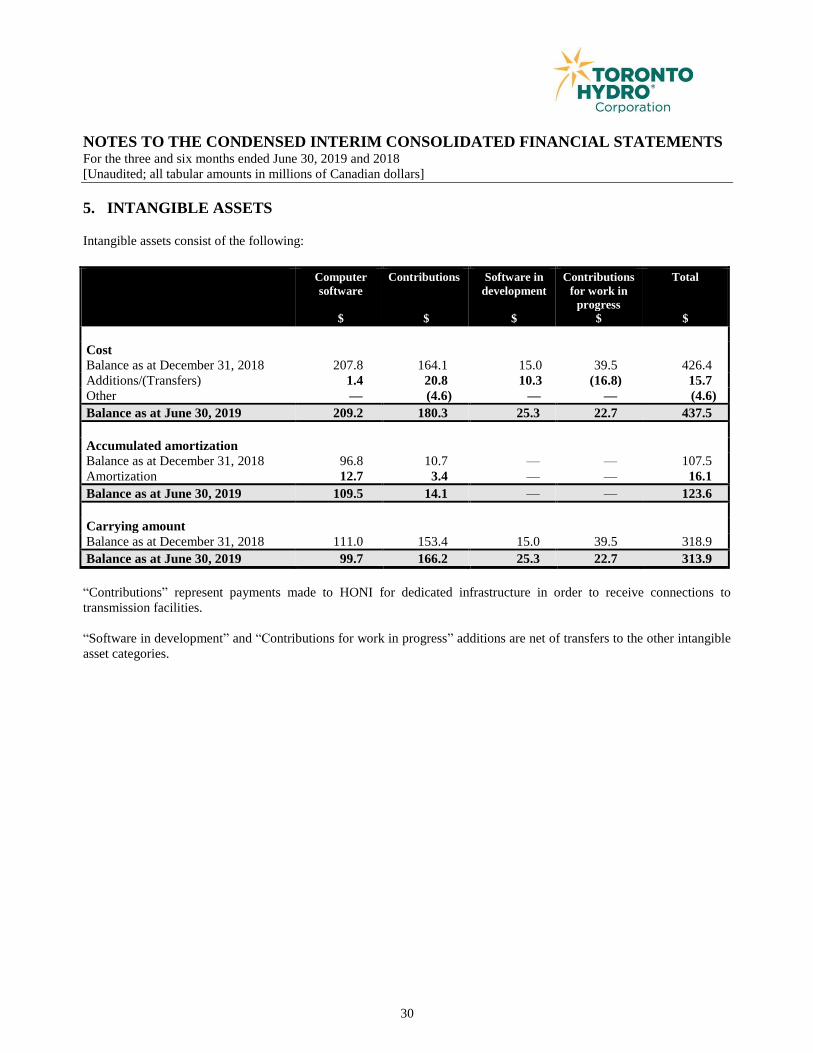
5. INTANGIBLE ASSETS
Intangible assets consist of the following:
“Contributions” represent payments made to HONI for dedicated infrastructure in order to receive connections to
transmission facilities.
“Software in development” and “Contributions for work in progress” additions are net of transfers to the other intangible
asset categories.
Computer
software
Contributions
Software in
development
Contributions
for work in
progress
Total
$ $ $ $ $
Cost
Balance as at December 31, 2018 207.8 164.1 15.0 39.5 426.4
Additions/(Transfers) 1.4 20.8 10.3 (16.8) 15.7
Other — (4.6) — — (4.6)
Balance as at June 30, 2019 209.2 180.3 25.3 22.7 437.5
Accumulated amortization
Balance as at December 31, 2018 96.8 10.7 — — 107.5
Amortization 12.7 3.4 — — 16.1
Balance as at June 30, 2019 109.5 14.1 — — 123.6
Carrying amount
Balance as at December 31, 2018 111.0 153.4 15.0 39.5 318.9
Balance as at June 30, 2019 99.7 166.2 25.3 22.7 313.9

NOTES TO THE CONDENSED INTERIM CONSOLIDATED FINANCIAL STATEMENTS For the three and six months ended June 30, 2019 and 2018
[Unaudited; all tabular amounts in millions of Canadian dollars]
31
6. REGULATORY BALANCES
Debit balances consist of the following:
Credit balances consist of the following:
January 1,
2019
$
Balances
arising in
the period
$
Recovery/
reversal
$
Other
movements
$
June 30,
2019
$
Remaining
recovery/
reversal
period
(months)
Carrying
charges
applicable
Capital-related revenue
requirement 56.5
12.8
—
—
69.3
(1)
(2)
Gain on disposal 61.8 0.7 (1.3) — 61.2 (1) (2)
Derecognition 21.8 6.3 — — 28.1 (1) (2)
Development charges 7.9 0.7 — — 8.6 (1) (2)
Tax-related variances 1.1 — (0.6) — 0.5 — (2)
Smart meters 0.3 — — — 0.3 — —
Settlement variances 19.2 — — (19.2) — (1) (2)
Deferred taxes 1.9 — — (1.9) — (1) —
Other 7.7 1.9 — — 9.6 — (2)
178.2 22.4 (1.9) (21.1) 177.6
(1) There were no significant changes to the disposition period for the six months ended June 30, 2019. Refer to note 8 to the Corporation’s
2018 Annual Financial Statements for details. (2) Carrying charges were added to the regulatory balance in accordance with the OEB’s direction, at a rate of 2.45% for January 1, 2019
to March 31, 2019 and 2.18% for April 1, 2019 to June 30, 2019 [January 1, 2018 to March 31, 2018 – 1.50%, April 1, 2018 to September
30, 2018 – 1.89%, and October 1, 2018 to December 31, 2018 – 2.17%].
January 1,
2019
$
Balances
arising in
the period
$
Recovery/
reversal
$
Other
movements
$
June 30,
2019
$
Remaining
recovery/
reversal
period
(months)
Carrying
charges
applicable
OPEB net actuarial loss 48.1 — — — 48.1 (1) —
Settlement variances — 50.3 7.6 (19.2) 38.7 (1) (2)
LRAM 29.0 9.4 (5.6) — 32.8 (1) (2)
Deferred taxes — 19.3 — (1.9) 17.4 (1) —
Foregone revenue 23.2 — (10.1) — 13.1 6 —
OPEB cash versus accrual 5.4 1.1 — — 6.5 (1) —
IFRS transitional adjustments 7.0 — (3.9) — 3.1 6 —
Stranded meters 3.6 — (2.0) — 1.6 6 (2)
Named properties 1.6 — (0.7) — 0.9 6 —
Capital contributions 0.5 — (0.2) — 0.3 6 —
Other 7.5 2.1 — — 9.6 — (2)
125.9 82.2 (14.9) (21.1) 172.1
NOTES TO THE CONDENSED INTERIM CONSOLIDATED FINANCIAL STATEMENTS For the three and six months ended June 30, 2019 and 2018
[Unaudited; all tabular amounts in millions of Canadian dollars]
32
The “Balances arising in the period” column consists of new additions to regulatory balances. The “Recovery/reversal”
column consists of amounts disposed through OEB-approved rate riders or transactions reversing an existing regulatory
balance. The “Other movements” column consists of impairments and reclassifications between the regulatory debit and
credit balances.
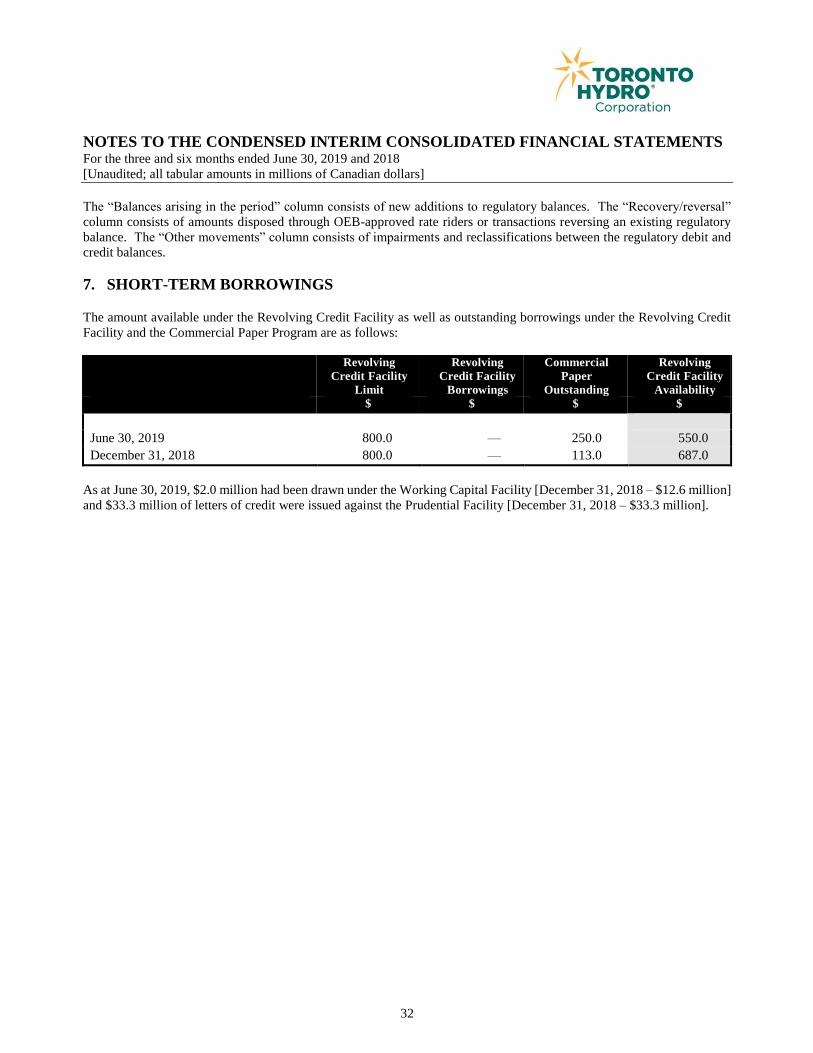
7. SHORT-TERM BORROWINGS
The amount available under the Revolving Credit Facility as well as outstanding borrowings under the Revolving Credit
Facility and the Commercial Paper Program are as follows:
Revolving
Credit Facility
Limit
Revolving
Credit Facility
Borrowings
Commercial
Paper
Outstanding
Revolving
Credit Facility
Availability
$ $ $ $
June 30, 2019 800.0 — 250.0 550.0
December 31, 2018 800.0 — 113.0 687.0
As at June 30, 2019, $2.0 million had been drawn under the Working Capital Facility [December 31, 2018 – $12.6 million]
and $33.3 million of letters of credit were issued against the Prudential Facility [December 31, 2018 – $33.3 million].

NOTES TO THE CONDENSED INTERIM CONSOLIDATED FINANCIAL STATEMENTS For the three and six months ended June 30, 2019 and 2018
[Unaudited; all tabular amounts in millions of Canadian dollars]
33
8. DEFERRED REVENUE
Deferred revenue consists of capital contributions received from electricity customers and developers to construct or
acquire PP&E and revenue from ancillary services which has not yet been recognized into other revenue.
As at and six
months ended
June 30,
2019
$
As at and year
ended
December 31,
2018
$
Capital contributions, beginning of period 288.6 188.2
Capital contributions received 48.8 106.5
Amortization (2.7) (5.3)
Other (0.2) (0.8)
Capital contributions, end of period 334.5 288.6
Other 6.9 2.4
Total deferred revenue 341.4 291.0
Less: Current portion of deferred revenue relating to:
Capital contributions 10.9 10.5
Other 6.9 2.4
Current portion of deferred revenue 17.8 12.9
Non-current portion of deferred revenue 323.6 278.1
9. DEBENTURES
The Corporation filed a base shelf prospectus dated July 30, 2019 with the securities commissions or similar regulatory
authorities in each of the provinces of Canada. These filings allow the Corporation to make offerings of unsecured debt
securities of up to $1.0 billion during the 25-month period following the date of the prospectus. The full amount of the
debenture offering capacity remains available to the Corporation under the base shelf prospectus.
10. FINANCIAL INSTRUMENTS
Recognition and measurement
As at June 30, 2019 and December 31, 2018, the fair values of accounts receivable, unbilled revenue, Working Capital
Facility, commercial paper, and accounts payable approximated their carrying amounts due to the short maturity of these
instruments. The fair value of customer deposits approximates their carrying amount taking into account interest accrued
on the outstanding balance. Obligations under leases are measured based on a discounted cash flow analysis and
approximate the carrying amounts as management believes that the fixed interest rates are representative of current market
rates.
The fair value of the debentures is based on the present value of contractual cash flows, discounted at the Corporation’s
current borrowing rate for similar debt instruments, and is included in Level 2 of the fair value hierarchy. As at June
30, 2019, the total fair value of the Corporation’s debentures was determined to be approximately $2,271.5 million
[December 31, 2018 – $2,087.3 million], with a total carrying amount of $2,035.2 million [December 31, 2018 – $2,034.9
million].
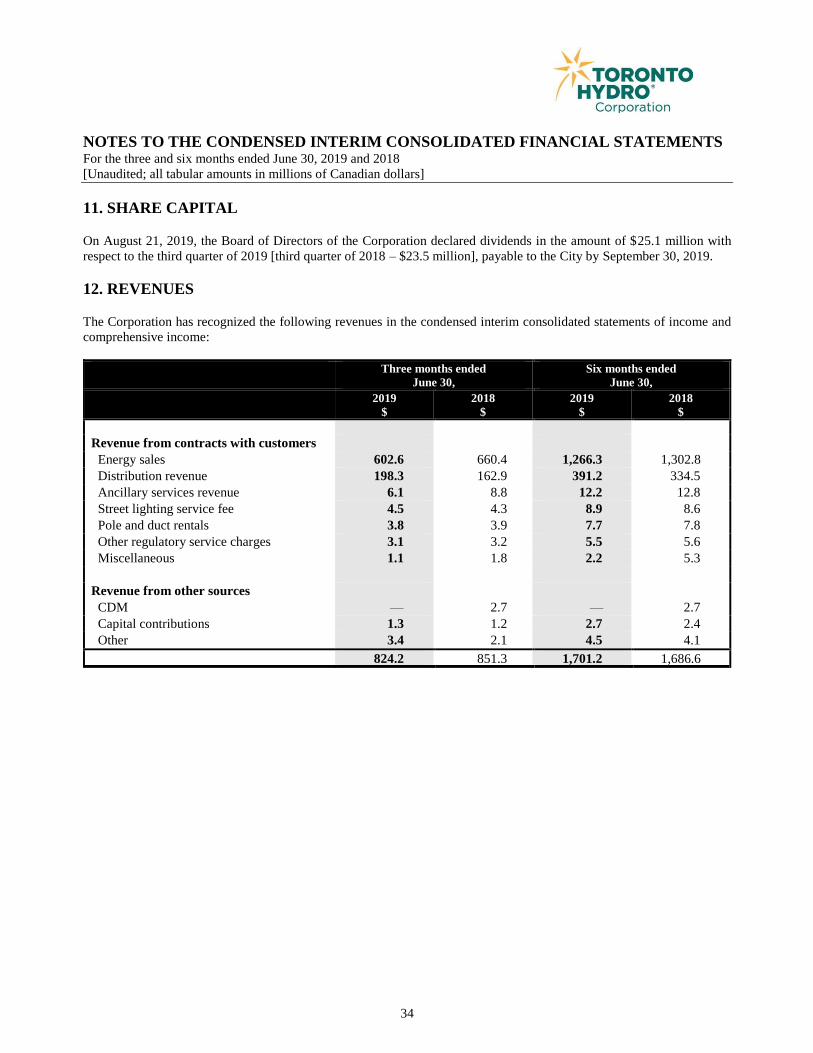
NOTES TO THE CONDENSED INTERIM CONSOLIDATED FINANCIAL STATEMENTS For the three and six months ended June 30, 2019 and 2018
[Unaudited; all tabular amounts in millions of Canadian dollars]
34
11. SHARE CAPITAL
On August 21, 2019, the Board of Directors of the Corporation declared dividends in the amount of $25.1 million with
respect to the third quarter of 2019 [third quarter of 2018 – $23.5 million], payable to the City by September 30, 2019.
12. REVENUES
The Corporation has recognized the following revenues in the condensed interim consolidated statements of income and
comprehensive income:
Three months ended
June 30,
Six months ended
June 30,
2019
$
2018
$
2019
$ 2018
$
Revenue from contracts with customers
Energy sales 602.6 660.4 1,266.3 1,302.8
Distribution revenue 198.3 162.9 391.2 334.5
Ancillary services revenue 6.1 8.8 12.2 12.8
Street lighting service fee 4.5 4.3 8.9 8.6
Pole and duct rentals
3.8 3.9 7.7 7.8
Other regulatory service charges
Ancillary services revenue
3.1 3.2 5.5 5.6
Miscellaneous 1.1 1.8 2.2 5.3
Revenue from other sources
CDM — 2.7 — 2.7
Capital contributions 1.3 1.2 2.7 2.4
Other 3.4 2.1 4.5 4.1
824.2 851.3 1,701.2 1,686.6
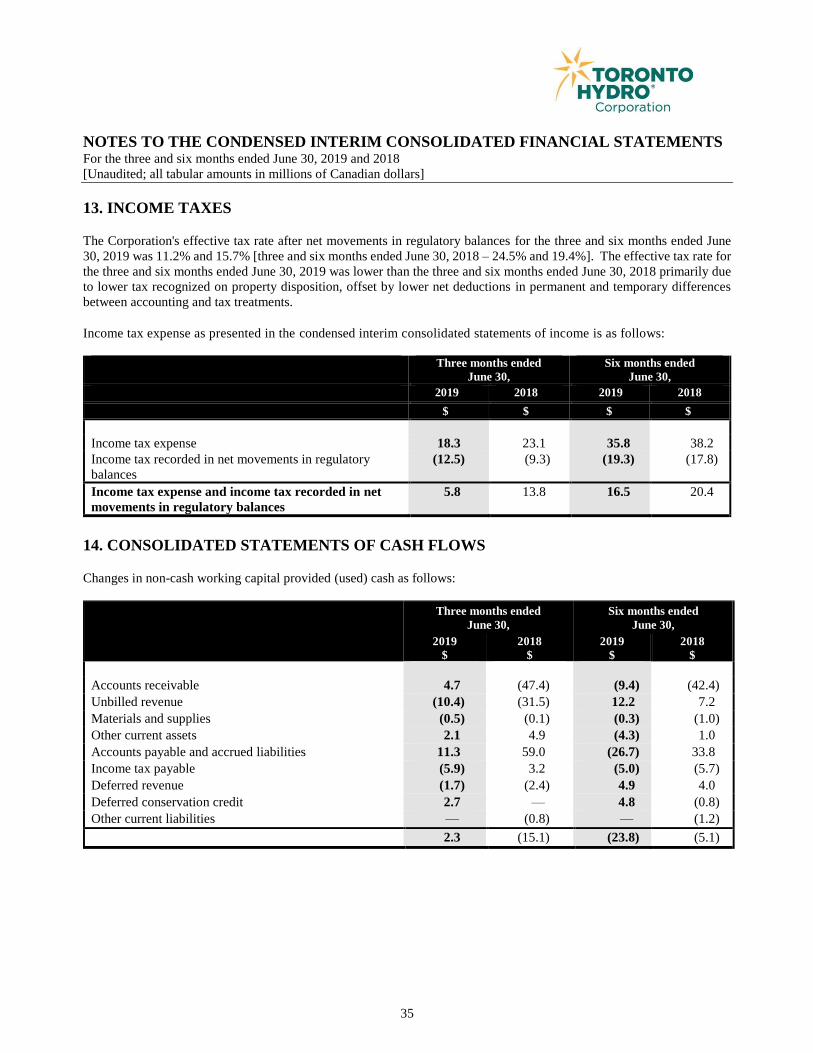
NOTES TO THE CONDENSED INTERIM CONSOLIDATED FINANCIAL STATEMENTS For the three and six months ended June 30, 2019 and 2018
[Unaudited; all tabular amounts in millions of Canadian dollars]
35
13. INCOME TAXES
The Corporation's effective tax rate after net movements in regulatory balances for the three and six months ended June
30, 2019 was 11.2% and 15.7% [three and six months ended June 30, 2018 – 24.5% and 19.4%]. The effective tax rate for
the three and six months ended June 30, 2019 was lower than the three and six months ended June 30, 2018 primarily due
to lower tax recognized on property disposition, offset by lower net deductions in permanent and temporary differences
between accounting and tax treatments.
Income tax expense as presented in the condensed interim consolidated statements of income is as follows:
Three months ended
June 30,
Six months ended
June 30,
2019
2018 2019
2018
$ $ $ $
Income tax expense 18.3 23.1 35.8 38.2
Income tax recorded in net movements in regulatory
balances
(12.5) (9.3) (19.3) (17.8)
Income tax expense and income tax recorded in net
movements in regulatory balances
5.8 13.8 16.5 20.4
14. CONSOLIDATED STATEMENTS OF CASH FLOWS
Changes in non-cash working capital provided (used) cash as follows:
Three months ended
June 30,
Six months ended
June 30,
2019
$
2018
$
2019
$
2018
$
Accounts receivable 4.7 (47.4) (9.4) (42.4)
Unbilled revenue (10.4) (31.5) 12.2 7.2
Materials and supplies (0.5) (0.1) (0.3) (1.0)
Other current assets 2.1 4.9 (4.3) 1.0
Accounts payable and accrued liabilities 11.3 59.0 (26.7) 33.8
Income tax payable (5.9) 3.2 (5.0) (5.7)
Deferred revenue (1.7) (2.4) 4.9 4.0
Deferred conservation credit 2.7 — 4.8 (0.8)
Other current liabilities — (0.8) — (1.2)
2.3 (15.1) (23.8) (5.1)
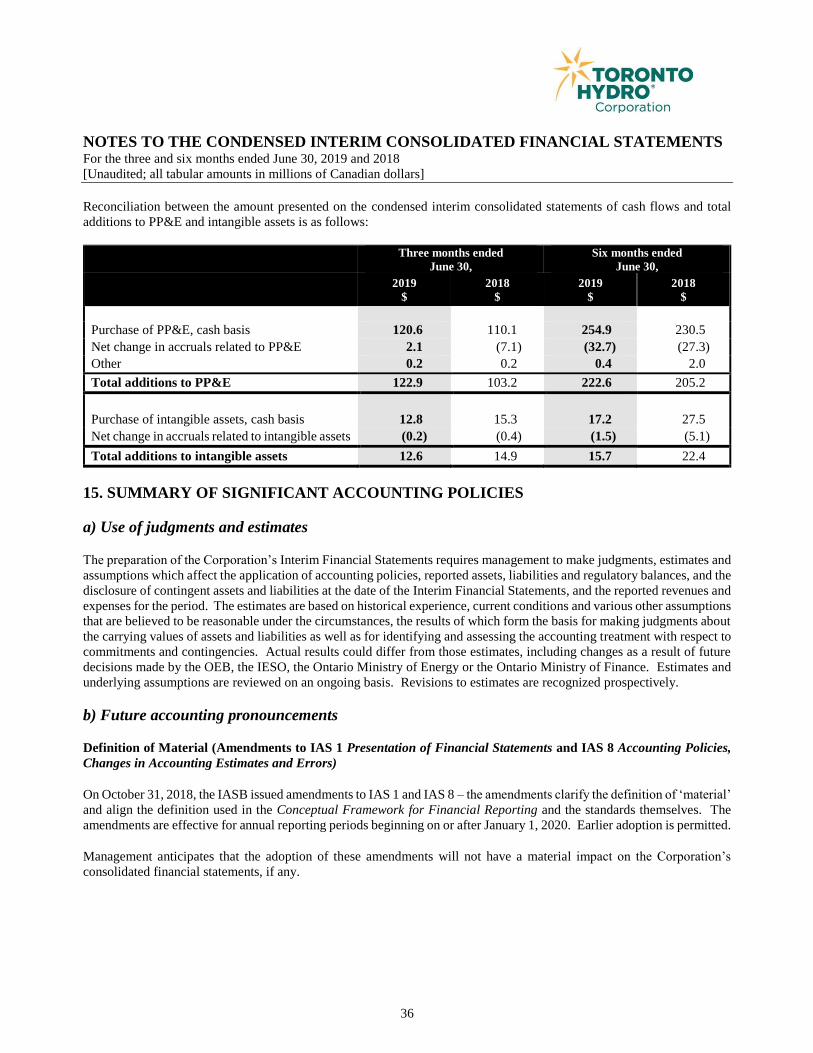
NOTES TO THE CONDENSED INTERIM CONSOLIDATED FINANCIAL STATEMENTS For the three and six months ended June 30, 2019 and 2018
[Unaudited; all tabular amounts in millions of Canadian dollars]
36
Reconciliation between the amount presented on the condensed interim consolidated statements of cash flows and total
additions to PP&E and intangible assets is as follows:
Three months ended
June 30,
Six months ended
June 30,
2019
$
2018
$
2019
$
2018
$
Purchase of PP&E, cash basis 120.6 110.1 254.9 230.5
Net change in accruals related to PP&E 2.1 (7.1) (32.7) (27.3)
Other 0.2 0.2 0.4 2.0
Total additions to PP&E 122.9 103.2 222.6 205.2
Purchase of intangible assets, cash basis 12.8 15.3 17.2 27.5
Net change in accruals related to intangible assets (0.2) (0.4) (1.5) (5.1)
Total additions to intangible assets 12.6 14.9 15.7 22.4
15. SUMMARY OF SIGNIFICANT ACCOUNTING POLICIES
a) Use of judgments and estimates
The preparation of the Corporation’s Interim Financial Statements requires management to make judgments, estimates and
assumptions which affect the application of accounting policies, reported assets, liabilities and regulatory balances, and the
disclosure of contingent assets and liabilities at the date of the Interim Financial Statements, and the reported revenues and
expenses for the period. The estimates are based on historical experience, current conditions and various other assumptions
that are believed to be reasonable under the circumstances, the results of which form the basis for making judgments about
the carrying values of assets and liabilities as well as for identifying and assessing the accounting treatment with respect to
commitments and contingencies. Actual results could differ from those estimates, including changes as a result of future
decisions made by the OEB, the IESO, the Ontario Ministry of Energy or the Ontario Ministry of Finance. Estimates and
underlying assumptions are reviewed on an ongoing basis. Revisions to estimates are recognized prospectively.
b) Future accounting pronouncements
Definition of Material (Amendments to IAS 1 Presentation of Financial Statements and IAS 8 Accounting Policies,
Changes in Accounting Estimates and Errors)
On October 31, 2018, the IASB issued amendments to IAS 1 and IAS 8 – the amendments clarify the definition of ‘material’
and align the definition used in the Conceptual Framework for Financial Reporting and the standards themselves. The
amendments are effective for annual reporting periods beginning on or after January 1, 2020. Earlier adoption is permitted.
Management anticipates that the adoption of these amendments will not have a material impact on the Corporation’s
consolidated financial statements, if any.


