39
Section 9.2 Variability
Section 9.2
Variability
Section 9.2
Variability
Objectives:1. To define and distinguish
measures of variability.2. To calculate measures of
variability.
Objectives:1. To define and distinguish
measures of variability.2. To calculate measures of
variability.

Variability is the amount of scatter or dispersion of data
from the mean.
Variability is the amount of scatter or dispersion of data
from the mean.

Consider the following values.28, 34, 41, 39, 34, 36, 40, 29, 33, 34, 30, 34, 37, 40, 33, 35, 32, 33, 34, 35, 39, 37, 36, 33, 34, 36, 34, 35, 29, 33, 35, 34, 36, 34
Consider the following values.28, 34, 41, 39, 34, 36, 40, 29, 33, 34, 30, 34, 37, 40, 33, 35, 32, 33, 34, 35, 39, 37, 36, 33, 34, 36, 34, 35, 29, 33, 35, 34, 36, 34
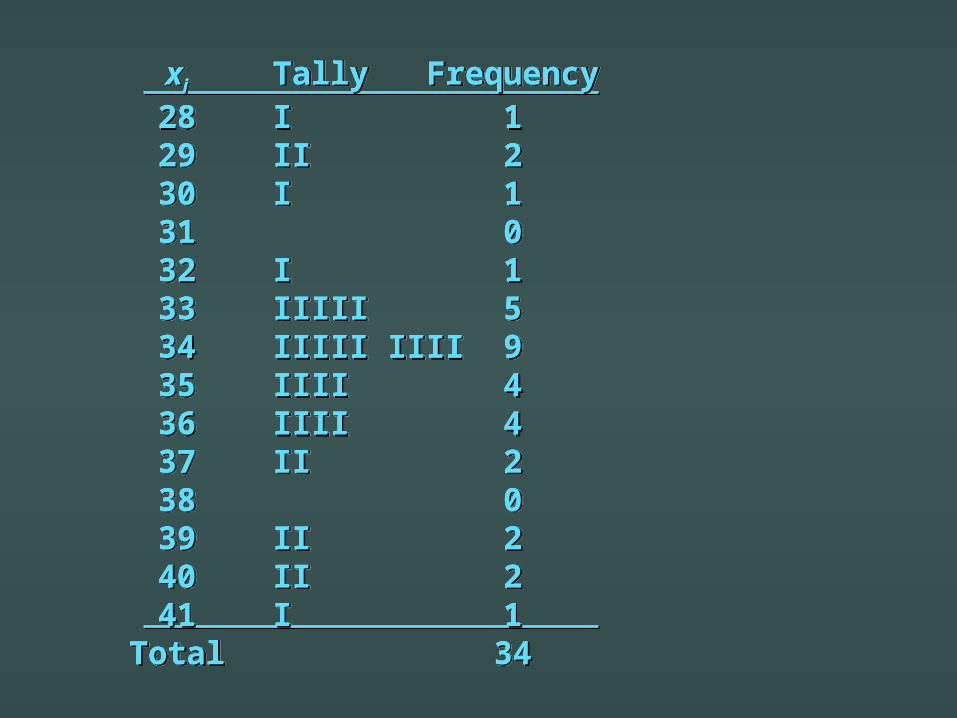
xi Tally Frequency28 I 129 II 230 I 131 032 I 133 IIIII 534 IIIII IIII 935 IIII 436 IIII 437 II 238 039 II 240 II 241 I 1
Total 34
xi Tally Frequency28 I 129 II 230 I 131 032 I 133 IIIII 534 IIIII IIII 935 IIII 436 IIII 437 II 238 039 II 240 II 241 I 1
Total 34
xi Tally Frequency28 I 129 II 230 I 131 032 I 133 IIIII 534 IIIII IIII 935 IIII 436 IIII 437 II 238 039 II 240 II 241 I 1
Total 34
xi Tally Frequency28 I 129 II 230 I 131 032 I 133 IIIII 534 IIIII IIII 935 IIII 436 IIII 437 II 238 039 II 240 II 241 I 1
Total 34
xi Tally Frequency28 I 129 II 230 I 131 032 I 133 IIIII 534 IIIII IIII 935 IIII 436 IIII 437 II 238 039 II 240 II 241 I 1
Total 34
xi Tally Frequency28 I 129 II 230 I 131 032 I 133 IIIII 534 IIIII IIII 935 IIII 436 IIII 437 II 238 039 II 240 II 241 I 1
Total 34

10-
9-
8-
7-
6-
5-
4-
3-
2-
1-
28 29 30 31 32 33 34 35 36 37 38 39 40 41
10-
9-
8-
7-
6-
5-
4-
3-
2-
1-
28 29 30 31 32 33 34 35 36 37 38 39 40 41
HistogramHistogramFr
eque
ncie
sFr
eque
ncie
s

little variabilitylittle variability

moderate variabilitymoderate variability
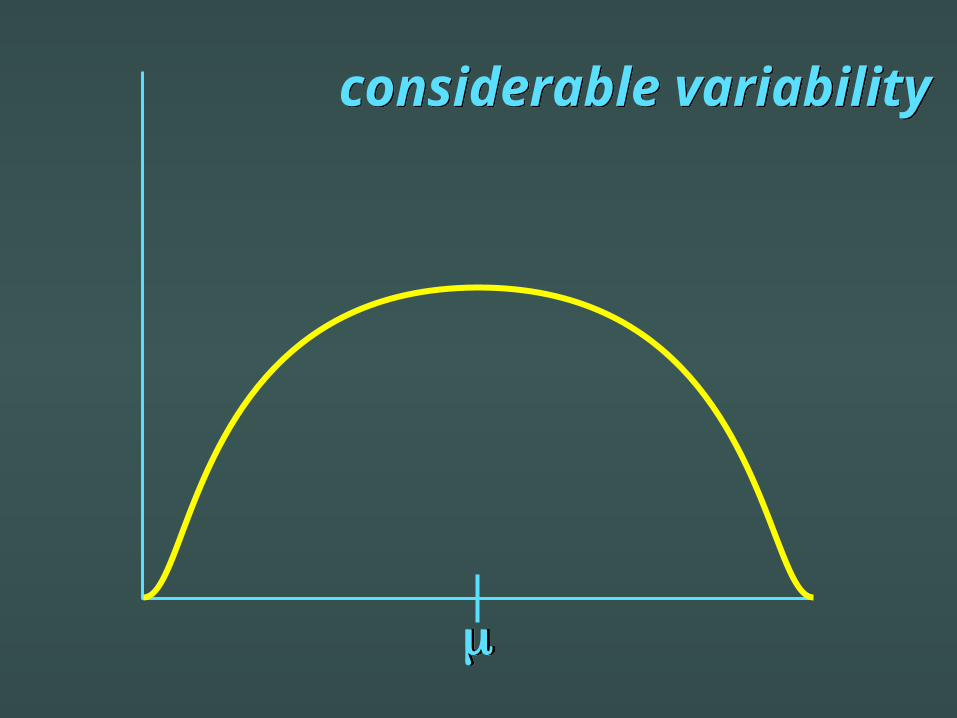
considerable variabilityconsiderable variability
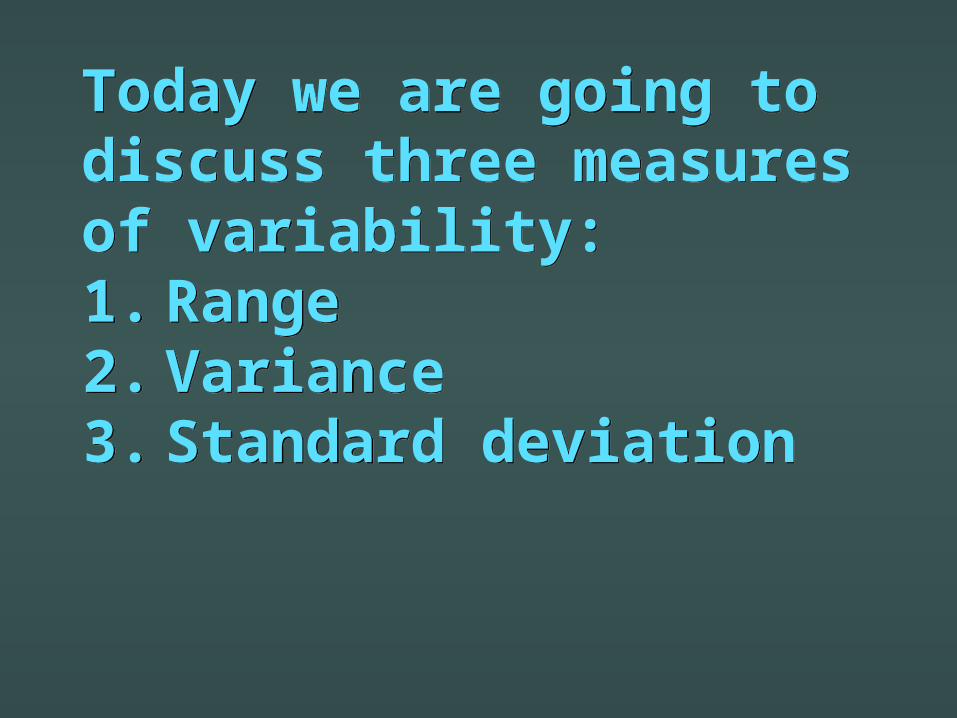
Today we are going to discuss three measures of variability:1. Range2. Variance3. Standard deviation
Today we are going to discuss three measures of variability:1. Range2. Variance3. Standard deviation

A B C
xi xi xi
8 10 10
7 8 6
6 6 6
5 4 6
4 2 2
A B C
xi xi xi
8 10 10
7 8 6
6 6 6
5 4 6
4 2 2

Each list has a mean and median of 6, but the lists are
not the same.
The range is the highest value minus the lowest
value.
Each list has a mean and median of 6, but the lists are
not the same.
The range is the highest value minus the lowest
value.
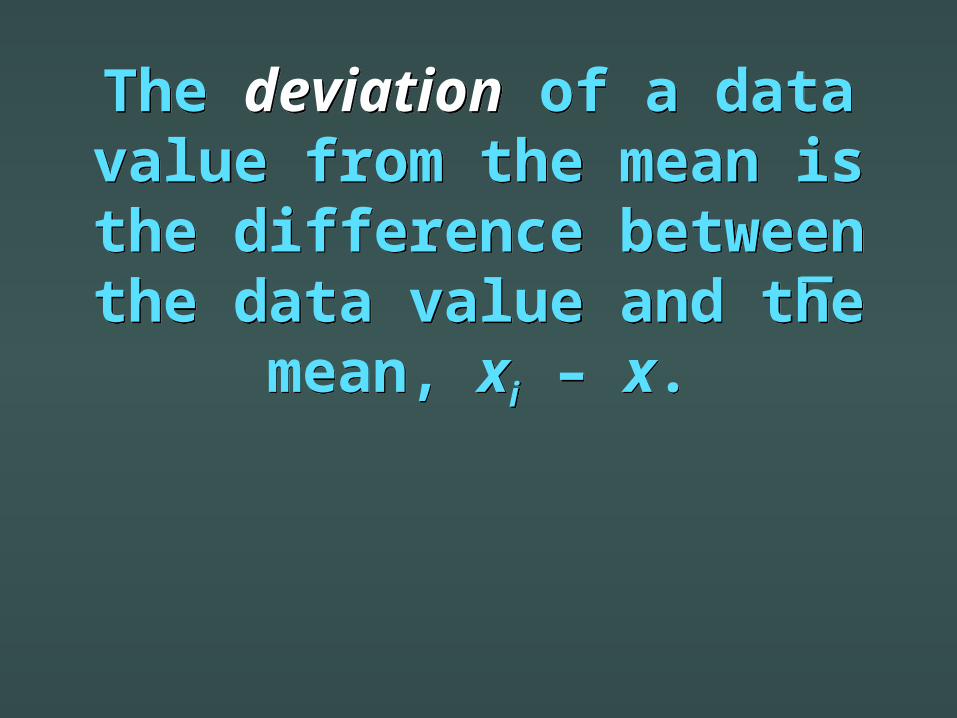
The deviation of a data value from the mean is the difference between the data value and the mean, xi – x.
The deviation of a data value from the mean is the difference between the data value and the mean, xi – x.

A B C
xi xi-x xi xi-x xi xi-x
8 2 10 4 10 4
7 1 8 2 6 0
6 0 6 0 6 0
5 -1 4 -2 6 0
4 -2 2 -4 2 -4
A B C
xi xi-x xi xi-x xi xi-x
8 2 10 4 10 4
7 1 8 2 6 0
6 0 6 0 6 0
5 -1 4 -2 6 0
4 -2 2 -4 2 -4

The mean deviation averages the absolute
values of the deviations.
The mean deviation averages the absolute
values of the deviations.
nn
nn
i=1i=1 |xi – x| |xi – x|

The sum of the squared deviations (numerator) is
important and is often abbreviated to SS for sum
of squares:
The sum of the squared deviations (numerator) is
important and is often abbreviated to SS for sum
of squares:
SS = (xi – x)2SS = (xi – x)2nn
i=1i=1

B C
xi xi-x (xi-x)2 xi xi-x (xi-x)2
10 4 16 10 4 16
8 2 4 6 0 0
6 0 0 6 0 0
4 -2 4 6 0 0
2 -4 16 2 -4 16
SS = 40 SS = 32
B C
xi xi-x (xi-x)2 xi xi-x (xi-x)2
10 4 16 10 4 16
8 2 4 6 0 0
6 0 0 6 0 0
4 -2 4 6 0 0
2 -4 16 2 -4 16
SS = 40 SS = 32

Variance The average of squared deviation.
For a population:
Variance The average of squared deviation.
For a population:
NN
NN
i=1i=1(xi – )2(xi – )2
2 =2 =
DefintionDefintionDefintionDefintion

Variance The average of squared deviation.
For a sample:
Variance The average of squared deviation.
For a sample:
n-1n-1
nn
i=1i=1(xi – x)2(xi – x)2
s2 =s2 =
DefintionDefintionDefintionDefintion
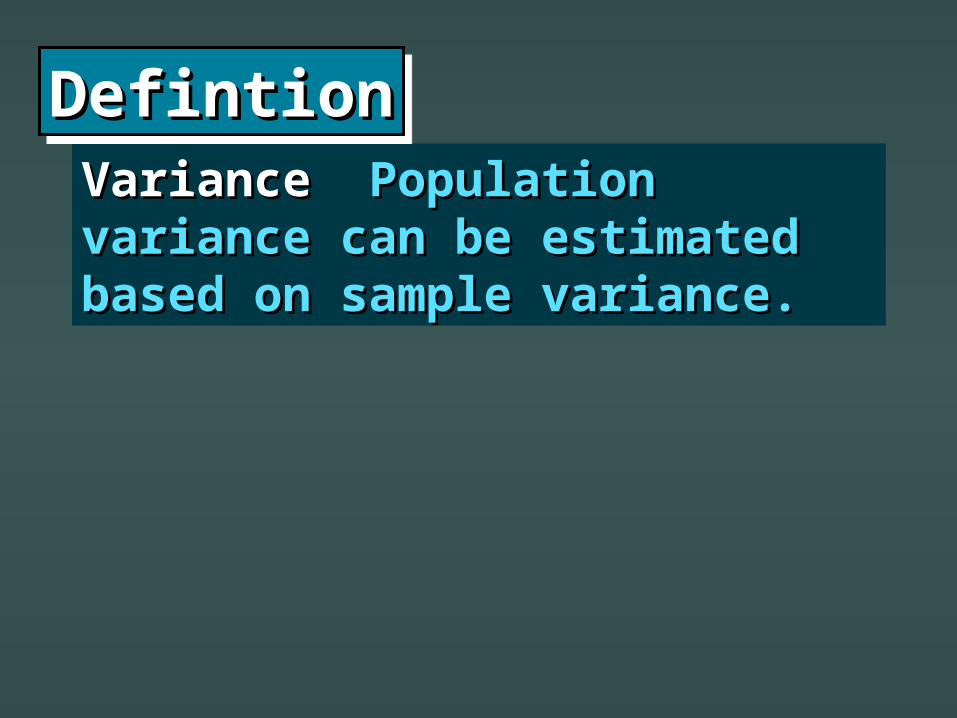
VarianceVariance Population variance can Population variance can be estimated based on sample be estimated based on sample variance.variance.
DefintionDefintionDefintionDefintion

Standard Deviation The square root of the variance.Standard Deviation The square root of the variance.
s =s =n - 1n - 1
nn
(xi - x)2(xi - x)2
i =1i =1
DefintionDefintionDefintionDefintion

Practice: Find SS, s2, and s for the data below:
25, 26, 32, 45, 51, 67
Practice: Find SS, s2, and s for the data below:
25, 26, 32, 45, 51, 67
xx 414166
246246====
1) Find the mean.
25 + 26 + 32 + 45 + 51 + 67 = 246
1) Find the mean.
25 + 26 + 32 + 45 + 51 + 67 = 246

x x - x (x - x)2x x - x (x - x)2
s = 16.5s = 16.5
25 -16 25626 -15 22532 -9 8145 4 1651 10 10067 26 676
SS = 1354
25 -16 25626 -15 22532 -9 8145 4 1651 10 10067 26 676
SS = 1354=270.8=270.8
6 - 16 - 113541354
s2 =s2 =
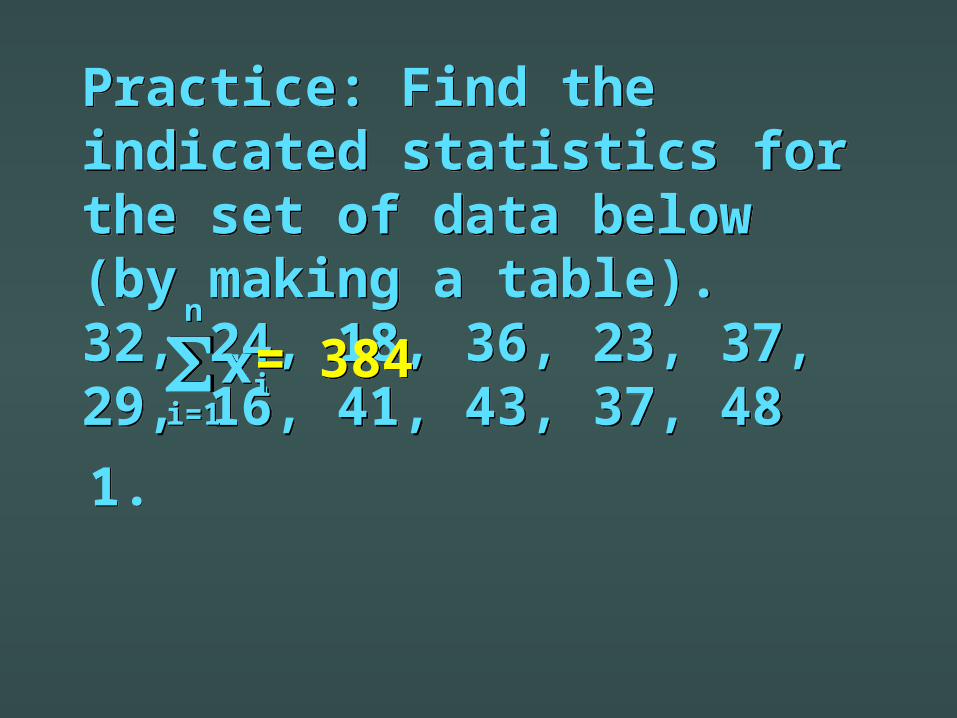
Practice: Find the indicated statistics for the set of data below (by making a table). 32, 24, 18, 36, 23, 37, 29, 16, 41, 43, 37, 48
1.
Practice: Find the indicated statistics for the set of data below (by making a table). 32, 24, 18, 36, 23, 37, 29, 16, 41, 43, 37, 48
1. nn
i=1i=1xixi
= 384= 384

Practice: Find the indicated statistics for the set of data below (by making a table). 32, 24, 18, 36, 23, 37, 29, 16, 41, 43, 37, 48
2. Mean
Practice: Find the indicated statistics for the set of data below (by making a table). 32, 24, 18, 36, 23, 37, 29, 16, 41, 43, 37, 48
2. Mean = 32= 32

x5 – x = -3x5 – x = -3
Practice: Find the indicated statistics for the set of data below (by making a table). 32, 24, 18, 36, 23, 37, 29, 16, 41, 43, 37, 48
3. Order the data and find the deviation of the fifth data value in the above list: x5 – x.
Practice: Find the indicated statistics for the set of data below (by making a table). 32, 24, 18, 36, 23, 37, 29, 16, 41, 43, 37, 48
3. Order the data and find the deviation of the fifth data value in the above list: x5 – x.

(xi – x)(xi – x)nn
i=1i=1 = 0= 0
Practice: Find the indicated statistics for the set of data below (by making a table). 32, 24, 18, 36, 23, 37, 29, 16, 41, 43, 37, 48
4.
Practice: Find the indicated statistics for the set of data below (by making a table). 32, 24, 18, 36, 23, 37, 29, 16, 41, 43, 37, 48
4.

|xi – x||xi – x|nn
i=1i=1 = 100= 100
Practice: Find the indicated statistics for the set of data below (by making a table). 32, 24, 18, 36, 23, 37, 29, 16, 41, 43, 37, 48
5.
Practice: Find the indicated statistics for the set of data below (by making a table). 32, 24, 18, 36, 23, 37, 29, 16, 41, 43, 37, 48
5.

≈ 8.3≈ 8.3
Practice: Find the indicated statistics for the set of data below (by making a table). 32, 24, 18, 36, 23, 37, 29, 16, 41, 43, 37, 48
6. Mean deviation
Practice: Find the indicated statistics for the set of data below (by making a table). 32, 24, 18, 36, 23, 37, 29, 16, 41, 43, 37, 48
6. Mean deviation

= 1130= 1130
Practice: Find the indicated statistics for the set of data below (by making a table). 32, 24, 18, 36, 23, 37, 29, 16, 41, 43, 37, 48
7. SS
Practice: Find the indicated statistics for the set of data below (by making a table). 32, 24, 18, 36, 23, 37, 29, 16, 41, 43, 37, 48
7. SS

≈ 102.7≈ 102.7
Practice: Find the indicated statistics for the set of data below (by making a table). 32, 24, 18, 36, 23, 37, 29, 16, 41, 43, 37, 48
8. s²
Practice: Find the indicated statistics for the set of data below (by making a table). 32, 24, 18, 36, 23, 37, 29, 16, 41, 43, 37, 48
8. s²

≈ 10.1≈ 10.1
Practice: Find the indicated statistics for the set of data below (by making a table). 32, 24, 18, 36, 23, 37, 29, 16, 41, 43, 37, 48
9. s
Practice: Find the indicated statistics for the set of data below (by making a table). 32, 24, 18, 36, 23, 37, 29, 16, 41, 43, 37, 48
9. s

= 32= 32
Practice: Find the indicated statistics for the set of data below (by making a table). 32, 24, 18, 36, 23, 37, 29, 16, 41, 43, 37, 48
10. range
Practice: Find the indicated statistics for the set of data below (by making a table). 32, 24, 18, 36, 23, 37, 29, 16, 41, 43, 37, 48
10. range

Homework:
pp. 456-457
Homework:
pp. 456-457

■ Cumulative Review
28. Given points A(9, -3) and B(2, -5), find AB, the midpoint of AB, and the point ¼ of the way from A to B.
■ Cumulative Review
28. Given points A(9, -3) and B(2, -5), find AB, the midpoint of AB, and the point ¼ of the way from A to B.

■ Cumulative Review
29. Write the equation of the line through A and B in exercise 28. Give your answer in standard form.
■ Cumulative Review
29. Write the equation of the line through A and B in exercise 28. Give your answer in standard form.

■ Cumulative Review
30. Which type of function is always continuous?
■ Cumulative Review
30. Which type of function is always continuous?
a. trigonometric
b. rational
c. radical
d. piece
a. trigonometric
b. rational
c. radical
d. piece

■ Cumulative Review
31. If f(x) is continuous and f(a) = 0, what happens at x = a on the graph of g(x) = ?
■ Cumulative Review
31. If f(x) is continuous and f(a) = 0, what happens at x = a on the graph of g(x) = ?11
f(x)f(x)

■ Cumulative Review
32. Write the equation of a hyperbola opening vertically that is centered at the origin with b = 6 and with perpendicular asymptotes.
■ Cumulative Review
32. Write the equation of a hyperbola opening vertically that is centered at the origin with b = 6 and with perpendicular asymptotes.


