SECTION V REGIONAL INFLUENCES A. ECONOMIC INFLUENCES This section provides an overview of the economic environment in Ohio Appalachia. A number of different indicators are used illustrate the changes that the region underwent during the 1980s and continue to experience. A brief examination of economic determinants of educational access is followed by a description and analysis of the 29-county region’s economy.
Transcript
SECTION VREGIONAL INFLUENCES
A. ECONOMIC INFLUENCES
This section provides an overview of the economic environment in Ohio Appalachia. A numberof different indicators are used illustrate the changes that the region underwent during the 1980s andcontinue to experience. A brief examination of economic determinants of educational access isfollowed by a description and analysis of the 29-county region’s economy.
114M.L. Blackburn, D.E. Bloom, and R.B. Freeman, “The Declining Economic Position of Less-Skilled AmericanMen,” National Bureau of Economic Research, 1989, NBER 3186.
115Jerry S. Davis and Kingston Johns, Jr., “Low Family Income: A Continuing Barrier to College Enrollment?” Journalof Student Financial Aid (February 1982): 5-10.
116Winship C. Fuller, Charles F. Manski, and David A. Wise, "New Evidence on the EconomicDeterminants of Postsecondary Schooling Choices." The Journal of Human Resources XVII (Fall 1982): 477-98;Stafford, Lundstedt, and Lynn; Stage and Hossler; Borus and Carpenter; Thomas G. Braun, "An Analysis of theEffects of Geographic-Demographic Factors on College Attendance," Research in Hi her Education 19, no. 2 (1983):131-52; J. S. Davis and K. Johns, "Low Family Income: A Continuing Barrier to College Enrollment?" Journal ofStudent Financial Aid 12 (February 1982): 5-10.
118Pelavin and Kane, 37.
ECONOMIC INFLUENCES ON EDUCATIONAL ACCESS
An analysis of the economic status of the region is highly pertinent to a consideration ofparticipation rates in higher education. Both the overall health and composition of the regional economyare determinants of educational access. In turn, the level of education of a region's population affects itseconomic potential. This is increasingly true where the labor market is demanding skill levels114 thatpoorer rural youth will be unable to supply unless educationalaccess is improved. Although there are many influences other than economic onthe decision to participate in higher education, the ease and effectiveness with which policy interventioncan occur in this area make it especially important to consider.115
Family Income
The ability to pay for an education as well as the socioeconomic status of a student's family jointly affectthe participation rate.116 For example, data for 1990 from the Current Population Survey show that lowlevels of educational attainment are clearly associated with high poverty rates in the United States, evenwhen controlled for ethnicity.117
Pelavin and Kane found that students with family incomes below $15,000 are less than half as likely topursue higher education than those with family incomes above $25,000.118 Thus, lower than averageper capita and family incomes in Ohio Appalachia than in the state and the United States account to alarge extent for the poor participation rate.
Regional Economic Structure / The Labor Market
Family income alone, however, is not the sole economic determinant of higher education participation.The human capital model assumes that an individual's decision to go on to higher education will in part
119Stafford, Lundstedt, and Lynn, 593.
120Paulsen, 29.
121See page 30 for a discussion of the high school students’ intentions to remain in or leave the region.
122Stafford, Lundstedt, and Lynn, 591.
be influenced by a judgement about the expected future earnings to be gained as a result of highereducational attainment. This involves an assessment, albeit crude, by the potential student of thelikelihood of attaining the desired level of future income either with or without the additionaleducation.119
Paulsen reports findings that a student is more likely to attend college when collegegraduates are in greater demand in the labor market and when noncollege graduates face fewer jobopportunities. In addition, evidence suggests that this effect is stronger for students from lower-incomefamilies."120 Thus, where there are fewer job opportunities for non-college graduates, the probability ofentering higher education increases at a higher rate for lower-income individuals than higher-incomeindividuals. Ohio Appalachia, with its concentration of lowerincome families and changing industrialstructure, should--following this argument-be experiencing increasing demand for higher education. Theparticipation rate figures indicate that this did indeed occur during the latter half of the 1980s see table0.1).
Although it was not explored in this study, it would be interesting to know the geographic extentof the region that high school students consider for future employment possibilities. Many students inOhio Appalachia almost certainly consider employment opportunities outside the region."121 Thus,although the condition of the regional economy is an important determinant of higher educationparticipation rates, the health of the wider economy, however each individual defines this, must also betaken into consideration.
Educational Attainment and the Regional Economy
The relationship between a region's economic well-being and the educational level of itsresidents is dynamic and self-reinforcing:
a low participation rate may affect the economic and social well-being of a state because it results in an insufficiently educated laborforce that is poorly positioned to respond to emerging economic andsocial conditions and the growing challenges of high-technology.122
As this is true for a state, so it holds for regions within a state. Areas with low levels of education,where families have low socioeconomic status, will tend to reproduce the characteristics over time, aswill individual families. If the situation is to improve, this cycle must be broken through intervention atone or more points. If this cannot be achieved, Ohio Appalachia is likely to become increasingly
123Ibid., 592.
124Berlin and Sum, 26.
125Pollard and O’Hare, iii.
126Berlin and Sum, 12.
127See Glasmeier.
128See, for example, Berlin and Sum, 13; Fairweather, 3; Hersh, 5-8.
differentiated and marginalized from the rest of the state.
In 1980, Ohio was the thirty-third highest state in terms of the percentage of the populationenrolled in public and private institutions of higher education.123 Circumscribed educational access forthe state as a whole compromises Ohio's future economic viability. As has been shown, OhioAppalachia exhibits a participation rate significantly lower than that of the state as a whole. Theincreasingly weak economic base in the region thereby hurts not only the region itself, but alsodiminishes its contribution to the health of the state's economy:
Skills and economic growth are interdependent . . . a less skilled workforce will impede economic growth and improvements in productivity.124
Across the nation, "the 1980s saw the deterioration of several industries important to rural America;"125 Ohio Appalachia was no exception to this trend. Declining manufacturing employment "had adevastating impact on all young people, but its impact was especially severe for those with deficienciesin basic education and skills.”126
The economy of Ohio Appalachia traditionally had a strong base in the extractive and heavymanufacturing industries. The industries, while offering very high wages for semi and unskilled workers,did not in general demand a high level of formal education. This is typical of rural areas, which oftenexhibit highly undiversified economies. One sector--mining, for example--is typically relied upon as asource of economic development. Although this may provide wealth in the short term, it does little tobroaden the skill base within the economy and thus renders it vulnerable to structural change.
As Ohio Appalachia's traditional economic base continues to decline, rural communities willhave to seek an alternative basis for economic development. Whatever this may be (high-technologyindustry is believed to have a great deal of potential in this role127), it is likely to require higher levels ofskill in the labor force than has previously been the case.128 If rural areas are to be competitive, therequired skills will have to be inculcated in the local labor force.
The lack of opportunities within the rural community has led to high rates of outmigration among
129Pollard and O’Hare, 2-3.
young people, particularly among those with higher levels of education (appendix III, table V.1). Thosewho remain in the area tend to be the individuals with lower levels of skill and education.129 Thechallenge to rural areas such as Ohio Appalachia is therefore twofold: to endow its youth with the skillsnecessary to take advantage of economic opportunities and, simultaneously, to create opportunitieswithin rural areas to arrest and reverse the relative decline that has occurred in the past decade.
130 Data for each of these variables are presented at the county level in appendix III.
131 1989 was the most recent year of County Business Pattern data available at the time of this report's preparation.Changes since 1989 are analyzed with the aid of supplemental data.
132 Francisco J. Arcelus, "An Extension of Shift-Share Analysis," Growth and Change 15 (January 1984): 2. For adescription of the methodology, its uses, and limitations, see Darryl R. Holden, Alasdair G. M. Nairn, and J. K. Swales, "Shift-Share Analysis of Regional Growth and Policy: A Critique," Oxford Bulletin of Economics and Statistics 51, no. 1 (1989): 15-34.
133 The summary tables in appendix II show regional averages both including and excluding Clermont county.
THE ECONOMY OF OHIO APPALACHIA
The Ohio Appalachia region is examined as a whole to provide a general picture of itscharacteristics. Within the region, however, there is a great deal of diversity. For example, to say thatOhio Appalachia has suffered from the decline of the coal mining industry would be correct butmisleading if generalized to all counties. Coal mining was concentrated in only some counties of theregion, which have thus tended to bear the brunt of its relative demise. To give a more representativeaccount of the region's characteristics, counties or subregions that exhibit characteristics distinct fromthose of the wider region are highlighted and discussed.
The indicators used to describe the economic environment are poverty and unemploymentrates, per capita and family incomes, and employment by industrial sector.130 To analyze the sectoralchanges in employment during the period 1980-1989, a shift-share analysis was performed.131 Shift-share is a simple methodology for studying the components of regional growth.132 It is used here,however, purely as a descriptive tool to illustrate the sectoral changes in industrial composition for eachcounty.
As noted in the introduction, the influence of Clermont County creates a problem whenexamining averages for the 29-county region. For example, if Clermont County is included in the shift-share analysis, the employment growth rate of the region is 8.6 percent--representing a gain of 25,296jobs--compared to a national rate of only 3.8 percent. This picture is clearly unrepresentative of theregion's overall character. Excluding Clermont County, the growth rate is 3.9 percent. This high rate ofemployment growth in Clermont County was largely the result of development spillover from Cincinnatiduring the 1980s and was concentrated in the northwest quadrant of the county. Regional averages,unless noted in the text, refer to the 28-county region excluding Clermont County.133
Per Capita and Family Income
The family plays a role as a resource provider for the high school senior wishing tocontinue on to higher education. Below-average family income is therefore a significant barrier toeducational access. The median family income for Ohio in 1989 was $34,531, while in the 28-countyregion it was only $25,802. With the exception of Clermont, no county within the region has a medianfamily income above $30,000. The range is fairly evenly distributed from a low of $21,226 in Adams
134 For a more complete discussion, see Isaac Shapiro, Laboring For Less Working But Poor In Rural America(Washington, DC: Center on Budget and Policy Priorities, 1989), 29.
135 Ibid., xi.
136 Ibid., 29.
County to a high of $29,863 in Washington County (table V.2). The impact of the lower family incomesin Ohio Appalachia is increased by the larger average family size in the region compared to the state asa whole, as limited economic resources are distributed among more family members (appendix 111,table V.3).
Per capita income figures are closely correlated with family incomes. The average per capitaincome in Ohio is $13,461; the only Appalachian county approaching this is again Clermont, with a percapita income of $13,338, compared to the 28-county average of $9,808. Per capita income isimportant as an indicator of the level of resources available to families to provide financially for theirchildren. The significantly lower income levels in Ohio Appalachia in comparison to the rest of the statecreate a financial barrier to higher education. In addition, those who receive higher education will bemore likely to leave the region to seek employment that offers higher wages elsewhere.
Poverty and Unemployment
As might be expected, unemployment is higher in Ohio Appalachia than the remainder of thestate. The average unemployment rate in the 7 region in 1990 was 8.0 percent, in comparison to 6.5percent for Ohio. Monroe, Perry, Harrison, and Adams Counties all suffer from unemployment ratesabove 10 percent (table V.2). The high rates of unemployment are all the more significant when oneexamines the types of jobs that have been lost. In each of the four counties, with the exception ofAdams, the unemployment is mainly explained by large job loss during the 1980s in the high-wagemining sector. Adams County had the majority of its job losses in manufacturing, again a sector payinghigh wages to semi and unskilled workers. Holmes County has the lowest unemployment rate in theregion, 4.7 percent, but this is probably a function of the large Amish population, as explained in theintroduction, page 25.
The unemployment rate, although often used as an indicator of the economic well-being of aregion, is, however, an insufficient and at times misleading measure of local economic disadvantage.This is due both to the inadequacies of the standard federal definition of unemployment134 and the rise innumbers of "working poor"135 during the 1980s. The federal definition of unemployment excludes both"discouraged workers," those who would like to work but are not actively seeking employment in thebelief that opportunities are unavailable, and "involuntary part-time workers," workers who wouldprefer to be in full-time employment but are unable to find it and therefore remain in parttimepositions.136 Both the poverty rate and the structure of an economy must be analyzed to gain a clearerpicture of the economic resources available to support educational participation.
137 CEOGC, 3.
138 Ibid., 24.
139 Ibid., 51.
140 Ibid., 53.
141 Ibid., 51.
142 Ibid., 5.
a 1989 dollars
As figure V.1 demonstrates, the relationship between poverty rates and unemployment is notsimple. Between 1980 and 1991, the overall poverty rate in Ohio grew by 37 percent, with fluctuationsduring this period."137 Whereas unemployment in Ohio peaked in 1982 at 12.5 percent and then felluntil 1989, poverty rates for the state continued to climb throughout the decade.
With the exception of Ashtabula County in northeastern Ohio, all the poorest counties in thestate are in the Appalachian region. Of the fifteen counties with poverty rates above 23 percent,fourteen are Appalachian.138 Thus Appalachia, despite having only a small proportion of the state'spopulation, "retains Ohio's most severe concentration of economic disadvantage in 1991./139 Povertyincreases as you travel from the northwest to the southeast of Ohio. The highest poverty rates areconcentrated in the Appalachian counties."140 During the 1970s, poverty rates in Appalachia declinedby 18 percent. Since 1980 the region has experienced a 66 percent increase in the poverty rate, leavingit in a worse position now than twenty years ago.141
One must also bear in mind that aspoverty has increased over theperiod from 1980 to 1991, “funding forthe states anti- poverty programshas been simultaneouslyreduced by 59%."142
Also, as unemploymentstarted to fall at the end of the 1980s,the poverty rate continued to climb,thus illustrating the divergencebetween the two indicators.
143 Ibid., 60.
144 Ibid., 4.
145 Data on the average wages across industrial categories at the one- and two-digit SIC level are presented in the wagedata tables in appendix III.
146 Ibid., 92.
Although figure V.1 shows major declines in unemployment during the latter part of the 1980s,this “did not lead to comparable reductions in economic disadvantage within Ohio.”143 The majorreason for this is the change in industrial composition. “The most important cause of Ohio’s povertyrate growth has been a major shift in the state’s economy . . . 23 percent of Ohio’s manufacturing jobshave disappeared since 1979.”144 Those jobs created have been predominantly in low-wageoccupational sectors. This effect is compounded by the 12 percent decrease in average earnings in theremaining manufacturing jobs.145
It has been demonstrated that "increased levels of education are associated with substantiallyreduced risk of poverty in the United States."146 If Ohio Appalachians are to improve their standard ofliving, they will have to increase their level of educational attainment.
Structural Change in the Ohio Appalachia Economy
Between 1980 and 1989, the 28-county region made a net gain of 10,940 jobs, a 3.9 percentrate of growth. This compares to national growth of 3.8 percent over the same period (table V.4).
These apparently impressive figures should not, however, lull one into an overly optimisticimpression of the region. Although there were job losses recorded in three of the nine one-digitStandard Industrial Classification (SIC) categories, the vast majority of the losses were in just twosectors: mining and manufacturing. The former, which on average is the highest paying sector at this
147 Data on the average wages across the industrial categories at the one- and two-digit SIC level are presented in thewage data tables in appendix III.
level of aggregation147, lost 9,675 jobs, 49.7 percent of the total mining employment. Manufacturingindustry, meanwhile, lost 11,480 jobs, which represents an 11.7 percent decrease in totalmanufacturing employment. At the one-digit SIC level of aggregation, all other sectors showed jobgains, with the exception of transport and public utilities, where there was a minor loss of 74 jobs.
The largest gains were in the service sector, exhibiting a net increase in employment of 20,880,or 41.6 percent, over the nine-year period. Second to this comes the retail trade sector, which grew by9,801 jobs, a 16.1 percent increase. Of the nine one-digit sectors analyzed, these were the third lowestand lowest paying sectors, respectively.
Looking at the more detailed two-digit SIC level can give a clearer picture of changes. Of
* County selected for survey
Source: ILGARD shift-share analysis, 1992
148 Interview with Don Myers, Belmont County Department of Development, May 1992.
64 sectors represented in the regional economy, employment fell in 28. The largest declines, indescending order, were in the primary metal industries, which lost 9,628 jobs; the bituminous coal andlignite industry, which lost 7,523; machinery manufacturing, which lost 3,895; and stone, clay, and glassproduct manufacturing, which lost 3,728. Six other sectors lost over 1,000 jobs each.
Employment increases were registered across a wide range of sectors, with over 15 sectorsadding more than 1,000 jobs. The largest gains were in health services, with 9,661 new jobs; eatingand drinking places, showing gains of 6,486; lumber and wood products, increasing employment by3,783; and business services, with just over 3,000 new jobs. Three of the sectors offer relatively low-wage earning opportunities, while health services can offer mid-level wages. Of the four sectors, healthservices is the one that would on average require higher levels of formal education, once morereinforcing the link between education and economic opportunity.
Eight counties in the 29-county region lost jobs, while in the other 21 employment growthranged from 0.7 percent in Washington County to 92.8 percent in Clermont County (table V.4). Thehighest percentage losses were in Harrison County, which lost 40.0 percent of its employment andBelmont County, which lost 23.9 percent of its employment (appendix III table V.5). Twelve countiesexperienced proportionally heavy losses in either mining or manufacturing sectors; four of thempredominantly in mining and eight mainly in manufacturing. There was a concentration of particularlyhigh losses in these sectors in the northeast part of the region: Belmont, Harrison, Jefferson, andMonroe Counties.
In general, job gains occurred in the retail and service sectors. Exceptions to this trend includeCoshocton County, which gained 852 manufacturing positions, and Holmes County, which gained1,958 manufacturing positions, the majority of them in the lumber and wood products sector.
One local economic development professional observed that "as long as we don't lose anymore jobs in coal and steel, we've gone through the worst of it."148 Apart from counties such as Meigs,which is still highly vulnerable due to its dependence upon the mining sector, Ohio Appalachia may wellhave already suffered the worst of the structural changes affecting the whole nation. Now the economymust be reconstructed in a different image. This will demand a different style of economic development.
Human capital is increasingly the factor of production that creates competitive advantage;natural resources are declining in importance and global capital markets are becoming more efficient.Rather than trying to attract large 105 companies to the area or relying on natural resources, economicdevelopment will have to be more concerned with creating sustainable employment utilizing the region'shuman resources. The role of education will become ever more important in preparing people for thelabor market.
149McCracken and Barcinas, 9.
150Berlin and Sum, 12.
The overall picture is of an economy increasingly devoid of its basic industries. The future of thearea will require generating employment opportunities to retain the region's young people, particularlythose with higher levels of education. According to a recent study of educational and occupationalaspirations of twelfth grade students in Ohio, rural students tend to aspire to occupations that are notrepresented within their communities.149 If they follow through with this desire, the human capital stockof the region is depleted, further weakening its future economic base.
Declines in manufacturing employment have impacted everyone in the labor market. Theindividuals most affected, however, are those with lower levels of education and basic skills.150 Thisfocuses attention once more on the dilemma faced by Ohio Appalachia: the region must equip its youthwith the skills necessary for employment opportunities, while simultaneously revitalizing the economy tocreate new jobs. The failure to achieve both of these objectives will cause Ohio Appalachia to lagfurther behind the state.
151 See, for example, Borus and Carpenter, 174.
152 Mortenson and Wu, 44.
153 James R. Mingle, Focus on Minorities: Trends in Higher Education Participation and Success (Denver: Education
Commission of the States and State Higher Education Executive Officers, 1987), ix.
154 Stage and Hossler, 312.
DEMOGRAPHIC EFFECTS ON EDUCATIONAL ACCESS
Demographic factors are considered from two perspectives. First, the size and agestructure of the region’s population determines the size of the potential college studentpopulation. Second, certain demographic factors, such as family structure and race, arecorrelated with educational attainment.
The racial composition of the region was not determined to be an important influence inthe context of the present study. Ohio Appalachia is very racially homogeneous, its populationbeing over 97 percent white. African Americans, the second largest racial group in the region,represent only 2 percent of the population, compared to 11 percent in Ohio.
Although there is still controversy in the literature over the issue of racial determinants ofhigher education access, it has generally been found that race itself is not the casual factor; rather,it is the variables correlated with race that lead to power probabilities for minorities to attendcollege.151 In addition, Mortenson found that “after 1984 the difference between the black andwhite college enrollment rate appears to have narrowed, especially for nonmetropolitan blacks.152
Taken together, these three factors sufficiently justify the lack of consideration given in thepresent study to racial barriers to educational participation.
Nonwhites will, however, comprise an increasingly large proportion of the traditionalcollege-age population in the future.153 To the extent that the Ohio Appalachia nonwhitepopulation increases in size, racial barriers to educational attainment, if these exist above andbeyond barriers related to class and socioeconomic status, could become an important factor toconsider.
There is substantial evidence that a student's household structure has an observableinfluence on aspirations for, and likelihood of, higher education. Stage and Hossler found that ifa student's parents are married, this slightly increases the probability of participating in highereducation.154 Similarly, McCartin and Meyer found that:
the traditional family constellation with two parents was likely toproduce adolescents with higher academic success and plans to gain
155 McCartin and Meyer, 390.
156 CEOGC, 86.
additional schooling.155
They also observed, however, that this finding was explained in part by the higher socioeconomicstatus of families with two incomes. It is certainly still the case "in both Ohio and the UnitedStates that the poorest demographic group is unquestionably households that are headed by singlefemale parents.156 At least to the extent that family income exerts an influence on highereducation participation, family structure will be correlated with lower rates of educationalattainment.
Finally, the age structure of a population has a vital influence on participation rates: itdetermines the size of the potential pool of college goers. The size of the traditional collegepopulation, 18 to 24 years old, although an important factor to consider, should not be examinedin isolation; nontraditional age students are enrolling at increasingly high rates which may, tosome extent, compensate for changes in the number of traditional-age students.
In addition, education is becoming less of a once-in-a-lifetime event. As rapidtechnological change continues, individuals are finding that new skills must be acquired duringtheir working lives. Institutions of higher education will doubtless play an increasingly significant role inthis process.
REGIONAL DEMOGRAPHIC CHARACTERISTICS
Population Change
The Appalachian region's 1,372,893 residents, including Clermont County, in 1990accounted for 12.7 percent of Ohio's population (table V.6), a very slight decrease from 1980.Excluding Clermont County, which gained 21,704 people over the decade, the 28-county regionlost 24,878 people, approximately 2 percent of its population. This decline is almost completelyaccounted for by heavy losses, in both absolute and percentage terms, in four counties: Belmont,Harrison, Jefferson, and Monroe. These are the same four counties that suffered the largestdeclines in their manufacturing and mining sectors.
With the exception of these four counties, Clermont County, and Holmes County, whichincreased its population by 3,433, or 11.7 percent, the magnitude of changes in the remainingcounties was generally small. Of these 23 counties, 11 made small gains and the remaining 12counties recorded net losses.
This change in population can be accounted for in two ways: net migration, whichmeasures the number of people moving into the region minus the number of people moving outof it, and general demographic trend shifts such as changes in birth and death rates, both in thepresent and as a result of the cumulative effects of past changes.
Net Migration
Excluding Clermont County, the 28-county region experienced lower rates of netmigration than the rest of the state in all age groups except 20-34 years (appendix III table V.1).Ohio's overall net migration rate from 1980-1990 was 5.7 percent, while in Appalachia it was 6.8percent. In the 20 to 34 year-old group, however, Appalachia's net migration rate was 21.3percent while Ohio's was 9.7 percent.
The 20 to 34 year-old group constitutes a large proportion of the economically productivesection of the population. Although it cannot be confirmed from the data used herein, it is likelythat those 20-34 year olds leaving the region are more highly educated than those remaining.They are leaving in order to find employment that is not available in the region.
Outmigration in this age group accounts for 68.3 percent of the total net migration for theregion. Counties suffering particularly high rates of outmigration in this age group includeBelmont, -44.5 percent; Harrison, -45.3 percent; and Monroe, -50.0 percent. Only two countiesexperienced positive net migration in this age group: Clermont County, 6.7 percent, and AthensCounty, 8.5 percent.
Overall, there are no other clearly discernible trends in net migration. Small amounts ofin- and outmigration--with slightly more out- than in-migration-are apparent across the OhioAppalachia region. Two counties stand out with significantly higher outmigration than the restof the region: Monroe, -15.2 percent, and Jefferson, -15.1 percent.
Under 18 Population
The proportion of the population under 18 years of age offers an indication of thepotential future size of the traditional-age potential college student population. Whereas between1980-1990 Ohio's under-18 population shrank by 8.8 percent, that of the Appalachian region fellby 21.8 percent (table V.7). Every county made losses of above ten percent except Holmes, -2.5percent, and Clermont, -6.7 percent. This decline in the under-18 age group is predominantly
157 Fishlow, i.
explained as the tail end of the lower post-baby-boom birth rates. Children of the baby boom arebeing replaced by smaller numbers of cohorts born after 1965.157
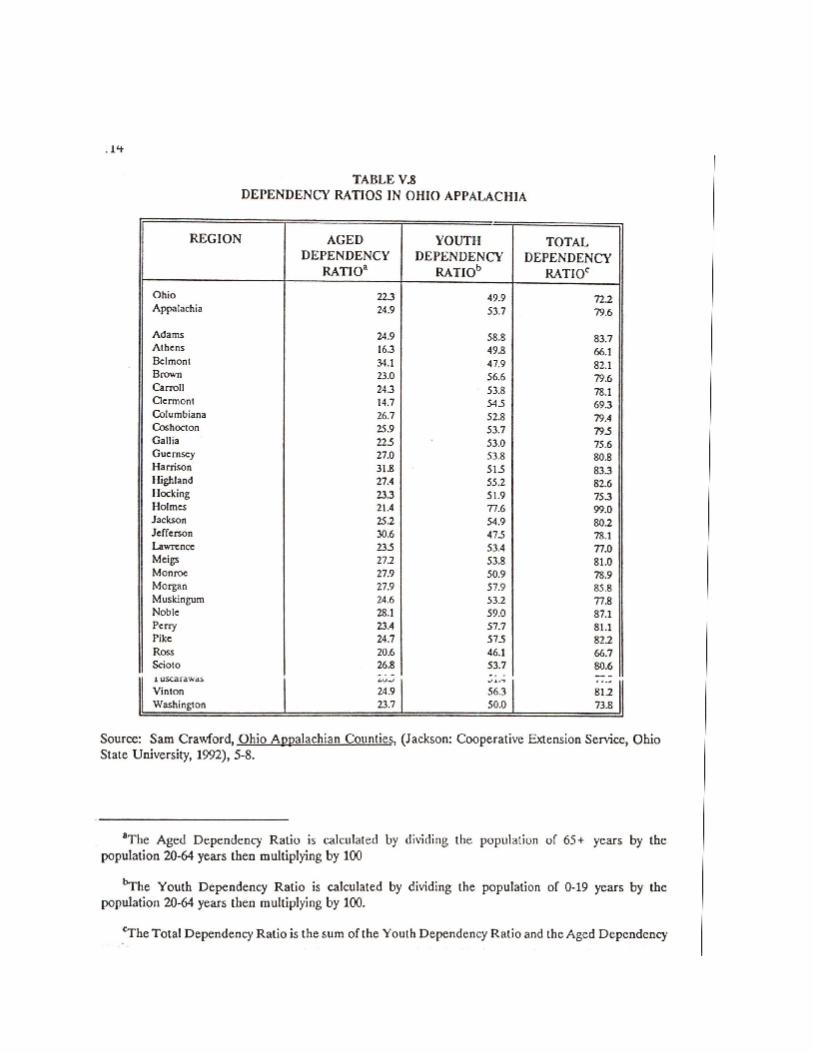
158 The Aged Dependency Ratio is calculated by dividing the population of 65+ years by the population 20-64 years,then multiplying by 100. The Youth Dependency Ratio is calculated by dividing the population of 0-19 years by the population2-64 years, then multiplying by 100. The Total Dependency Ratio is the sum of the Aged Dependency Ratio and YouthDependency Ratio.
A significant percentage, 11.8 percent, of the decline can, however, be accounted for byoutmigration from the region.
This result indicates that, by virtue of the region's demographic attributes alone, areacolleges could expect to foresee enrollments declining in the near future. The potential pool oftraditional-age college students has declined and will continue to decline in the future. Otherfactors, such as the condition of the labor market or a concerted effort to increase theparticipation rate, could be expected to offset this negative influence on total enrollment,however.
Dependency Ratios
Although conveying little directly about the size of the potential college-goingpopulation, dependency ratio data are an interesting indicator of the ability of a community tosupport itself economically. The higher the dependency ratio, the more people the earnings ofeconomically productive members of the population have to support. In the context of thepresent study, this fact has great bearing on the impetus for Ohio Appalachia to increase theeducational attainment levels of its population, so as to increase living standards and becomemore economically competitive.
Dependency ratios measure the number of economically non-productive individuals as aproportion of the economically active population (table V.8).158 In all three dependency ratiomeasures, Ohio Appalachia displays a higher dependency than Ohio on the earnings of theeconomically active population. The Total Dependency Ratio of the 29-county region is 79.6percent, significantly higher than that of Ohio, 72.2 percent. Population projections for the regionindicate that the Total Dependency Ratio will fall to 69.2 percent in the year 2000 and further to 65.3percent in the year 2010. The larger portion of this decrease is accounted for by decreases in the YouthDependency Ratio. In all time periods considered, Holmes County is an anomaly by virtue of itsunusually high dependency ratio (see page 25 of introduction).
Population Projections
Population projections can give some idea of the future demographic environment thatOhio Appalachia educators will be facing. Whereas Ohio is forecasted to decrease itspopulation 2.9 percent by the year 2000 and 4.7 percent by 2010, the Appalachian region isforecasted to increase population 0.8 percent by the year 2000 and lose only 1.7 percent ofpopulation by 2010. If Clermont County is included in regional averages, gains of 1.7 percentand 4.7 percent are forecasted for the years 2000 and 2010 respectively (appendix III table V.9).The region exhibits similar changes across age groups, as does Ohio, but of a differentmagnitude. All age groups in the region will experience declines in population, except the 35 to
64 year-old group, which will increase in size 15.8 percent between the years 1990 and 2000
159 Fishlow, i.
and 19.9 percent by 2010. When Clermont is included in the regional averages, populationlosses are slowed and gains occur in the over 65 year-old category. It is perhaps of most interestto note that the region's under-19 population is declining at a significantly lower rate than forOhio, losing 13.9 percent compared to 21.0 percent by the year 2010. This bodes well forcomparative future numbers of college-age individuals.
In summary, the decrease in both the under-18 population and the traditional college-agepopulation correspond to national trends. These indicate that to the mid-1990s there will be adecline in these age categories, as children of the baby boom generation are replaced by asmaller number of persons born after 1965.159
Family Structure
Previous research has found that family structure is related to academic attainment. Astudent from a traditional family unit of two parents is more likely to aspire to college, havingbeen more successful academically in high school.
In 1990, 61.1 percent of the 504,542 households in the 29-county region were marriedcouples (table V.10). This was slightly higher than Ohio as a whole, with 56.1 percent ofhouseholds married couples. The only significant deviations from around 60 percent are AthensCounty, 25.2 percent, explained by the influence of Ohio University, and Holmes County, 73.9percent, explained by the large Amish population.
As might be predicted from this, Ohio Appalachia has a lower percentage of female-headed,single-parent households, 13.4 percent of households compared to 16.5 percent for thestate as a whole. Following the findings in the literature, the lower number of nontraditionalfamily structures is, therefore, one barrier that exerts less of an influence than in the rest ofOhio.