50
Contents Sectoral Trends: Performance of the primary and secondary sectors of the South African economy – statistical update 3 rd Quarter 2014 Department of Research and Information

Contents
Sectoral Trends: Performance of the primary and secondary sectors
of the South African economy – statistical update
3rd Quarter 2014
Department of Research and Information
Contents
Highlights 1
Performance of the primary and secondary sectors
Physical volume of production 6
Production capacity utilisation 6
Employment 7
Remuneration 7
Exports 8
Imports 8
Selected trade trends (excluding trade with BLNS)
Trade balance 9
Major traded products 9
Composition of trade 9
Regional trade 9
Trade trends with major regions or regional blocs 10
Performance of the primary and secondary sub-sectors: statistical synopsis
Agriculture, forestry and fishing 12
Total mining 13
- Coal mining 14
- Gold and uranium mining 15
- PGM mining 16
- Iron ore mining 17
- Other mining 18
Total manufacturing 19
- Food 20
- Beverages 21
- Textiles 22
- Wearing apparel 23
- Leather and leather products 24
- Footwear 25
- Wood and wood products 26
- Paper and paper products 27
- Printing, publishing and recorded media 28
- Coke and refined petroleum products 29
- Basic chemicals 30
- Other chemicals and man-made fibres 31
- Rubber products 32
- Plastic products 33
- Glass and glass products 34
- Non-metallic mineral products 35
- Basic iron and steel 36
- Basic non-ferrous metallic products 37
- Metal products excluding machinery 38
- Machinery and equipment 39
- Electrical machinery 40
- Television, radio and communication equipment 41
- Professional and scientific equipment 42
- Motor vehicles, parts and accessories 43
- Other transport equipment 44
- Furniture 45
- Other manufacturing 46
Acronyms, notes and data sources 47

September 2014 IDC – Research and Information – Sectoral Trends 1
Highlights
Value added (agriculture sector) and physical volume of production (mining and manufacturing
sectors)
Valued added by the agriculture, forestry and fishing sector benefitted from favourable weather
conditions early in the first semester of 2014, with good rain in the major maize growing areas. This
resulted in 3.3% growth in real terms relative to the corresponding period in 2013 (refer to Figure 1 on
page 6), mainly due to higher output of field crops and livestock.
The adverse effects of the protracted strike in the platinum group metals (PGM) mining sub-sector were
reflected in the 27.8% contraction (year-on-year) in its physical volume of production in the first half of
2014, with its large weighting impacting negatively on the performance of the overall mining sector. The
‘other mining’ sub-sector (including manganese ore, chrome ore, nickel, copper, building materials and
diamonds) and iron ore mining reported solid increases in production volumes in the opening half of the
year, although output of manganese, iron ore and, to a lesser extent, chrome ore tapered off towards the
end of the period. Nonetheless, on a cumulative basis over the six-month period, manganese and nickel
production was substantially higher relative to the corresponding period in 2013, posting increases of
approximately 27.3% and 14.6%, respectively, while diamond production was 17.6% higher. Output of
coal (-0.8% year-on-year) and copper (-0.1%) was marginally lower in the first semester of 2014, and
the downward trend in gold production continued unabated.
The physical volume of production in the broad manufacturing sector remained unaltered in the opening
half of 2014 relative to the corresponding period in 2013. Major segments of the manufacturing sector
continued to face difficult trading conditions in key external markets, particularly in Europe.
Domestically, demand conditions deteriorated due to the spill-over effects of the industrial action
induced production stoppages in platinum mining during the first five months of 2014, as well as
weakening household demand for consumption goods. Manufacturing sub-sectors with strong linkages
to mining activity, such as machinery and equipment, ‘other transport equipment’, ‘other chemicals’ and
rubber products reported lower production volumes. Sub-sectors that recorded substantially higher
output levels included television, radio and communication equipment; leather and leather products; and
coke and refined petroleum products.
Utilisation of production capacity in manufacturing
Despite flat overall production volumes, the broad manufacturing sector reported a marginal increase in
the utilisation of its production capacity in the second quarter of 2014 relative to the same period a year
earlier, as illustrated in Figure 2 on page 6. This may be indicative of a slight loss of production capacity.

September 2014 IDC – Research and Information – Sectoral Trends 2
Highlights
The higher output levels posted by the television, radio and communication equipment sub-sector and
the coke and refined petroleum products sub-sector were confirmed by a higher utilisation of their
production capacity in the year to the second quarter of 2014.
In contrast, the furniture sub-sector continued to experience difficult operating conditions as reflected by
lower production volumes, and yet also reduced spare capacity, possibly indicating a decline in its
production capacity over the past year.
Employment
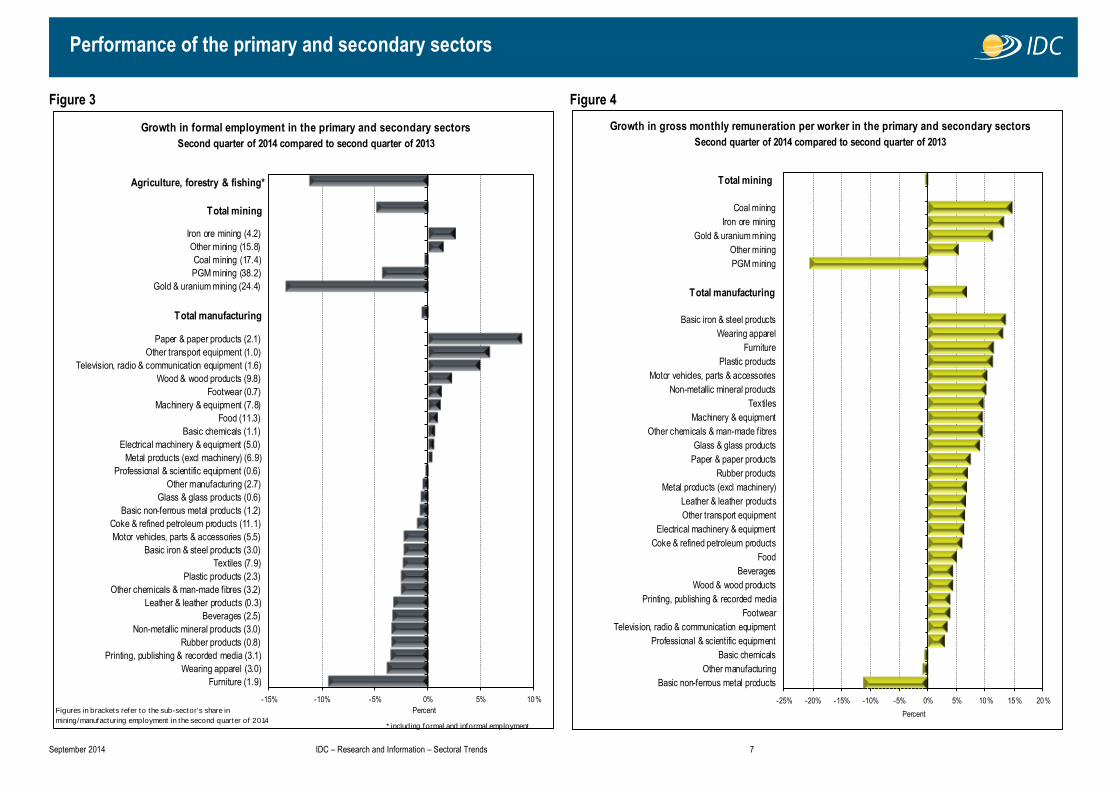
Employment levels in the agriculture, forestry and fishing sector declined by 83 000, or 11.2% of the
sector’s total employment, in the second quarter of 2014 compared to the same quarter in 2013 (refer to
Figure 3 on page 7). The contraction in employment since the first quarter of 2013, when the most
recent peak was recorded, amounted to 105 000 job losses. This adverse trend may be partly explained
by the sharp increase in the sector’s minimum wage during the latter part of 2013, which may have
reinforced its mechanisation drive.
Mining sector employment fell by approximately 25 000, or 4.9% of the total, in the year to the second
quarter of 2014. The majority of the job losses were attributable to the gold mining (-18 188) and
platinum group metals mining (-8 309) sub-sectors. The contraction reported in the gold mining sub-
sector was mainly due to a lower number of permanent employees, whilst the platinum group metals
mining sub-sector reduced the use of contract employees as the five-month long strike drew to a close
at the end of the second quarter of 2014.
Employment in the broad manufacturing sector declined by 9 000 in the second quarter of 2014 relative
to the levels reported a year earlier. The following sub-sectors recorded the largest job losses: furniture
(-3 104 jobs); textiles (-3 060); and motor vehicles, parts and accessories (-2 006). The wood and wood
products sub-sector as well as the paper and paper products sub-sector, in turn, reported substantial
employment gains in the order of 3 336 and 2 612 additional jobs, respectively.
Further employment losses are expected in the overall manufacturing sector in the third quarter of 2014
considering the generally difficult trading conditions and above inflation wage increases settled upon in
segments of the sector at the end of a month-long strike.
Worker remuneration in mining and manufacturing
Gross remuneration per worker in the mining sector was clearly affected by protracted strike activity in
its platinum mining segment, as it declined by 0.5% over the 12-month period up to the second quarter

September 2014 IDC – Research and Information – Sectoral Trends 3
Highlights
of 2014 (refer to Figure 4 on page 7). Due to the ‘no-work-no-pay’ principle, the average remuneration
per worker in the platinum group metals mining sub-sector fell by 20.5% over this period.
Against the backdrop of declining employment at the broad sector level, gross remuneration per worker
in manufacturing increased by 7.4% in the year to the second quarter of 2014. At the sub-sector level,
the highest rates of increase were reported by the coke and refined petroleum as well as the ‘other
chemicals’ industries.
Trade balance (excl. BLNS)
South Africa’s external trade (excluding trade with Botswana, Lesotho, Namibia and Swaziland, also
known as the BLNS countries within the Southern African Customs Union) in the opening semester of
2014 was severely affected by the production stoppages associated with industrial action over the first
five months of the year, as well as by weaker global demand, especially in commodities markets. Import
demand, particularly for mineral products (mostly crude oil and refined petroleum and related products),
remained strong. The balance of trade recorded a cumulative deficit of R108.5 billion, representing a
26% increase on the R86.1 billion deficit reported in the first half of 2013 (refer to page 9).
The trade surplus with European countries outside of the European Union (EU) narrowed to R2.2 billion
in the opening semester of 2014, from R7.4 billion a year earlier. In contrast, the trade deficit with the EU
came in at R48.8 billion, compared to R58.3 billion in the first half of 2013.
A sharp increase in imports from the Middle East worsened South Africa’s trade deficit with this region
over the first six months of 2014 to almost R50 billion, from R35 billion in the corresponding period a
year earlier.
South Africa’s trade surplus with the rest of the African continent (excluding BLNS) remained almost
unchanged at R19.5 billion over the reporting period.
Exports (excl. BLNS)
South Africa’s merchandise exports (excluding exports to BLNS countries) totalled R403.4 billion in the
first semester of 2014, representing an 8.4% increase relative to the corresponding period in 2013, as
illustrated in Figure 5 on page 8.
Exports of the agriculture, forestry & fishing sector increased by 7.6% over this period, having benefitted
from a substantial rise in exports of edible fruits (such as citrus fruit, grapes, stone fruit, etc.). Exports of
maize, apples and groundnuts fell sharply over the period.

September 2014 IDC – Research and Information – Sectoral Trends 4
Highlights
The value of mining related exports declined marginally in the opening semester of 2014 on a year-on-
year basis. The exports of the gold mining sub-sector fell by R6.4 billion, while those of the PGMs mining
sub-sector were R3.7 billion lower. The stronger export performance of ores, especially manganese
(+R2.7 billion) and iron (+R1.3 billion), in conjunction with coal (+R1.3 billion) limited the impact of lower
precious metals’ exports.
Manufacturing exports increased by 16.2% in the first half of 2014 relative to the corresponding period a
year earlier. Iron and steel exports made a substantial contribution as these increased by R13.2 billion
over this period. Higher output levels in the television, radio and communications equipment supported
an 88.9% increase in the value its exports, the best performance of all manufacturing sub-sectors, albeit
off a very low base.
Asia remained the largest regional market for South Africa’s exports in the first semester of 2014. Mining
products dominated the export basket destined for this region, specifically iron ore, coal, non-ferrous
metals and PGMs. Iron and steel exports were also significant, with China, Japan and India as key Asian
destinations.
Although Asia remained the leading export destination, exports to the EU were the largest contributors to
the 9% year-on-year growth in overall exports in the first half of 2014. The export basket destined for EU
markets was dominated by basic iron and steel, PGMs, motor vehicles, parts and accessories for motor
vehicles, as well as cereals and other agricultural products. Germany, the United Kingdom, the
Netherlands and Belgium were the principal contributors to the growth in South Africa’s exports to the
EU over this period.
The rest of the African continent has become an increasingly important market for locally-produced
goods, accounting for approximately 18.7%, or R75.6 billion, of South Africa’s overall merchandise
export basket (excluding trade with BLNS countries). Importantly, the export basket destined for African
markets consists largely of manufactured goods and is quite diversified, comprising items such as
machinery and equipment (e.g. mining and agricultural machinery); transport equipment (including motor
vehicles and parts); base metals and fabricated metal products; chemicals; as well as processed food.
The decline in exports destined for the North American Free Trade Agreement (NAFTA) region was
mainly attributable to lower exports of spun and woven textiles.
Imports (excl. BLNS)
Merchandise imports (excluding imports from BLNS countries) during the first semester of 2014
amounted to R511.9 billion, representing an increase of 11.7% from the value recorded over the
corresponding period in 2013, as illustrated in Figure 6 on page 8.

September 2014 IDC – Research and Information – Sectoral Trends 5
Highlights
The value of imports of agricultural, forestry and fishing products increased by 36.4% over this period,
largely due to imports of oil seed (R920 million higher, or 188%) and cereals (R854 million higher, or
46%).
Mining imports similarly rose by 36.7%, driven mainly by increased imports of crude oil, which expanded
by R25.6 billion, and PGM ores (which increased by 641% year-on-year, or R1.1 billion) to cater for
insufficient domestic supply due to production stoppages.
Imports of manufactured goods increased by 5.9% in the year to the first semester of 2014, with import
demand for parts and accessories of motor vehicles, electric motors, generators and transformers, motor
vehicles, as well as for office, accounting and computing machinery rising sharply. Demand for imported
iron and steel products, in turn, fell 20.4% over this period.
Asia remained South Africa’s largest source of imported products, mostly supplying petroleum products,
motor vehicle parts and accessories, as well as television and radio transmitters, line telephony. China,
India, Japan, Thailand and Singapore were the most prominent sources of these imports.
The substantial growth in imports from the Middle East recorded in the first half of 2014 on a year-on-
year basis was attributable to sharply higher crude oil imports (R12.6 billion higher, or 36.4%) and some
refined petroleum imports (R1.5 billion higher, or 29.8%), sourced largely from Saudi Arabia and, to a
lesser extent, the United Arab Emirates and Kuwait.

September 2014 IDC – Research and Information – Sectoral Trends 6
Performance of the primary and secondary sectors
Figure 1 Figure 2
Growth in physical volume of production in the primary and secondary sectors
Average for the first half of 2014 compared to average for the first half of 2013 (Seasonally adjusted)
* Real value add
Figures in brackets refer to the sub-sector's percentage
share in mining/manufacturing product ion in the second quarter of 2014
-30% -20% -10% 0% 10% 20%
Glass & glass products (0.9)
Rubber products (1.2)
Other transport equipment (1.2)
Machinery & equipment (6.1)
Printing, publishing & recorded media (3.6)
Wearing apparel (1.1)
Other chemicals & man-made fibres (7.1)
Furniture (1.1)
Textiles (1.2)
Non-metallic mineral products (3.5)
Plastic products (3.1)
Footwear (0.4)
Basic non-ferrous metal products (3.5)
Professional & scientific equipment (0.5)
Motor vehicles, parts & accessories (7.4)
Beverages (6.4)
Electrical machinery & equipment (2.4)
Food (17.4)
Basic iron & steel products (4.7)
Basic chemicals (4.8)
Wood & wood products (2.6)
Metal products (excl machinery) (6.1)
Paper & paper products (3.3)
Other manufacturing (3.0)
Coke & refined petroleum products (6.3)
Leather & leather products (0.2)
Television, radio & communication equipment (0.9)
PGM mining (24.6)
Gold & uranium mining (17.7)
Coal mining (23.7)
Iron ore mining (14.4)
Other mining (19.6)
Percent
Agriculture, forestry & fishing *
Total mining
Agriculture, forestry & fishing *
Total mining
Total manufacturing
Manufacturing: Change in the utilisation of production capacity
Total manufacturing (81.6)
Second quarter of 2014 compared to second quarter of 2013
Figures in brackets refer to the sub-sector's average capacity
ut ilisat ion in the second quarter of 2014
-10 -8 -6 -4 -2 0 2 4 6 8
Footwear (84.5)
Other transport equipment (72.4)
Motor vehicles, parts & accessories (80.2)
Glass & glass products (80.2)
Rubber products (82.3)
Wearing apparel (77.6)
Basic iron & steel products (77.8)
Food (80.0)
Machinery & equipment (81.0)
Electrical machinery & equipment (80.5)
Other manufacturing (75.0)
Plastic products (83.2)
Wood & wood products (82.7)
Professional & scientific equipment (84.4)
Basic chemicals (86.1)
Printing, publishing & recorded media (76.8)
Textiles (69.1)
Metal products (excl machinery) (74.4)
Basic non-ferrous metal products (80.8)
Beverages (82.6)
Paper & paper products (86.4)
Leather & leather products (69.9)
Other chemicals & man-made fibres (83.0)
Non-metallic mineral products (81.3)
Furniture (89.9)
Coke & refined petroleum products (81.1)
Television, radio & communication equipment (83.8)
Percentage points
September 2014 IDC – Research and Information – Sectoral Trends 7
Performance of the primary and secondary sectors
Figure 3 Figure 4
* including formal and informal employment
Growth in formal employment in the primary and secondary sectors
Second quarter of 2014 compared to second quarter of 2013
Figures in brackets refer to the sub-sector's share in
mining/manufacturing employment in the second quarter of 2014
-15% -10% -5% 0% 5% 10%
Furniture (1.9)
Wearing apparel (3.0)
Printing, publishing & recorded media (3.1)
Rubber products (0.8)
Non-metallic mineral products (3.0)
Beverages (2.5)
Leather & leather products (0.3)
Other chemicals & man-made fibres (3.2)
Plastic products (2.3)
Textiles (7.9)
Basic iron & steel products (3.0)
Motor vehicles, parts & accessories (5.5)
Coke & refined petroleum products (11.1)
Basic non-ferrous metal products (1.2)
Glass & glass products (0.6)
Other manufacturing (2.7)
Professional & scientific equipment (0.6)
Metal products (excl machinery) (6.9)
Electrical machinery & equipment (5.0)
Basic chemicals (1.1)
Food (11.3)
Machinery & equipment (7.8)
Footwear (0.7)
Wood & wood products (9.8)
Television, radio & communication equipment (1.6)
Other transport equipment (1.0)
Paper & paper products (2.1)
Gold & uranium mining (24.4)
PGM mining (38.2)
Coal mining (17.4)
Other mining (15.8)
Iron ore mining (4.2)
Percent
Agriculture, forestry & fishing*
Total mining
Total manufacturing
Growth in gross monthly remuneration per worker in the primary and secondary sectors
Second quarter of 2014 compared to second quarter of 2013
-25% -20% -15% -10% -5% 0% 5% 10% 15% 20%
Basic non-ferrous metal products
Other manufacturing
Basic chemicals
Professional & scientific equipment
Television, radio & communication equipment
Footwear
Printing, publishing & recorded media
Wood & wood products
Beverages
Food
Coke & refined petroleum products
Electrical machinery & equipment
Other transport equipment
Leather & leather products
Metal products (excl machinery)
Rubber products
Paper & paper products
Glass & glass products
Other chemicals & man-made fibres
Machinery & equipment
Textiles
Non-metallic mineral products
Motor vehicles, parts & accessories
Plastic products
Furniture
Wearing apparel
Basic iron & steel products
PGM mining
Other mining
Gold & uranium mining
Iron ore mining
Coal mining
Percent
Total manufacturing
Total mining

September 2014 IDC – Research and Information – Sectoral Trends 8
Performance of the primary and secondary sectors
Figure 5 Figure 6
First half of 2014 (cumulative total) compared to First half of 2013 (cumulative total)
Growth in the value of imports (excl. imports from BLNS) in the primary and secondary sectors
Figures in brackets refer to the sub-sector's percentage
share in mining/manufacturing imports in Q2 of 2014
-30% -20% -10% 0% 10% 20% 30% 40%
Basic iron & steel products (2.1)
Printing, publishing & recorded media (0.3)
Rubber products (1.3)
Coke & refined petroleum products (7.8)
Machinery & equipment (17.8)
Furniture (0.6)
Food (5.0)
Motor vehicles, parts & accessories (19.0)
Television, radio & communication equipment (6.3)
Beverages (0.6)
Other chemicals & man-made fibres (7.7)
Footwear (1.1)
Metal products (excl machinery) (2.4)
Basic non-ferrous metal products (2.0)
Wearing apparel (2.2)
Plastic products (1.5)
Leather & leather products (0.4)
Wood & wood products (0.5)
Glass & glass products (0.3)
Basic chemicals (5.3)
Professional & scientific equipment (3.3)
Other manufacturing (1.4)
Textiles (1.5)
Electrical machinery & equipment (4.7)
Paper & paper products (1.4)
Non-metallic mineral products (1.2)
Other transport equipment (2.1)
Gold & uranium mining (0.0)
Iron ore mining (0.3)
Coal mining (1.4)
Other mining (97.0)
PGM mining (1.3)
Percent
Agriculture, forestry & fishing
Total mining
Total manufacturing
-72.8%
641.4%
Growth in the value of exports (excl. exports to BLNS) in the primary and secondary sectors
First half of 2014 (cumulative total) compared to First half of 2013 (cumulative total)
Figures in brackets refer to the sub-sector's percentage
share in mining/manufacturing exports in Q2 of 2014
-40% -20% 0% 20% 40% 60% 80% 100%
Rubber products (0.6)
Other manufacturing (5.8)
Motor vehicles, parts & accessories (20.2)
Glass & glass products (0.3)
Beverages (2.5)
Coke & refined petroleum products (4.5)
Electrical machinery & equipment (1.7)
Wearing apparel (0.2)
Metal products (excl machinery) (2.6)
Printing, publishing & recorded media (0.2)
Machinery & equipment (6.7)
Basic non-ferrous metal products (5.8)
Furniture (0.7)
Basic chemicals (8.6)
Plastic products (0.9)
Other transport equipment (1.3)
Textiles (0.8)
Other chemicals & man-made fibres (4.8)
Footwear (0.1)
Paper & paper products (3.3)
Non-metallic mineral products (0.6)
Professional & scientific equipment (1.1)
Food (6.6)
Wood & wood products (0.9)
Basic iron & steel products (17.1)
Leather & leather products (0.5)
Television, radio & communication equipment (1.6)
Gold & uranium mining (16.4)
PGM mining (20.2)
Iron ore mining (24.2)
Coal mining (17.0)
Other mining (22.2)
Percent
Agriculture, forestry & fishing
Total mining
Total manufacturing

September 2014 IDC – Research and Information – Sectoral Trends 9
Selected trade trends (excluding trade with BLNS)
-300
-200
-100
0
100
200
300
Q1 Q22010
Q3 Q4| Q1 Q22011
Q3 Q4| Q1 Q22012
Q3 Q4| Q1 Q22013
Q3 Q4| Q1 Q22014
SA trade balance
Imports Exports Trade balance
ZAR billion per quarter (current v alues)
0
25
50
75
100
Q1 Q22010
Q3 Q4| Q1 Q22011
Q3 Q4| Q1 Q22012
Q3 Q4| Q1 Q22013
Q3 Q4| Q1 Q22014
SA exports by broad economic classification
Capital goods Consumption goods
Intermediate goods Raw materials
ZAR billion per quarter (current v alues)
0
25
50
75
100
125
Q1 Q22010
Q3 Q4| Q1 Q22011
Q3 Q4| Q1 Q22012
Q3 Q4| Q1 Q22013
Q3 Q4| Q1 Q22014
SA imports by broad economic classification
Capital goods Consumption goods
Intermediate goods Raw materials
ZAR billion per quarter (current v alues)
HS2 code ZAR m
H71: Natural or cultured pearls, precious stones and metals 69 083.21
H26: Ores, slag and ash 66 166.37
H27: Coal, petroleum and petroleum products 39 346.39
H72: Iron and steel 39 078.05
H87: Vehicles, parts and accessories 32 720.99
Exports Total (including others) 403 391.19
H27: Coal, petroleum and petroleum products 128 112.10
H84: Machinery and equipment, mechanical appliances 69 596.10
H85: Electrical machinery and electronic equipment 48 123.04
H87: Vehicles, parts and accessories 44 573.27
H98: Original equipment components for the motor vehicle industry 32 712.23
Imports Total (including others) 511 859.90
Imp
ort
s
Major traded productsFirst half of 2014 (cumulative total)
Ex
po
rts
SA trade per regionFirst half of 2014 (cumulative total)
0% 5% 10% 15% 20% 25% 30% 35% 40%
Oceania
Europe (excl. EU)
Other Americas
NAFTA
Africa
Middle East
EU
Asia
Oceania
Other Americas
Europe (excl. EU)
Middle East
NAFTA
Africa
EU
Asia
Share of exports
Share of imports
SA trade growth by region
First half of 2014 (cumulative total) compared to first half of 2013 (cumulative total)
-30% -20% -10% 0% 10% 20% 30% 40% 50%
Oceania
Other Americas
EU
Europe (excl. EU)
NAFTA
Asia
Africa
Middle East
Europe (excl. EU)
Other Americas
Oceania
NAFTA
Asia
Africa
Middle East
EU
Export growth
Import growth

September 2014 IDC – Research and Information – Sectoral Trends 10
Trade trends with major regions or regional blocs
First half of 2014 (cumulative total)
SA trade balance with the EU Top traded product categories:
First half of 2014 (cumulative total)
First half of 2014 (cumulative total)
SA trade balance with Asia
SA trade balance with the Middle East Top traded product categories:
Top traded product categories:
SA trade balance with Africa (excl. trade with BLNS) Top traded product categories:
First half of 2014 (cumulative total)
-40
-30
-20
-10
0
10
20
30
40
50
Q1 Q22010
Q3 Q4| Q1 Q22011
Q3 Q4| Q1 Q22012
Q3 Q4| Q1 Q22013
Q3 Q4| Q1 Q22014
Imports Exports Trade balance
ZAR billion per quarter (current v alues)
0% 20% 40% 60% 80% 100%
Other goods
Wearing apparel; excl. fur apparel
Basic precious & non-ferrous metals
Petroleum refineries & synthesisers
Agriculture (cereals & other crops)
Crude oil mining
Other goods
Mining & construction machinery
Agriculture (cereals & other crops)
Petroleum refineries & synthesisers
Basic iron & steel
Motor vehicles
Share ofexports
Share ofimports
-120
-100
-80
-60
-40
-20
0
20
40
60
80
100
Q1 Q22010
Q3 Q4| Q1 Q22011
Q3 Q4| Q1 Q22012
Q3 Q4| Q1 Q22013
Q3 Q4| Q1 Q22014
Imports Exports Trade balance
ZAR billion per quarter (current v alues)
0% 15% 30% 45% 60% 75%
Other goods
Office, accounting & computing…
Motor vehicles
TV & radio transmitters, line telephony
Motor vehicle parts & accessories
Petroleum refineries & synthesisers
Other goods
Platinum group metal mining
Basic iron & steel
Mining of non-ferrous metal ores
Coal mining
Iron ore mining
Share ofexports
Share ofimports
-90
-75
-60
-45
-30
-15
0
15
30
45
60
Q1 Q22010
Q3 Q4| Q1 Q22011
Q3 Q4| Q1 Q22012
Q3 Q4| Q1 Q22013
Q3 Q4| Q1 Q22014
Imports Exports Trade balance
ZAR billion per quarter (current v alues)
0% 15% 30% 45% 60% 75%
Other goods
Petroleum refineries & synthesisers
Other chemical products, nec.
Medicinal chemicals
Motor vehicles
Motor vehicle parts & accessories
Other goods
Agriculture (cereals & other crops)
Motor vehicles
Motor vehicle parts & accessories
Platinum group metal mining
Basic iron & steel
Share ofexports
Share ofimports
-35
-30
-25
-20
-15
-10
-5
0
5
10
15
Q1 Q22010
Q3 Q4| Q1 Q22011
Q3 Q4| Q1 Q22012
Q3 Q4| Q1 Q22013
Q3 Q4| Q1 Q22014
Imports Exports Trade balance
ZAR billion per quarter (current v alues)
0% 15% 30% 45% 60% 75%
Other goods
Plastics in primary form
Fertilisers & nitrogen compounds
Basic chemicals
Petroleum refineries & synthesisers
Crude oil mining
Other goods
Basic precious & non-ferrous metals
Basic iron & steel
Agriculture (cereals & other crops)
Coal mining
Diamond mining
Share ofexports
Share ofimports

September 2014 IDC – Research and Information – Sectoral Trends 11
Trade trends with major regions or regional blocs
SA trade balance with Oceania Top traded product categories:
First half of 2014 (cumulative total)
First half of 2014 (cumulative total)
First half of 2014 (cumulative total)
First half of 2014 (cumulative total)
SA trade balance with Nafta Top traded product categories:
SA trade balance with the Americas (excluding Nafta) Top traded product categories:
SA trade balance with Europe (excluding the EU) Top traded product categories:
-6
-4
-2
0
2
4
6
8
10
Q1 Q22010
Q3 Q4| Q1 Q22011
Q3 Q4| Q1 Q22012
Q3 Q4| Q1 Q22013
Q3 Q4| Q1 Q22014
Imports Exports Trade balance
ZAR billion per quarter (current v alues)
0% 15% 30% 45% 60%
Other goods
Medical & surgical equipment, etc.
Basic precious & non-ferrous metals
Watches & clocks
Medicinal chemicals
Agriculture (cereals & other crops)
Other goods
Motor vehicles
Agriculture (cereals & other crops)
Mining of non-ferrous metal ores
Basic precious & non-ferrous metals
Platinum group metal mining
Shareofexports
Shareofimports
-25
-20
-15
-10
-5
0
5
10
15
20
25
Q1 Q22010
Q3 Q4| Q1 Q22011
Q3 Q4| Q1 Q22012
Q3 Q4| Q1 Q22013
Q3 Q4| Q1 Q22014
Imports Exports Trade balance
ZAR billion per quarter (current v alues)
0% 15% 30% 45% 60% 75%
Other goods
Other chemical products, nec.
Mining & construction machinery
Motor vehicle parts & accessories
Aircraft & spacecraft
Motor vehicles
Other goods
Mining of non-ferrous metal ores
Basic chemicals
Platinum group metal mining
Basic iron & steel
Motor vehicles
Share ofexports
Share ofimports
-8
-6
-4
-2
0
2
4
6
Q1 Q22010
Q3 Q4| Q1 Q22011
Q3 Q4| Q1 Q22012
Q3 Q4| Q1 Q22013
Q3 Q4| Q1 Q22014
Imports Exports Trade balance
ZAR billion per quarter (current v alues)
0% 15% 30% 45% 60%
Other goods
Sugar refining
Agriculture (cereals & other crops)
Slaughtering, processing of meat
Vegetable & animal oils & fats
Motor vehicle parts & accessories
Other goods
Plastics in primary form
Basic chemicals
Motor vehicle parts & accessories
Coal mining
Basic iron & steel
Share ofexports
Share ofimports
-5
-4
-3
-2
-1
0
1
2
3
Q1 Q22010
Q3 Q4| Q1 Q22011
Q3 Q4| Q1 Q22012
Q3 Q4| Q1 Q22013
Q3 Q4| Q1 Q22014
Imports Exports Trade balance
ZAR billion per quarter (current v alues)
0% 15% 30% 45% 60%
Other goods
Mining & construction machinery
Pulp, paper & paperboard
Agriculture (cereals & other crops)
Coal mining
Basic precious & non-ferrous metals
Other goods
Mining & construction machinery
Basic iron & steel
Mining of non-ferrous metal ores
Basic chemicals
Motor vehicles
Share ofexports
Share ofimports

September 2014 IDC – Research and Information – Sectoral Trends 12
Production weight: 100 Agriculture, forestry and fishing
Real v alue added index (seasonally adjusted)
ZAR billion per quarter (current v alues) HS2 code: sector description ZAR m
H08: Edible fruit, nuts, peel o f citrus fruit, melons 14 763.00
H10: Cereals 2 182.08
H51: Wool, animal hair, horsehair yarn and fabric thereof 1 398.60
H12: Oil seed, o leagic fruits, grain, seed, fruit, etc 675.08
H07: Edible vegetables and certain roots and tubers 588.87
Expo rts T o tal ( including o thers) 21 059.66
H10: Cereals 2 697.95
H12: Oil seed, o leagic fruits, grain, seed, fruit, etc 1 411.48
H09: Coffee, tea, mate and spices 904.46
H40: Rubber and articles thereof 637.96
H24: Tobacco and manufactured tobacco substitutes 630.38
Impo rts T o tal ( including o thers) 8 042.49
HS2 code: sector description Change in ZAR m
H08: Edible fruit, nuts, peel o f citrus fruit, melons 2 008.61
H12: Oil seed, o leagic fruits, grain, seed, fruit, etc 212.83
H07: Edible vegetables and certain roots and tubers 128.36
H03: Fish, crustaceans, molluscs, aquatic invertebrates nes 85.54
H09: Coffee, tea, mate and spices 57.89
H10: Cereals -1 203.24
H51: Wool, animal hair, horsehair yarn and fabric thereof - 46.16
H24: Tobacco and manufactured tobacco substitutes - 4.62
H52: Cotton, yarn and woven fabric - 3.12
H40: Rubber and articles thereof - 0.65
First half of 2014 (cumulative total)
Export performance
Nominal value of first half of 2014 compared to first half of 2013
Quarterly
Real value added trend
Trade trends
Total per quarter
Top trading partners
First half of 2014 (cumulative total)
Employment trend
Quarterly
Number (1 000)
Major traded products
Exp
ort
s
To
p g
ain
ers
Imp
ort
s
To
p l
ose
rs
110
115
120
125
130
Q1 Q22010
Q3 Q4| Q1 Q22011
Q3 Q4| Q1 Q22012
Q3 Q4| Q1 Q22013
Q3 Q4| Q1 Q22014
Real value added
0
3
6
9
12
15
Q1 Q22010
Q3 Q4| Q1 Q22011
Q3 Q4| Q1 Q22012
Q3 Q4| Q1 Q22013
Q3 Q4| Q1 Q22014
Exports Imports
0% 5% 10% 15% 20%
Russia
USA
Brazil
Romania
Australia
Zambia
India
Netherlands
UK
UAE
China
Hong Kong
Zimbabwe
Russia
Top export destinations' share
Top import sources' share
600
640
680
720
760
800
Q1 Q22010
Q3 Q4| Q1 Q22011
Q3 Q4| Q1 Q22012
Q3 Q4| Q1 Q22013
Q3 Q4| Q1 Q22014
3.3% -- (percentage points) -9.8% -- 7.6% 36.4%
Real value added (seas. adj.) Employment Gross monthly remuneration per worker Exports (ZAR) Imports (ZAR)
Trend analysis: first half of 2014 compared to first half of 2013 (except: capacity utilisation, employment and remuneration - Q2 2014 y-o-y)
Capacity utilisation

September 2014 IDC – Research and Information – Sectoral Trends 13
Production weight: 100 Total mining
Production index (seasonally adjusted)
ZAR billion per quarter (current v alues) HS2 code: sector description ZAR m
H71: Natural or cultured pearls, precious stones and metals 65 009.56
H26: Ores, slag and ash 64 253.34
H27: Coal, petro leum and petro leum products 27 085.63
H25: Salt, sulphur, earth, stone, plaster, lime and cement 1 817.08
Expo rts T o tal ( including o thers) 158 165.61
H27: Coal, petro leum and petro leum products 95 407.43
H71: Natural or cultured pearls, precious stones and metals 3 507.31
H25: Salt, sulphur, earth, stone, plaster, lime and cement 938.24
H26: Ores, slag and ash 878.21
Impo rts T o tal ( including o thers) 100 731.19
HS2 code: sector description Change in ZAR m
H26: Ores, slag and ash 9 357.95
H27: Coal, petro leum and petro leum products 3 240.50
H25: Salt, sulphur, earth, stone, plaster, lime and cement 670.82
H71: Natural or cultured pearls, precious stones and metals -11 845.14
Export performance Top trading partners
Nominal value of first half of 2014 compared to first half of 2013 First half of 2014 (cumulative total)
To
p g
ain
ers
To
p l
ose
rs
Trade trends Major traded products
Total per quarter First half of 2014 (cumulative total)
Exp
ort
sIm
po
rts
Production trends Employment trend
Quarterly Quarterly
Number (1 000) Gross remuneration per w orker (R '000)
87
89
91
93
95
97
99
101
103
105
Q1 Q22010
Q3 Q4| Q1 Q22011
Q3 Q4| Q1 Q22012
Q3 Q4| Q1 Q22013
Q3 Q4| Q1 Q22014
Volume of production
15
25
35
45
55
65
75
85
95
105
Q1 Q22010
Q3 Q4| Q1 Q22011
Q3 Q4| Q1 Q22012
Q3 Q4| Q1 Q22013
Q3 Q4| Q1 Q22014
Exports Imports
0% 10% 20% 30% 40% 50%
Saudi Arabia
Nigeria
Angola
Ghana
UAE
Mozambique
Gabon
China
Japan
India
Netherlands
USA
UK
Switzerland
Top export destinations' share
Top import sources' share
8
10
12
14
16
18
20
480
490
500
510
520
530
540
Q1 Q22010
Q3 Q4| Q1 Q22011
Q3 Q4| Q1 Q22012
Q3 Q4| Q1 Q22013
Q3 Q4| Q1 Q22014
Employment Remunera tion per worker
-2.6% -- (percentage points) -4.9% -0.5% -1.3% 36.7%
Production (seas. adj.) Employment Gross monthly remuneration per worker Exports (ZAR) Imports (ZAR)
Trend analysis: first half of 2014 compared to first half of 2013 (except: capacity utilisation, employment and remuneration - Q2 2014 y-o-y)
Capacity utilisation

September 2014 IDC – Research and Information – Sectoral Trends 14
Production weight: 23.7 Coal mining
Production index (seasonally adjusted)
ZAR billion per quarter (current v alues) HS4 code: sector description ZAR m
H2701: Coal, briquettes, ovoids etc, made from coal 26 932.13
H2703: Peat (including peat litter) 0.61
H2702: Lignite, except jet 0.06
0.00
Expo rts T o tal ( including o thers) 26 932.80
H2701: Coal, briquettes, ovoids etc, made from coal 1 380.60
H2703: Peat (including peat litter) 22.71
Impo rts T o tal ( including o thers) 1 403.32
HS4 code: sector description Change in ZAR m
H2701: Coal, briquettes, ovoids etc, made from coal 1 268.61
H2703: Peat (including peat litter) 0.21
H2702: Lignite, except jet 0.04
Export performance Top trading partners
Nominal value of first half of 2014 compared to first half of 2013 First half of 2014 (cumulative total)
To
p g
ain
ers
To
p l
ose
rs
Trade trends Major traded products
Total per quarter First half of 2014 (cumulative total)
Exp
ort
sIm
po
rts
Production trends Employment trend
Quarterly Quarterly
Number (1 000) Gross remuneration per w orker (R '000)
90
93
96
99
102
105
Q1 Q22010
Q3 Q4| Q1 Q22011
Q3 Q4| Q1 Q22012
Q3 Q4| Q1 Q22013
Q3 Q4| Q1 Q22014
Volume of production
0
4
8
12
16
20
Q1 Q22010
Q3 Q4| Q1 Q22011
Q3 Q4| Q1 Q22012
Q3 Q4| Q1 Q22013
Q3 Q4| Q1 Q22014
Exports Imports
0% 10% 20% 30% 40% 50%
Australia
Mozambique
USA
Russia
New Zealand
Vietnam
Netherlands
India
Netherlands
China
Pakistan
Taiwan
UAE
Israel
Top export destinations' share
Top import sources' share
15
16
17
18
19
20
70
75
80
85
90
95
Q1 Q22010
Q3 Q4| Q1 Q22011
Q3 Q4| Q1 Q22012
Q3 Q4| Q1 Q22013
Q3 Q4| Q1
Employment Remunera tion per worker
-0.8% -- (percentage points) -0.4% 14.5% 4.9% 24.2%
Production (seas. adj.) Employment Gross monthly remuneration per worker Exports (ZAR) Imports (ZAR)
Trend analysis: first half of 2014 compared to first half of 2013 (except: capacity utilisation, employment and remuneration - Q2 2014 y-o-y)
Capacity utilisation
September 2014 IDC – Research and Information – Sectoral Trends 15
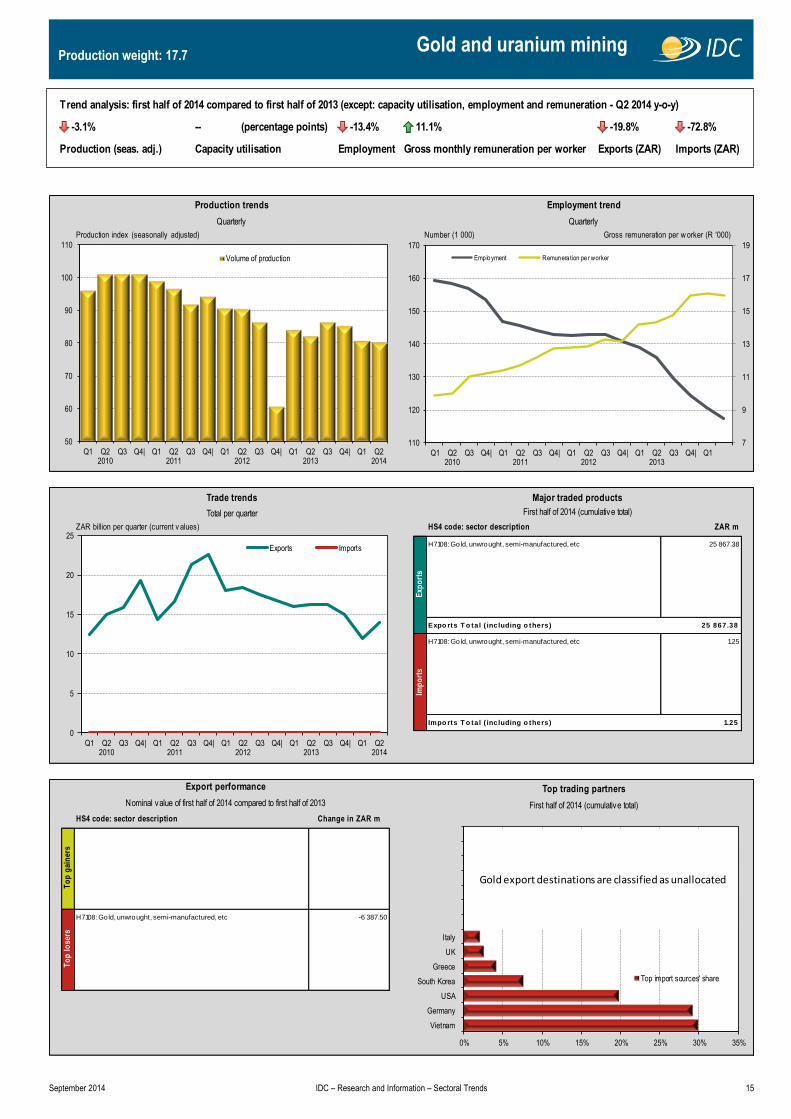
Production weight: 17.7 Gold and uranium mining
Production index (seasonally adjusted)
ZAR billion per quarter (current v alues) HS4 code: sector description ZAR m
H7108: Gold, unwrought, semi-manufactured, etc 25 867.38
Expo rts T o tal ( including o thers) 25 867.38
H7108: Gold, unwrought, semi-manufactured, etc 1.25
Impo rts T o tal ( including o thers) 1.25
HS4 code: sector description Change in ZAR m
H7108: Gold, unwrought, semi-manufactured, etc -6 387.50
Export performance Top trading partners
Nominal value of first half of 2014 compared to first half of 2013 First half of 2014 (cumulative total)
To
p g
ain
ers
To
p l
ose
rs
Trade trends Major traded products
Total per quarter First half of 2014 (cumulative total)
Exp
ort
sIm
po
rts
Production trends Employment trend
Quarterly Quarterly
Number (1 000) Gross remuneration per w orker (R '000)
50
60
70
80
90
100
110
Q1 Q22010
Q3 Q4| Q1 Q22011
Q3 Q4| Q1 Q22012
Q3 Q4| Q1 Q22013
Q3 Q4| Q1 Q22014
Volume of production
0
5
10
15
20
25
Q1 Q22010
Q3 Q4| Q1 Q22011
Q3 Q4| Q1 Q22012
Q3 Q4| Q1 Q22013
Q3 Q4| Q1 Q22014
Exports Imports
0% 5% 10% 15% 20% 25% 30% 35%
Vietnam
Germany
USA
South Korea
Greece
UK
Italy
Top export destinations' share
Top import sources' share
7
9
11
13
15
17
19
110
120
130
140
150
160
170
Q1 Q22010
Q3 Q4| Q1 Q22011
Q3 Q4| Q1 Q22012
Q3 Q4| Q1 Q22013
Q3 Q4| Q1
Employment Remunera tion per worker
Gold export destinations are classified as unallocated
-3.1% -- (percentage points) -13.4% 11.1% -19.8% -72.8%
Production (seas. adj.) Employment Gross monthly remuneration per worker Exports (ZAR) Imports (ZAR)
Trend analysis: first half of 2014 compared to first half of 2013 (except: capacity utilisation, employment and remuneration - Q2 2014 y-o-y)
Capacity utilisation

September 2014 IDC – Research and Information – Sectoral Trends 16
Production weight: 24.6 PGM mining
Production index (seasonally adjusted)
ZAR billion per quarter (current v alues) HS4 code: sector description ZAR m
H7110: P latinum, unwrought, semi-manufactured 31 897.91
H7111: M etals, clad with platinum, semi-manufactured 21.47
Expo rts T o tal ( including o thers) 31 919.38
H7110: P latinum, unwrought, semi-manufactured 1 284.01
H7111: M etals, clad with platinum, semi-manufactured 0.08
Impo rts T o tal ( including o thers) 1 284.09
HS4 code: sector description Change in ZAR m
H7111: M etals, clad with platinum, semi-manufactured 5.10
H7110: P latinum, unwrought, semi-manufactured -3 721.06
Imp
ort
s
Production trends Employment trend
Quarterly Quarterly
Number (1 000) Gross remuneration per w orker (R '000)
Export performance Top trading partners
Nominal value of first half of 2014 compared to first half of 2013 First half of 2014 (cumulative total)
To
p g
ain
ers
To
p l
ose
rs
Trade trends Major traded products
Total per quarter First half of 2014 (cumulative total)
Exp
ort
s
50
60
70
80
90
100
110
120
Q1 Q22010
Q3 Q4| Q1 Q22011
Q3 Q4| Q1 Q22012
Q3 Q4| Q1 Q22013
Q3 Q4| Q1 Q22014
Volume of production
0
5
10
15
20
25
30
Q1 Q22010
Q3 Q4| Q1 Q22011
Q3 Q4| Q1 Q22012
Q3 Q4| Q1 Q22013
Q3 Q4| Q1 Q22014
Exports Imports
0% 5% 10% 15% 20% 25% 30%
UK
Germany
Switzerland
USA
Gabon
South Korea
Taiwan
Japan
UK
USA
Switzerland
Hong Kong
Germany
China
Top export destinations' share
Top import sources' share
59.3%
11
13
15
17
19
175
185
195
205
215
Q1 Q22010
Q3 Q4| Q1 Q22011
Q3 Q4| Q1 Q22012
Q3 Q4| Q1 Q22013
Q3 Q4| Q1
Employment Remunera tion per worker
-27.8% -- (percentage points) -4.3% -20.5% -10.4% 641.4%
Production (seas. adj.) Employment Gross monthly remuneration per worker Exports (ZAR) Imports (ZAR)
Trend analysis: first half of 2014 compared to first half of 2013 (except: capacity utilisation, employment and remuneration - Q2 2014 y-o-y)
Capacity utilisation
September 2014 IDC – Research and Information – Sectoral Trends 17
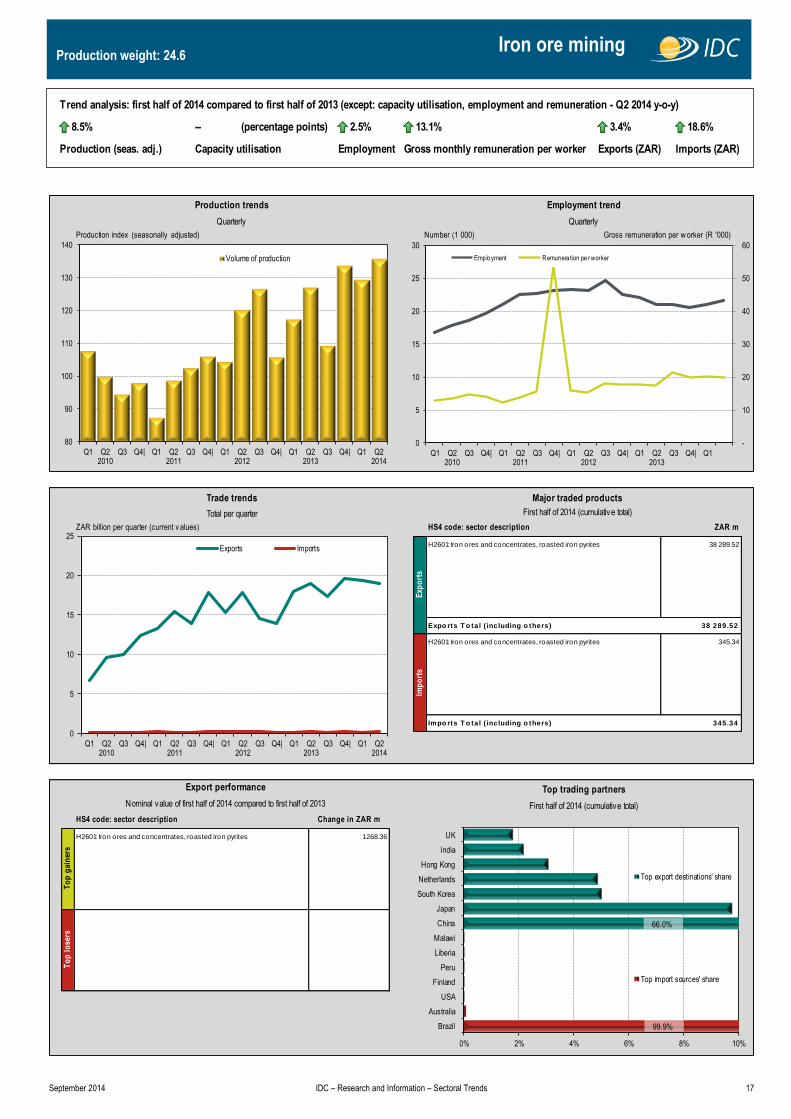
Production weight: 24.6 Iron ore mining
Production index (seasonally adjusted)
ZAR billion per quarter (current v alues) HS4 code: sector description ZAR m
H2601: Iron ores and concentrates, roasted iron pyrites 38 289.52
Expo rts T o tal ( including o thers) 38 289.52
H2601: Iron ores and concentrates, roasted iron pyrites 345.34
Impo rts T o tal ( including o thers) 345.34
HS4 code: sector description Change in ZAR m
H2601: Iron ores and concentrates, roasted iron pyrites 1 268.36
Export performance Top trading partners
Nominal value of first half of 2014 compared to first half of 2013 First half of 2014 (cumulative total)
To
p g
ain
ers
To
p l
ose
rs
Trade trends Major traded products
Total per quarter First half of 2014 (cumulative total)
Exp
ort
sIm
po
rts
Production trends Employment trend
Quarterly Quarterly
Number (1 000) Gross remuneration per w orker (R '000)
80
90
100
110
120
130
140
Q1 Q22010
Q3 Q4| Q1 Q22011
Q3 Q4| Q1 Q22012
Q3 Q4| Q1 Q22013
Q3 Q4| Q1 Q22014
Volume of production
0
5
10
15
20
25
Q1 Q22010
Q3 Q4| Q1 Q22011
Q3 Q4| Q1 Q22012
Q3 Q4| Q1 Q22013
Q3 Q4| Q1 Q22014
Exports Imports
0% 2% 4% 6% 8% 10%
Brazil
Australia
USA
Finland
Peru
Liberia
Malawi
China
Japan
South Korea
Netherlands
Hong Kong
India
UK
Top export destinations' share
Top import sources' share
99.9%
66.0%
-
10
20
30
40
50
60
0
5
10
15
20
25
30
Q1 Q22010
Q3 Q4| Q1 Q22011
Q3 Q4| Q1 Q22012
Q3 Q4| Q1 Q22013
Q3 Q4| Q1
Employment Remunera tion per worker
8.5% -- (percentage points) 2.5% 13.1% 3.4% 18.6%
Production (seas. adj.) Employment Gross monthly remuneration per worker Exports (ZAR) Imports (ZAR)
Trend analysis: first half of 2014 compared to first half of 2013 (except: capacity utilisation, employment and remuneration - Q2 2014 y-o-y)
Capacity utilisation

September 2014 IDC – Research and Information – Sectoral Trends 18
Production weight: 19.6 Other mining
Production index (seasonally adjusted)
ZAR billion per quarter (current v alues) HS4 code: sector description ZAR m
H2602: M anganese ores, iron ores >20% M anganese 9 684.60
H7102: Diamonds, not mounted or set 7 200.15
H2610: Chromium ores and concentrates 5 755.60
H2614: Titanium ores and concentrates 2 891.49
H2603: Copper ores and concentrates 2 715.99
Expo rts T o tal ( including o thers) 35 156.53
H2709: Petro leum oils, o ils from bituminous minerals, crude 92 302.03
H7102: Diamonds, not mounted or set 2 211.04
H2711: Petro leum gases & other gaseous hydrocarbons 1 701.34
H2503: Sulphur, except sublimated, precipitated, co llo idal 518.51
H2519: Natural magnesium carbonate, magnesium oxide 154.04
Impo rts T o tal ( including o thers) 97 697.19
HS4 code: sector description Change in ZAR m
H2602: M anganese ores, iron ores >20% M anganese 2 744.95
H7102: Diamonds, not mounted or set 1 445.42
H2603: Copper ores and concentrates 1 015.18
H2617: Ores and concentrates, nes 894.79
H2616: Precious metal ores and concentrates 548.48
H2610: Chromium ores and concentrates - 696.00
H2615: Niobium tantalum vanadium zirconium ores, etc - 540.39
H2607: Lead ores and concentrates - 352.13
H7106: Silver, unwrought or semi-manufactured, etc - 41.35
H2608: Zinc ores and concentrates - 32.75
Export performance Top trading partners
Nominal value of first half of 2014 compared to first half of 2013 First half of 2014 (cumulative total)
To
p g
ain
ers
To
p l
ose
rs
Trade trends Major traded products
Total per quarter First half of 2014 (cumulative total)
Exp
ort
sIm
po
rts
Production trends Employment trend
Quarterly Quarterly
Number (1 000) Gross remuneration per w orker (R '000)
80
85
90
95
100
105
110
115
120
125
Q1 Q22010
Q3 Q4| Q1 Q22011
Q3 Q4| Q1 Q22012
Q3 Q4| Q1 Q22013
Q3 Q4| Q1 Q22014
Volume of production
0
10
20
30
40
50
60
Q1 Q22010
Q3 Q4| Q1 Q22011
Q3 Q4| Q1 Q22012
Q3 Q4| Q1 Q22013
Q3 Q4| Q1 Q22014
Exports Imports
0% 10% 20% 30% 40% 50%
Saudi Arabia
Nigeria
Angola
Ghana
UAE
Mozambique
Gabon
China
Belgium
USA
India
Finland
UAE
Israel
Top export destinations' share
Top import sources' share
9
11
13
15
17
19
60
65
70
75
80
85
Q1 Q22010
Q3 Q4| Q1 Q22011
Q3 Q4| Q1 Q22012
Q3 Q4| Q1 Q22013
Q3 Q4| Q1
Employment Remunera tion per worker
14.1% -- (percentage points) 1.4% 5.2% 18.8% 35.6%
Production (seas. adj.) Employment Gross monthly remuneration per worker Exports (ZAR) Imports (ZAR)
Trend analysis: first half of 2014 compared to first half of 2013 (except: capacity utilisation, employment and remuneration - Q2 2014 y-o-y)
Capacity utilisation
September 2014 IDC – Research and Information – Sectoral Trends 19
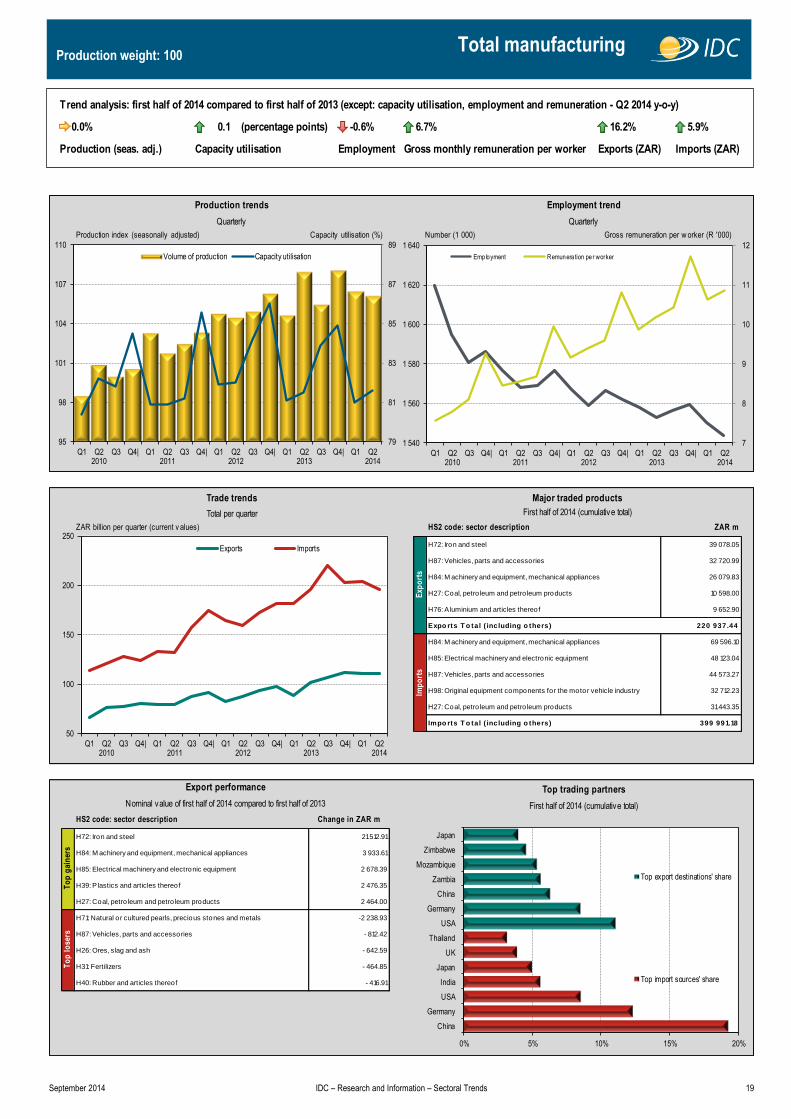
Production weight: 100 Total manufacturing
ZAR billion per quarter (current v alues) HS2 code: sector description ZAR m
H72: Iron and steel 39 078.05
H87: Vehicles, parts and accessories 32 720.99
H84: M achinery and equipment, mechanical appliances 26 079.83
H27: Coal, petro leum and petro leum products 10 598.00
H76: A luminium and articles thereof 9 652.90
Expo rts T o tal ( including o thers) 220 937.44
H84: M achinery and equipment, mechanical appliances 69 596.10
H85: Electrical machinery and electronic equipment 48 123.04
H87: Vehicles, parts and accessories 44 573.27
H98: Original equipment components for the motor vehicle industry 32 712.23
H27: Coal, petro leum and petro leum products 31 443.35
Impo rts T o tal ( including o thers) 399 991.18
HS2 code: sector description Change in ZAR m
H72: Iron and steel 21 512.91
H84: M achinery and equipment, mechanical appliances 3 933.61
H85: Electrical machinery and electronic equipment 2 678.39
H39: P lastics and articles thereof 2 476.35
H27: Coal, petro leum and petro leum products 2 464.00
H71: Natural or cultured pearls, precious stones and metals -2 238.93
H87: Vehicles, parts and accessories - 812.42
H26: Ores, slag and ash - 642.59
H31: Fertilizers - 464.85
H40: Rubber and articles thereof - 416.91
Export performance Top trading partners
Nominal value of first half of 2014 compared to first half of 2013 First half of 2014 (cumulative total)
To
p g
ain
ers
To
p l
ose
rs
Trade trends Major traded products
Total per quarter First half of 2014 (cumulative total)
Exp
ort
sIm
po
rts
Production trends Employment trend
Quarterly Quarterly
Number (1 000) Gross remuneration per w orker (R '000)Production index (seasonally adjusted) Capacity utilisation (%)
79
81
83
85
87
89
95
98
101
104
107
110
Q1 Q22010
Q3 Q4| Q1 Q22011
Q3 Q4| Q1 Q22012
Q3 Q4| Q1 Q22013
Q3 Q4| Q1 Q22014
Volume of production Capacity utilisation
50
100
150
200
250
Q1 Q22010
Q3 Q4| Q1 Q22011
Q3 Q4| Q1 Q22012
Q3 Q4| Q1 Q22013
Q3 Q4| Q1 Q22014
Exports Imports
0% 5% 10% 15% 20%
China
Germany
USA
India
Japan
UK
Thailand
USA
Germany
China
Zambia
Mozambique
Zimbabwe
Japan
Top export destinations' share
Top import sources' share
7
8
9
10
11
12
1 540
1 560
1 580
1 600
1 620
1 640
Q1 Q22010
Q3 Q4| Q1 Q22011
Q3 Q4| Q1 Q22012
Q3 Q4| Q1 Q22013
Q3 Q4| Q1 Q22014
Employment Remunera tion per worker
0.0% 0.1 (percentage points) -0.6% 6.7% 16.2% 5.9%
Production (seas. adj.) Employment Gross monthly remuneration per worker Exports (ZAR) Imports (ZAR)
Trend analysis: first half of 2014 compared to first half of 2013 (except: capacity utilisation, employment and remuneration - Q2 2014 y-o-y)
Capacity utilisation

September 2014 IDC – Research and Information – Sectoral Trends 20
Production weight: 17.4 Food
ZAR billion per quarter (current v alues) HS4 code: sector description ZAR m
H1701: Solid cane/ beet sugar & chemically pure sucrose 1 580.90
H2009: Fruit and vegetable juices, not fermented/ spirited 1 207.64
H2008: Fruit, edible plant parts nes, prepared/preserved 1 057.24
H2106: Food preparations, nes 858.80
H0303: Fish, frozen, whole 790.65
Expo rts T o tal ( including o thers) 14 663.10
H0207: M eat, edible offal o f domestic poultry 1 993.64
H1006: Rice 1 814.49
H1511: Palm o il and its fractions, not chemically modified 1 677.66
H2304: Soya-bean o il-cake and other so lid residues 1 612.47
H2106: Food preparations, nes 987.59
Impo rts T o tal ( including o thers) 19 910.37
HS4 code: sector description Change in ZAR m
H1701: Solid cane/ beet sugar & chemically pure sucrose 686.05
H2301: Flour etc of meat, fish or o ffal for animal feed 303.20
H2009: Fruit and vegetable juices, not fermented/ spirited 300.64
H0303: Fish, frozen, whole 238.49
H2106: Food preparations, nes 231.92
H1512: Safflower, sunflower & cotton-seed o il, fractions - 36.95
H1104: Worked cereal grains except flour, groat, meal,etc - 24.70
H1702: Sugars nes, lactose, fructose, glucose etc - 15.70
H1101: Wheat or meslin flour - 12.69
H3505: Dextrins, o ther modified starches, starch glues - 10.08
Export performance Top trading partners
Nominal value of first half of 2014 compared to first half of 2013 First half of 2014 (cumulative total)
To
p g
ain
ers
To
p l
ose
rs
Trade trends Major traded products
Total per quarter First half of 2014 (cumulative total)
Exp
ort
sIm
po
rts
Production trends Employment trend
Quarterly Quarterly
Number (1 000) Gross remuneration per w orker (R '000)Production index (seasonally adjusted) Capacity utilisation (%)
74
76
78
80
82
84
86
88
85
90
95
100
105
110
115
Q1 Q22010
Q3 Q4| Q1 Q22011
Q3 Q4| Q1 Q22012
Q3 Q4| Q1 Q22013
Q3 Q4| Q1
Volume of production Capacity utilisation
2
5
8
11
14
Q1 Q22010
Q3 Q4| Q1 Q22011
Q3 Q4| Q1 Q22012
Q3 Q4| Q1 Q22013
Q3 Q4| Q1 Q22014
Exports Imports
0% 3% 6% 9% 12% 15%
Argentina
Thailand
Netherlands
Indonesia
Brazil
China
Germany
Zimbabwe
Mozambique
Angola
Zambia
Italy
China
Japan
Top export destinations' share
Top import sources' share
5
7
9
11
13
165
170
175
180
185
Q1 Q22010
Q3 Q4| Q1 Q22011
Q3 Q4| Q1 Q22012
Q3 Q4| Q1 Q22013
Q3 Q4| Q1 Q22014
Employment Remunera tion per worker
2.3% -2.7 (percentage points) 0.9% 4.9% 33.7% 3.9%
Production (seas. adj.) Employment Gross monthly remuneration per worker Exports (ZAR) Imports (ZAR)
Trend analysis: first half of 2014 compared to first half of 2013 (except: capacity utilisation, employment and remuneration - Q2 2014 y-o-y)
Capacity utilisation
September 2014 IDC – Research and Information – Sectoral Trends 21
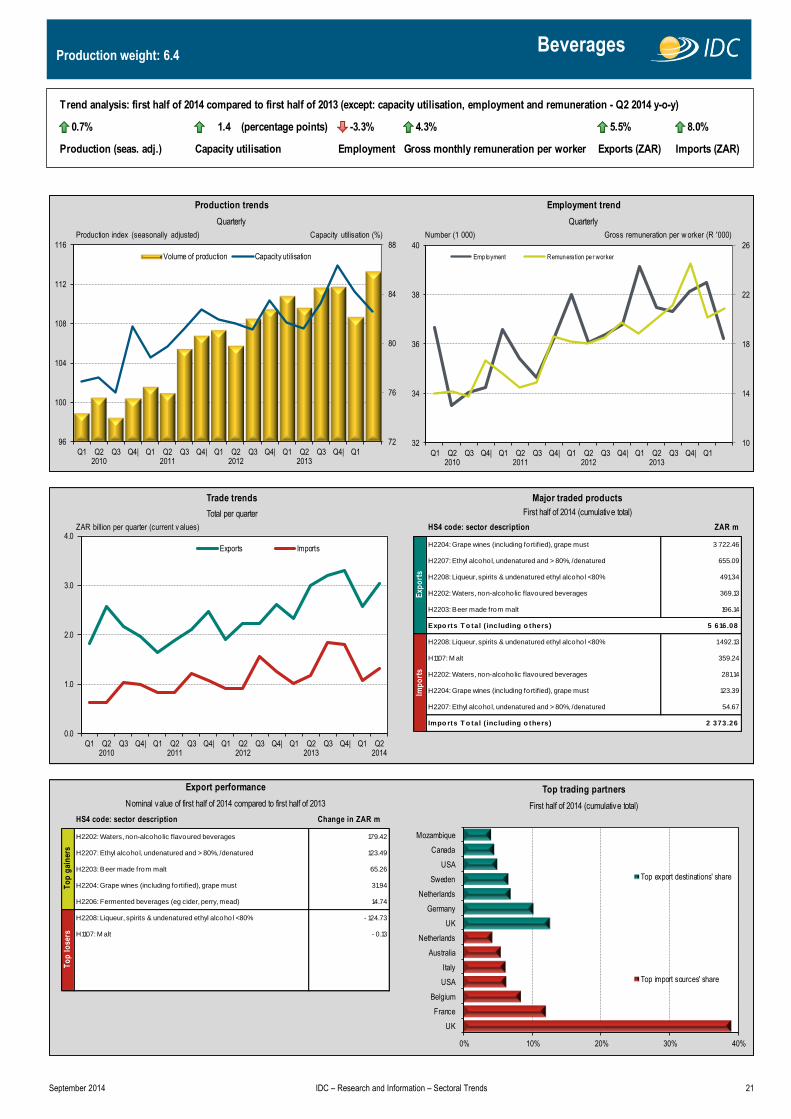
Production weight: 6.4 Beverages
ZAR billion per quarter (current v alues) HS4 code: sector description ZAR m
H2204: Grape wines (including fortified), grape must 3 722.46
H2207: Ethyl alcohol, undenatured and > 80%, /denatured 655.09
H2208: Liqueur, spirits & undenatured ethyl alcohol <80% 491.34
H2202: Waters, non-alcoholic flavoured beverages 369.13
H2203: Beer made from malt 196.14
Expo rts T o tal ( including o thers) 5 616.08
H2208: Liqueur, spirits & undenatured ethyl alcohol <80% 1 492.13
H1107: M alt 359.24
H2202: Waters, non-alcoholic flavoured beverages 281.14
H2204: Grape wines (including fortified), grape must 123.39
H2207: Ethyl alcohol, undenatured and > 80%, /denatured 54.67
Impo rts T o tal ( including o thers) 2 373.26
HS4 code: sector description Change in ZAR m
H2202: Waters, non-alcoholic flavoured beverages 179.42
H2207: Ethyl alcohol, undenatured and > 80%, /denatured 123.49
H2203: Beer made from malt 65.26
H2204: Grape wines (including fortified), grape must 31.94
H2206: Fermented beverages (eg cider, perry, mead) 14.74
H2208: Liqueur, spirits & undenatured ethyl alcohol <80% - 124.73
H1107: M alt - 0.13
Export performance Top trading partners
Nominal value of first half of 2014 compared to first half of 2013 First half of 2014 (cumulative total)
To
p g
ain
ers
To
p l
ose
rs
Trade trends Major traded products
Total per quarter First half of 2014 (cumulative total)
Exp
ort
sIm
po
rts
Production trends Employment trend
Quarterly Quarterly
Number (1 000) Gross remuneration per w orker (R '000)Production index (seasonally adjusted) Capacity utilisation (%)
72
76
80
84
88
96
100
104
108
112
116
Q1 Q22010
Q3 Q4| Q1 Q22011
Q3 Q4| Q1 Q22012
Q3 Q4| Q1 Q22013
Q3 Q4| Q1
Volume of production Capacity utilisation
0.0
1.0
2.0
3.0
4.0
Q1 Q22010
Q3 Q4| Q1 Q22011
Q3 Q4| Q1 Q22012
Q3 Q4| Q1 Q22013
Q3 Q4| Q1 Q22014
Exports Imports
0% 10% 20% 30% 40%
UK
France
Belgium
USA
Italy
Australia
Netherlands
UK
Germany
Netherlands
Sweden
USA
Canada
Mozambique
Top export destinations' share
Top import sources' share
10
14
18
22
26
32
34
36
38
40
Q1 Q22010
Q3 Q4| Q1 Q22011
Q3 Q4| Q1 Q22012
Q3 Q4| Q1 Q22013
Q3 Q4| Q1
Employment Remunera tion per worker
0.7% 1.4 (percentage points) -3.3% 4.3% 5.5% 8.0%
Production (seas. adj.) Employment Gross monthly remuneration per worker Exports (ZAR) Imports (ZAR)
Trend analysis: first half of 2014 compared to first half of 2013 (except: capacity utilisation, employment and remuneration - Q2 2014 y-o-y)
Capacity utilisation

September 2014 IDC – Research and Information – Sectoral Trends 22
Production weight: 1.2 Textiles
ZAR billion per quarter (current v alues) HS4 code: sector description ZAR m
H5105: Wool and animal hair, carded or combed 467.70
H5603: Nonwoven textiles, except felt 151.15
H9619: Sanitary towels and tampons, napkins and napkin liners for babies 146.83
H6306: Textile tarpaulin, sail, awning, tent, camping goods 133.92
H5101: Wool, not carded or combed 79.00
Expo rts T o tal ( including o thers) 1 815.71
H5407: Woven synth filament yarn, monofilament >67dtex 690.78
H9619: Sanitary towels and tampons, napkins and napkin liners for babies 655.87
H5603: Nonwoven textiles, except felt 491.09
H5513: Woven fabric>85% synt+cotn<170g/m2 unb/blchd 335.07
H6302: Bed, table, to ilet and kitchen linens 322.40
Impo rts T o tal ( including o thers) 6 198.05
HS4 code: sector description Change in ZAR m
H5105: Wool and animal hair, carded or combed 103.23
H9619: Sanitary towels and tampons, napkins and napkin liners for babies 71.34
H5603: Nonwoven textiles, except felt 36.74
H6305: Sacks& bags of a kind used for packing of goods 32.42
H5101: Wool, not carded or combed 21.17
H6306: Textile tarpaulin, sail, awning, tent, camping goods - 19.52
H5704: Carpets, floor coverings of felt, not tufted, flocked - 11.13
H5903: Fabric impregnated, coated/ covered with plastic - 6.33
H5407: Woven synth filament yarn, monofilament >67dtex - 5.87
H7019: Glass fibres, glass wool, and articles thereof - 4.87
Export performance Top trading partners
Nominal value of first half of 2014 compared to first half of 2013 First half of 2014 (cumulative total)
To
p g
ain
ers
To
p l
ose
rs
Trade trends Major traded products
Total per quarter First half of 2014 (cumulative total)
Exp
ort
sIm
po
rts
Production trends Employment trend
Quarterly Quarterly
Number (1 000) Gross remuneration per w orker (R '000)Production index (seasonally adjusted) Capacity utilisation (%)
68
69
70
71
72
73
74
75
80
84
88
92
96
100
104
108
Q1 Q22010
Q3 Q4| Q1 Q22011
Q3 Q4| Q1 Q22012
Q3 Q4| Q1 Q22013
Q3 Q4| Q1
Volume of production Capacity utilisation
0
1
2
3
4
Q1 Q22010
Q3 Q4| Q1 Q22011
Q3 Q4| Q1 Q22012
Q3 Q4| Q1 Q22013
Q3 Q4| Q1 Q22014
Exports Imports
0% 10% 20% 30% 40%
China
Pakistan
India
Germany
Poland
Turkey
Hungary
Italy
Germany
Zambia
Zimbabwe
China
UK
Mozambique
Top export destinations' share
Top import sources' share
3
4
5
6
7
8
9
120
125
130
135
140
145
150
Q1 Q22010
Q3 Q4| Q1 Q22011
Q3 Q4| Q1 Q22012
Q3 Q4| Q1 Q22013
Q3 Q4| Q1
Employment Remunera tion per worker
-3.0% -0.4 (percentage points) -2.4% 9.6% 22.1% 15.4%
Production (seas. adj.) Employment Gross monthly remuneration per worker Exports (ZAR) Imports (ZAR)
Trend analysis: first half of 2014 compared to first half of 2013 (except: capacity utilisation, employment and remuneration - Q2 2014 y-o-y)
Capacity utilisation

September 2014 IDC – Research and Information – Sectoral Trends 23
Production weight: 1.1 Wearing apparel
ZAR billion per quarter (current v alues) HS4 code: sector description ZAR m
H6203: M ens or boys suits, jackets, trousers, etc not knit 80.90
H6115: Panty hose, tights, hosiery nes, knit or crochet 41.46
H6103: M ens, boys suits,jackets,trousers, etc knit/crochet 37.85
H6211: Track suits, ski suits & swimwear, o ther garments 35.64
H6006: Other knitted or crocheted fabrics 35.17
Expo rts T o tal ( including o thers) 532.20
H6110: Jerseys, pullovers, cardigans, etc, knit or crochet 973.54
H6203: M ens or boys suits, jackets, trousers, etc not knit 910.92
H6109: T-shirts, singlets and other vests, knit or crochet 842.93
H6204: Woven female suits, jacket, dress, etc 742.43
H6104: Female suit, dress, skirt, etc, knit or crochet 413.63
Impo rts T o tal ( including o thers) 8 997.48
HS4 code: sector description Change in ZAR m
H6006: Other knitted or crocheted fabrics 15.29
H6103: M ens, boys suits,jackets,trousers, etc knit/crochet 9.82
H6211: Track suits, ski suits & swimwear, o ther garments 9.39
H6114: Garments, knit or crochet, nes 9.26
H6104: Female suit, dress, skirt, etc, knit or crochet 8.54
H6117: Clothing accessories or parts nes, knit or crochet - 14.04
H6206: Womens or girls' blouses, shirts and shirt-blouses - 4.40
H6201: Woven male overcoats, windjackets, etc - 3.25
H6205: M en's or boys' shirts - 2.60
H6110: Jerseys, pullovers, cardigans, etc, knit or crochet - 2.45
Export performance Top trading partners
Nominal value of first half of 2014 compared to first half of 2013 First half of 2014 (cumulative total)
To
p g
ain
ers
To
p l
ose
rs
Trade trends Major traded products
Total per quarter First half of 2014 (cumulative total)
Exp
ort
sIm
po
rts
Production trends Employment trend
Quarterly Quarterly
Number (1 000) Gross remuneration per w orker (R '000)Production index (seasonally adjusted) Capacity utilisation (%)
73
76
79
82
85
88
85
90
95
100
105
110
Q1 Q22010
Q3 Q4| Q1 Q22011
Q3 Q4| Q1 Q22012
Q3 Q4| Q1 Q22013
Q3 Q4| Q1 Q22014
Volume of production Capacity utilisation
0
1
2
3
4
5
6
Q1 Q22010
Q3 Q4| Q1 Q22011
Q3 Q4| Q1 Q22012
Q3 Q4| Q1 Q22013
Q3 Q4| Q1 Q22014
Exports Imports
0% 15% 30% 45% 60% 75%
China
Mauritius
Madagascar
India
Bangladesh
Vietnam
Indonesia
Mozambique
Zambia
USA
UK
Zimbabwe
DRC
Angola
Top export destinations' share
Top import sources' share
3.0
3.5
4.0
4.5
5.0
5.5
6.0
6.5
7.0
45
47
49
51
53
55
57
59
61
Q1 Q22010
Q3 Q4| Q1 Q22011
Q3 Q4| Q1 Q22012
Q3 Q4| Q1 Q22013
Q3 Q4| Q1 Q22014
Employment Remunera tion per worker
-3.8% -3.9 (percentage points) -3.9% 12.8% 9.9% 12.6%
Production (seas. adj.) Employment Gross monthly remuneration per worker Exports (ZAR) Imports (ZAR)
Trend analysis: first half of 2014 compared to first half of 2013 (except: capacity utilisation, employment and remuneration - Q2 2014 y-o-y)
Capacity utilisation

September 2014 IDC – Research and Information – Sectoral Trends 24
Production weight: 0.2 Leather & leather products
ZAR billion per quarter (current v alues) HS4 code: sector description ZAR m
H4104: Bovine/equine leather, no hair, not chamois, patent 618.92
H4107: Leather o f o ther animals, no hair, not chamois, etc 166.49
H4205: Articles of leather and composition leather, nes 121.70
H4106: Goat or kid skin leather, without hair 61.57
H4202: Trunks, suit-cases, camera cases, handbags, etc 46.02
Expo rts T o tal ( including o thers) 1 075.60
H4202: Trunks, suit-cases, camera cases, handbags, etc 955.84
H4107: Leather o f o ther animals, no hair, not chamois, etc 233.15
H4104: Bovine/equine leather, no hair, not chamois, patent 213.52
H4201: Saddlery and harness, o f any material 22.30
H4113: Composition leather, in slabs, sheets or strips 21.71
Impo rts T o tal ( including o thers) 1 500.74
HS4 code: sector description Change in ZAR m
H4104: Bovine/equine leather, no hair, not chamois, patent 206.42
H4107: Leather o f o ther animals, no hair, not chamois, etc 116.28
H4205: Articles of leather and composition leather, nes 57.85
H4202: Trunks, suit-cases, camera cases, handbags, etc 14.81
H4113: Composition leather, in slabs, sheets or strips 12.56
H4115: Composition leather, in slabs, sheets or strips - 1.74
H4114: Composition leather, in slabs, sheets or strips - 1.26
Export performance Top trading partners
Nominal value of first half of 2014 compared to first half of 2013 First half of 2014 (cumulative total)
To
p g
ain
ers
To
p l
ose
rs
Trade trends Major traded products
Total per quarter First half of 2014 (cumulative total)
Exp
ort
sIm
po
rts
Production trends Employment trend
Quarterly Quarterly
Number (1 000) Gross remuneration per w orker (R '000)Production index (seasonally adjusted) Capacity utilisation (%)
60
64
68
72
76
80
80
90
100
110
120
130
140
Q1 Q22010
Q3 Q4| Q1 Q22011
Q3 Q4| Q1 Q22012
Q3 Q4| Q1 Q22013
Q3 Q4| Q1
Volume of production Capacity utilisation
0.0
0.2
0.4
0.6
0.8
1.0
1.2
Q1 Q22010
Q3 Q4| Q1 Q22011
Q3 Q4| Q1 Q22012
Q3 Q4| Q1 Q22013
Q3 Q4| Q1 Q22014
Exports Imports
0% 10% 20% 30% 40% 50% 60%
China
India
Brazil
Uruguay
Pakistan
Italy
Vietnam
Italy
China
Vietnam
Poland
Hong Kong
Hungary
Bulgaria
Top export destinations' share
Top import sources' share
5
6
7
8
9
3
4
5
6
7
Q1 Q22010
Q3 Q4| Q1 Q22011
Q3 Q4| Q1 Q22012
Q3 Q4| Q1 Q22013
Q3 Q4| Q1
Employment Remunera tion per worker
14.1% 2.0 (percentage points) -3.2% 6.4% 64.6% 13.1%
Production (seas. adj.) Employment Gross monthly remuneration per worker Exports (ZAR) Imports (ZAR)
Trend analysis: first half of 2014 compared to first half of 2013 (except: capacity utilisation, employment and remuneration - Q2 2014 y-o-y)
Capacity utilisation

September 2014 IDC – Research and Information – Sectoral Trends 25
Production weight: 0.4 Footwear
ZAR billion per quarter (current v alues) HS4 code: sector description ZAR m
H6403: Footwear with uppers of leather 70.49
H6401: Waterproof footwear, rubber, plastic 41.87
H6402: Footwear, with outer so le, upper rubber or plastic 18.73
H6405: Footwear nes, so le not leather, rubber or plastic 15.81
H6404: Footwear with uppers of textile materials 13.24
Expo rts T o tal ( including o thers) 163.94
H6404: Footwear with uppers of textile materials 1 525.61
H6402: Footwear, with outer so le, upper rubber or plastic 1 482.64
H6403: Footwear with uppers of leather 1 141.40
H6406: Parts o f footwear, in-so les, heel cushion, etc 93.50
H6405: Footwear nes, so le not leather, rubber or plastic 76.94
Impo rts T o tal ( including o thers) 4 388.15
HS4 code: sector description Change in ZAR m
H6403: Footwear with uppers of leather 18.04
H6405: Footwear nes, so le not leather, rubber or plastic 6.05
H6402: Footwear, with outer so le, upper rubber or plastic 5.97
H6401: Waterproof footwear, rubber, plastic 4.28
H6404: Footwear with uppers of textile materials 1.15
H6406: Parts o f footwear, in-so les, heel cushion, etc - 0.08
Export performance Top trading partners
Nominal value of first half of 2014 compared to first half of 2013 First half of 2014 (cumulative total)
To
p g
ain
ers
To
p l
ose
rs
Trade trends Major traded products
Total per quarter First half of 2014 (cumulative total)
Exp
ort
sIm
po
rts
Production trends Employment trend
Quarterly Quarterly
Number (1 000) Gross remuneration per w orker (R '000)Production index (seasonally adjusted) Capacity utilisation (%)
84
86
88
90
92
94
85
90
95
100
105
110
Q1 Q22010
Q3 Q4| Q1 Q22011
Q3 Q4| Q1 Q22012
Q3 Q4| Q1 Q22013
Q3 Q4| Q1 Q22014
Volume of production Capacity utilisation
0
1
2
3
4
Q1 Q22010
Q3 Q4| Q1 Q22011
Q3 Q4| Q1 Q22012
Q3 Q4| Q1 Q22013
Q3 Q4| Q1 Q22014
Exports Imports
0% 15% 30% 45% 60% 75%
China
Vietnam
Indonesia
Italy
India
Brazil
Thailand
Zambia
Zimbabwe
Mozambique
DRC
USA
Angola
Malawi
Top export destinations' share
Top import sources' share
4
5
6
7
8
9
7
8
9
10
11
12
Q1 Q22010
Q3 Q4| Q1 Q22011
Q3 Q4| Q1 Q22012
Q3 Q4| Q1 Q22013
Q3 Q4| Q1
Employment Remunera tion per worker
-2.0% -8.7 (percentage points) 1.2% 3.7% 27.5% 10.3%
Production (seas. adj.) Employment Gross monthly remuneration per worker Exports (ZAR) Imports (ZAR)
Trend analysis: first half of 2014 compared to first half of 2013 (except: capacity utilisation, employment and remuneration - Q2 2014 y-o-y)
Capacity utilisation
September 2014 IDC – Research and Information – Sectoral Trends 26
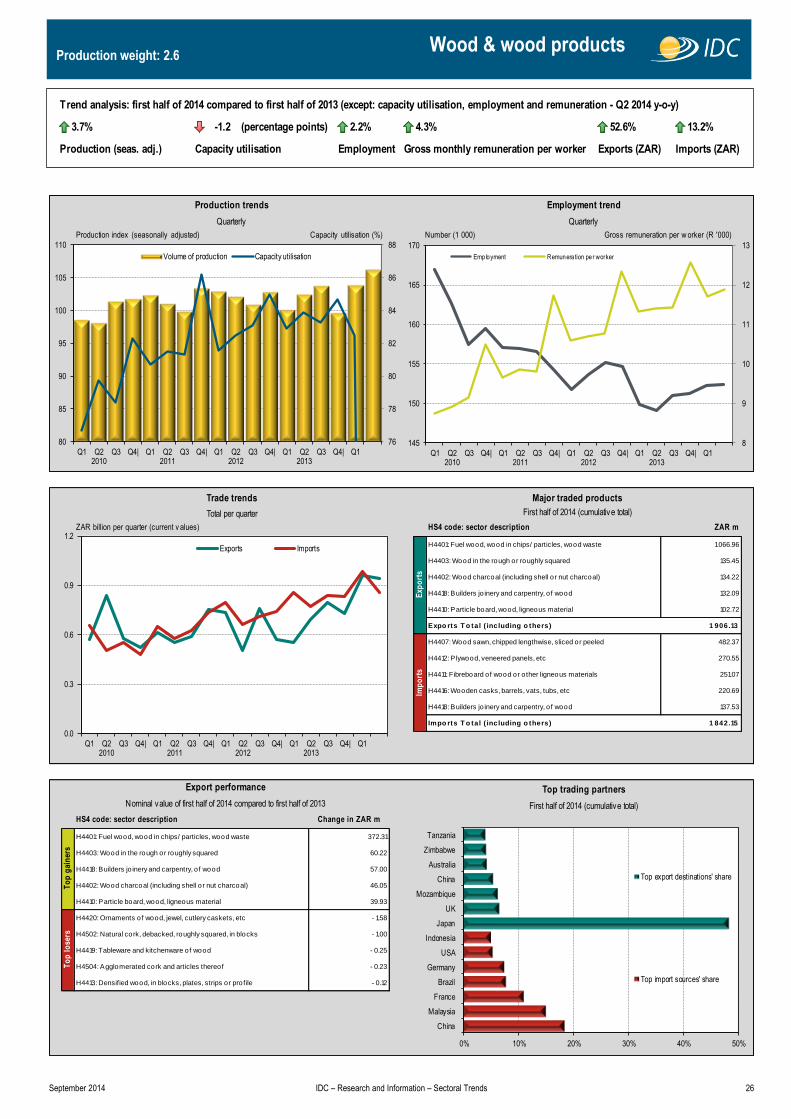
Production weight: 2.6 Wood & wood products
ZAR billion per quarter (current v alues) HS4 code: sector description ZAR m
H4401: Fuel wood, wood in chips/ particles, wood waste 1 066.96
H4403: Wood in the rough or roughly squared 135.45
H4402: Wood charcoal (including shell or nut charcoal) 134.22
H4418: Builders jo inery and carpentry, o f wood 132.09
H4410: Particle board, wood, ligneous material 102.72
Expo rts T o tal ( including o thers) 1 906.13
H4407: Wood sawn, chipped lengthwise, sliced or peeled 482.37
H4412: P lywood, veneered panels, etc 270.55
H4411: Fibreboard of wood or o ther ligneous materials 251.07
H4416: Wooden casks, barrels, vats, tubs, etc 220.69
H4418: Builders jo inery and carpentry, o f wood 137.53
Impo rts T o tal ( including o thers) 1 842.15
HS4 code: sector description Change in ZAR m
H4401: Fuel wood, wood in chips/ particles, wood waste 372.31
H4403: Wood in the rough or roughly squared 60.22
H4418: Builders jo inery and carpentry, o f wood 57.00
H4402: Wood charcoal (including shell or nut charcoal) 46.05
H4410: Particle board, wood, ligneous material 39.93
H4420: Ornaments of wood, jewel, cutlery caskets, etc - 1.58
H4502: Natural cork, debacked, roughly squared, in blocks - 1.00
H4419: Tableware and kitchenware of wood - 0.25
H4504: Agglomerated cork and articles thereof - 0.23
H4413: Densified wood, in blocks, plates, strips or profile - 0.12
Export performance Top trading partners
Nominal value of first half of 2014 compared to first half of 2013 First half of 2014 (cumulative total)
To
p g
ain
ers
To
p l
ose
rs
Trade trends Major traded products
Total per quarter First half of 2014 (cumulative total)
Exp
ort
sIm
po
rts
Production trends Employment trend
Quarterly Quarterly
Number (1 000) Gross remuneration per w orker (R '000)Production index (seasonally adjusted) Capacity utilisation (%)
76
78
80
82
84
86
88
80
85
90
95
100
105
110
Q1 Q22010
Q3 Q4| Q1 Q22011
Q3 Q4| Q1 Q22012
Q3 Q4| Q1 Q22013
Q3 Q4| Q1
Volume of production Capacity utilisation
0.0
0.3
0.6
0.9
1.2
Q1 Q22010
Q3 Q4| Q1 Q22011
Q3 Q4| Q1 Q22012
Q3 Q4| Q1 Q22013
Q3 Q4| Q1
Exports Imports
0% 10% 20% 30% 40% 50%
China
Malaysia
France
Brazil
Germany
USA
Indonesia
Japan
UK
Mozambique
China
Australia
Zimbabwe
Tanzania
Top export destinations' share
Top import sources' share
8
9
10
11
12
13
145
150
155
160
165
170
Q1 Q22010
Q3 Q4| Q1 Q22011
Q3 Q4| Q1 Q22012
Q3 Q4| Q1 Q22013
Q3 Q4| Q1
Employment Remunera tion per worker
3.7% -1.2 (percentage points) 2.2% 4.3% 52.6% 13.2%
Production (seas. adj.) Employment Gross monthly remuneration per worker Exports (ZAR) Imports (ZAR)
Trend analysis: first half of 2014 compared to first half of 2013 (except: capacity utilisation, employment and remuneration - Q2 2014 y-o-y)
Capacity utilisation
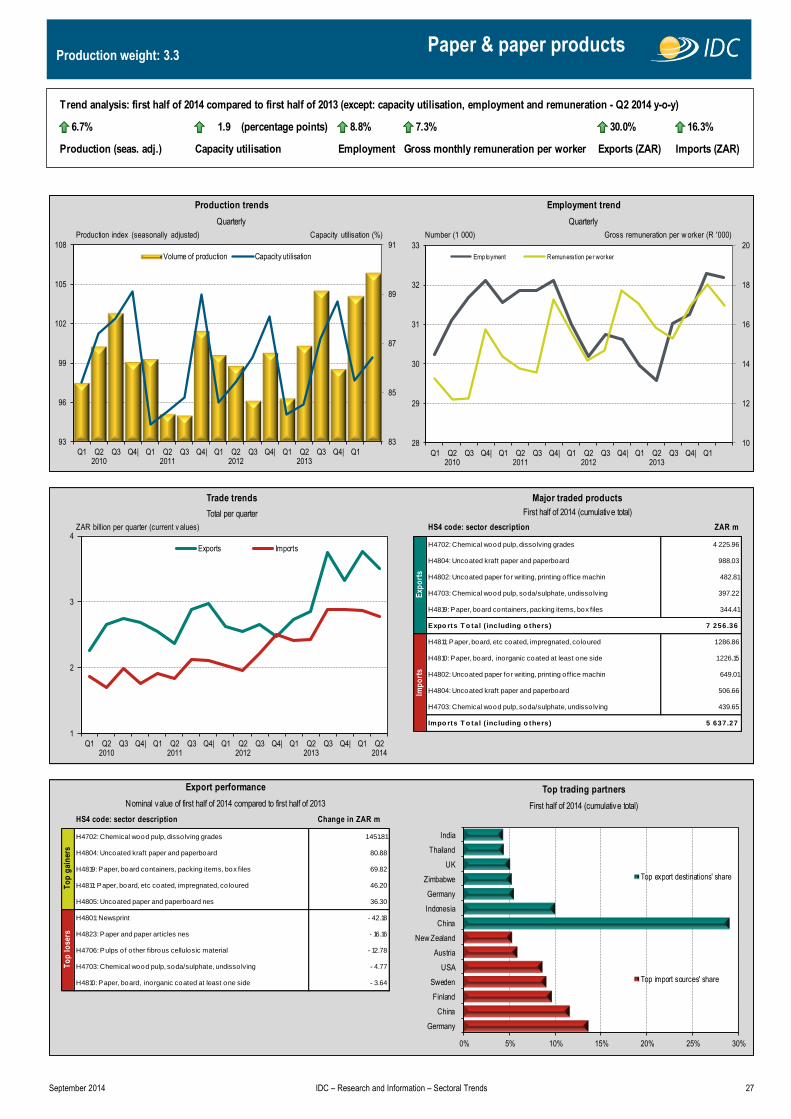
September 2014 IDC – Research and Information – Sectoral Trends 27
Production weight: 3.3 Paper & paper products
ZAR billion per quarter (current v alues) HS4 code: sector description ZAR m
H4702: Chemical wood pulp, disso lving grades 4 225.96
H4804: Uncoated kraft paper and paperboard 988.03
H4802: Uncoated paper for writing, printing office machin 482.81
H4703: Chemical wood pulp, soda/sulphate, undissolving 397.22
H4819: Paper, board containers, packing items, box files 344.41
Expo rts T o tal ( including o thers) 7 256.36
H4811: Paper, board, etc coated, impregnated, co loured 1 286.86
H4810: Paper, board, inorganic coated at least one side 1 226.15
H4802: Uncoated paper for writing, printing office machin 649.01
H4804: Uncoated kraft paper and paperboard 506.66
H4703: Chemical wood pulp, soda/sulphate, undissolving 439.65
Impo rts T o tal ( including o thers) 5 637.27
HS4 code: sector description Change in ZAR m
H4702: Chemical wood pulp, disso lving grades 1 451.81
H4804: Uncoated kraft paper and paperboard 80.88
H4819: Paper, board containers, packing items, box files 69.82
H4811: Paper, board, etc coated, impregnated, co loured 46.20
H4805: Uncoated paper and paperboard nes 36.30
H4801: Newsprint - 42.18
H4823: Paper and paper articles nes - 16.16
H4706: Pulps of o ther fibrous cellulosic material - 12.78
H4703: Chemical wood pulp, soda/sulphate, undissolving - 4.77
H4810: Paper, board, inorganic coated at least one side - 3.64
Export performance Top trading partners
Nominal value of first half of 2014 compared to first half of 2013 First half of 2014 (cumulative total)
To
p g
ain
ers
To
p l
ose
rs
Trade trends Major traded products
Total per quarter First half of 2014 (cumulative total)
Exp
ort
sIm
po
rts
Production trends Employment trend
Quarterly Quarterly
Number (1 000) Gross remuneration per w orker (R '000)Production index (seasonally adjusted) Capacity utilisation (%)
83
85
87
89
91
93
96
99
102
105
108
Q1 Q22010
Q3 Q4| Q1 Q22011
Q3 Q4| Q1 Q22012
Q3 Q4| Q1 Q22013
Q3 Q4| Q1
Volume of production Capacity utilisation
1
2
3
4
Q1 Q22010
Q3 Q4| Q1 Q22011
Q3 Q4| Q1 Q22012
Q3 Q4| Q1 Q22013
Q3 Q4| Q1 Q22014
Exports Imports
0% 5% 10% 15% 20% 25% 30%
Germany
China
Finland
Sweden
USA
Austria
New Zealand
China
Indonesia
Germany
Zimbabwe
UK
Thailand
India
Top export destinations' share
Top import sources' share
10
12
14
16
18
20
28
29
30
31
32
33
Q1 Q22010
Q3 Q4| Q1 Q22011
Q3 Q4| Q1 Q22012
Q3 Q4| Q1 Q22013
Q3 Q4| Q1
Employment Remunera tion per worker
6.7% 1.9 (percentage points) 8.8% 7.3% 30.0% 16.3%
Production (seas. adj.) Employment Gross monthly remuneration per worker Exports (ZAR) Imports (ZAR)
Trend analysis: first half of 2014 compared to first half of 2013 (except: capacity utilisation, employment and remuneration - Q2 2014 y-o-y)
Capacity utilisation
6.7% 1.9 (percentage points) 8.8% 7.3% 30.0% 16.3%
Production (seas. adj.) Employment Gross monthly remuneration per worker Exports (ZAR) Imports (ZAR)
Trend analysis: first half of 2014 compared to first half of 2013 (except: capacity utilisation and employment - Q2 2014 compared to Q2 2013)
Capacity utilisation

September 2014 IDC – Research and Information – Sectoral Trends 28
Production weight: 3.6 Printing, publishing & recorded media
ZAR billion per quarter (current v alues) HS4 code: sector description ZAR m
H4901: Printed reading books, brochures, leaflets, etc 153.00
H4820: Office books, forms, exercise books, fo lders, etc 74.77
H4911: Printed matter, catalogues, pictures and photos 65.31
H4908: Transfers (decalcomanias) 31.77
H4902: Newspapers, journals and periodicals 22.67
Expo rts T o tal ( including o thers) 355.28
H4901: Printed reading books, brochures, leaflets, etc 798.18
H4911: Printed matter, catalogues, pictures and photos 184.75
H4907: Documents of title (bonds etc), unused stamps, etc 179.13
H4820: Office books, forms, exercise books, fo lders, etc 60.31
H4902: Newspapers, journals and periodicals 24.70
Impo rts T o tal ( including o thers) 1 326.30
HS4 code: sector description Change in ZAR m
H4901: Printed reading books, brochures, leaflets, etc 28.88
H4820: Office books, forms, exercise books, fo lders, etc 16.81
H4911: Printed matter, catalogues, pictures and photos 12.68
H8442: M achinery or equipment for print preparation 1.19
H4910: Calendars, printed 0.27
H4908: Transfers (decalcomanias) - 15.97
H4902: Newspapers, journals and periodicals - 7.34
H4905: Printed maps, charts and atlases - 0.80
H4909: Postcards, printed or illustrated, greeting cards - 0.36
H4903: Children's picture, drawing or co louring books - 0.16
Export performance Top trading partners
Nominal value of first half of 2014 compared to first half of 2013 First half of 2014 (cumulative total)
To
p g
ain
ers
To
p l
ose
rs
Trade trends Major traded products
Total per quarter First half of 2014 (cumulative total)
Exp
ort
sIm
po
rts
Production trends Employment trend
Quarterly Quarterly
Number (1 000) Gross remuneration per w orker (R '000)Production index (seasonally adjusted) Capacity utilisation (%)
75
78
81
84
87
90
98
106
114
122
Q1 Q22010
Q3 Q4| Q1 Q22011
Q3 Q4| Q1 Q22012
Q3 Q4| Q1 Q22013
Q3 Q4| Q1 Q22014
Volume of production Capacity utilisation
0.0
0.2
0.4
0.6
0.8
1.0
Q1 Q22010
Q3 Q4| Q1 Q22011
Q3 Q4| Q1 Q22012
Q3 Q4| Q1 Q22013
Q3 Q4| Q1 Q22014
Exports Imports
0% 5% 10% 15% 20% 25% 30% 35%
UK
Germany
USA
China
Ireland
Belgium
Switzerland
Zimbabwe
Mozambique
Rwanda
Angola
Malawi
Zambia
Saudi Arabia
Top export destinations' share
Top import sources' share
9
11
13
15
17
19
47
49
51
53
55
57
Q1 Q22010
Q3 Q4| Q1 Q22011
Q3 Q4| Q1 Q22012
Q3 Q4| Q1 Q22013
Q3 Q4| Q1 Q22014
Employment Remunera tion per worker
-4.0% -0.4 (percentage points) -3.5% 3.8% 11.0% -15.6%
Production (seas. adj.) Employment Gross monthly remuneration per worker Exports (ZAR) Imports (ZAR)
Trend analysis: first half of 2014 compared to first half of 2013 (except: capacity utilisation, employment and remuneration - Q2 2014 y-o-y)
Capacity utilisation

September 2014 IDC – Research and Information – Sectoral Trends 29
Production weight: 6.3 Coke & refined petroleum products
ZAR billion per quarter (current v alues) HS4 code: sector description ZAR m
H2710: Petro leum oils, bituminous, distillates, except crude 7 869.80
H2712: Petro leum jelly and wax, o ther mineral waxes 1 011.81
H2713: Petro leum coke, bitumen & other o il industry residues 521.06
H2844: Radioactive elements, isotopes, compounds and mixtures 257.69
H2704: Retort carbon, coke/semi-coke of coal, lignite,peat 176.72
Expo rts T o tal ( including o thers) 9 993.51
H2710: Petro leum oils, bituminous, distillates, except crude 29 362.20
H2704: Retort carbon, coke/semi-coke of coal, lignite,peat 782.70
H2713: Petro leum coke, bitumen & other o il industry residues 579.01
H2712: Petro leum jelly and wax, o ther mineral waxes 323.54
H2711: Petro leum gases & other gaseous hydrocarbons 140.94
Impo rts T o tal ( including o thers) 31 242.70
HS4 code: sector description Change in ZAR m
H2713: Petro leum coke, bitumen & other o il industry residues 293.35
H2710: Petro leum oils, bituminous, distillates, except crude 139.70
H2712: Petro leum jelly and wax, o ther mineral waxes 132.90
H2704: Retort carbon, coke/semi-coke of coal, lignite,peat 129.59
H2711: Petro leum gases & other gaseous hydrocarbons 28.92
H2844: Radioactive elements, isotopes, compounds and mixtures - 61.25
H2706: Tar from coal, lignite or peat, o ther mineral tars - 0.06
H3826: B iodiesel and mixtures thereof, containing ≤70 per cent by mass of petro leum oils - 0.06
Export performance Top trading partners
Nominal value of first half of 2014 compared to first half of 2013 First half of 2014 (cumulative total)
To
p g
ain
ers
To
p l
ose
rs
Trade trends Major traded products
Total per quarter First half of 2014 (cumulative total)
Exp
ort
sIm
po
rts
Production trends Employment trend
Quarterly Quarterly
Number (1 000) Gross remuneration per w orker (R '000)Production index (seasonally adjusted) Capacity utilisation (%)
63
70
77
84
91
80
90
100
110
120
Q1 Q22010
Q3 Q4| Q1 Q22011
Q3 Q4| Q1 Q22012
Q3 Q4| Q1 Q22013
Q3 Q4| Q1
Volume of production Capacity utilisation
2
6
10
14
18
22
Q1 Q22010
Q3 Q4| Q1 Q22011
Q3 Q4| Q1 Q22012
Q3 Q4| Q1 Q22013
Q3 Q4| Q1 Q22014
Exports Imports
0% 5% 10% 15% 20% 25% 30%
Singapore
India
UAE
Oman
Saudi Arabia
Netherlands
Italy
Singapore
DRC
Zambia
Mozambique
Zimbabwe
USA
Angola
Top export destinations' share
Top import sources' share
15
18
21
24
27
168
170
172
174
176
Q1 Q22010
Q3 Q4| Q1 Q22011
Q3 Q4| Q1 Q22012
Q3 Q4| Q1 Q22013
Q3 Q4| Q1
Employment Remunera tion per worker
8.5% 5.2 (percentage points) -1.0% 5.9% 7.1% -8.6%
Production (seas. adj.) Employment Gross monthly remuneration per worker Exports (ZAR) Imports (ZAR)
Trend analysis: first half of 2014 compared to first half of 2013 (except: capacity utilisation, employment and remuneration - Q2 2014 y-o-y)
Capacity utilisation

September 2014 IDC – Research and Information – Sectoral Trends 30
Production weight: 4.8 Basic chemicals
ZAR billion per quarter (current v alues) HS4 code: sector description ZAR m
H3902: Polymers of propylene, o lefins in primary forms 3 463.90
H2901: Acyclic hydrocarbons 2 577.09
H2905: Acyclic alcohols and their derivatives 1 319.04
H2914: Ketones and quinones, their derivatives 1 276.51
H2916: Unsaturated acyclic, cyclic monocarboxylc acids 796.84
Expo rts T o tal ( including o thers) 19 011.29
H3901: Polymers of ethylene, in primary forms 1 864.05
H3907: Polyacetals, po lyethers, etc, primary 1 416.53
H3102: M ineral or chemical fertilizers, nitrogenous 1 269.90
H2905: Acyclic alcohols and their derivatives 839.29
H3903: Polymers of styrene, in primary forms 836.52
Impo rts T o tal ( including o thers) 21 345.60
HS4 code: sector description Change in ZAR m
H3902: Polymers of propylene, o lefins in primary forms 1 046.50
H2804: Hydrogen, rare gases, non-metallic elements 391.01
H2914: Ketones and quinones, their derivatives 233.92
H2707: Coal-tar distillation products including o ils 209.14
H2905: Acyclic alcohols and their derivatives 173.98
H3105: Fertilizer mixtures in packs of < 10kg - 343.08
H2835: Phosphatic compounds - 83.67
H2820: M anganese oxides - 72.93
H2909: Ether and derivatives - 44.84
H2932: Heterocyclic compounds with oxygn hetero-atoms - 44.46
Export performance Top trading partners
Nominal value of first half of 2014 compared to first half of 2013 First half of 2014 (cumulative total)
To
p g
ain
ers
To
p l
ose
rs
Trade trends Major traded products
Total per quarter First half of 2014 (cumulative total)
Exp
ort
sIm
po
rts
Production trends Employment trend
Quarterly Quarterly
Number (1 000) Gross remuneration per w orker (R '000)Production index (seasonally adjusted) Capacity utilisation (%)
76
78
80
82
84
86
88
90
90
94
98
102
106
110
114
118
Q1 Q22010
Q3 Q4| Q1 Q22011
Q3 Q4| Q1 Q22012
Q3 Q4| Q1 Q22013
Q3 Q4| Q1 Q22014
Volume of production Capacity utilisation
5
7
9
11
13
Q1 Q22010
Q3 Q4| Q1 Q22011
Q3 Q4| Q1 Q22012
Q3 Q4| Q1 Q22013
Q3 Q4| Q1 Q22014
Exports Imports
0% 2% 4% 6% 8% 10% 12% 14% 16% 18%
China
Germany
Saudi Arabia
USA
India
Netherlands
South Korea
USA
Belgium
Singapore
China
Zambia
Zimbabwe
India
Top export destinations' share
Top import sources' share
12
14
16
18
20
22
24
17.0
17.5
18.0
18.5
19.0
19.5
20.0
Q1 Q22010
Q3 Q4| Q1 Q22011
Q3 Q4| Q1 Q22012
Q3 Q4| Q1 Q22013
Q3 Q4| Q1
Employment Remunera tion per worker
3.6% -0.6 (percentage points) 0.6% -0.7% 16.2% 13.3%
Production (seas. adj.) Employment Gross monthly remuneration per worker Exports (ZAR) Imports (ZAR)
Trend analysis: first half of 2014 compared to first half of 2013 (except: capacity utilisation, employment and remuneration - Q2 2014 y-o-y)
Capacity utilisation

September 2014 IDC – Research and Information – Sectoral Trends 31
Production weight: 7.1 Other chemicals & man-made fibres
ZAR billion per quarter (current v alues) HS4 code: sector description ZAR m
H3815: Reaction initiators, accelerators & catalysts 1 146.14
H3808: Insecticides, fungicides, herbicides etc (retail) 1 018.43
H3304: Beauty, make-up and skin care preparations 966.87
H3824: Prepared binders for foundary moulds or cores 789.79
H3402: Organic surface active agent, preparation, except soap 608.26
Expo rts T o tal ( including o thers) 10 666.71
H3004: M edicaments, therapeutic, prophylactic use 8 609.18
H8523: Prepared unrecorded sound recording media 1 642.41
H3808: Insecticides, fungicides, herbicides etc (retail) 1 543.01
H3002: B lood, antisera, vaccines, toxins and cultures 1 430.76
H3824: Prepared binders for foundary moulds or cores 1 256.38
Impo rts T o tal ( including o thers) 30 631.90
HS4 code: sector description Change in ZAR m
H3815: Reaction initiators, accelerators & catalysts 929.80
H3824: Prepared binders for foundary moulds or cores 336.53
H3304: Beauty, make-up and skin care preparations 228.36
H3307: Shaving and to ilet preparations nes, deodorizers 171.04
H3814: Organic composite so lvents,paint,varnish remover 130.39
H3808: Insecticides, fungicides, herbicides etc (retail) - 241.89
H3823: Chemical industry products nes - 169.85
H3818: Element/compound wafers doped for electronics - 16.27
H3004: M edicaments, therapeutic, prophylactic use - 14.26
H2923: Quaternary ammonium salts, hydroxides, lecithins - 13.26
Export performance Top trading partners
Nominal value of first half of 2014 compared to first half of 2013 First half of 2014 (cumulative total)
To
p g
ain
ers
To
p l
ose
rs
Trade trends Major traded products
Total per quarter First half of 2014 (cumulative total)
Exp
ort
sIm
po
rts
Production trends Employment trend
Quarterly Quarterly
Number (1 000) Gross remuneration per w orker (R '000)Production index (seasonally adjusted) Capacity utilisation (%)
76
78
80
82
84
86
95
100
105
110
115
120
Q1 Q22010
Q3 Q4| Q1 Q22011
Q3 Q4| Q1 Q22012
Q3 Q4| Q1 Q22013
Q3 Q4| Q1 Q22014
Volume of production Capacity utilisation
0
4
8
12
16
20
Q1 Q22010
Q3 Q4| Q1 Q22011
Q3 Q4| Q1 Q22012
Q3 Q4| Q1 Q22013
Q3 Q4| Q1 Q22014
Exports Imports
0% 3% 6% 9% 12% 15%
Germany
USA
India
France
China
UK
Netherlands
Zimbabwe
Germany
Zambia
Mozambique
Angola
USA
Brazil
Top export destinations' share
Top import sources' share
12
14
16
18
20
22
46
47
48
49
50
51
Q1 Q22010
Q3 Q4| Q1 Q22011
Q3 Q4| Q1 Q22012
Q3 Q4| Q1 Q22013
Q3 Q4| Q1
Employment Remunera tion per worker
-3.6% 2.6 (percentage points) -2.6% 9.4% 25.9% 8.1%
Production (seas. adj.) Employment Gross monthly remuneration per worker Exports (ZAR) Imports (ZAR)
Trend analysis: first half of 2014 compared to first half of 2013 (except: capacity utilisation, employment and remuneration - Q2 2014 y-o-y)
Capacity utilisation
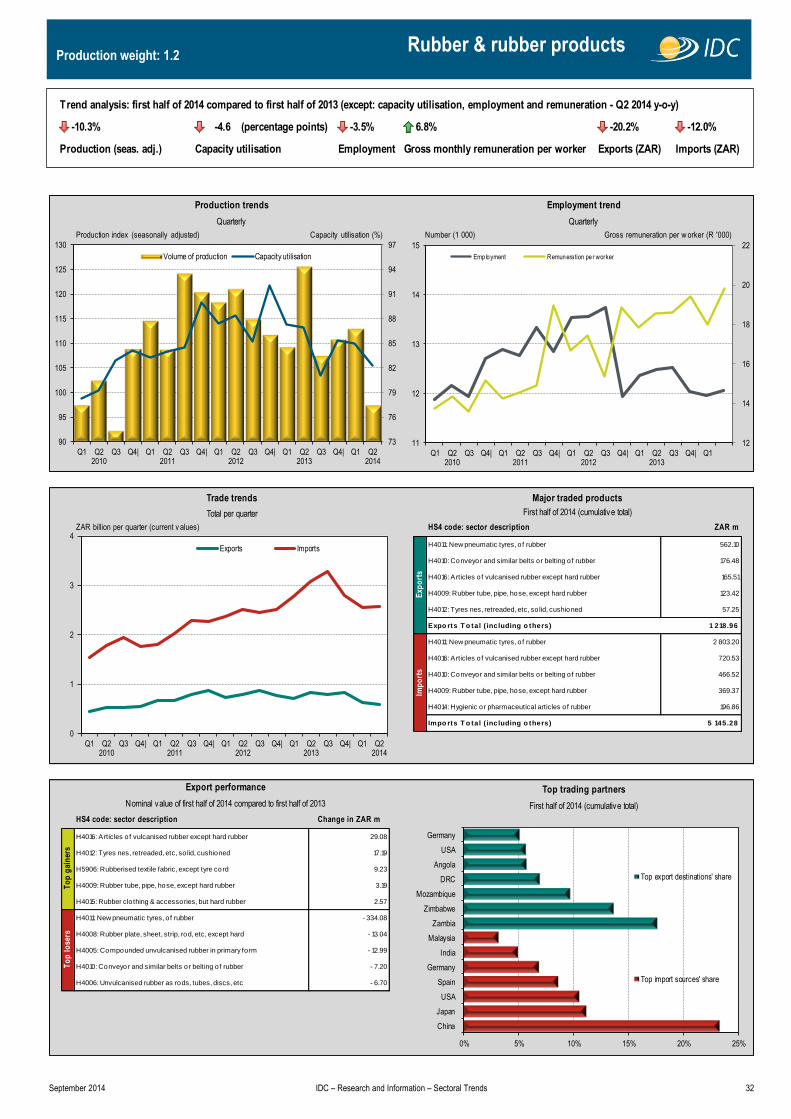
September 2014 IDC – Research and Information – Sectoral Trends 32
Production weight: 1.2 Rubber & rubber products
ZAR billion per quarter (current v alues) HS4 code: sector description ZAR m
H4011: New pneumatic tyres, o f rubber 562.10
H4010: Conveyor and similar belts or belting of rubber 176.48
H4016: Articles of vulcanised rubber except hard rubber 165.51
H4009: Rubber tube, pipe, hose, except hard rubber 123.42
H4012: Tyres nes, retreaded, etc, so lid, cushioned 57.25
Expo rts T o tal ( including o thers) 1 218.96
H4011: New pneumatic tyres, o f rubber 2 803.20
H4016: Articles of vulcanised rubber except hard rubber 720.53
H4010: Conveyor and similar belts or belting of rubber 466.52
H4009: Rubber tube, pipe, hose, except hard rubber 369.37
H4014: Hygienic or pharmaceutical articles of rubber 196.86
Impo rts T o tal ( including o thers) 5 145.28
HS4 code: sector description Change in ZAR m
H4016: Articles of vulcanised rubber except hard rubber 29.08
H4012: Tyres nes, retreaded, etc, so lid, cushioned 17.19
H5906: Rubberised textile fabric, except tyre cord 9.23
H4009: Rubber tube, pipe, hose, except hard rubber 3.19
H4015: Rubber clo thing & accessories, but hard rubber 2.57
H4011: New pneumatic tyres, o f rubber - 334.08
H4008: Rubber plate, sheet, strip, rod, etc, except hard - 13.04
H4005: Compounded unvulcanised rubber in primary form - 12.99
H4010: Conveyor and similar belts or belting of rubber - 7.20
H4006: Unvulcanised rubber as rods, tubes, discs, etc - 6.70
Export performance Top trading partners
Nominal value of first half of 2014 compared to first half of 2013 First half of 2014 (cumulative total)
To
p g
ain
ers
To
p l
ose
rs
Trade trends Major traded products
Total per quarter First half of 2014 (cumulative total)
Exp
ort
sIm
po
rts
Production trends Employment trend
Quarterly Quarterly
Number (1 000) Gross remuneration per w orker (R '000)Production index (seasonally adjusted) Capacity utilisation (%)
73
76
79
82
85
88
91
94
97
90
95
100
105
110
115
120
125
130
Q1 Q22010
Q3 Q4| Q1 Q22011
Q3 Q4| Q1 Q22012
Q3 Q4| Q1 Q22013
Q3 Q4| Q1 Q22014
Volume of production Capacity utilisation
0
1
2
3
4
Q1 Q22010
Q3 Q4| Q1 Q22011
Q3 Q4| Q1 Q22012
Q3 Q4| Q1 Q22013
Q3 Q4| Q1 Q22014
Exports Imports
0% 5% 10% 15% 20% 25%
China
Japan
USA
Spain
Germany
India
Malaysia
Zambia
Zimbabwe
Mozambique
DRC
Angola
USA
Germany
Top export destinations' share
Top import sources' share
12
14
16
18
20
22
11
12
13
14
15
Q1 Q22010
Q3 Q4| Q1 Q22011
Q3 Q4| Q1 Q22012
Q3 Q4| Q1 Q22013
Q3 Q4| Q1
Employment Remunera tion per worker
-10.3% -4.6 (percentage points) -3.5% 6.8% -20.2% -12.0%
Production (seas. adj.) Employment Gross monthly remuneration per worker Exports (ZAR) Imports (ZAR)
Trend analysis: first half of 2014 compared to first half of 2013 (except: capacity utilisation, employment and remuneration - Q2 2014 y-o-y)
Capacity utilisation

September 2014 IDC – Research and Information – Sectoral Trends 33
Production weight: 3.1 Plastic & plastic products
ZAR billion per quarter (current v alues) HS4 code: sector description ZAR m
H3923: Containers, bobbins and packages, o f plastics 532.78
H3926: P lastic articles nes 396.71
H3917: P lastic tube, pipe, hose and fittings 377.45
H3920: P lastic plate, sheet, film not cellular, reinforced 182.81
H3921: P lastic plate, sheet, film, fo il, strip, cellular, nes 139.54
Expo rts T o tal ( including o thers) 1 967.03
H3920: P lastic plate, sheet, film not cellular, reinforced 1 383.75
H3926: P lastic articles nes 986.87
H3919: Self-adhesive plates, sheets, film, etc of plastic 771.46
H3923: Containers, bobbins and packages, o f plastics 675.12
H3921: P lastic plate, sheet, film, fo il, strip, cellular, nes 592.74
Impo rts T o tal ( including o thers) 5 937.31
HS4 code: sector description Change in ZAR m
H3926: P lastic articles nes 141.42
H3921: P lastic plate, sheet, film, fo il, strip, cellular, nes 72.74
H3923: Containers, bobbins and packages, o f plastics 33.63
H3922: Bathroom wares, o f plastics 28.39
H3925: P lastic articles for use in construction nes 14.52
H3917: P lastic tube, pipe, hose and fittings - 33.39
H9405: Lamps and lighting fittings, illuminated signs, etc - 0.04
Export performance Top trading partners
Nominal value of first half of 2014 compared to first half of 2013 First half of 2014 (cumulative total)
To
p g
ain
ers
To
p l
ose
rs
Trade trends Major traded products
Total per quarter First half of 2014 (cumulative total)
Exp
ort
sIm
po
rts
Production trends Employment trend
Quarterly Quarterly
Number (1 000) Gross remuneration per w orker (R '000)Production index (seasonally adjusted) Capacity utilisation (%)
78
80
82
84
86
88
90
92
97
99
101
103
105
107
109
111
Q1 Q22010
Q3 Q4| Q1 Q22011
Q3 Q4| Q1 Q22012
Q3 Q4| Q1 Q22013
Q3 Q4| Q1 Q22014
Volume of production Capacity utilisation
0
1
2
3
4
Q1 Q22010
Q3 Q4| Q1 Q22011
Q3 Q4| Q1 Q22012
Q3 Q4| Q1 Q22013
Q3 Q4| Q1 Q22014
Exports Imports
0% 5% 10% 15% 20% 25% 30%
China
Germany
USA
UK
India
Italy
France
Zimbabwe
Zambia
Mozambique
DRC
UK
Ghana
Angola
Top export destinations' share
Top import sources' share
5
7
9
11
13
15
35
36
37
38
39
40
Q1 Q22010
Q3 Q4| Q1 Q22011
Q3 Q4| Q1 Q22012
Q3 Q4| Q1 Q22013
Q3 Q4| Q1
Employment Remunera tion per worker
-2.1% -1.3 (percentage points) -2.6% 11.2% 18.4% 12.8%
Production (seas. adj.) Employment Gross monthly remuneration per worker Exports (ZAR) Imports (ZAR)
Trend analysis: first half of 2014 compared to first half of 2013 (except: capacity utilisation, employment and remuneration - Q2 2014 y-o-y)
Capacity utilisation

September 2014 IDC – Research and Information – Sectoral Trends 34
Production weight: 0.9 Glass & glass products
ZAR billion per quarter (current v alues) HS4 code: sector description ZAR m
H7007: Safety glass (toughened, tempered, laminated) 228.93
H7005: Float glass, surface ground, po lished glass 175.83
H7010: Glass bottles, flasks, jars, phials, stoppers, etc 91.53
H7019: Glass fibres, glass wool, and articles thereof 68.52
H7003: Cast and ro lled glass, sheets and profiles 38.45
Expo rts T o tal ( including o thers) 662.67
H7013: Glassware for table, kitchen, to ilet, decoration 280.55
H7007: Safety glass (toughened, tempered, laminated) 245.11
H7019: Glass fibres, glass wool, and articles thereof 178.17
H7009: Glass mirrors, whether or not framed 116.00
H7010: Glass bottles, flasks, jars, phials, stoppers, etc 115.31
Impo rts T o tal ( including o thers) 1 228.19
HS4 code: sector description Change in ZAR m
H7007: Safety glass (toughened, tempered, laminated) 32.12
H7005: Float glass, surface ground, po lished glass 27.30
H7019: Glass fibres, glass wool, and articles thereof 17.81
H7009: Glass mirrors, whether or not framed 3.79
H7018: Glass beads, imitation stones (not jewelery), etc 2.50
H7010: Glass bottles, flasks, jars, phials, stoppers, etc - 52.48
H7008: M ultiple-walled insulating units o f glass - 3.98
H7002: Glass in balls, rods or tubes, unworked - 3.18
H7017: Laboratory, hygienic/ pharmaceutical glassware - 1.89
H7003: Cast and ro lled glass, sheets and profiles - 1.49
Export performance Top trading partners
Nominal value of first half of 2014 compared to first half of 2013 First half of 2014 (cumulative total)
To
p g
ain
ers
To
p l
ose
rs
Trade trends Major traded products
Total per quarter First half of 2014 (cumulative total)
Exp
ort
sIm
po
rts
Production trends Employment trend
Quarterly Quarterly
Number (1 000) Gross remuneration per w orker (R '000)Production index (seasonally adjusted) Capacity utilisation (%)
77
82
87
92
97
80
90
100
110
120
Q1 Q22010
Q3 Q4| Q1 Q22011
Q3 Q4| Q1 Q22012
Q3 Q4| Q1 Q22013
Q3 Q4| Q1 Q22014
Volume of production Capacity utilisation
0.0
0.2
0.4
0.6
0.8
1.0
Q1 Q22010
Q3 Q4| Q1 Q22011
Q3 Q4| Q1 Q22012
Q3 Q4| Q1 Q22013
Q3 Q4| Q1 Q22014
Exports Imports
0% 10% 20% 30% 40%
China
Germany
USA
France
Indonesia
UAE
UK
India
UK
Zimbabwe
Mozambique
Zambia
Belgium
Germany
Top export destinations' share
Top import sources' share
10
12
14
16
9
10
11
12
Q1 Q22010
Q3 Q4| Q1 Q22011
Q3 Q4| Q1 Q22012
Q3 Q4| Q1 Q22013
Q3 Q4| Q1
Employment Remunera tion per worker
-17.8% -5.4 (percentage points) -0.7% 8.9% 3.3% 13.2%
Production (seas. adj.) Employment Gross monthly remuneration per worker Exports (ZAR) Imports (ZAR)
Trend analysis: first half of 2014 compared to first half of 2013 (except: capacity utilisation, employment and remuneration - Q2 2014 y-o-y)
Capacity utilisation
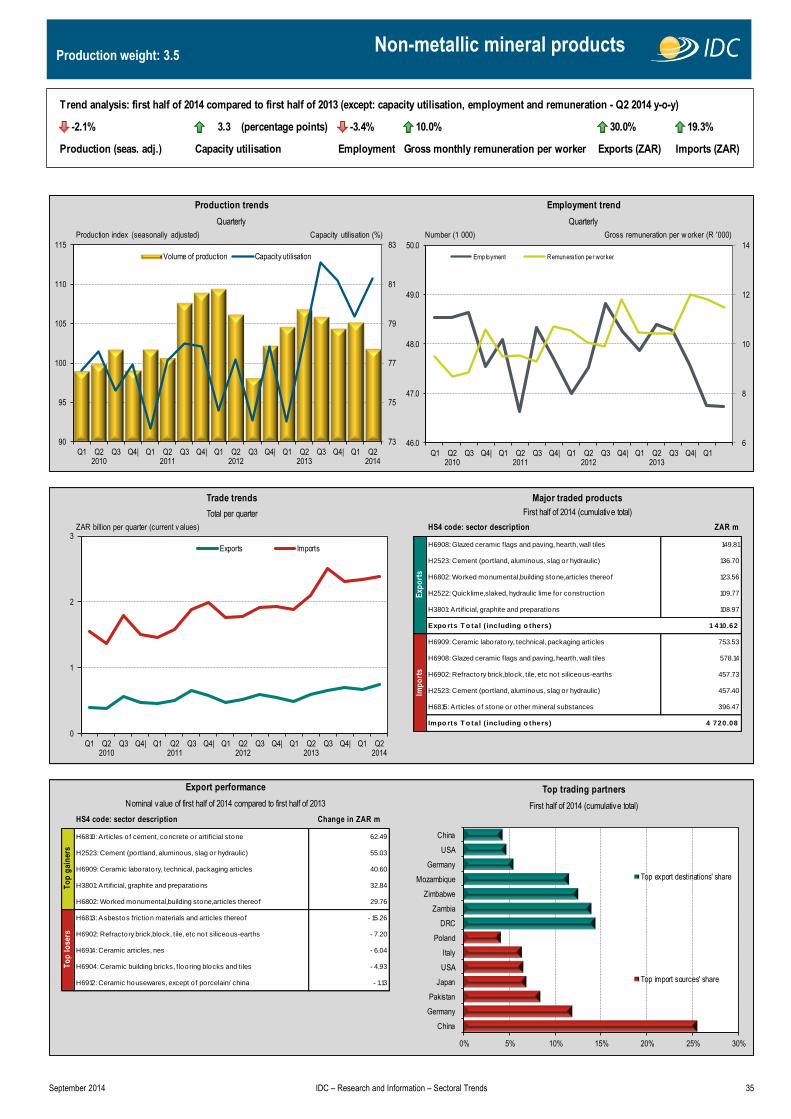
September 2014 IDC – Research and Information – Sectoral Trends 35
Production weight: 3.5 Non-metallic mineral products
ZAR billion per quarter (current v alues) HS4 code: sector description ZAR m
H6908: Glazed ceramic flags and paving, hearth, wall tiles 149.81
H2523: Cement (portland, aluminous, slag or hydraulic) 136.70
H6802: Worked monumental,building stone,articles thereof 123.56
H2522: Quicklime,slaked, hydraulic lime for construction 109.77
H3801: Artificial, graphite and preparations 108.97
Expo rts T o tal ( including o thers) 1 410.62
H6909: Ceramic laboratory, technical, packaging articles 753.53
H6908: Glazed ceramic flags and paving, hearth, wall tiles 578.14
H6902: Refractory brick,block, tile, etc not siliceous-earths 457.73
H2523: Cement (portland, aluminous, slag or hydraulic) 457.40
H6815: Articles of stone or o ther mineral substances 396.47
Impo rts T o tal ( including o thers) 4 720.08
HS4 code: sector description Change in ZAR m
H6810: Articles of cement, concrete or artificial stone 62.49
H2523: Cement (portland, aluminous, slag or hydraulic) 55.03
H6909: Ceramic laboratory, technical, packaging articles 40.60
H3801: Artificial, graphite and preparations 32.84
H6802: Worked monumental,building stone,articles thereof 29.76
H6813: Asbestos friction materials and articles thereof - 15.26
H6902: Refractory brick,block, tile, etc not siliceous-earths - 7.20
H6914: Ceramic articles, nes - 6.04
H6904: Ceramic building bricks, flooring blocks and tiles - 4.93
H6912: Ceramic housewares, except o f porcelain/ china - 1.13
Export performance Top trading partners
Nominal value of first half of 2014 compared to first half of 2013 First half of 2014 (cumulative total)
To
p g
ain
ers
To
p l
ose
rs
Trade trends Major traded products
Total per quarter First half of 2014 (cumulative total)
Exp
ort
sIm
po
rts
Production trends Employment trend
Quarterly Quarterly
Number (1 000) Gross remuneration per w orker (R '000)Production index (seasonally adjusted) Capacity utilisation (%)
73
75
77
79
81
83
90
95
100
105
110
115
Q1 Q22010
Q3 Q4| Q1 Q22011
Q3 Q4| Q1 Q22012
Q3 Q4| Q1 Q22013
Q3 Q4| Q1 Q22014
Volume of production Capacity utilisation
0
1
2
3
Q1 Q22010
Q3 Q4| Q1 Q22011
Q3 Q4| Q1 Q22012
Q3 Q4| Q1 Q22013
Q3 Q4| Q1 Q22014
Exports Imports
0% 5% 10% 15% 20% 25% 30%
China
Germany
Pakistan
Japan
USA
Italy
Poland
DRC
Zambia
Zimbabwe
Mozambique
Germany
USA
China
Top export destinations' share
Top import sources' share
6
8
10
12
14
46.0
47.0
48.0
49.0
50.0
Q1 Q22010
Q3 Q4| Q1 Q22011
Q3 Q4| Q1 Q22012
Q3 Q4| Q1 Q22013
Q3 Q4| Q1
Employment Remunera tion per worker
-2.1% 3.3 (percentage points) -3.4% 10.0% 30.0% 19.3%
Production (seas. adj.) Employment Gross monthly remuneration per worker Exports (ZAR) Imports (ZAR)
Trend analysis: first half of 2014 compared to first half of 2013 (except: capacity utilisation, employment and remuneration - Q2 2014 y-o-y)
Capacity utilisation

September 2014 IDC – Research and Information – Sectoral Trends 36
Production weight: 4.7 Basic iron & steel products
ZAR billion per quarter (current v alues) HS4 code: sector description ZAR m
H7202: Ferro-alloys 23 877.46
H7219: Rolled stainless steel sheet, width > 600mm 4 122.95
H7208: Hot-ro lled products, iron/steel, width>600mm, etc 3 004.71
H7201: P ig iron and spiegeleisen in primary forms 1 851.55
H7210: Flat-ro lled iron/steel, >600mm, clad, plated/ coated 1 022.71
Expo rts T o tal ( including o thers) 37 833.66
H7210: Flat-ro lled iron/steel, >600mm, clad, plated/ coated 1 428.27
H7225: Flat-ro lled alloy steel, width >600mm 1 399.75
H7202: Ferro-alloys 755.45
H7307: P ipe fittings, o f iron or steel 680.25
H7208: Hot-ro lled products, iron/steel, width>600mm, etc 586.42
Impo rts T o tal ( including o thers) 8 393.85
HS4 code: sector description Change in ZAR m
H7202: Ferro-alloys 9 131.05
H7208: Hot-ro lled products, iron/steel, width>600mm, etc 1 729.29
H7219: Rolled stainless steel sheet, width > 600mm 776.94
H7201: P ig iron and spiegeleisen in primary forms 560.47
H7210: Flat-ro lled iron/steel, >600mm, clad, plated/ coated 338.21
H7213: Hot ro lled bar, rod of iron/steel, in irregular co ils - 45.64
H7302: Railway & tramway track material o f iron or steel - 40.66
H7212: Flat-ro lled iron/steel, <600mm, clad, plated/ coated - 34.00
H7307: P ipe fittings, o f iron or steel - 27.50
H7228: Bar, rod, angle, etc nes, ho llow steel drill bars - 22.94
Export performance Top trading partners
Nominal value of first half of 2014 compared to first half of 2013 First half of 2014 (cumulative total)
To
p g
ain
ers
To
p l
ose
rs
Trade trends Major traded products
Total per quarter First half of 2014 (cumulative total)
Exp
ort
sIm
po
rts
Production trends Employment trend
Quarterly Quarterly
Number (1 000) Gross remuneration per w orker (R '000)Production index (seasonally adjusted) Capacity utilisation (%)
59
66
73
80
87
80
90
100
110
120
Q1 Q22010
Q3 Q4| Q1 Q22011
Q3 Q4| Q1 Q22012
Q3 Q4| Q1 Q22013
Q3 Q4| Q1 Q22014
Volume of production Capacity utilisation
0
5
10
15
20
25
Q1 Q22010
Q3 Q4| Q1 Q22011
Q3 Q4| Q1 Q22012
Q3 Q4| Q1 Q22013
Q3 Q4| Q1 Q22014
Exports Imports
0% 5% 10% 15% 20% 25% 30%
China
Germany
Japan
Sweden
India
Austria
Taiwan
China
USA
Netherlands
Germany
Japan
Taiwan
Mozambique
Top export destinations' share
Top import sources' share
13
15
17
19
21
23
45
47
49
51
53
55
Q1 Q22010
Q3 Q4| Q1 Q22011
Q3 Q4| Q1 Q22012
Q3 Q4| Q1 Q22013
Q3 Q4| Q1
Employment Remunera tion per worker
2.4% -3.4 (percentage points) -2.3% 13.3% 53.5% -20.4%
Production (seas. adj.) Employment Gross monthly remuneration per worker Exports (ZAR) Imports (ZAR)
Trend analysis: first half of 2014 compared to first half of 2013 (except: capacity utilisation, employment and remuneration - Q2 2014 y-o-y)
Capacity utilisation

September 2014 IDC – Research and Information – Sectoral Trends 37
Production weight: 3.5 Basic non-ferrous metal products
ZAR billion per quarter (current v alues) HS4 code: sector description ZAR m
H7601: Unwrought aluminium 5 743.85
H7606: A luminium plates, sheets&strip, thickness> 0.2 mm 2 604.73
H7502: Unwrought nickel 863.10
H7505: Nickel bars, rods, profiles and wire 766.89
H7403: Refined copper and copper alloys, unwrought 490.22
Expo rts T o tal ( including o thers) 12 878.83
H2818: A luminium oxide, hydroxide & artificial corundum 2 628.30
H7408: Copper wire 1 099.53
H7606: A luminium plates, sheets&strip, thickness> 0.2 mm 582.33
H7601: Unwrought aluminium 509.74
H7403: Refined copper and copper alloys, unwrought 457.45
Impo rts T o tal ( including o thers) 8 112.52
HS4 code: sector description Change in ZAR m
H7601: Unwrought aluminium 629.72
H7505: Nickel bars, rods, profiles and wire 585.93
H7606: A luminium plates, sheets&strip, thickness> 0.2 mm 335.38
H7502: Unwrought nickel 236.14
H7403: Refined copper and copper alloys, unwrought 187.14
H7506: Nickel plates, sheets, strip and fo il - 416.22
H7501: Nickel matte, interim products of nickel metallurgy - 350.76
H8111: M anganese, articles thereof, waste or scrap - 295.74
H7504: Nickel powders and flakes - 15.00
H8108: Titanium, articles thereof, waste or scrap - 12.31
Export performance Top trading partners
Nominal value of first half of 2014 compared to first half of 2013 First half of 2014 (cumulative total)
To
p g
ain
ers
To
p l
ose
rs
Trade trends Major traded products
Total per quarter First half of 2014 (cumulative total)
Exp
ort
sIm
po
rts
Production trends Employment trend
Quarterly Quarterly
Number (1 000) Gross remuneration per w orker (R '000)Production index (seasonally adjusted) Capacity utilisation (%)
66
70
74
78
82
86
90
85
90
95
100
105
110
115
Q1 Q22010
Q3 Q4| Q1 Q22011
Q3 Q4| Q1 Q22012
Q3 Q4| Q1 Q22013
Q3 Q4| Q1 Q22014
Volume of production Capacity utilisation
0
2
4
6
8
Q1 Q22010
Q3 Q4| Q1 Q22011
Q3 Q4| Q1 Q22012
Q3 Q4| Q1 Q22013
Q3 Q4| Q1 Q22014
Exports Imports
0% 5% 10% 15% 20% 25% 30% 35%
Australia
China
Zambia
Germany
Russia
Bahrain
Brazil
Japan
USA
China
Switzerland
South Korea
UK
Netherlands
Top export destinations' share
Top import sources' share
11
14
17
20
23
16
18
20
22
24
Q1 Q22010
Q3 Q4| Q1 Q22011
Q3 Q4| Q1 Q22012
Q3 Q4| Q1 Q22013
Q3 Q4| Q1
Employment Remunera tion per worker
-0.3% -0.3 (percentage points) -0.8% -11.3% 12.2% 12.1%
Production (seas. adj.) Employment Gross monthly remuneration per worker Exports (ZAR) Imports (ZAR)
Trend analysis: first half of 2014 compared to first half of 2013 (except: capacity utilisation, employment and remuneration - Q2 2014 y-o-y)
Capacity utilisation
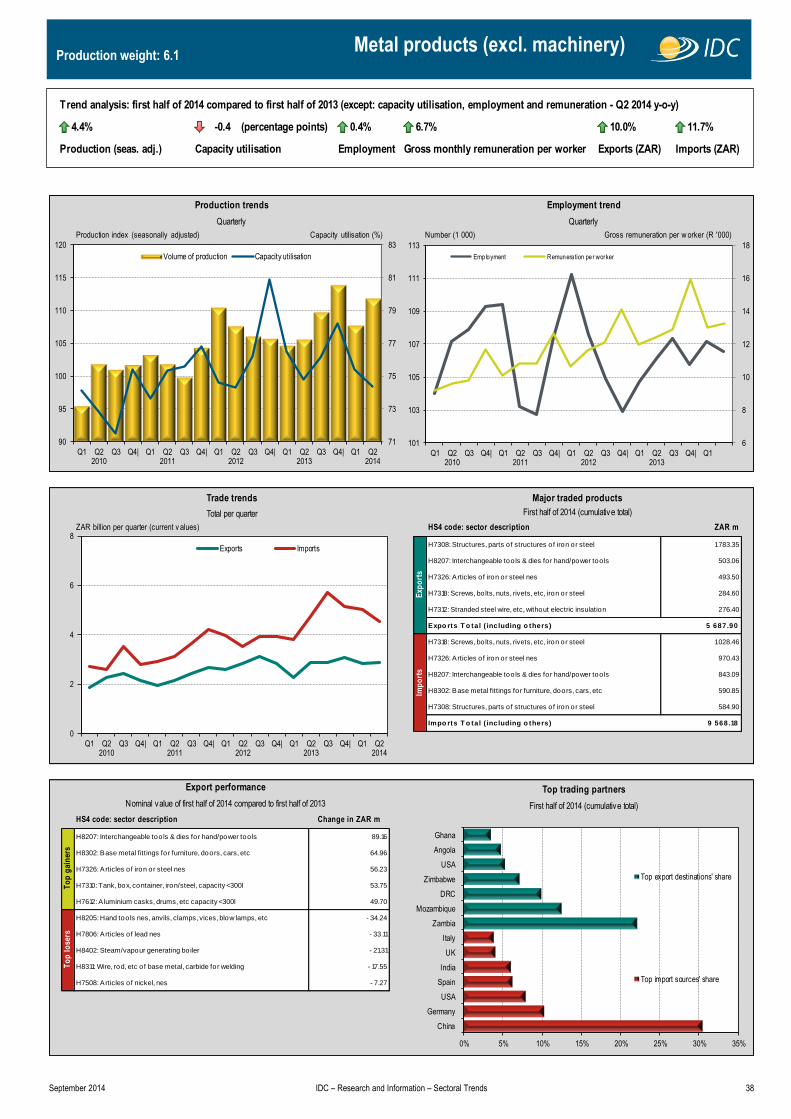
September 2014 IDC – Research and Information – Sectoral Trends 38
Production weight: 6.1 Metal products (excl. machinery)
ZAR billion per quarter (current v alues) HS4 code: sector description ZAR m
H7308: Structures, parts o f structures of iron or steel 1 783.35
H8207: Interchangeable too ls & dies for hand/power too ls 503.06
H7326: Articles of iron or steel nes 493.50
H7318: Screws, bo lts, nuts, rivets, etc, iron or steel 284.60
H7312: Stranded steel wire, etc, without electric insulation 276.40
Expo rts T o tal ( including o thers) 5 687.90
H7318: Screws, bo lts, nuts, rivets, etc, iron or steel 1 028.46
H7326: Articles of iron or steel nes 970.43
H8207: Interchangeable too ls & dies for hand/power too ls 843.09
H8302: Base metal fittings for furniture, doors, cars, etc 590.85
H7308: Structures, parts o f structures of iron or steel 584.90
Impo rts T o tal ( including o thers) 9 568.18
HS4 code: sector description Change in ZAR m
H8207: Interchangeable too ls & dies for hand/power too ls 89.16
H8302: Base metal fittings for furniture, doors, cars, etc 64.96
H7326: Articles of iron or steel nes 56.23
H7310: Tank, box, container, iron/steel, capacity <300l 53.75
H7612: A luminium casks, drums, etc capacity <300l 49.70
H8205: Hand too ls nes, anvils, clamps, vices, blow lamps, etc - 34.24
H7806: Articles of lead nes - 33.11
H8402: Steam/vapour generating boiler - 21.31
H8311: Wire, rod, etc o f base metal, carbide for welding - 17.55
H7508: Articles of nickel, nes - 7.27
Export performance Top trading partners
Nominal value of first half of 2014 compared to first half of 2013 First half of 2014 (cumulative total)
To
p g
ain
ers
To
p l
ose
rs
Trade trends Major traded products
Total per quarter First half of 2014 (cumulative total)
Exp
ort
sIm
po
rts
Production trends Employment trend
Quarterly Quarterly
Number (1 000) Gross remuneration per w orker (R '000)Production index (seasonally adjusted) Capacity utilisation (%)
71
73
75
77
79
81
83
90
95
100
105
110
115
120
Q1 Q22010
Q3 Q4| Q1 Q22011
Q3 Q4| Q1 Q22012
Q3 Q4| Q1 Q22013
Q3 Q4| Q1 Q22014
Volume of production Capacity utilisation
0
2
4
6
8
Q1 Q22010
Q3 Q4| Q1 Q22011
Q3 Q4| Q1 Q22012
Q3 Q4| Q1 Q22013
Q3 Q4| Q1 Q22014
Exports Imports
0% 5% 10% 15% 20% 25% 30% 35%
China
Germany
USA
Spain
India
UK
Italy
Zambia
Mozambique
DRC
Zimbabwe
USA
Angola
Ghana
Top export destinations' share
Top import sources' share
6
8
10
12
14
16
18
101
103
105
107
109
111
113
Q1 Q22010
Q3 Q4| Q1 Q22011
Q3 Q4| Q1 Q22012
Q3 Q4| Q1 Q22013
Q3 Q4| Q1
Employment Remunera tion per worker
4.4% -0.4 (percentage points) 0.4% 6.7% 10.0% 11.7%
Production (seas. adj.) Employment Gross monthly remuneration per worker Exports (ZAR) Imports (ZAR)
Trend analysis: first half of 2014 compared to first half of 2013 (except: capacity utilisation, employment and remuneration - Q2 2014 y-o-y)
Capacity utilisation
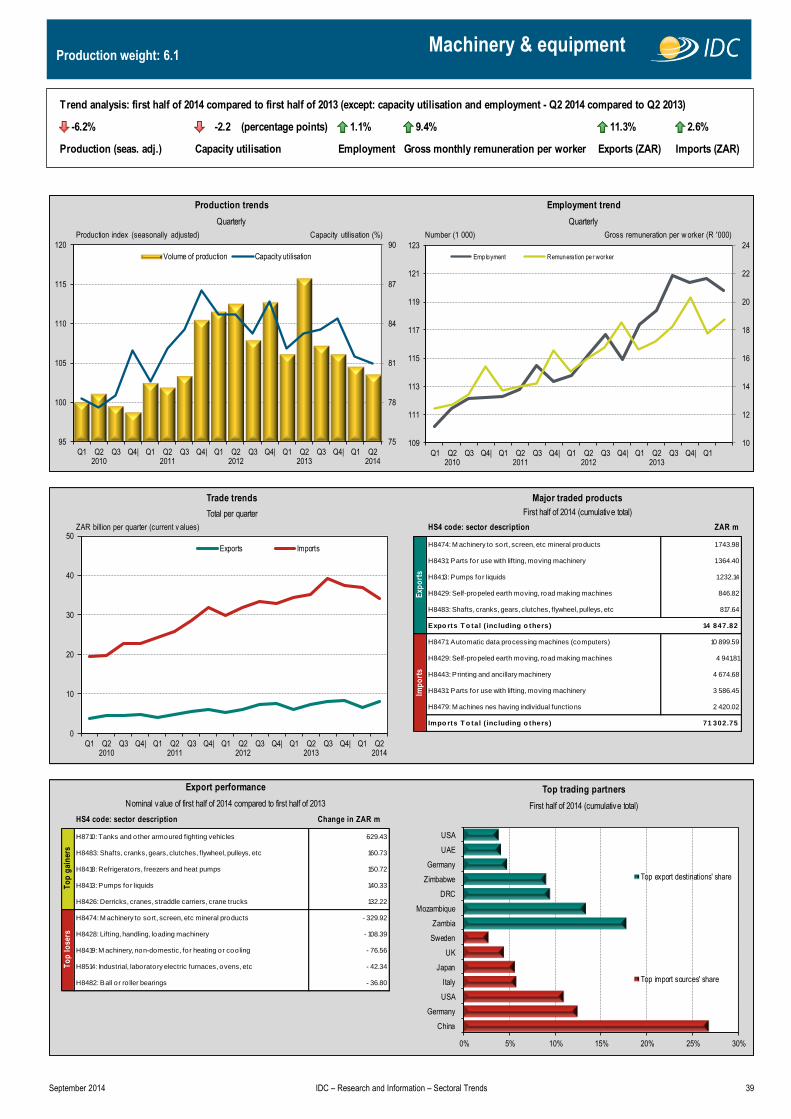
September 2014 IDC – Research and Information – Sectoral Trends 39
Production weight: 6.1 Machinery & equipment
ZAR billion per quarter (current v alues) HS4 code: sector description ZAR m
H8474: M achinery to sort, screen, etc mineral products 1 743.98
H8431: Parts for use with lifting, moving machinery 1 364.40
H8413: Pumps for liquids 1 232.14
H8429: Self-propeled earth moving, road making machines 846.82
H8483: Shafts, cranks, gears, clutches, flywheel, pulleys, etc 817.64
Expo rts T o tal ( including o thers) 14 847.82
H8471: Automatic data processing machines (computers) 10 899.59
H8429: Self-propeled earth moving, road making machines 4 941.81
H8443: Printing and ancillary machinery 4 674.68
H8431: Parts for use with lifting, moving machinery 3 586.45
H8479: M achines nes having individual functions 2 420.02
Impo rts T o tal ( including o thers) 71 302.75
HS4 code: sector description Change in ZAR m
H8710: Tanks and other armoured fighting vehicles 629.43
H8483: Shafts, cranks, gears, clutches, flywheel, pulleys, etc 160.73
H8418: Refrigerators, freezers and heat pumps 150.72
H8413: Pumps for liquids 140.33
H8426: Derricks, cranes, straddle carriers, crane trucks 132.22
H8474: M achinery to sort, screen, etc mineral products - 329.92
H8428: Lifting, handling, loading machinery - 108.39
H8419: M achinery, non-domestic, for heating or cooling - 76.56
H8514: Industrial, laboratory electric furnaces, ovens, etc - 42.34
H8482: Ball or ro ller bearings - 36.80
Export performance Top trading partners
Nominal value of first half of 2014 compared to first half of 2013 First half of 2014 (cumulative total)
To
p g
ain
ers
To
p l
ose
rs
Trade trends Major traded products
Total per quarter First half of 2014 (cumulative total)
Exp
ort
sIm
po
rts
Production trends Employment trend
Quarterly Quarterly
Number (1 000) Gross remuneration per w orker (R '000)Production index (seasonally adjusted) Capacity utilisation (%)
75
78
81
84
87
90
95
100
105
110
115
120
Q1 Q22010
Q3 Q4| Q1 Q22011
Q3 Q4| Q1 Q22012
Q3 Q4| Q1 Q22013
Q3 Q4| Q1 Q22014
Volume of production Capacity utilisation
0
10
20
30
40
50
Q1 Q22010
Q3 Q4| Q1 Q22011
Q3 Q4| Q1 Q22012
Q3 Q4| Q1 Q22013
Q3 Q4| Q1 Q22014
Exports Imports
0% 5% 10% 15% 20% 25% 30%
China
Germany
USA
Italy
Japan
UK
Sweden
Zambia
Mozambique
DRC
Zimbabwe
Germany
UAE
USA
Top export destinations' share
Top import sources' share
10
12
14
16
18
20
22
24
109
111
113
115
117
119
121
123
Q1 Q22010
Q3 Q4| Q1 Q22011
Q3 Q4| Q1 Q22012
Q3 Q4| Q1 Q22013
Q3 Q4| Q1
Employment Remunera tion per worker
-6.2% -2.2 (percentage points) 1.1% 9.4% 11.3% 2.6%
Production (seas. adj.) Employment Gross monthly remuneration per worker Exports (ZAR) Imports (ZAR)
Trend analysis: first half of 2014 compared to first half of 2013 (except: capacity utilisation and employment - Q2 2014 compared to Q2 2013)
Capacity utilisation
-6.2% -2.2 (percentage points) 1.1% 9.4% 11.3% 2.6%
Production (seas. adj.) Employment Gross monthly remuneration per worker Exports (ZAR) Imports (ZAR)
Trend analysis: first half of 2014 compared to first half of 2013 (except: capacity utilisation, employment and remuneration - Q2 2014 y-o-y)
Capacity utilisation
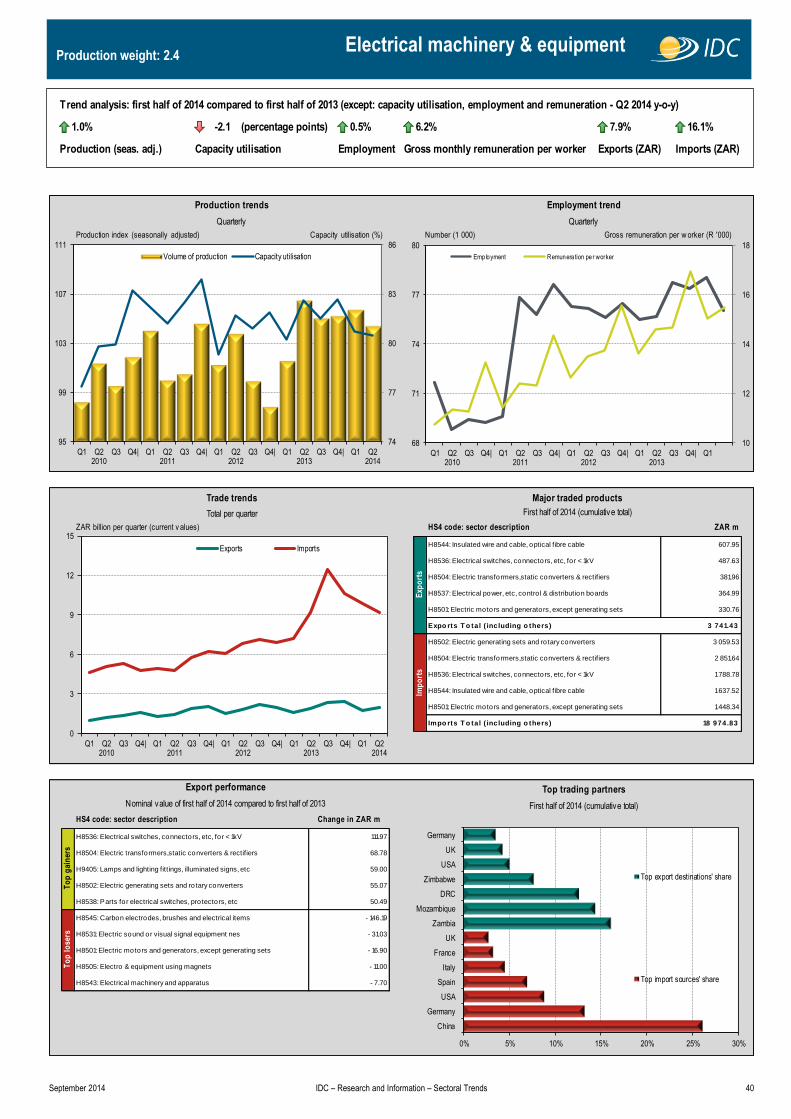
September 2014 IDC – Research and Information – Sectoral Trends 40
Production weight: 2.4 Electrical machinery & equipment
ZAR billion per quarter (current v alues) HS4 code: sector description ZAR m
H8544: Insulated wire and cable, optical fibre cable 607.95
H8536: Electrical switches, connectors, etc, for < 1kV 487.63
H8504: Electric transformers,static converters & rectifiers 381.96
H8537: Electrical power, etc, contro l & distribution boards 364.99
H8501: Electric motors and generators, except generating sets 330.76
Expo rts T o tal ( including o thers) 3 741.43
H8502: Electric generating sets and rotary converters 3 059.53
H8504: Electric transformers,static converters & rectifiers 2 851.64
H8536: Electrical switches, connectors, etc, for < 1kV 1 788.78
H8544: Insulated wire and cable, optical fibre cable 1 637.52
H8501: Electric motors and generators, except generating sets 1 448.34
Impo rts T o tal ( including o thers) 18 974.83
HS4 code: sector description Change in ZAR m
H8536: Electrical switches, connectors, etc, for < 1kV 111.97
H8504: Electric transformers,static converters & rectifiers 68.78
H9405: Lamps and lighting fittings, illuminated signs, etc 59.00
H8502: Electric generating sets and rotary converters 55.07
H8538: Parts for electrical switches, protectors, etc 50.49
H8545: Carbon electrodes, brushes and electrical items - 146.19
H8531: Electric sound or visual signal equipment nes - 31.03
H8501: Electric motors and generators, except generating sets - 16.90
H8505: Electro & equipment using magnets - 11.00
H8543: Electrical machinery and apparatus - 7.70
Export performance Top trading partners
Nominal value of first half of 2014 compared to first half of 2013 First half of 2014 (cumulative total)
To
p g
ain
ers
To
p l
ose
rs
Trade trends Major traded products
Total per quarter First half of 2014 (cumulative total)
Exp
ort
sIm
po
rts
Production trends Employment trend
Quarterly Quarterly
Number (1 000) Gross remuneration per w orker (R '000)Production index (seasonally adjusted) Capacity utilisation (%)
74
77
80
83
86
95
99
103
107
111
Q1 Q22010
Q3 Q4| Q1 Q22011
Q3 Q4| Q1 Q22012
Q3 Q4| Q1 Q22013
Q3 Q4| Q1 Q22014
Volume of production Capacity utilisation
0
3
6
9
12
15
Q1 Q22010
Q3 Q4| Q1 Q22011
Q3 Q4| Q1 Q22012
Q3 Q4| Q1 Q22013
Q3 Q4| Q1 Q22014
Exports Imports
0% 5% 10% 15% 20% 25% 30%
China
Germany
USA
Spain
Italy
France
UK
Zambia
Mozambique
DRC
Zimbabwe
USA
UK
Germany
Top export destinations' share
Top import sources' share
10
12
14
16
18
68
71
74
77
80
Q1 Q22010
Q3 Q4| Q1 Q22011
Q3 Q4| Q1 Q22012
Q3 Q4| Q1 Q22013
Q3 Q4| Q1
Employment Remunera tion per worker
1.0% -2.1 (percentage points) 0.5% 6.2% 7.9% 16.1%
Production (seas. adj.) Employment Gross monthly remuneration per worker Exports (ZAR) Imports (ZAR)
Trend analysis: first half of 2014 compared to first half of 2013 (except: capacity utilisation, employment and remuneration - Q2 2014 y-o-y)
Capacity utilisation
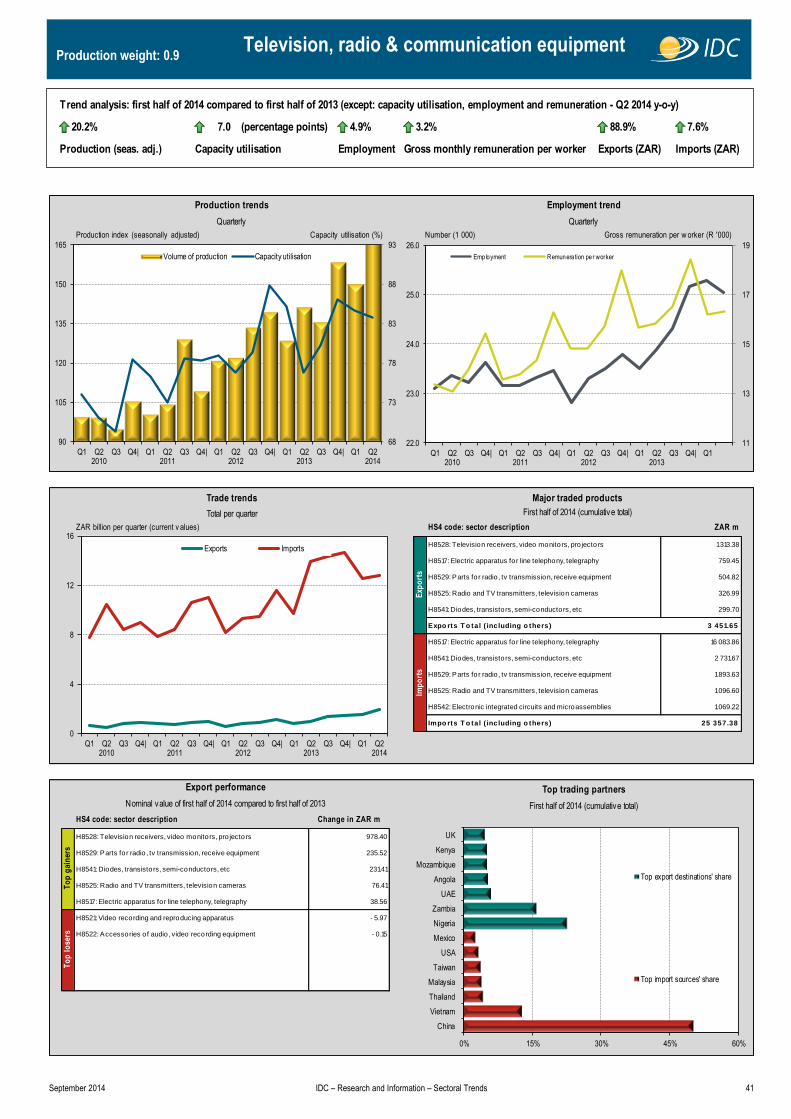
September 2014 IDC – Research and Information – Sectoral Trends 41
Production weight: 0.9 Television, radio & communication equipment
ZAR billion per quarter (current v alues) HS4 code: sector description ZAR m
H8528: Television receivers, video monitors, pro jectors 1 313.38
H8517: Electric apparatus for line telephony, telegraphy 759.45
H8529: Parts for radio, tv transmission, receive equipment 504.82
H8525: Radio and TV transmitters, television cameras 326.99
H8541: Diodes, transistors, semi-conductors, etc 299.70
Expo rts T o tal ( including o thers) 3 451.65
H8517: Electric apparatus for line telephony, telegraphy 16 083.86
H8541: Diodes, transistors, semi-conductors, etc 2 731.67
H8529: Parts for radio, tv transmission, receive equipment 1 893.63
H8525: Radio and TV transmitters, television cameras 1 096.60
H8542: Electronic integrated circuits and microassemblies 1 069.22
Impo rts T o tal ( including o thers) 25 357.38
HS4 code: sector description Change in ZAR m
H8528: Television receivers, video monitors, pro jectors 978.40
H8529: Parts for radio, tv transmission, receive equipment 235.52
H8541: Diodes, transistors, semi-conductors, etc 231.41
H8525: Radio and TV transmitters, television cameras 76.41
H8517: Electric apparatus for line telephony, telegraphy 38.56
H8521: Video recording and reproducing apparatus - 5.97
H8522: Accessories of audio, video recording equipment - 0.15
Export performance Top trading partners
Nominal value of first half of 2014 compared to first half of 2013 First half of 2014 (cumulative total)
To
p g
ain
ers
To
p l
ose
rs
Trade trends Major traded products
Total per quarter First half of 2014 (cumulative total)
Exp
ort
sIm
po
rts
Production trends Employment trend
Quarterly Quarterly
Number (1 000) Gross remuneration per w orker (R '000)Production index (seasonally adjusted) Capacity utilisation (%)
68
73
78
83
88
93
90
105
120
135
150
165
Q1 Q22010
Q3 Q4| Q1 Q22011
Q3 Q4| Q1 Q22012
Q3 Q4| Q1 Q22013
Q3 Q4| Q1 Q22014
Volume of production Capacity utilisation
0
4
8
12
16
Q1 Q22010
Q3 Q4| Q1 Q22011
Q3 Q4| Q1 Q22012
Q3 Q4| Q1 Q22013
Q3 Q4| Q1 Q22014
Exports Imports
0% 15% 30% 45% 60%
China
Vietnam
Thailand
Malaysia
Taiwan
USA
Mexico
Nigeria
Zambia
UAE
Angola
Mozambique
Kenya
UK
Top export destinations' share
Top import sources' share
11
13
15
17
19
22.0
23.0
24.0
25.0
26.0
Q1 Q22010
Q3 Q4| Q1 Q22011
Q3 Q4| Q1 Q22012
Q3 Q4| Q1 Q22013
Q3 Q4| Q1
Employment Remunera tion per worker
20.2% 7.0 (percentage points) 4.9% 3.2% 88.9% 7.6%
Production (seas. adj.) Employment Gross monthly remuneration per worker Exports (ZAR) Imports (ZAR)
Trend analysis: first half of 2014 compared to first half of 2013 (except: capacity utilisation, employment and remuneration - Q2 2014 y-o-y)
Capacity utilisation
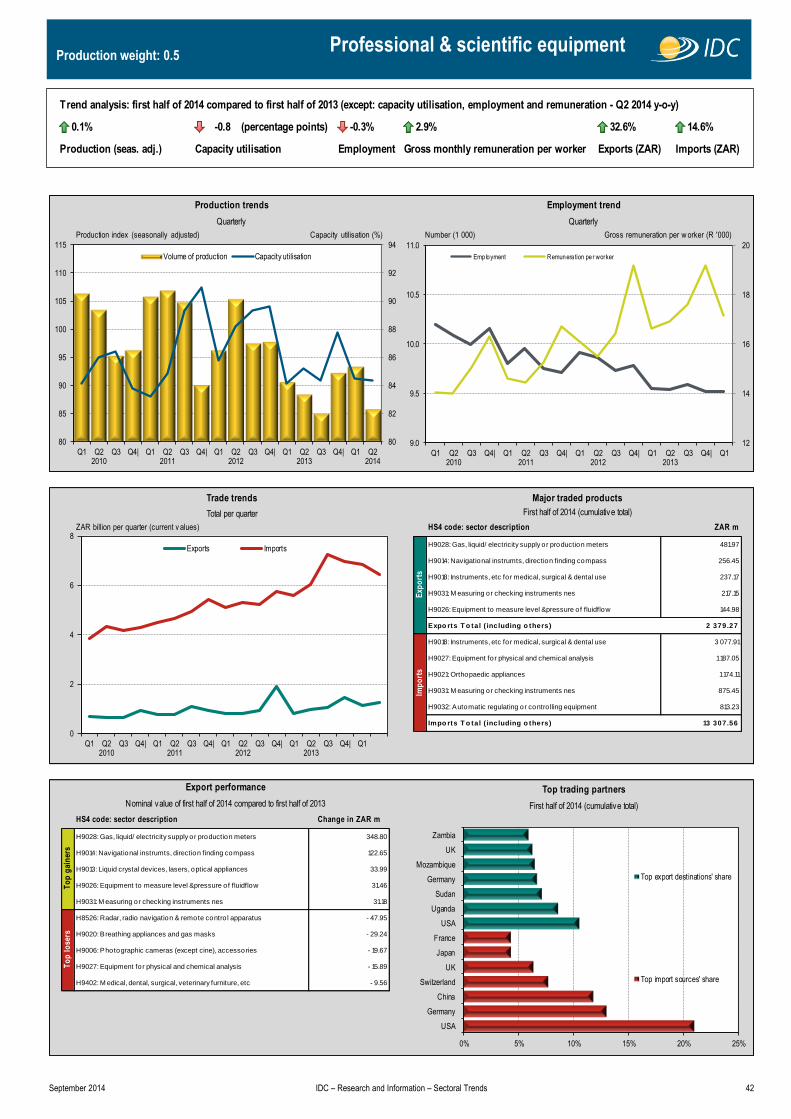
September 2014 IDC – Research and Information – Sectoral Trends 42
Production weight: 0.5 Professional & scientific equipment
ZAR billion per quarter (current v alues) HS4 code: sector description ZAR m
H9028: Gas, liquid/ electricity supply or production meters 481.97
H9014: Navigational instrumts, direction finding compass 256.45
H9018: Instruments, etc for medical, surgical & dental use 237.17
H9031: M easuring or checking instruments nes 217.15
H9026: Equipment to measure level &pressure of fluidflow 144.98
Expo rts T o tal ( including o thers) 2 379.27
H9018: Instruments, etc for medical, surgical & dental use 3 077.91
H9027: Equipment for physical and chemical analysis 1 187.05
H9021: Orthopaedic appliances 1 174.11
H9031: M easuring or checking instruments nes 875.45
H9032: Automatic regulating or contro lling equipment 813.23
Impo rts T o tal ( including o thers) 13 307.56
HS4 code: sector description Change in ZAR m
H9028: Gas, liquid/ electricity supply or production meters 348.80
H9014: Navigational instrumts, direction finding compass 122.65
H9013: Liquid crystal devices, lasers, optical appliances 33.99
H9026: Equipment to measure level &pressure of fluidflow 31.46
H9031: M easuring or checking instruments nes 31.18
H8526: Radar, radio navigation & remote contro l apparatus - 47.95
H9020: Breathing appliances and gas masks - 29.24
H9006: Photographic cameras (except cine), accessories - 19.67
H9027: Equipment for physical and chemical analysis - 15.89
H9402: M edical, dental, surgical, veterinary furniture, etc - 9.56
Export performance Top trading partners
Nominal value of first half of 2014 compared to first half of 2013 First half of 2014 (cumulative total)
To
p g
ain
ers
To
p l
ose
rs
Trade trends Major traded products
Total per quarter First half of 2014 (cumulative total)
Exp
ort
sIm
po
rts
Production trends Employment trend
Quarterly Quarterly
Number (1 000) Gross remuneration per w orker (R '000)Production index (seasonally adjusted) Capacity utilisation (%)
80
82
84
86
88
90
92
94
80
85
90
95
100
105
110
115
Q1 Q22010
Q3 Q4| Q1 Q22011
Q3 Q4| Q1 Q22012
Q3 Q4| Q1 Q22013
Q3 Q4| Q1 Q22014
Volume of production Capacity utilisation
0
2
4
6
8
Q1 Q22010
Q3 Q4| Q1 Q22011
Q3 Q4| Q1 Q22012
Q3 Q4| Q1 Q22013
Q3 Q4| Q1
Exports Imports
0% 5% 10% 15% 20% 25%
USA
Germany
China
Switzerland
UK
Japan
France
USA
Uganda
Sudan
Germany
Mozambique
UK
Zambia
Top export destinations' share
Top import sources' share
12
14
16
18
20
9.0
9.5
10.0
10.5
11.0
Q1 Q22010
Q3 Q4| Q1 Q22011
Q3 Q4| Q1 Q22012
Q3 Q4| Q1 Q22013
Q3 Q4| Q1
Employment Remunera tion per worker
0.1% -0.8 (percentage points) -0.3% 2.9% 32.6% 14.6%
Production (seas. adj.) Employment Gross monthly remuneration per worker Exports (ZAR) Imports (ZAR)
Trend analysis: first half of 2014 compared to first half of 2013 (except: capacity utilisation, employment and remuneration - Q2 2014 y-o-y)
Capacity utilisation

September 2014 IDC – Research and Information – Sectoral Trends 43
Production weight: 7.4 Motor vehicles, parts & accessories
ZAR billion per quarter (current v alues) HS4 code: sector description ZAR m
H8703: Vehicles for transport o f persons (except buses) 14 420.07
H8704: M otor vehicles for the transport o f goods 13 208.05
H8421: Liquid, gas centrifuges, filtering, purifying machine 9 972.97
H8708: Parts and accessories for motor vehicles 3 019.71
H8409: Parts for internal combustion spark ignition engine 1 319.98
Expo rts T o tal ( including o thers) 44 660.51
H9801: Original equipment components 32 712.23
H8703: Vehicles for transport o f persons (except buses) 25 978.43
H8708: Parts and accessories for motor vehicles 6 514.71
H8704: M otor vehicles for the transport o f goods 6 379.40
H8409: Parts for internal combustion spark ignition engine 1 277.67
Impo rts T o tal ( including o thers) 76 082.83
HS4 code: sector description Change in ZAR m
H8421: Liquid, gas centrifuges, filtering, purifying machine 1 522.51
H8704: M otor vehicles for the transport o f goods 732.82
H8408: Compression-ignition engines (diesel, etc) 313.21
H8705: Special purpose motor vehicles 158.69
H8609: Cargo containers designed for carriage of goods 121.45
H8703: Vehicles for transport o f persons (except buses) -2 245.47
H8708: Parts and accessories for motor vehicles - 633.39
H8707: Bodies (including cabs), for motor vehicles - 55.29
H9801: Original equipment components - 2.33
H8407: Spark-ignition internal combustion engines - 0.82
Export performance Top trading partners
Nominal value of first half of 2014 compared to first half of 2013 First half of 2014 (cumulative total)
To
p g
ain
ers
To
p l
ose
rs
Trade trends Major traded products
Total per quarter First half of 2014 (cumulative total)
Exp
ort
sIm
po
rts
Production trends Employment trend
Quarterly Quarterly
Number (1 000) Gross remuneration per w orker (R '000)Production index (seasonally adjusted) Capacity utilisation (%)
67
71
75
79
83
87
91
90
95
100
105
110
115
120
Q1 Q22010
Q3 Q4| Q1 Q22011
Q3 Q4| Q1 Q22012
Q3 Q4| Q1 Q22013
Q3 Q4| Q1 Q22014
Volume of production Capacity utilisation
10
20
30
40
50
Q1 Q22010
Q3 Q4| Q1 Q22011
Q3 Q4| Q1 Q22012
Q3 Q4| Q1 Q22013
Q3 Q4| Q1 Q22014
Exports Imports
0% 5% 10% 15% 20% 25% 30%
Germany
Japan
USA
Thailand
India
South Korea
UK
Germany
USA
UK
Belgium
Japan
Australia
Nigeria
Top export destinations' share
Top import sources' share
10
12
14
16
18
20
84
85
86
87
88
89
Q1 Q22010
Q3 Q4| Q1 Q22011
Q3 Q4| Q1 Q22012
Q3 Q4| Q1 Q22013
Q3 Q4| Q1
Employment Remunera tion per worker
0.1% -6.0 (percentage points) -2.3% 10.1% 0.0% 6.7%
Production (seas. adj.) Employment Gross monthly remuneration per worker Exports (ZAR) Imports (ZAR)
Trend analysis: first half of 2014 compared to first half of 2013 (except: capacity utilisation, employment and remuneration - Q2 2014 y-o-y)
Capacity utilisation

September 2014 IDC – Research and Information – Sectoral Trends 44
Production weight: 1.2 Other transport equipment
ZAR billion per quarter (current v alues) HS4 code: sector description ZAR m
H8803: Parts o f aircraft, spacecraft, etc 907.13
H8903: Yachts, pleasure, sports vessels, boats, canoes 581.37
H8606: Railway and tramway goods vans and wagons 238.83
H8802: A ircraft, spacecraft, satellites 232.81
H8607: Parts o f railway, tramway locomotives, etc 197.47
Expo rts T o tal ( including o thers) 2 942.64
H8802: A ircraft, spacecraft, satellites 3 374.99
H8803: Parts o f aircraft, spacecraft, etc 1 508.84
H8711: M otorcycles, bicycles, etc with auxiliary motor 704.95
H8607: Parts o f railway, tramway locomotives, etc 699.61
H8601: Rail locomotives, electrically powered 593.26
Impo rts T o tal ( including o thers) 8 430.23
HS4 code: sector description Change in ZAR m
H8803: Parts o f aircraft, spacecraft, etc 471.75
H8606: Railway and tramway goods vans and wagons 161.56
H8903: Yachts, pleasure, sports vessels, boats, canoes 120.72
H8805: A ircraft launching gear, flight simulators 35.93
H8407: Spark-ignition internal combustion engines 32.80
H8802: A ircraft, spacecraft, satellites - 160.32
H8602: Rail locomotives, diesel, steam, locomotive tenders - 90.89
H8605: Railway passenger and special purpose coaches - 58.17
H8905: Special purpose ships, vessels, nes - 25.85
H8607: Parts o f railway, tramway locomotives, etc - 23.00
Export performance Top trading partners
Nominal value of first half of 2014 compared to first half of 2013 First half of 2014 (cumulative total)
To
p g
ain
ers
To
p l
ose
rs
Trade trends Major traded products
Total per quarter First half of 2014 (cumulative total)
Exp
ort
sIm
po
rts
Production trends Employment trend
Quarterly Quarterly
Number (1 000) Gross remuneration per w orker (R '000)Production index (seasonally adjusted) Capacity utilisation (%)
72
75
78
81
84
80
95
110
125
140
Q1 Q22010
Q3 Q4| Q1 Q22011
Q3 Q4| Q1 Q22012
Q3 Q4| Q1 Q22013
Q3 Q4| Q1 Q22014
Volume of production Capacity utilisation
0
2
4
6
8
Q1 Q22010
Q3 Q4| Q1 Q22011
Q3 Q4| Q1 Q22012
Q3 Q4| Q1 Q22013
Q3 Q4| Q1 Q22014
Exports Imports
0% 10% 20% 30% 40% 50%
USA
China
France
UK
Germany
Belgium
Italy
Mozambique
USA
France
UK
Germany
Malta
Top export destinations' share
Top import sources' share
10
12
14
16
18
14
15
16
17
18
Q1 Q22010
Q3 Q4| Q1 Q22011
Q3 Q4| Q1 Q22012
Q3 Q4| Q1 Q22013
Q3 Q4| Q1
Employment Remunera tion per worker
-8.5% -7.1 (percentage points) 5.8% 6.3% 21.4% 36.2%
Production (seas. adj.) Employment Gross monthly remuneration per worker Exports (ZAR) Imports (ZAR)
Trend analysis: first half of 2014 compared to first half of 2013 (except: capacity utilisation, employment and remuneration - Q2 2014 y-o-y)
Capacity utilisation

September 2014 IDC – Research and Information – Sectoral Trends 45
Production weight: 1.1 Furniture
ZAR billion per quarter (current v alues) HS4 code: sector description ZAR m
H9401: Seats (except dentist, barber, etc chairs) 1 075.22
H9403: Other furniture and parts thereof 353.76
H9404: M attress supports, mattresses, bedding 33.70
0.00
0.00
Expo rts T o tal ( including o thers) 1 462.68
H9401: Seats (except dentist, barber, etc chairs) 1 351.42
H9403: Other furniture and parts thereof 982.42
H9404: M attress supports, mattresses, bedding 18.52
0.00
0.00
Impo rts T o tal ( including o thers) 2 352.36
HS4 code: sector description Change in ZAR m
H9403: Other furniture and parts thereof 88.43
H9401: Seats (except dentist, barber, etc chairs) 66.19
H9404: M attress supports, mattresses, bedding 5.55
Export performance Top trading partners
Nominal value of first half of 2014 compared to first half of 2013 First half of 2014 (cumulative total)
To
p g
ain
ers
To
p l
ose
rs
Trade trends Major traded products
Total per quarter First half of 2014 (cumulative total)
Exp
ort
sIm
po
rts
Production trends Employment trend
Quarterly Quarterly
Number (1 000) Gross remuneration per w orker (R '000)Production index (seasonally adjusted) Capacity utilisation (%)
77
81
85
89
93
97
85
90
95
100
105
110
Q1 Q22010
Q3 Q4| Q1 Q22011
Q3 Q4| Q1 Q22012
Q3 Q4| Q1 Q22013
Q3 Q4| Q1 Q22014
Volume of production Capacity utilisation
0.0
0.5
1.0
1.5
2.0
Q1 Q22010
Q3 Q4| Q1 Q22011
Q3 Q4| Q1 Q22012
Q3 Q4| Q1 Q22013
Q3 Q4| Q1 Q22014
Exports Imports
0% 10% 20% 30% 40% 50%
China
Germany
Thailand
Italy
Malaysia
Poland
UK
Germany
UK
Zambia
Bulgaria
Mozambique
Poland
Spain
Top export destinations' share
Top import sources' share
3
4
5
6
7
8
9
28
30
32
34
36
38
40
Q1 Q22010
Q3 Q4| Q1 Q22011
Q3 Q4| Q1 Q22012
Q3 Q4| Q1 Q22013
Q3 Q4| Q1
Employment Remunera tion per worker
-3.5% 3.9 (percentage points) -9.4% 11.2% 12.3% 2.8%
Production (seas. adj.) Employment Gross monthly remuneration per worker Exports (ZAR) Imports (ZAR)
Trend analysis: first half of 2014 compared to first half of 2013 (except: capacity utilisation, employment and remuneration - Q2 2014 y-o-y)
Capacity utilisation

September 2014 IDC – Research and Information – Sectoral Trends 46
Production weight: 3.0 Other manufacturing
ZAR billion per quarter (current v alues) HS4 code: sector description ZAR m
H7204: Ferrous waste or scrap, ingots or iron or steel 2 565.71
H7118: Coin 2 287.74
H7404: Copper, copper alloy, waste or scrap 1 707.80
H7112: Waste or scrap of precious metal 1 491.69
H2618: Granulated slag from iron & steel industry 1 485.00
Expo rts T o tal ( including o thers) 12 735.85
H9504: Articles for funfairs, table and parlour games 865.43
H9503: Other toys, scale models, puzzles, etc 727.88
H9506: Equipment for gymnastics, sports, outdoor games nes 622.05
H7113: Jewellery and parts, containing precious metal 298.10
H9603: Brooms, brushes, mops, feather dusters, etc 278.78
Impo rts T o tal ( including o thers) 5 683.88
HS4 code: sector description Change in ZAR m
H7204: Ferrous waste or scrap, ingots or iron or steel 220.36
H2619: Waste, scale, dross, slag of iron or steel industry 178.56
H3804: Residual lyes from the manufacture of wood pulp 175.76
H7112: Waste or scrap of precious metal 117.17
H7602: A luminium waste or scrap 51.75
H7118: Coin -1 875.69
H2618: Granulated slag from iron & steel industry - 547.71
H7404: Copper, copper alloy, waste or scrap - 417.10
H2402: Cigars, cigarettes etc, tobacco/tobacco substitute - 69.40
H9701: Hand made paintings, drawings, pastels, co llages - 43.90
Export performance Top trading partners
Nominal value of first half of 2014 compared to first half of 2013 First half of 2014 (cumulative total)
To
p g
ain
ers
To
p l
ose
rs
Trade trends Major traded products
Total per quarter First half of 2014 (cumulative total)
Exp
ort
sIm
po
rts
Production trends Employment trend
Quarterly Quarterly
Number (1 000) Gross remuneration per w orker (R '000)Production index (seasonally adjusted) Capacity utilisation (%)
72
75
78
81
84
87
90
93
90
95
100
105
110
115
120
125
Q1 Q22010
Q3 Q4| Q1 Q22011
Q3 Q4| Q1 Q22012
Q3 Q4| Q1 Q22013
Q3 Q4| Q1 Q22014
Production volume Capacity utilisation
0
2
4
6
8
10
Q1 Q22010
Q3 Q4| Q1 Q22011
Q3 Q4| Q1 Q22012
Q3 Q4| Q1 Q22013
Q3 Q4| Q1 Q22014
Exports Imports
0% 10% 20% 30% 40%
China
USA
Italy
Germany
Mozambique
UK
India
India
Germany
USA
China
South Korea
Hong Kong
Belgium
Top export destinations' share
Top import sources' share
8
10
12
14
16
18
40
42
44
46
48
50
Q1 Q22010
Q3 Q4| Q1 Q22011
Q3 Q4| Q1 Q22012
Q3 Q4| Q1 Q22013
Q3 Q4| Q1
Employment Remunera tion per worker
7.3% -1.7 (percentage points) -0.5% -1.0% -14.1% 14.7%
Production (seas. adj.) Employment Gross monthly remuneration per worker Exports (ZAR) Imports (ZAR)
Trend analysis: first half of 2014 compared to first half of 2013 (except: capacity utilisation, employment and remuneration - Q2 2014 y-o-y)
Capacity utilisation
September 2014 IDC – Research and Information – Sectoral Trends 47
Acronyms, notes and data sources
Acronyms
BLNS Botswana, Lesotho, Namibia and Swaziland.
COMESA Common Market for Eastern & Southern Africa members are: Burundi, Comoros, DRC, Djibouti, Egypt, Eritrea,
Ethiopia, Kenya, Libya, Madagascar, Malawi, Mauritius, Rwanda, Seychelles, Sudan, Swaziland, Uganda, Zambia &
Zimbabwe.
DRC Democratic Republic of Congo.
EU European Union member states are: Austria, Belgium, Cyprus, Czech Republic, Germany, Denmark, Estonia, Spain,
Finland, France, United Kingdom, Bulgaria, Greece, Hungary, Ireland, Italy, Lithuania, Luxembourg, Latvia, Malta, The
Netherlands, Poland, Portugal, Romania, Sweden, Slovenia and Slovakia.
GDP Gross domestic product.
HS Codes Harmonized system codes.
Middle East The countries in the Middle East grouping are: Bahrain, Iran (Islamic Republic of), Iraq, Israel, Jordan, Kuwait, Lebanon,
Oman, Qatar, Saudi Arabia, Syrian Arab Republic, Turkey, United Arab Emirates and Yemen
NAFTA North American Free Trade Agreement members are: Canada, Mexico and the United States of America.
n.e.s. Not elsewhere specified.
PGM Platinum group metals.
ZAR or R South African rand.
SA Republic of South Africa.
SACU Southern African Customs Union members are: Botswana, Lesotho, Namibia, South Africa and Swaziland.
SADC Southern African Development Community members are: Angola, Botswana, Democratic Republic of Congo, Lesotho,
Madagascar, Malawi, Mauritius, Mozambique, Namibia, Seychelles, South Africa, Swaziland, United Republic of Tanzania,
Zambia and Zimbabwe.
UK United Kingdom.
USA or US United States of America.
USD United States dollar.
y-o-y Year-on-year growth rate.
q-o-q Quarter-on-quarter growth rate.
Notes
All volume of production data (value add data in the case of the agriculture, forestry and fishing sector) is seasonally adjusted. All other data
is not seasonally adjusted.
All trade data and related information exclude South Africa’s trade with Botswana, Lesotho, Namibia and Swaziland (BLNS). Discrepancies
may arise between preliminary trade data released by SARS and the Quantec data utilised in this report due to historical revisions.
The methodology utilised by StatsSA and DMR in relation to remuneration data differs in that the DMR includes all income derived due to
employment, such as severance, retrenchment and termination payments as well as income derived from employee share schemes.
Therefore direct comparisons between remuneration per worker in the mining and manufacturing sectors reported in this document should
be done with great care.
Data sources
Quantec Research based on South African Revenue Services (SARS): South African trade data.
Statistics South Africa (Stats SA): South African employment, production and capacity utilization data.
Department of Mineral Resources: South African employment and remuneration data for the mining sector and sub-sectors.
Compiled by:
The Department of Research and Information
Industrial Development Corporation of South Africa Limited
PO Box 784055, Sandton, 2146, Gauteng, South Africa
For further assistance or information contact:
The Department of Research and Information
Tel: +27 11 269 3454 (Dianne Rymer)
Email: [email protected]
IDC Head Office:
19 Fredman Drive, Sandown, 2196
PO Box 784055, Sandton, 2146, South Africa
Tel: +27 11 269 3000
Fax: +27 11 269 3116
Call Centre: 0860 693 888
Email: [email protected]
Website: www.idc.co.za
Although every care is taken to ensure the accuracy of this publication, supplements, updates and replacement material; the authors, editors, publishers and printers do not accept responsibility for any act, omission, loss or damage or the consequences thereof, occasioned by a reliance by any person upon the contents hereof.


