Bulletin of the Marine Geology, Vol. 32, No. 2, December 2017, pp. 67 to 76 67 Sediment Characteristics of Mergui Basin, Andaman Sea based on Multi- proxy Analyses Karakteristik Sedimen Cekungan Mergui, Laut Andaman berdasarkan Analisis Multi-proksi Rina Zuraida 1 , Rainer A. Troa 2 , Marfasran Hendrizan 3 , Luli Gustiantini 1 , and Eko Triarso 2 1 Marine Geological Institute of Indonesia, Jl. Dr. Junjunan No. 236 Bandung, Telp: (022) 6032020, Fax: (022) 6017887 2 Marine Research Center (MRC), ARHRMF, Ministry of Marine Affairs and Fisheries 3 Research Center for Geotechnology, LIPI, Bandung Corresponding author : [email protected](Received 30 October 2017; in revised from 01 November 2017; accepted 07 February 2018) ABSTRACT: This paper presents the characteristics of sediment from core BS-36 (6°55.85’ S and 96°7.48’ E, 1147.1 m water depth) that was acquired in the Mergui Basin, Andaman Sea. The analyses involved megascopic description, core scanning by multi-sensor core logger, and carbonate content measurement. The purpose of this study is to determine the physical and chemical characteristics of sediment to infer the depositional environment. The results show that this core can be divided into 5 lithologic units that represent various environmental conditions. The sedimentation of the bottom part, Units V and IV were inferred to be deposited in suboxic to anoxic bottom condition combined with high productivity and low precipitation. Unit III was deposited during high precipitation and oxic condition due to ocean ventilation. In the upper part, Units II and I occurred during higher precipitation, higher carbonate production and suboxic to anoxic condition. Keywords: sediment characteristics, Mergui Basin, Andaman Sea, suboxic, anoxic, oxic, carbonate content ABSTRAK: Makalah ini menyajikan karakteristik sedimen contoh inti BS-36 (6°55,85’ LS dan 96°7,48’ BT, kedalaman 1147,1 m) yang diambil di Cekungan Mergui, Laut Andaman. Metode analisis meliputi pemerian megaskopis contoh inti, pemindaian contoh inti dengan menggunakan multi-sensor core logger, dan pengukuran kandungan karbonat. Tujuan penelitian adalah untuk mengetahui karakteristik fisik dan kimiawi sedimen untuk menafsirkan kondisi lingkungan pengendapan. Hasil penelitian menunjukkan bahwa contoh inti ini dapat dibagi menjadi 5 unit litologi yang mewakili kondisi lingkungan yang berbeda. Pada bagian bawah sedimen, Unit V dan IV ditafsirkan sebagai hasil endapan pada kondisi suboksik hingga anoksik pada saat produktivitas tinggi dan curah hujan rendah. Unit III diendapkan pada saat curah hujan tinggi dan kondisi oksik yang diperkirakan berkaitan dengan ventilasi samudera. Pada bagian atas, Unit II dan I diendapkan pada saat curah hujan cukup tinggi dengan produksi karbonat yang cukup besar dan kondisi dasar laut suboksik hingga anoksik. Kata kunci: karakteristik sedimen, Cekungan Mergui, Laut Andaman, suboksik, anoksik, oksik, kandungan karbonat INTRODUCTION Marine sediment is an accumulation of detrital, biogenic, and authigenic particles that are deposited at the seafloor. Detrital particles are mostly derived from continental or terrestrial weathering (Millot, 1970) which reflect their source rocks (Hemming et al., 2007). Biogenic particles that are found in marine sediments are mostly carbonate tests of microorganism such as foraminifera (Hansen, 1999 in Gupta, 1999; Rahman and Oomori, 2008) or siliceous shells radiolaria (Anderson, 1983). Changes in the environment would be reflected in microorganism assemblages, particularly foraminifera. Thus foraminiferal assemblage could be used to reconstruct enviromental condition as have been reported by e.g. Spooner et al. (2005) from Banda Sea, and Gustiantini et al. (2015) from Halmahera Sea. Authigenic particles are in situ precipitates which formation are influenced by environmetal condition (Boles, 2014). Therefore, authigenic particle could be used to detect environmental condition during deposition, such as the level of sea bottom oxygenation (Kraal et al., 2012).
Transcript
Bulletin of the Marine Geology, Vol. 32, No. 2, December 2017, pp. 67 to 76
67
Sediment Characteristics of Mergui Basin, Andaman Sea based on Multi-proxy Analyses
Karakteristik Sedimen Cekungan Mergui, Laut Andaman berdasarkan Analisis Multi-proksi
Rina Zuraida1, Rainer A. Troa2, Marfasran Hendrizan3, Luli Gustiantini1, and Eko Triarso2
1 Marine Geological Institute of Indonesia, Jl. Dr. Junjunan No. 236 Bandung, Telp: (022) 6032020, Fax: (022) 60178872 Marine Research Center (MRC), ARHRMF, Ministry of Marine Affairs and Fisheries 3 Research Center for Geotechnology, LIPI, Bandung
(Received 30 October 2017; in revised from 01 November 2017; accepted 07 February 2018)
ABSTRACT: This paper presents the characteristics of sediment from core BS-36 (6°55.85’ S and 96°7.48’E, 1147.1 m water depth) that was acquired in the Mergui Basin, Andaman Sea. The analyses involvedmegascopic description, core scanning by multi-sensor core logger, and carbonate content measurement.The purpose of this study is to determine the physical and chemical characteristics of sediment to infer thedepositional environment. The results show that this core can be divided into 5 lithologic units thatrepresent various environmental conditions. The sedimentation of the bottom part, Units V and IV wereinferred to be deposited in suboxic to anoxic bottom condition combined with high productivity and lowprecipitation. Unit III was deposited during high precipitation and oxic condition due to ocean ventilation.In the upper part, Units II and I occurred during higher precipitation, higher carbonate production andsuboxic to anoxic condition.
ABSTRAK : Makalah ini menyajikan karakteristik sedimen contoh inti BS-36 (6°55,85’ LS dan 96°7,48’ BT,kedalaman 1147,1 m) yang diambil di Cekungan Mergui, Laut Andaman. Metode analisis meliputi pemerianmegaskopis contoh inti, pemindaian contoh inti dengan menggunakan multi-sensor core logger, dan pengukurankandungan karbonat. Tujuan penelitian adalah untuk mengetahui karakteristik fisik dan kimiawi sedimen untukmenafsirkan kondisi lingkungan pengendapan. Hasil penelitian menunjukkan bahwa contoh inti ini dapat dibagimenjadi 5 unit litologi yang mewakili kondisi lingkungan yang berbeda. Pada bagian bawah sedimen, Unit V dan IVditafsirkan sebagai hasil endapan pada kondisi suboksik hingga anoksik pada saat produktivitas tinggi dan curahhujan rendah. Unit III diendapkan pada saat curah hujan tinggi dan kondisi oksik yang diperkirakan berkaitandengan ventilasi samudera. Pada bagian atas, Unit II dan I diendapkan pada saat curah hujan cukup tinggi denganproduksi karbonat yang cukup besar dan kondisi dasar laut suboksik hingga anoksik.
Kata kunci: karakteristik sedimen, Cekungan Mergui, Laut Andaman, suboksik, anoksik, oksik, kandungankarbonat
INTRODUCTIONMarine sediment is an accumulation of detrital,
biogenic, and authigenic particles that are deposited atthe seafloor. Detrital particles are mostly derived fromcontinental or terrestrial weathering (Millot, 1970)which reflect their source rocks (Hemming et al., 2007).Biogenic particles that are found in marine sedimentsare mostly carbonate tests of microorganism such asforaminifera (Hansen, 1999 in Gupta, 1999; Rahmanand Oomori, 2008) or siliceous shells radiolaria(Anderson, 1983). Changes in the environment would
be reflected in microorganism assemblages,particularly foraminifera. Thus foraminiferalassemblage could be used to reconstruct enviromentalcondition as have been reported by e.g. Spooner et al.(2005) from Banda Sea, and Gustiantini et al. (2015)from Halmahera Sea. Authigenic particles are in situprecipitates which formation are influenced byenvironmetal condition (Boles, 2014). Therefore,authigenic particle could be used to detectenvironmental condition during deposition, such as thelevel of sea bottom oxygenation (Kraal et al., 2012).
68 Rina Zuraida et al.
Andaman Sea that is located to the north ofSumatra connects Malacca Strait to the Indian Ocean.Andaman Sea is bounded on the west by Thailand andMyanmar and to the northwest by Indian subcontinent.Previous study from this region showed that AndamanSea is strongly influenced by Indian Ocean Monsoon(Rashid et al., 2007) as well as shifting of the locus ofAsian summer monsoon (Awasthi et al., 2014). To date,most of published studies have been concentrated in theeastern part of Andaman Basin (Figure 1), while scarcedata comes from Mergui Basin that is located in thesouthern part of Andaman Sea. This study provides newdata on physical and chemical characteristics of thestudy area (Figure 1). Our finding is the first steptowards understanding environmental changes in thisregion.
Geology and Oceanography of Andaman Sea
Andaman Sea is separated from the Indian Oceanby Andaman-Nicobar island arcs. The bathymetry ofAndaman Sea ranges between 200 and 2500 m and thedeepest bathymetry is located in the central part of EastAndaman Basin (Figure 1, right). The southeast part ofAndaman Sea is occupied by Mergui Basin thatconnects the Sea to Sunda Shelf. Mergui Basin ischaracterized by gentle slope to the east and north andsteep slope to the south (maximum slope is 83°) and
eastward-bearing channel that connect Mergui Basinwith Andaman Basin (Figure 1, right). The water depthof Mergui Basin ranges between 400 and 1700 m andthe maximum depth is located at the edge of AndamanBasin (Troa et al., 2014).
Mergui Basin is formed by post-Oligocene normalfault with annual subsidence rate of 0.25 mm/year. Thatrate of subsidence allows sediment supply frommainland Asia, Sumatra and Sunda Shelf to bedeposited in the basin (Lin et al., 2010). One of thefactor that controls sediment supply to Sunda Shelf isthe vast topographical difference between mainlandAsia and Indonesia archipelago (Hall and Morley,2004). In addition to terrigenous fragments fromsurrounding lands, marine sediment of Mergui Basin isalso composed of biogenic particles such asforaminifera, pteropod and radiolaria (Tripathi, 2014).
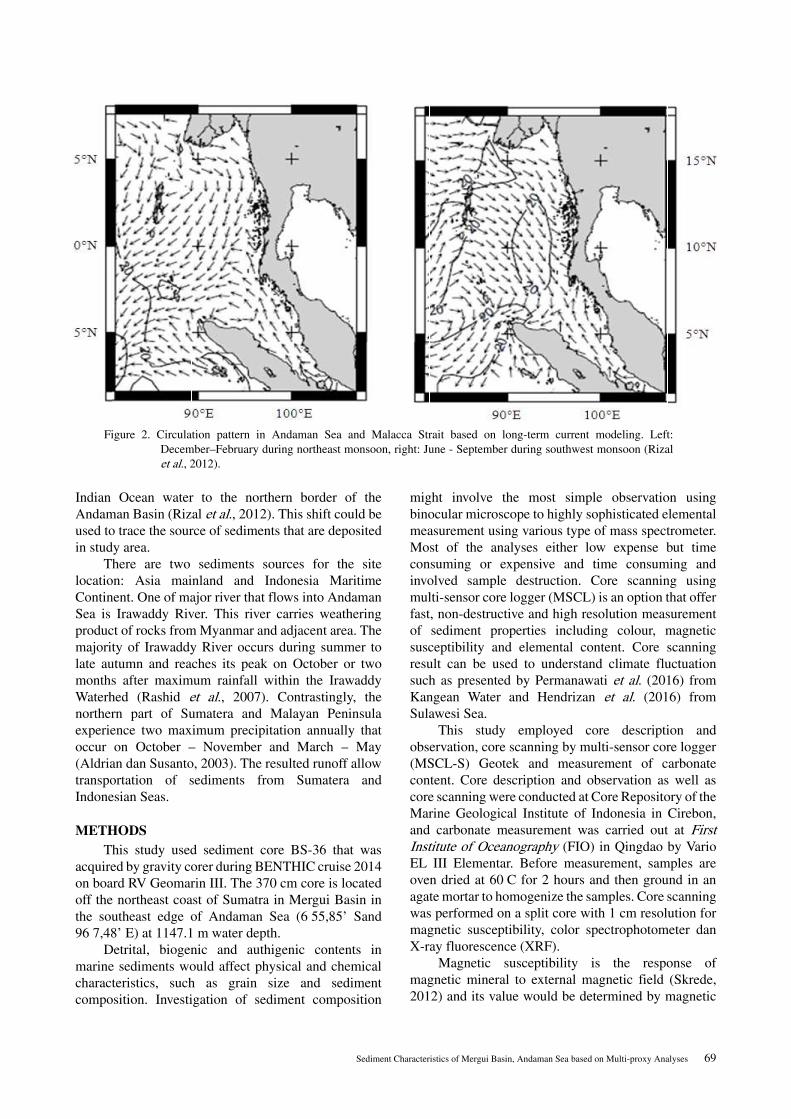
Oceanography modelling in Malacca Strait andAndaman Sea on long-term data shows slight differentin current that flows in the study area during Northeast(NE) Monsoon and Southwest (SW) Monsoon (Rizal etal., 2012). Even though the general current directiononly shows slight seasonal changes, a counter-current isobserved flowing to the southeast during NE Monsoon(Figure 2). The general circulation pattern indicatesshifting of ocean front from Malacca Strait withstrongest flow during NE Monsoon that pushes the
Figure 1. Left: location of Core BS-36 that was acquired near the edge of Mergui Basin (red star). Map source:Andreason et al. (1997 in Razali, 2011). Right: bathymetry surrounding Core BS-36 (Troa et al., 2014).
Sediment Characteristics of Mergui Basin, Andaman Sea based on Multi-proxy Analyses 69
Indian Ocean water to the northern border of theAndaman Basin (Rizal et al., 2012). This shift could beused to trace the source of sediments that are depositedin study area.
There are two sediments sources for the sitelocation: Asia mainland and Indonesia MaritimeContinent. One of major river that flows into AndamanSea is Irawaddy River. This river carries weatheringproduct of rocks from Myanmar and adjacent area. Themajority of Irawaddy River occurs during summer tolate autumn and reaches its peak on October or twomonths after maximum rainfall within the IrawaddyWaterhed (Rashid et al., 2007). Contrastingly, thenorthern part of Sumatera and Malayan Peninsulaexperience two maximum precipitation annually thatoccur on October – November and March – May(Aldrian dan Susanto, 2003). The resulted runoff allowtransportation of sediments from Sumatera andIndonesian Seas.
METHODSThis study used sediment core BS-36 that was
acquired by gravity corer during BENTHIC cruise 2014on board RV Geomarin III. The 370 cm core is locatedoff the northeast coast of Sumatra in Mergui Basin inthe southeast edge of Andaman Sea (6°55,85Ê Sand96°7,48Ê E) at 1147.1 m water depth.
Detrital, biogenic and authigenic contents inmarine sediments would affect physical and chemicalcharacteristics, such as grain size and sedimentcomposition. Investigation of sediment composition
might involve the most simple observation usingbinocular microscope to highly sophisticated elementalmeasurement using various type of mass spectrometer.Most of the analyses either low expense but timeconsuming or expensive and time consuming andinvolved sample destruction. Core scanning usingmulti-sensor core logger (MSCL) is an option that offerfast, non-destructive and high resolution measurementof sediment properties including colour, magneticsusceptibility and elemental content. Core scanningresult can be used to understand climate fluctuationsuch as presented by Permanawati et al. (2016) fromKangean Water and Hendrizan et al. (2016) fromSulawesi Sea.
This study employed core description andobservation, core scanning by multi-sensor core logger(MSCL-S) Geotek and measurement of carbonatecontent. Core description and observation as well ascore scanning were conducted at Core Repository of theMarine Geological Institute of Indonesia in Cirebon,and carbonate measurement was carried out at FirstInstitute of Oceanography (FIO) in Qingdao by VarioEL III Elementar. Before measurement, samples areoven dried at 60°C for 2 hours and then ground in anagate mortar to homogenize the samples. Core scanningwas performed on a split core with 1 cm resolution formagnetic susceptibility, color spectrophotometer danX-ray fluorescence (XRF).
Magnetic susceptibility is the response ofmagnetic mineral to external magnetic field (Skrede,2012) and its value would be determined by magnetic
Figure 2. Circulation pattern in Andaman Sea and Malacca Strait based on long-term current modeling. Left:December–February during northeast monsoon, right: June - September during southwest monsoon (Rizalet al., 2012).
70 Rina Zuraida et al.
mineral content (Nielsen and Rasmussen, 2002).Magnetic susceptibility has been applied inpaleoceanography and paleoclimate studies to correlatesedimentary sequence, determine sediment condition(missing or disturb layer), and reconstruct past climateand oceanography conditions (Verosub and Roberts,1995; Hounslow and Maher, 1999 in Larrasoana et al.,2008). Magnetic susceptibility measurement isconducted by point sensor Bartington MS2E.
Colour spectrophotometry is a sensor withinMSCL-S system that quantify the color of visible lightspectrum. The measurements are reported as light anddark, red and green and yellow and blue that composeCIE L* a* b* classification (Fairchild, 2005). Sedimentcolor reflects its composition and it has been employedto estimate sediment and mineralogy composition(Balsam and Damuth, 2000). An example of theapplication of sediment color in estimating elementalcomposition is the ratio of 700/400 that reflects Fecontent (Wei et al., 2014). This study used Konica-Minolta CM2600d colour spectrophotometer.
X-ray fluorescence (XRF) spectrometry is non-destructive method to measure elemental content ofsediments. The data could be used to understandpaleoenvironmental changes in Japan Sea (Yao et al.,2012), identify past climate in Africa (Itambi et al.,2009) and changes in marine productivity in Chile(Rebolledo et al., 2008). The XRF spectrometeremployed in this study is XRF Olympus Delta X. Dataanalysis involves calculating correlation coefficient,and principle component analysis (PCA) to determinethe main factors affecting the sediments. Correlatoncoefficient and PCA were calculated by PAST(Hammer et al., 2001).
RESULTS
Lithology
Core BS-36 is composed mostly of clay and siltwith a layer of foraminiferal sand near the bottom. Thecolor shows lightening upward trend while 700/400ratio shows rapid increase at 270 cm. L* valuesfluctuates around 35 from 370-270 cm before increaseabruptly to reach 41 and fluctuates around 38 to the top.The ratio of 700/400 spectrum shows increase from 1.4to 2.1 from 370-50 cm before it drops abruptly to 1.7and then increase upward to 2.1 to the upper part.Overall, based on lithology, L* and 700/400 ratio, coreBS-36 can be divided into five units. Detaileddescription of each unit from bottom to top is as follows(Figure 3):• Unit V
Unit V is characterized by gray (5Y 3/1)foraminifera-bearing clay and L* value show
similar pattern to 700/400 ratio. The values of L*fluctuate between 30.4 and 35, while the range of700/400 values is 1.3 – 1.6. This unit composes thelower part of core BS-36 and found between 351 -371 cm.
• Unit IV
Unit IV is formed by gray (5Y4/3) sand thatcontains abundant foraminifera with L* valuesfollow 700/400 ratio. L* values fluctuate between32.7 and 38.1, while the range of 700/400 values is1.5 – 1.8. Unit IV is found between 332 and 350cm.
• Unit III
Unit III is characterized by gray (5Y3/1and 5Y4/3)clay that consists of foraminifera and exhibitsinverse relationship between L* and 700/400 ratio.The range of L* values is 32.5 - 42.7, while 700/400 values fluctuate between 1.5 and 1.9. Unit IIIcan be divided into 2 sub-units, sub-unit A thatcomprises of clay with high L* value and low 700/400 ratio and sub-unit B that shows opposingcharacteristics to sub-unit A. This unit is foundbetween 86 and 325 cm.
• Unit II
Unit II is found between 51 and 85 cm and itcomposed of gray (5Y 3/1) clay comprisesforaminifera and pteropods. L* values show linearrelationship with 700/400 ratio with L* valuesrange between 35.7 and 40.6 while 700/400 valuesfluctuate between 1.6 and 2.0.
• Unit I
Unit I form the top 50 cm of core BS-36 and it isdominated by silt. This unit has inverserelationship between L* and 700/400 ratio, withL* values range between 34.3 and 42.4 while 700/400 values range between 1.7 and 2,2. Coreobservation reveals color fluctuation between 5Y4/3 and 5Y 3/2 that supports variation of measuredL* values.
XRF Analysis and Carbonate Measurement
The result of XRF scanning is reported in parts permillion or ppm. To avoid matrix effects, elementalcontent is presented as natural logarithmic (ln) ratio ofsaid element to a major element following Weltje andTjallingii (2008). Two ratios that have been used inunderstanding depositional environment are ln (Ti/Ca)and ln (Mn/Cl). The ln (Ti/Ca) was used by Fraser et al.(2014) as an indicator of precipitation, while ln (Mn/Cl)was interpreted as related to paleoredox condition byYao et al. (2012).
To understand the relationship between elements,carbonate, and color, we calculate their correlation
Sediment Characteristics of Mergui Basin, Andaman Sea based on Multi-proxy Analyses 71
�
Figu
re 3
. Lith
olog
ic u
nit o
f C
ore
BS-
36 a
nd it
s ph
ysic
al c
hara
cter
istic
s re
pres
ente
d by
700
/400
rat
io a
nd li
ghtn
ess
(L*)
.
72 Rina Zuraida et al.
coefficient (Table 1). Chlor shows relativey highcorrelation with L* and b* (>0.6) that suggest the effectof pore water content, indicated by Cl, to sediment color(Yao et al., 2012). A strong correlation is shown by Tiand Mn (0.8) that indicates possible terrigenous sourceof Mn, even though Mn precipitation in most seafloor isinfluenced by oxygene content (Yao et al., 2012). Thisinterpretation is supported by negative correlationbetween Ti and Mn to carbonate content (Table 1). Arelatively strong negative correlation is exhibited by ln(Mn/Cl) and carbonates that might be related to theeffect of redox condition to carbonate shell preservation(Cranston and Buckley, 1990).
Combination of ln (Ti/Ca) and ln (Mn/Cl) tocarbonate content and b* value to lithology unit revealsthat each lithology unit of core BS-36 has distinctcharacteristic (Figure 4). In general, ln (Ti/Ca) showsdecreasing upward trend with three maxima at 325-310,160-150 cm and 60-40 cm, while b* exhibit increasingupward trend. An inverse pattern is shown by ln (Mn/Cl) and carbonate content.
Unit V is signified by decreasing upward ln (Ti/Ca) and b*, while ln (Mn/Cl) relatively stable andcarbonate content slightly increase. The range of valuesfor ln (Ti/Ca), b*, ln (Mn/Cl) and carbonate are: -4.5 to-3.7; 4.2 to 5.9; -7.5 to -6.9; and 19.7 to 32.9.
Table 1. Correlation coefficient between physical and chemical properties of marine sediments from Andaman Sea.
Figure 4. Correlation between lithology and physical properties measured by MSCL and carbonate content.
Sediment Characteristics of Mergui Basin, Andaman Sea based on Multi-proxy Analyses 73
Unit IV is characterised by sharp increase of ln (Ti/Ca), b*, ln (Mn/Cl) and carbonate content. The range ofvalues for ln (Ti/Ca), b*, ln (Mn/Cl) and carbonate are:-4.6 to -3.4; 5.8 to 8.6; -7.7 to -7.1; and 34 to 44.9.Carbonate content in Unit IV reaches its first peak thatis only slightly lower than the second peak that isobserved in the upper part (Unit I).
Unit III demonstrate fluctuations of ln (Ti/Ca), b*,ln (Mn/Cl), and carbonate content with an overall trendof decreasing upward. The values of ln (Ti/Ca) rangebetween -4.3 and -3.2, b* range between 6.1 and 9, ln(Mn/Cl) range between -7 and -6.6, and carbonatecontent range between 18.6 and 33. The maximumvalue of ln (Ti/Ca) occurs at 160-150 cm concurrentwith minimum value of ln (Mn/Cl). An interestingfeature of this unit is the similarities of b* fluctuation to700/400 (Figure 3) that indicate the importance ofredox condition to Fe content.
Unit II is indicated by increasing ln (Ti/Ca), b* andcarbonate content, with values range between -4.4 and -3.3, 6.8 and 10.5, 31.5 and 41.2, respectively.Contrasting trend is shown by ln (Mn/Cl) that isdecreasing upward with values range between -7.7 and-6.9.
Unit I is characterised by decreasing values of ln(Ti/Ca) and increasing values of ln (Mn/Cl), 04.7 to -3.2and -8.1 to -7.2 respectively. The values of b* rangebetween 7.6 and 11.1, while carbonate content rangebetween 21.9 and 47.6.
DISCUSSIONL* value has been applied as indicator of
carbonate content in the Gulf of Cadiz sediment byRogerson et al. (2006). However, carbonate content ofBS-36 show similar trend to b* instead of L* (Figures 3and 4) with higher correlation coefficient to b* than toL* (Table 1). This discrepancy points to the effect ofredox condition to shell preservation in marinesediment as was considered in previous section.
Beside carbonate content, light colored sedimentsmight reflect high content of Si, Sr and Zr as wasobserved by Sprenk et al. (2014) in Weddell Sea. Thesource of silica in Andaman Sea sediments areconsidered to be the granite belt of Malaya Peninsulaand volcanic rocks of northern Sumatra (Crow andBarber, 2005) or Andaman islands (Awasthi, 2012 andAwasthi et al., 2010). Surface circulation pattern in thestudy area shows north- and northeastward flows fromthe south to core location (Rizal et al., 2012) that madetransport of silica from Malay Peninsula or Andamanislands to core BS-36 location negligible.
Better correlation of carbonate content to b* thanL* in core BS-36 along with possible negligible silicainput suggests that redox plays an important role indetermining carbonate content in this location. Further
study on foraminiferal assemblage should take thiscondition into account.
Another factor that influence carbonate content isproductivity that is affected by terrigenous input.Sediment transport from the land to the sea in thisregion is mostly dominated by runoff, particularly riverrunoff that is influenced by precipitation on land.Carbonate content of core BS-36 shows inverse trend toln (Ti/Ca), an indicator of precipitation, from Unit V toUnit II but similar trend in Unit I. Contrastingly,carbonate content of Unit V and I shows similar trend toln (Mn/Cl) but reverse trend for Units II to IV. Thiscondition suggests change in predominant factor thatinfluences carbonate content.
Fluctuations of Environmental Condition during Deposition
Multi-proxy analyses on Core BS-36 reveal fivedistinct environmental conditions. Changes indepositional environments in study area consist ofvariation of bottom oxygenation (anoxic – oxic),precipitation and productivity rate. The discussion ofthese changes are described from bottom (Unit V) to top(Unit I) of the core to reflect sedimentary sequences.
Units V and IV show darker sediment color, low ln(Ti/Ca) and high carbonate content (Figs. 3 and 4). Thischaracteristics might be related to low precipitationwith high productivity that resulted in high carbonateproducing organisms. The darker sediment color isinferred to reflect higher Fe content followingGuimaraes et al. (2013) that might be deposited insuboxic to anoxic condition signified by low ln (Mn/Cl)value that according to Yao et al. (2012) indicatespaleoredox condition.
Unit III is interpreted to be deposited duringrelatively high precipitation (ln Ti/Ca) that providedadequate runoff to carry Si-rich terrigenous materialfrom Malay Peninsula to core location. The transport ofSi-rich terrigenous material from Malay Peninsula intocore location might happen during NE Monsoon whenwatermass from Malacca Strait pushes the IndianOcean water into the northern border of the AndamanSea as presented by Rizal et al. (2012). The presence ofSi-rich sediments in core BS-36 implies weakening ofIndian Monsoon during the sedimentation of unit III.The weakening of Indian Monsoon reaches its minimain the end of unit III deposition. This unit is interpretedas deposited in oxic condition that might be the result ofbetter ocean ventilation producing bottom oxygenation.
Rapid increase of precipitation might occur duringthe deposition of the lower part of Unit II and reachedits peak early on Unit I deposition before slowlydecreased. Increased of precipitation occurredsimultaneously with increased carbonate production,slow-down of ocean circulation that resulted in suboxic
74 Rina Zuraida et al.
to anoxic condition of core BS-36 location that yieldedFe-rich sediments of Units I and II.
CONCLUSIONPhysical and chemical properties along with
carbonate content has been analysed from core BS-36from Andaman Sea. The results show that the sedimentscan be classified into 5 lithologic units based onlithology, color and elemental contents. Thecharacteristics of each unit reveal changes indepositional environment condition. The bottom part ofthe core was deposited during suboxic to anoxic bottomcondition combined with high productivity and lowprecipitation, going upward the depositional conditionchanged into a high precipitation and oxic conditiondue to ocean ventilation, then the condition changedinto higher precipitation, higher carbonate productionand suboxic to anoxic condition.
ACKNOWLEDGEMENTThis study is funded by the Analysis of the
Characteristic of Deep Water Resources ResearchProject of the Marine Research Center (MRC),ARHRMF, Ministry of Marine Affairs and Fisheries(MMAF), 2015. This project involved scientists fromMRC, Marine Geological Institute of Indonesia (MGI),ARDEMR, MEMR, and Research Center forGeotechnology (RCG) LIPI. The authors are grateful toall BENTHIC cruise participants who worked hard onacquiring the sediment core that is presented in thispaper. We appreciate the Captain and crew of GeomarinIII that carried out the BENTHIC cruise, a collaborationbetween the Marine Geology Division of the FirstInstitute of Oceanography (FIO), SOA, China andMMAF. The authors would like to thank the Director ofP3SDLP who supported to this research. We would alsolike to thank the Directors of MGI, RCG-LIPI, and Prof.Xuefa Shi and Dr. Shengfa Liu who supported thisstudy.
REFERENCESAldrian, E., and Susanto, R.D. 2003. Identification of
three dominant rainfall regions within Indonesiaand their relationship to sea surfacetemperature, International Journal ofClimatology 23, 1435–1452.
Anderson, O.R. 1983. Radiolaria. Springer-Verlag,New York, 355 p.
Awasthi, N. 2012. Geochemical and Isotopic studies ofsediments from the Andaman Islands and theAndaman Sea. PhD thesis, M.S. Univ.ofBaroda, Vadodara, India.
Awasthi, N., Ray, J.S., Laskar, A.H., Kumar, A.,Sudhakar, M., Bhutani, R., Sheth, H.C., andYadava, M.G. 2010. Major ash eruptions ofBarrenIsland volcano (Andaman Sea) duringthe past 72 kyr: Clues from a sediment corerecord. Bulletin of Volcanology, 72:1131–1136.
Awasthi, N., Ray, J.S., Singh, A.K., Band, S.T., andRai, V.K. 2014. Provenance of the LateQuaternary sediments in the Andaman Sea:Implications for monsoon variability and oceancirculation. Geochemistry, Geophysics,Geosystem, 15:3890–3906, doi: 10.1002/2014GC005462.
Balsam, W.L., and Damuth, J.E. 2000. FurtherInvestigations of Shipboard vs Shore-BasedSpectral Data: Implications for Interpreting Leg164 Sediment Composition, in Paull, C.K.,Matsumoto, R., Wallace, P.J., and Dillon, W.P.(Eds.): Proceeding ODP, Scientific Results, 164.College Station, TX (Ocean Drilling Program).
Boles, J.R. 2014. Authigenic minerals in AccessScience. McGraw-Hill Education. http://dx.doi.org/10.1036/1097-8542.062800.
Cranston, R.E., and Buckley, D.E. 1990. Redoxreactions and carbonate preservation in deep-sea sediments. Marine Geology, 94:1-8.
Crow, M.J. and Barber, A.J. 2005. Simplifiedgeological map of Sumatra. In: Barber, A.J.,Crow, M.J., dan Milsom, J.S. (eds.) SumatraGeology, Resources and Tectonic Evolution.Geological Society Memoir, 31. doi:10.1144/GSL.MEM.2005.031.01.17.
Fairchild, M.D. 2005. Color and Image AppearanceModels. Color Appearance Models. John Wileyand Sons. 340 p.
Fraser, N., Kuhnt, W., Holbourn, A., Bolliet, T.,Andersen, N., Blanz, T., and Beaufort, L. 2014.Precipitation variability within the West PacificWarmPool over the past 120 ka: Evidence fromthe Davao Gulf, southern Philippines.Paleoceanography, 29:1094–1110, doi:10.1002/2013PA002599.
Guimaraes, J.T.F, Cohen, M.C.L., Franca, M.C., daSilva, A.K.T., and Rodrigues, S.F.S. 2013.Mineralogical and geochemical influencesonsediment color of Amazon wetlands analyzedbyvisible spectrophotometry. Acta Amazonica,43:331 – 342.
Gupta, K.S. 1999. Modern Foraminifera. Springer,Dordrecht, 279p.
Gustiantini, L., Maryunani, K.A., Zuraida, R., Kissel,C., Bassinot, F., and Zaim, Y. 2015. Distribusi
Sediment Characteristics of Mergui Basin, Andaman Sea based on Multi-proxy Analyses 75
foraminifera di Laut Halmahera dari glasialakhir sampai resen (foraminiferal distributionsince the last glacial until recent in HalmaheraSea), Jurnal Geologi Kelautan, 13(1): 25-36.
Hall., R. and Morley, C. 2004. Sundaland Basin, inClift, P. D., Wang, P., Kuhnt, W., and Hayes, D.(Eds.), Continent-Ocean Interactions within theEast Asian Marginal Seas: GeophysicalMonograph 149. Washington, D.C.: AmericanGeophysical Union, 55-85.
Hammer, O., Harper, D.A.T., and Ryan, P.D. 2001.PAST: Paleontological Statistics SoftwarePackage foe Education and Data Analysis.Palaeontologia Electronica, 4:9. (http://folk.uio/ohammer/past).
Hemming, S. R., van de Flierdt, T., Goldstein, S.L.,Franzese, A.M., Roy, M., Gastineau, G., andLandrot, G. 2007. Strontium isotope tracing ofterrigenous sediment dispersal in the AntarcticCircumpolar Current: Implications forconstraining frontal positions. Geochemistry,Geophysics, Geosystem, 8:Q06N13,doi:10.1029/2006GC001441.
Hendrizan, M., Zuraida, R., and Cahyarini, S.Y. 2016.Karakteristik Sedimen Palung Laut Sulawesi(Sumur St12) berdasarkan Hasil PengamatanMegaskopis dan Sifat Fisika dari PengukuranMulti-Sensor Core Logger (MSCL). RisetGeologi dan Pertambangan, 26: 69-80. doi:10.14203/risetgeotam2016.v26.273.
Itambi, A.C., von Dobeneck, T., Mulitza, S., Bickert,T., and Heslop, D. 2009. Millennial-scalenorthwest African droughts related to Heinrichevents and Dansgaard-Oeschger cycles:Evidence in marine sediments from offshoreSenegal. Paleoceanography, 24: PA1205, doi:10.1029/2007PA001570.
Kraal, P., Slomp, C. P., Reed, D.C., Reichart, G.-J., andPoulton, S. . 2012. Sedimentary phosphorus andiron cycling in and below the oxygen minimumzone of the northern Arabian Sea.Biogeoscience, 9:2603–2624, doi:10.5194/bg-9-2603-2012.
Larrasoaña, J.C., Roberts, A.P., and Rohling, E.J.2008. Magnetic susceptibility of easternMediterranean marine sediments as a proxy forSaharan dust supply? Marine Geology,254:224–229.
Lin, Y. N., Sieh, K., and Stock, J. 2010. Submarinelandslides along the Malacca Strait?MerguiBasin shelf margin: Insights fromsequence?stratigraphic analysis. Journal
Millot, G., 1970. Geology of Clays: Weathering,Sedimentology, Geochemistry. Springer-VerlagParis, 427 p.
Nielsen, B.M., and Rasmussen, T.M. 2002. Geologicalcorrelation of magnetic susceptibility andprofiles from Nordre StrŒmfjord, southern WestGreenland. Geology of Greenland SurveyBulletin, 191:48–56.
Permanawati, Y., Prartono, T., Atmadipoera, A.S.,Zuraida, R., and Chang, Y. 2016. Rekamsedimen inti untuk memperkirakan perubahanlingkungan di perairan lereng Kangean (coresediment records to predict environmentalchanges in Kangean slope Waters). JurnalGeologi Kelautan, 14(2): 65-77.
Rahman, M.A. and Oomori, T. 2008. Structure,crystallization and mineral composition ofsclerites in the alcyonarian coral. Journal ofCrystal Growth, 310(15): 3528-3534.
Rashid, H., Flower, B.P., Poore, R.Z., and Quinn, T.M.2007. A ~ 25 ka Indian Ocean monsoonvariability record from theAndaman Sea.Quaternary Science Review, 26:2586–2597.
Razali, M. 2011. Play type in the cross border NorthSumatra – Mergui Basin. North Sumatra –Mergui Basin Cross Border Case Study EPPM-CCOP, 1-44.
Rebolledo, L., Sepulveda, J., Lange, C.B., Pantoja, S.,Bertrand, S., Hughen, K., and Figueroa, D.2008. Late Holocene marine productivitychanges in Northern Patagonia-Chile inferredfrom a multi-proxy analysis of Jacaf channelsediments. Estuarine, Coastal and ShelfScience, 80:314–322.
Rizal, S., Damm, P., Wahid, M.A., Sundermann, J.,Ilhamsyah, Y., Iskandar, T., and Muhammad.2012. General Circulation in the Malacca Straitand Andaman Sea: a Numerical Model Study.American Journal of Environmental Science,8:479-488.
Rogerson, M., Weaver, P.E., Rohling, E.J., Lourens,L.J., Murray, J.W., and Hayes, A. 2006. Colourlogging as a tool in high-resolutionpalaeoceanography, in: Rothwell RG. (ed.) NewTechniques in Sediment Core Analysis.Geological Society. London: SpecialPublications, 267:99-112.
Skrede, K. 2012. Magnetic susceptibility ofsedimentary rocks from BjŒrnŒya. Thesis.
76 Rina Zuraida et al.
Norwegian University of Science andTechnology. Unpub.
Spooner, M. I., Barrows, T. T., De Deckker, P., andPaterne, M. 2005. Palaeoceanography of theBanda Sea, and Late Pleistocene initiation ofthe Northwest Monsoon. Global PlanetaryChange, 49:28-46, doi:10.1016/j.gloplacha.2005.05.002.
Sprenk, D., Weber, M.E., Kuhn, G., Wennrich, V.,Hartmann, T., and Seelos, K. 2014. Seasonalchanges in glacial polynya activity inferredfrom Weddell Sea varves. Climate of the Past,10:1239–1251. doi:10.5194/cp-10-1239-2014.
Troa, R.A., Liu, S., Zuraida, R., Triarso, E.,Gustiantini, L., and Hendrizan, M. 2014. CruiseReport of BENTHIC Cruis Phase I. Researchand Development Center for Marine andCoastal Resources – Ministry of Marine Affairsand Fisheries. 40 p. Unpublished report.
Tripathi, S.K. 2014. Biogenic sediment distributionaround south of Central Andaman Trough,
Andaman Sea: signatures frommicropaleontological studies. Indian Journal ofGeoscience, 68:337-346.
Wei, J.H., Finkelstein, D.B., Brigham-Grette, J.,Castaneda, I.S., and Nowaczyk, N. 2014.Sediment colour reflectance spectroscopy as aproxy for wet/dry cycles at Lake ElÊgygytgyn.Far East Russia, during Marine Isotope Stages 8to 12. Sedimentology, 61:1793-1811.
Weltje, G.J. and Tjallingii, R. 2008. Calibration OfXRF Core Scanners For QuantitativeGeochemical Logging Of Sediment Cores:Theory And Application. Earth and Planetary.Science Letter, 274:423–438.
Yao, Z., Liu, Y., Shi, X., and Suk, B.-C. 2012.Paleoenvironmental changes in the East/JapanSea during the last 48 ka: indications from high-resolution X-ray fluorescence core scanning.Journal of Quaternary Science, 27:932-940.