24
Solid Earth Geophysics Ali Oncel [email protected] Department of Earth Sciences KFUPM Today’s class: Seismology Measuring the Interior Reading: Fowler Chapter 4
| Date post: | 13-Jul-2015 |
| Category: |
Technology |
| Upload: | ali-osman-oencel |
| View: | 1,213 times |
| Download: | 1 times |

Solid Earth Geophysics
Department of Earth SciencesKFUPM
Today’s class: Seismology Measuring the InteriorReading: Fowler Chapter 4

and β are termed for the P-wave and S-wave velocities. Often, the symbols Vp and Vs are used instead of α and β. Θ is the scalar displacement potential, but U vector displacement.
, µ are the Lamé coefficients, where λ is bulk modulus (incompressibility), µ shear modulus (rigidity) and ρdensity.
Compressional Rotational
Wave Equations

λ = k - = 2µ ν E3 ( 1 + ν ) ( 1 – 2ν)
Seismic velocities
How α and β depend on density ρ?
P wave velocity a and S wave velocity b depend on physical properties of medium through which they travel:
ρµ=sV
where: K = the bulk modulus, or the reciprocal of compressibility.µ = the shear modulus, or the second Lamé constant,
and ρ = density.
ρ
µ34+
=K
VP

P and S-Wave Velocities
Unlike density, seismic velocityinvolves the deformation of a rock as a function of time. As shown below, a cube of rock can be compressed, which changes its volume and shape or sheared, which changes its shape but not its volume.
4
Last Updated: January 2007
Nafe-Drake Curve
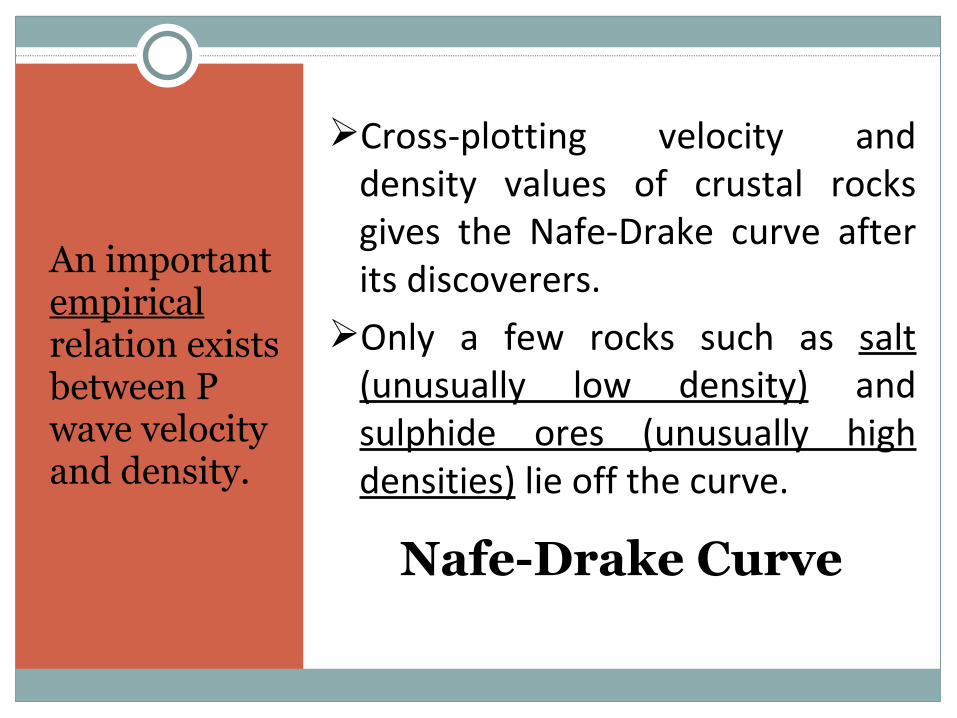
An important empirical relation exists between P wave velocity and density.
Cross-plotting velocity and density values of crustal rocks gives the Nafe-Drake curve after its discoverers.
Only a few rocks such as salt (unusually low density) and sulphide ores (unusually high densities) lie off the curve.

Nafe-Drake Curve
It is a linear relationship between densityand seismic velocity
V = a ρ + bwhere a and b are constants.
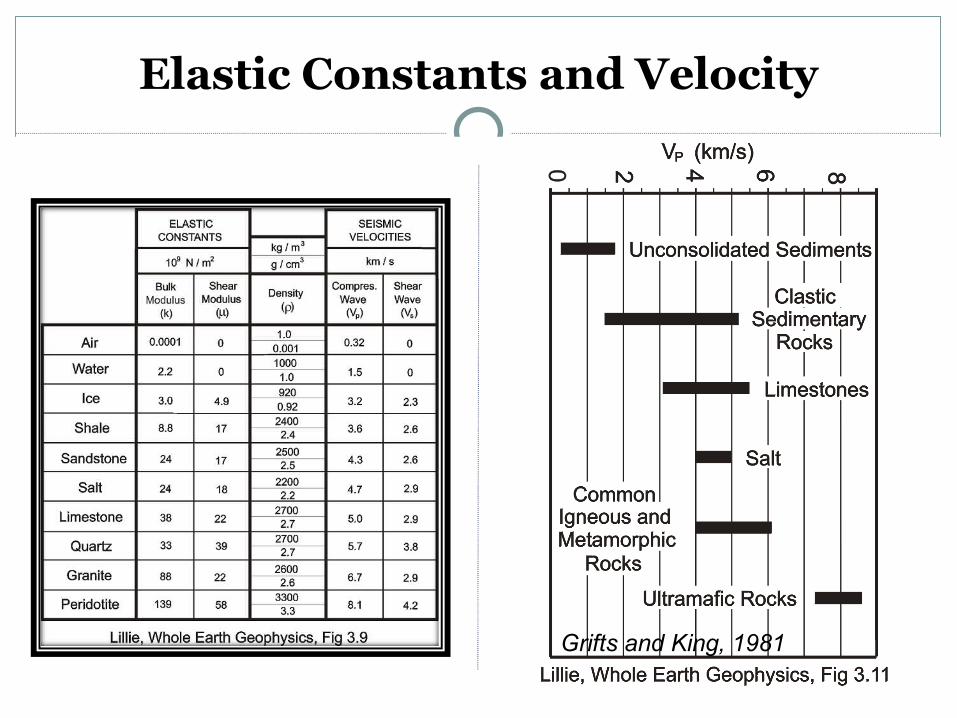
Elastic Constants and Velocity
Grifts and King, 1981


Locating an Earthquake’s Epicentre

Travel-times for location
Measure time between P and S wave on seismogram
Use travel-time graph to get distance to epicenter

Earthquake terminology
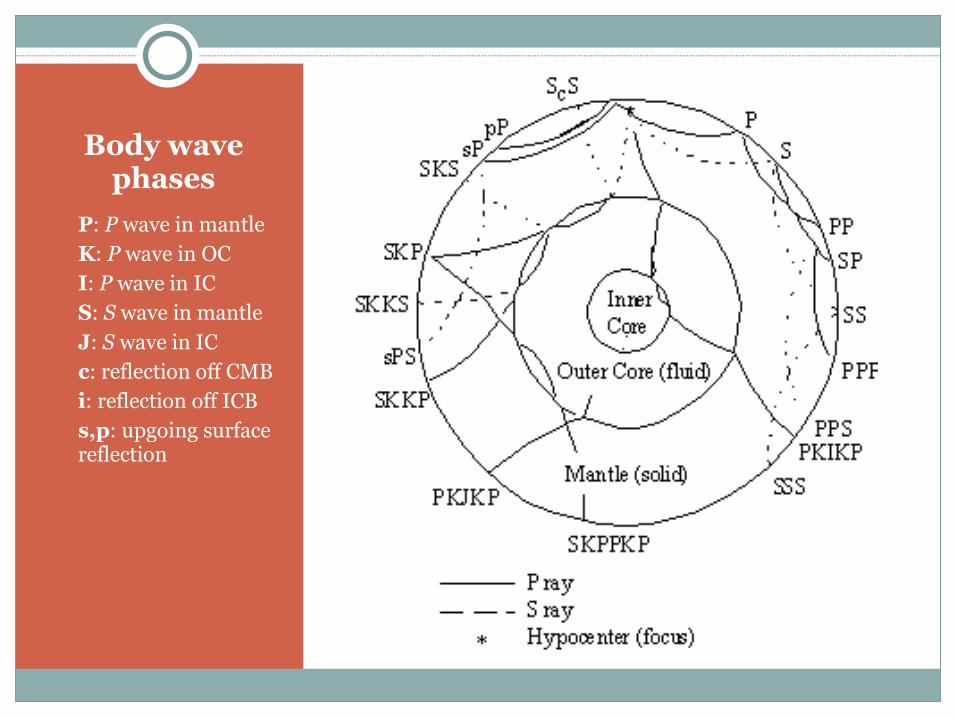
Body wave phases
P: P wave in mantle K: P wave in OC I: P wave in IC S: S wave in mantle J: S wave in IC c: reflection off CMB i: reflection off ICB s,p: upgoing surface
reflection

Global travel time curves

Focal Mechanism
There are special graphics, called focal mechanisms or “beach balls” that we use as shorthand to describe the style of faulting.

Seismographs
A seismograph is an instrument which writes a permanent continuous record of earth motion.[1] Measuring the three orthogonal components of ground motion at a seismic.
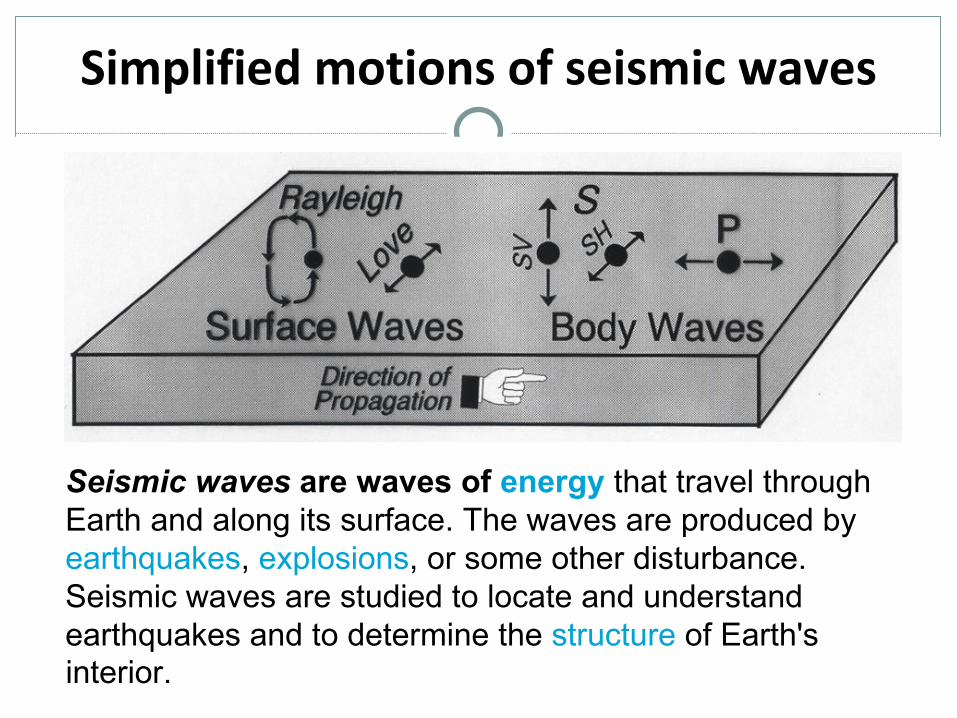
Simplified motions of seismic waves
Seismic waves are waves of energy that travel through Earth and along its surface. The waves are produced by earthquakes, explosions, or some other disturbance. Seismic waves are studied to locate and understand earthquakes and to determine the structure of Earth's interior.
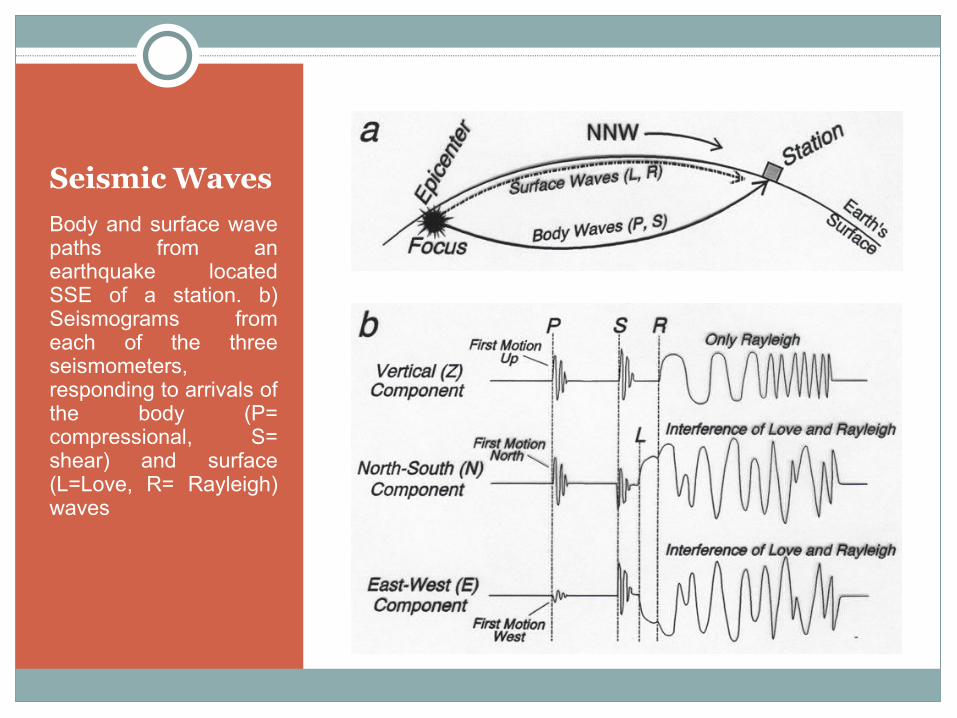
Seismic Waves
Body and surface wave paths from an earthquake located SSE of a station. b) Seismograms from each of the three seismometers, responding to arrivals of the body (P= compressional, S= shear) and surface (L=Love, R= Rayleigh) waves

Pushes up
Polarity : P-waves
Initial arrival as a compression pushesthe ground up; Z-component shows an upward first motion.
Initial arrival as a dilatation pulls the ground down; Z-component shows an downward first motion
Pulls down

• Waves radiate outward in quadrants of compression and dilatation
• The Z-component seismograms for the three stations highlighted in (a).
Initial P-wave Radiation Pattern:

• Map view of radiation pattern for right-lateral, strike-slip fault occurring along the San Andreas transform plate boundary
• First-motion information for arrival at stations indicated in (a), plotted as a focal mechanism solution.

c) Auxiliary fault interpretation of the first-motion in (a), showing that the same radiation pattern could have resulted from a left-lateral fault.
d) Focal mechanism solution for (c) is exactly the same as that resulting from right-lateral fault in (a).

Unbiguity for Strike Bingol EQ, May 1, 2003
What is the strike of fault?
Case Work: Fault interpretation
Mw=6.4
May 1, 2003- Bingol Earthquake (Mw=6.4)

Deploying Stations Aftershocks Monitoring
Case Work: Fault interpretation
TUBITAK Earthquake StationsEarthquake Aftershocks

Case Work: Fault interpretation
Strike based Aftershocks Earthquake Ruptures
Earthquake Aftershocks Observed surfaced deformation due to Bingol Earthquake


