SELECTED NUTRIENT ANALYSES OF FRESH, FRESH-STORED, AND FROZEN FRUITS AND VEGETABLES by LINSHAN LI (Under the Direction of Ronald B. Pegg) ABSTRACT The objective of this two-year study was to determine and compare the status of targeted nutrients in selected fresh, fresh-stored, and frozen fruits and vegetables, while mimicking typical consumer purchasing and storage patterns of the produce. The nutrients analyzed were L- ascorbic acid (vitamin C), β-carotene (provitamin A), and folate, while the produce was blueberries, strawberries, broccoli, cauliflower, corn, green beans, spinach, and green peas. Analyses were performed in triplicate on representative samples using approved, standardized analytical methods and included a quality control plan for each nutrient; all data were analyzed by one-way ANOVA to determine the presence of significant difference in nutrient contents according to treatment (α=0.05). The findings demonstrated that fresh produce loses vitamins upon refrigerated storage over time, while their frozen counterparts retain these nutrients equally so or better. The consumers’ assumption that fresh food has significantly greater nutritional value than its frozen counterpart is misplaced. INDEX WORDS: Fresh Fruits and Vegetables, Frozen Fruits and Vegetables, Nutrients, Vitamin C, Vitamin A, Food Folate.
Transcript
SELECTED NUTRIENT ANALYSES OF FRESH, FRESH-STORED, AND FROZEN
FRUITS AND VEGETABLES
by
LINSHAN LI
(Under the Direction of Ronald B. Pegg)
ABSTRACT
The objective of this two-year study was to determine and compare the status of targeted
nutrients in selected fresh, fresh-stored, and frozen fruits and vegetables, while mimicking
typical consumer purchasing and storage patterns of the produce. The nutrients analyzed were L-
ascorbic acid (vitamin C), β-carotene (provitamin A), and folate, while the produce was
blueberries, strawberries, broccoli, cauliflower, corn, green beans, spinach, and green peas.
Analyses were performed in triplicate on representative samples using approved, standardized
analytical methods and included a quality control plan for each nutrient; all data were analyzed
by one-way ANOVA to determine the presence of significant difference in nutrient contents
according to treatment (α=0.05). The findings demonstrated that fresh produce loses vitamins
upon refrigerated storage over time, while their frozen counterparts retain these nutrients equally
so or better. The consumers’ assumption that fresh food has significantly greater nutritional value
than its frozen counterpart is misplaced.
INDEX WORDS: Fresh Fruits and Vegetables, Frozen Fruits and Vegetables, Nutrients, Vitamin C, Vitamin A, Food Folate.
SELECTED NUTRIENT ANALYSES OF FRESH, FRESH-STORED, AND FROZEN
FRUITS AND VEGETABLES
by
LINSHAN LI
B.E., Shanghai Ocean University, China, 2010
A Thesis Submitted to the Graduate Faculty of The University of Georgia in Partial
SELECTED NUTRIENT ANALYSES OF FRESH, FRESH-STORED, AND FROZEN
FRUITS AND VEGETABLES
by
LINSHAN LI
Major Professor: Ronald B. Pegg
Committee: Mark A. Harrison Ronald R. Eitenmiller Electronic Version Approved: Maureen Grasso Dean of the Graduate School The University of Georgia December 2013
iv
DEDICATION
This thesis is dedicated to my loving parents, Xiaoming Li and Zongqiong Ma, who love
me and support me in every way. In addition this work is dedicated to my loving husband, Yi
Chen, who supports and shares my hopes and dreams.
v
ACKNOWLEDGEMENTS
I would like to acknowledge my funding source, the Frozen Food Foundation, for
providing me with this opportunity. I want to express my appreciation and gratitude to my major
professor, Dr. Ronald B. Pegg, for all his constant encouragement and valuable guidance during
my M.S. study. I appreciate the training he gave me to build my ability to research independently
and corporately. In addition, he helped me in developing my critical thinking and English
communication skills, which are very important in the journey of my life.
I would also like to thank Dr. Ronald R. Eitenmiller and Dr. Mark A. Harrison for
serving on my advisory committee and giving me valuable advice. Additionally, I want to thank
most sincerely Vickie Wentzel, Dr. Ji-Yeon Chun, Sheena Patel, and Elizabeth Carr for their
cooperation assistance in completing this research and thesis.
dichloroindophenol, to a colorless product. At the end-point, any excess un-reduced indicator
dye will be visible as rose-pink in acidic solutions.
Vitamin C is exhaustively extracted from produce samples and the titration is performed
in the presence of a meta-phosphoric–acetic acid reagent to maintain a suitable acidity for the
reaction, as well as to avoid auto-oxidation of L-ascorbic acid at higher pH values.
40
Quality Control
Accuracy
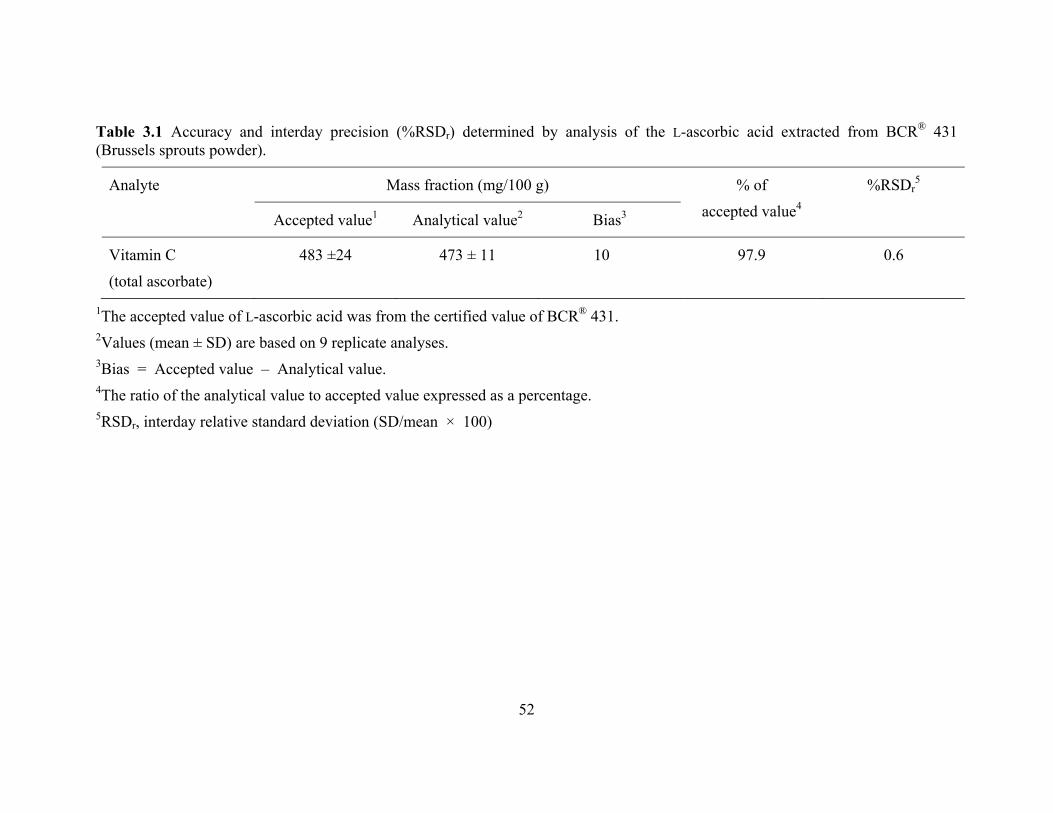
Accuracy and %RSDr measures for the ascorbic acid assay are reported in Table 3.1.
Ascorbic acid was extracted from the CRM, BCR® 431 (Brussels sprouts powder), and analyzed.
According to its certificate of analysis, BCR® 431 contains 483 ± 24 mg vitamin C/100 g.
Comparison of the analytical value to the accepted value from the certified value of the CRM
was within the accepted range reported for BCR® 431. The bias value was +10. The ratio of the
analytical value to the accepted value, expressed as a percentage (% of accepted value), can be
used to evaluate accuracy. For ascorbic acid, the % accepted value was 97.9 indicating a close
agreement between the analytical and accepted value. Interday precision (%RSDr) was excellent
at a value of 0.6. Together, the accuracy and %RSDr measures indicated that the ascorbic acid
analyses of the fruit and vegetable samples were accurate and repeatable. Noteworthy is that
many nutrient profiling studies fail to report on these parameters.
The recoveries of ascorbic acid from BCR® 431 for spiked samples at levels of 50, 100,
and 200% were 101 ± 4, 97 ± 3 and 105 ± 3%, respectively. The recoveries ranged from 97 to
105%. For fruit and vegetable samples, the recoveries ranged from 93 to 105%, thereby
demonstrating excellent recovery of vitamin C from the test samples (see Table 3.2). Such high
recoveries from the CRM and produce experiments validate the accuracy of the L-ascorbic acid
assay.
Precision
Intraday precision (repeatability) was determined by running 9 replicates of the CRM
over 3 days. The findings are presented in Table 3.1. The RSD of the data were calculated and
41
shown to be less than 5%. The daily (intraday) and day-to-day (interday) precision of the CRM
gave the following results: based on n=3, the ascorbic acid analysis of the CRM showed a
relative standard deviation of 0.64%. In terms of inter-day precision, the ascorbic acid analysis of
BCR® 431 (Brussels sprouts powder) gave a relative standard deviation of 2.33%. In both
cases, %RSD values were found well within the 5% limit, indicating that the current method is
repeatable.
Statistics
The question of interest is whether or not the L-ascorbic acid contents in frozen fruits and
vegetables are significantly (p < 0.05) different from those of their fresh and/or fresh-stored
counterparts. Consumers generally assume that the nutrient content in fresh produce is greater
than that which is frozen. Because the range of ascorbic acid contents in the selected produce
varied quite markedly, it was more reasonable to analyze each fruit and vegetable separately. To
illustrate, the L-ascorbic acid content in fresh blueberries was only ~13 mg/100 g, f.w. whereas
in fresh strawberries it was ~55 mg/100 g, f.w. Consequently, it is not appropriate to fit just one
statistical model to the L-ascorbic acid data. Instead, 8 different models were fitted based on 54
observations (i.e., 6 trials per fruit or vegetable × 3 replicates per sample ×3 treatments {fresh,
fresh-stored, and frozen}). Seasonality was not considered in this study because of lack of
knowledge of the source and processing of the fresh and frozen fruits and vegetables.
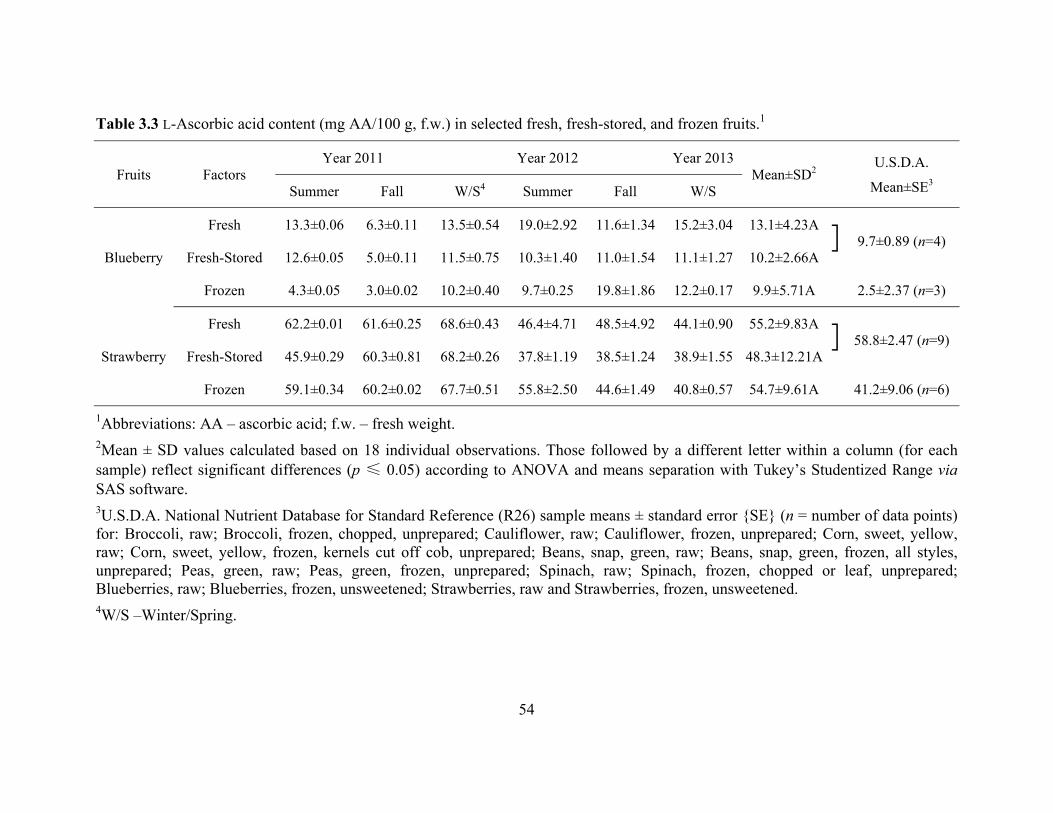
The mean L-ascorbic acid contents determined in fresh, fresh-stored, and frozen
blueberries and strawberries as well as the corresponding fresh and frozen values from the
U.S.D.A. National Nutrient Database for Standard Reference (R26), herein after referred to
simply as Database, are presented in Table 3.3. There was no statistical (p > 0.05) difference in
42
the levels of vitamin C for all three berry types. For frozen blueberries, the mean value
determined was 9.9 ± 5.7 mg/100 g, f.w., which is much higher than the Database value of 2.5 ±
2.4 mg/100 g, f.w., based on only 3 observations. With reference to both values, there were large
standard errors of the means. Possible explanation for this variation may stem from the
employment of different cultivars, but the preparation of the composite each time prior to
vitamin C analysis should have decreased this variability. For fresh and fresh-stored blueberries,
the standard errors of the means were much less than that of the frozen berry composites. One
might have expected less variance in the content of L-ascorbic acid in frozen blueberries; the
range was from 3.0 mg/100 g to 19.8 mg/100 g, possibly being due to the impact of non-uniform
blast freezing.
Not just blueberries but for all produce analyzed in this study, the mean value for L-
ascorbic acid in the fresh samples was always higher than that of the fresh-stored product. This is
expected, as the nutrient content would change with the respiration/lifespan of the fruit. What
this study lacks is uniform control over the age, handling, and treatment of the fruit before it was
analyzed. As stated in the objective, this investigation was designed to mimic the purchasing and
storage habits of produce by consumers before consumption. The findings show that the vitamin
C content of fresh blueberries stored at 4 °C for 5 days decreased by 22%. A study by Kalt,
Forney, Martin, & Prior (1999) found that ascorbate level in low-bush blueberries dropped by 27%
after 8 days held at 20 °C. These authors postulated that the losses may be from extra vacuolar
vitamin C.
For strawberries, the ascorbic acid contents in the fresh and fresh-stored strawberries
were 55.2 ± 9.8 and 48.3 ± 12.2 mg/100 g, f.w., respectively, and were consistent with the
43
Database value of 58.8 ± 2.5, based on 9 observations. However for frozen strawberries, the
vitamin C content of 54.7 ± 9.6 mg/100 g, f.w. was higher than the value of 41.2 ± 9.1 reported
by the U.S.D.A. It is interesting that greater variation in the vitamin C content of the analyzed
strawberries from values reported in the Database was not found. Olsson et al. (2004) reported a
2 to 5 fold variation in the ascorbic acid level among 4 different cultivars. These authors also
reported that the concentration of bioactive compounds in strawberries varied according to the
type of cultivar, ripening stage, and length of storage. Just like blueberries, the fresh strawberries
had a greater mean content of vitamin C compared with its fresh-stored counterpart. The data
showed a 12.5% decrease of L-ascorbic acid in fresh strawberries stored at 4 °C for 5 days after
purchase. The loss was minor compared to that of blueberries. Kalt et al. (1999) found no
ascorbate losses in strawberries during 8 days of storage at 0, 10, 20, and 30 °C. What is
noteworthy is that the mean content of the frozen berries were greater than that of the fresh-
stored strawberries. Yet, there is no statistical (p > 0.05) difference in the level of vitamin C
between the fresh, fresh-stored, and frozen berries.
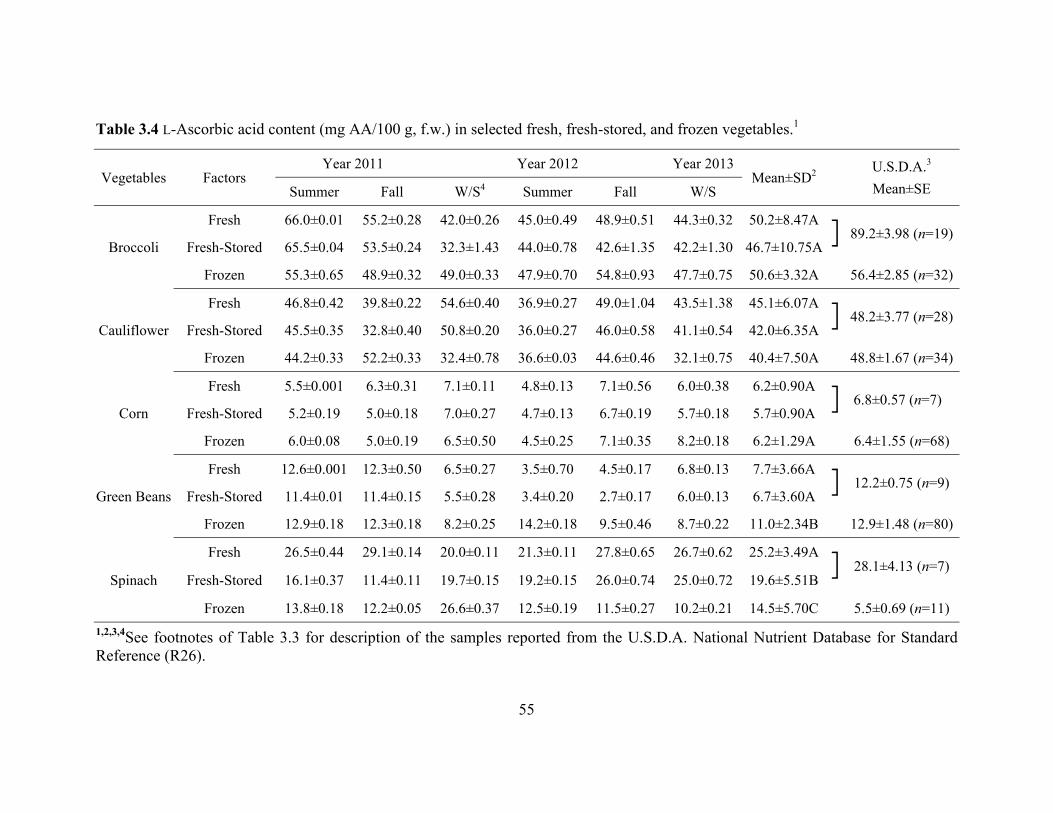
The mean L-ascorbic acid contents determined in fresh, fresh-stored, and frozen broccoli,
cauliflower, corn, green beans, and spinach, as well as the corresponding fresh and frozen values
from the Database are presented in Table 3.4. The mean values for fresh, fresh-stored, and frozen
broccoli were 50.2 ± 8.5, 46.7 ± 10.8, and 50.6 ± 3.3 mg/100 g, f.w., respectively, and there were
no statistical (p > 0.05) differences. The vitamin C content in frozen broccoli was similar to the
56.4 ± 2.9 mg/100 g, f.w. value of the Database; however, this was not the case for fresh broccoli,
whose reported value is 89.2 ± 4.0 mg/100 g, f.w. It is possible that lack of a blanching step
before taking a representative sample from the broccoli composite was responsible for some
44
degradation of vitamin C, but unlike corn-on-the-cob, there was no significant tissue damage to
the broccoli to release oxidases until the grinding step in the chopper, followed immediately by
sampling and addition of the meta-phosphoric acid–acetic acid nutrient-stabilizing reagent. A
decrease of only 7% L-ascorbic acid was noted in fresh broccoli stored at 4 °C for 5 days after
purchase. Consistent with this work, Favell (1998) found no significant decrease of vitamin C in
fresh broccoli stored at 4 °C for 7 days. A study by Schonhof, Kläring, Krumbein, Claußen, &
Schreiner (2007) found that temperature had a strong influence on the L-ascorbic acid content.
These authors found at 15 to 20 °C the L-ascorbic acid content decreased by up to 38% as
compared to broccoli grown at 7 to 12 °C. Although seasonal variability was not examined in
this study, the observation by Schonhof et al. (2007) reinforces the point that horticultural
practices and growing conditions also markedly impact nutrient levels, not just cultivar selection,
handling, and storage conditions.
The mean values for fresh, fresh-stored, and frozen cauliflower were 45.1 ± 6.1, 42.0 ±
6.4, and 40.4 ± 7.5 mg/100 g, f.w., respectively, and there were no statistical (p > 0.05)
differences. The vitamin C content in fresh cauliflower was similar to the 48.2 ± 3.8 mg/100 g,
f.w. value reported in the Database, while the frozen cauliflower analyzed in this study yielded a
slightly lower value than the Database’s 48.8 ± 1.7 mg/100 g, f.w. A 7% decrease in vitamin C
was observed in fresh cauliflower stored at 4 °C for 5 days after purchase. Unlike the frozen,
neither the fresh nor fresh-stored cauliflower samples were blanched. It is possible that the lower
ascorbic acid mean in frozen cauliflower, albeit not statistically so, might be a result of blanching.
Volden, Bengtsson, & Wicklund (2009) found an average 19% loss of L-ascorbic acid in
cauliflower as a result of blanching. Lisiewska and Kmiecik (1996) also reported that 28 to 32%
45
losses in the vitamin C content had occurred due to blanching. Yet, further losses in the nutrient
during frozen storage were slight. After 12 months of frozen storage, Lisiewska and Kmiecik
(1996) found a further reduction of ascorbic acid in cauliflower of only 6 to 13%.This finding
clearly illustrates the stability of L-ascorbic acid in frozen storage.
The mean values for fresh, fresh-stored, and frozen corn were 6.2 ± 0.9, 5.7 ± 0.9, and 6.2
± 1.3 mg/100 g, f.w., respectively, and there were no statistical (p > 0.05) differences. The
vitamin C contents in fresh and frozen corn were similar to the 6.8 ± 0.6 and 6.4 ± 1.6 mg/100 g,
f.w. values reported in the Database, respectively. The L-ascorbic acid content in corn was lowest
of all produce analyzed. Because the fresh and fresh-stored corn cobs were blanched prior to
preparing the composite, the moisture content of the composite was determined gravimetrically
by oven drying and compared to that of non-blanched corn. A correction factor, as described in
the experimental section, was employed to be able to report the results on a f.w. basis. An
interesting experiment would have been not to blanch the corn before stripping it off the cob to
see if the enzymatic degradation of vitamin C was pronounced. This was not done, as it was a
logical step to blanch the corn. The mean ascorbic acid contents in fresh corn and frozen corn
were similar and slightly higher than that of the fresh-stored produce. A 5% loss in L-ascorbic
acid was noted in fresh corn-on-the-cob stored at 4 °C for 5 days after purchase. The similar
nutrition value in frozen corn ought to be a major attraction to consumers, because the frozen
product needs much less handling before consumption compared with fresh corn.
The mean values for fresh, fresh-stored, and frozen green beans were 7.7 ± 3.7, 6.7 ± 3.6,
and 11.0 ± 2.3 mg/100 g, f.w., respectively. The frozen green beans possessed a mean L-ascorbic
acid level significantly (p < 0.05) greater than both the fresh and fresh-stored samples. The
46
vitamin C contents in the frozen green beans were similar to the 12.9 ± 1.5 mg/100 g, f.w. value
reported in the Database, but the fresh sample was lower than the Database’s 12.2 ± 0.8 mg/100
g, f.w. value. It is interesting to note that the Database’s mean content of vitamin C for fresh
green beans is lower than that of its frozen counterpart; our findings match this observation.
Makhlouf et al. (1995) also found vitamin C in the raw beans had an average of 8.2 mg/100 g,
which corresponds with our finding. In this study, a loss of 13% ascorbic acid was noted for
fresh green beans stored at 4 °C for 5 days after purchase. Although the loss was not significant
compared to the fresh sample, other researchers have reported marked ascorbic acid loss with
extended storage. For instance, Howard, Wong, Perry, & Klein (2008) found a rapid loss of L-
ascorbic acid in fresh green beans during refrigeration for 3 weeks. Although blanching prior to
freezing slightly decreased the L-ascorbic acid content, the authors reported that its retention
remained stable after freezing. Martin and Silva (2004) found that the nutritional and sensory
parameters of green beans were retained at storage temperatures of 5, -6, and -12 °C, thereby
indicating that the beans’ quality held well during frozen storage. Favell (1998) noted a 77%
decrease in L-ascorbic acid in fresh green beans stored at 4 °C for 7 days. Because the handling
practices and age of the picked green beans reaching the supermarkets are unknown, it is not
surprising based the previous studies mentioned above, that frozen green beans can contain more
vitamin C than those which are “fresh.” This is something of which the consumer is not aware.
The most interesting finding in the L-ascorbic acid assay was for spinach. The mean
values for fresh, fresh-stored, and frozen spinach were 25.2 ± 3.5, 19.6 ± 5.5, and 14.5 ± 5.7
mg/100 g, f.w., respectively. All means were statistically (p < 0.05) different from one another!
The vitamin C content in fresh spinach was similar to the 28.1 ± 4.1 mg/100 g, f.w. value
47
reported in the Database, based on 7 observations. However for frozen spinach, the value of 5.5
± 0.7 mg/100 g, f.w. was markedly lower than that determined in this study. In fact, the mean
ascorbic acid content in frozen spinach was ~1.6× greater than the Database value. What can
account for the variation? Spinach possesses a large surface area relative to the other fruits and
vegetables examined in this study; so, blanching may have had a detrimental effect on its vitamin
C content. Note that only the frozen sample had been blanched before it was analyzed, while the
fresh and fresh-stored test samples were placed in the nutrient-stabilizing reagent after grinding.
This may possibly account for why the vitamin C content in frozen spinach is significantly (p <
0.05) less than the fresh, non-blanched, counterpart. It is also very apparent that refrigerated
storage results in a significant (p < 0.05) loss of vitamin C: a 22% decrease of L-ascorbic acid
was noted for fresh spinach that had been stored at 4 °C for 5 days after purchase. On the other
hand, Giannakourou and Taoukis (2003) found higher levels of L-ascorbic acid in frozen spinach:
the contents ranged from 25 to 34 mg/100 g, f.w. The difference might have been due to cultivar
selection or how blanching was performed. Other studies have also noted poor retention of
vitamin C in spinach. Favell (1998) reported a 75% decrease in L-ascorbic acid in fresh spinach
stored at 4 °C for 7 days. This loss is markedly greater than the ~30% loss of L-ascorbic acid
these authors observed in frozen spinach stored at -20 °C for 12 months. Hunter and Fletcher
(2002) reported a total loss of L-ascorbic acid in fresh spinach stored for 4 days at 20°C. He
partially attributed the loss to permeation of oxygen through the spinach leaves. Consequently, in
consideration of rapid L-ascorbic acid losses post-harvest, freezing would have an obvious
advantage compared to refrigeration.
48
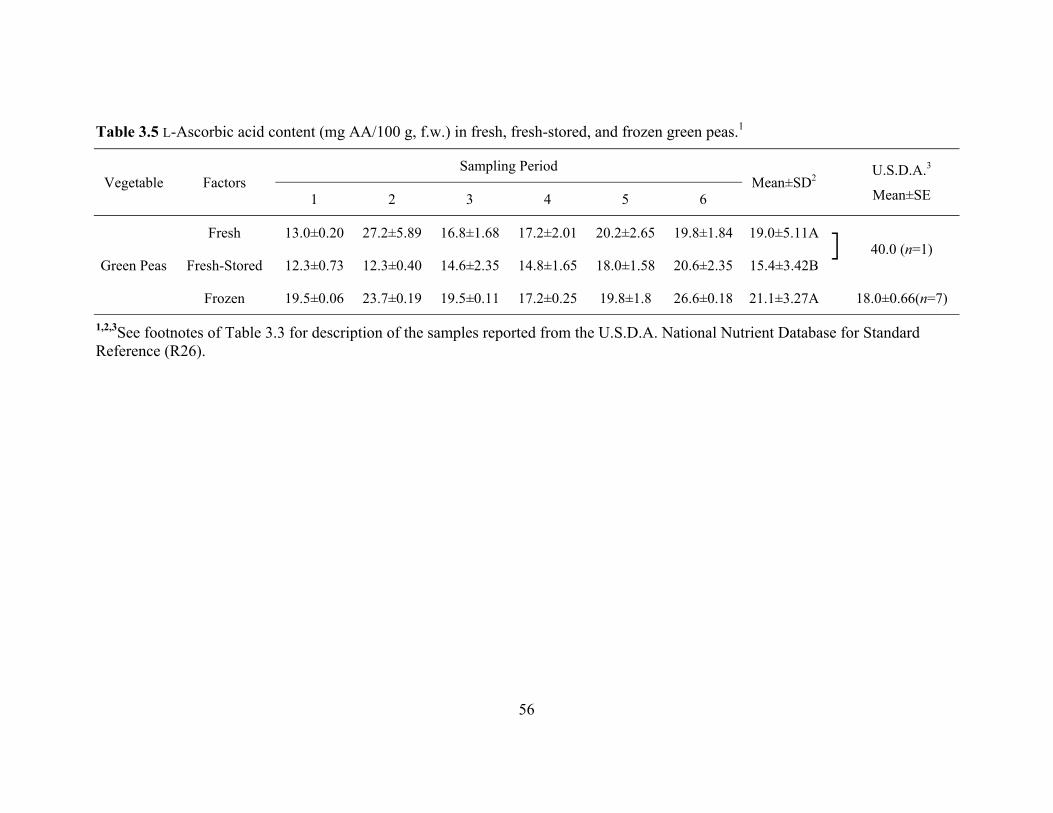
The mean L-ascorbic acid contents determined in fresh, fresh-stored, and frozen green
peas as well as the corresponding fresh and frozen values from the Database are presented in
Table 3.5. Unlike the other produce, fresh green peas, also referred to as English peas, could only
be procured in the spring of both years of the study; hence, Table 3.5 lists sampling times as
opposed to seasons. The mean values for fresh, fresh-stored, and frozen green peas were 19.0 ±
5.1, 15.4 ± 3.4, and 21.1 ± 3.3 mg/100 g, f.w., respectively. Fresh and frozen green peas were not
statistically (p > 0.05) different from one another, even though the absolute mean value of L-
ascorbic acid in frozen green peas was greater than that of fresh peas. For fresh-stored green peas,
however, the L-ascorbic acid content was reduced and statistically (p < 0.05) different from the
latter two types. With reference to the Database, the vitamin C content of frozen green peas listed
was consistent with that found in the present study; the former being 18.0 ± 0.7 mg/100 g, f.w.,
based on 7 observations. For fresh green peas only one observation is given in the Database at a
value of 40 mg/100 g, f.w., which cannot be deemed as reliable for comparative purposes. A
study by Makhlouf et al. (1995) also found raw peas to possess vitamin C levels 45% below the
Database value. These authors also noted that there was actually no marked difference between
the content of L-ascorbic acid in frozen and fresh green peas. In other studies, frozen peas were
found to have a good retention of L-ascorbic acid. For instance, Sistrunk, Gonzalez, & Moore
(1989) reported that frozen green peas retained the highest nutritional quality compared with
other processing methods. With no processing, a 19% loss of L-ascorbic acid was noted for fresh
green peas stored at 4 °C for 5 days. This observation is consistent with the findings of Favell
(1998), who reported a 15% loss of L-ascorbic acid in fresh green peas during 7 days at 4 °C
compared to a 10% decrease in frozen green peas stored at -20 °C for 12 months. Hunter and
49
Fletcher (2002) observed that fresh green peas stored at ambient temperatures lost ~50% of their
L-ascorbic acid content after 7 days, indicating a dramatic loss in the nutrient if fresh green peas
were not properly stored. Finally, an older study by Fellers and Stepat (1935) reported a 51.5%
ascorbic acid loss in fresh green peas during 24-48 h after picking on a fresh/wet weight basis.
References
AOAC International. (2006). AOAC Official Method 967.21, Ascorbic acid in vitamin
preparations and juices 2,6-dichloroindophenol titrimetric method, 45.1.14.
AOAC International. (2006). AOAC Official Method 984.325, Moisture (loss of mass on drying)
in frozen french-fried potatoes.
Favell, D. J. (1998). A comparison of the vitamin C content of fresh and frozen vegetables. Food
Chemistry 62:59–64.
Fellers, C. R., & Stepat, W. (1935). Effect of shipping, freezing and canning on the ascorbic acid
(vitamin C) content of peas. Proceedings of the American Society for Horticultural Science
32:627–633.
Giannakourou, M. C., & Taoukis, P. S. (2003). Kinetic modelling of vitamin C loss in frozen
green vegetables under variable storage conditions. Food Chemistry 83:33–41.
Hossu, A-M., & Magearu, V. (2004). Determination of vitamin C in pharmaceutical products
with physico-chemical and bioanalytical technics. Roumanian Biotechnological Letters
9:1497–1504.
Howard, L. A., Wong, A. D., Perry, A. K., & Klein, B. P. (2008). β-Carotene and ascorbic acid
retention in fresh and processed vegetables. Journal of Food Science 64:929–936.
50
Hunter, K. J., & Fletcher, J. M. (2002). The antioxidant activity and composition of fresh, frozen,
jarred and canned vegetables. Innovative Food Science and Emerging Technologies 3:399–
406.
Kalt, W., Forney, C. F., Martin, A., & Prior, R. L. (1999). Antioxidant capacity, vitamin C,
phenolics, and anthocyanins after fresh storage of small fruits. Journal of Agricultural and
Food Chemistry 47:4638–4644.
Lisiewska, Z., & Kmiecik, W. (1996). Effects of level of nitrogen fertilizer, processing
conditions and period of storage of frozen broccoli and cauliflower on vitamin C retention.
Food Chemistry 57:267–270.
Makhlouf, J., Zee, J., Tremblay, N., Bélanger, A., Michaud, M.-H., & Gosselin, A. (1995). Some
nutritional characteristics of beans, sweet corn and peas (raw, canned and frozen) produced
in the province of Quebec. Food Research International 28:253–259.
Martins, R. C., & Silva, C. L. M. (2004). Frozen green beans (Phaseolus vulgaris, L.) quality
profile evaluation during home storage. Journal of Food Engineering 64:481–488.
Olsson, M. E., Ekvall, J., Gustavsson, K-E., Nilsson, J., Pillai, D., Sjöholm, I., Svensson, U.,
Åkesson, B., & Nyman, M. G. L. (2004). Antioxidants, low molecular weight carbohydrates,
and total antioxidant capacity in strawberries (Fragaria × ananassa): Effects of cultivar,
ripening, and storage. Journal of Agricultural and Food Chemistry 52:2490−2498.
Schonhof, I., Kläring, H.-P., Krumbein, A., Claußen, W., & Schreiner, M. (2007). Effect of
temperature increase under low radiation conditions on phytochemicals and ascorbic acid in
greenhouse grown broccoli. Agriculture, Ecosystems and Environment 119:103–111.
51
Sistrunk, W. A., Gonzalez, A. R., & Moore, K. J. (1989). Chapter 6: Green beans. In: Quality
and Preservation of Vegetables, ed. Eskin, N. A. M. Boca Raton, FL: CRC Press, pp. 185–
216.
Volden, J., Bengtsson, B. B., & Wicklund, T. (2009). Glucosinolates, L-ascorbic acid, total
phenols, anthocyanins, antioxidant capacities and colour in cauliflower (Brassica oleracea L.
ssp. botrytis); effects of long-term freezer storage. Food Chemistry 112:967–976.
52
Table 3.1 Accuracy and interday precision (%RSDr) determined by analysis of the L-ascorbic acid extracted from BCR® 431 (Brussels sprouts powder).
Analyte Mass fraction (mg/100 g) % of
accepted value4
%RSDr5
Accepted value1 Analytical value2 Bias3
Vitamin C
(total ascorbate)
483 ±24 473 ± 11 10 97.9 0.6
1The accepted value of L-ascorbic acid was from the certified value of BCR® 431. 2Values (mean ± SD) are based on 9 replicate analyses. 3Bias = Accepted value – Analytical value. 4The ratio of the analytical value to accepted value expressed as a percentage. 5RSDr, interday relative standard deviation (SD/mean × 100)
53
Table 3.2 L-Ascorbic acid recoveries in frozen fruits and vegetables.
Frozen Produce Recovery (%)
Blueberry 93 ± 2
Strawberry 104 ± 2
Broccoli 105 ± 3
Cauliflower 94 ± 3
Corn 99 ± 5
Green Beans 95 ± 7
Spinach 103 ± 1
Green Peas 98 ± 4
1Values (mean % ± SD) are based on 3 replicate analyses using USP-grade L-ascorbic acid.
54
Table 3.3 L-Ascorbic acid content (mg AA/100 g, f.w.) in selected fresh, fresh-stored, and frozen fruits.1
1Abbreviations: AA – ascorbic acid; f.w. – fresh weight. 2Mean ± SD values calculated based on 18 individual observations. Those followed by a different letter within a column (for each sample) reflect significant differences (p ≤ 0.05) according to ANOVA and means separation with Tukey’s Studentized Range via SAS software. 3U.S.D.A. National Nutrient Database for Standard Reference (R26) sample means ± standard error {SE} (n = number of data points) for: Broccoli, raw; Broccoli, frozen, chopped, unprepared; Cauliflower, raw; Cauliflower, frozen, unprepared; Corn, sweet, yellow, raw; Corn, sweet, yellow, frozen, kernels cut off cob, unprepared; Beans, snap, green, raw; Beans, snap, green, frozen, all styles, unprepared; Peas, green, raw; Peas, green, frozen, unprepared; Spinach, raw; Spinach, frozen, chopped or leaf, unprepared; Blueberries, raw; Blueberries, frozen, unsweetened; Strawberries, raw and Strawberries, frozen, unsweetened. 4W/S –Winter/Spring.
1The accepted value of trans-β-carotene is calculated from the certified value of BCR® 485 based on the % mass fraction. 2Values (mean ± SD) are based on 5 replicate analyses. 3Bias = Accepted value – Analytical value. 4The ratio of the analytical value to accepted value expressed as a percentage. 5RSDr, interday relative standard deviation (SD/mean × 100)
84
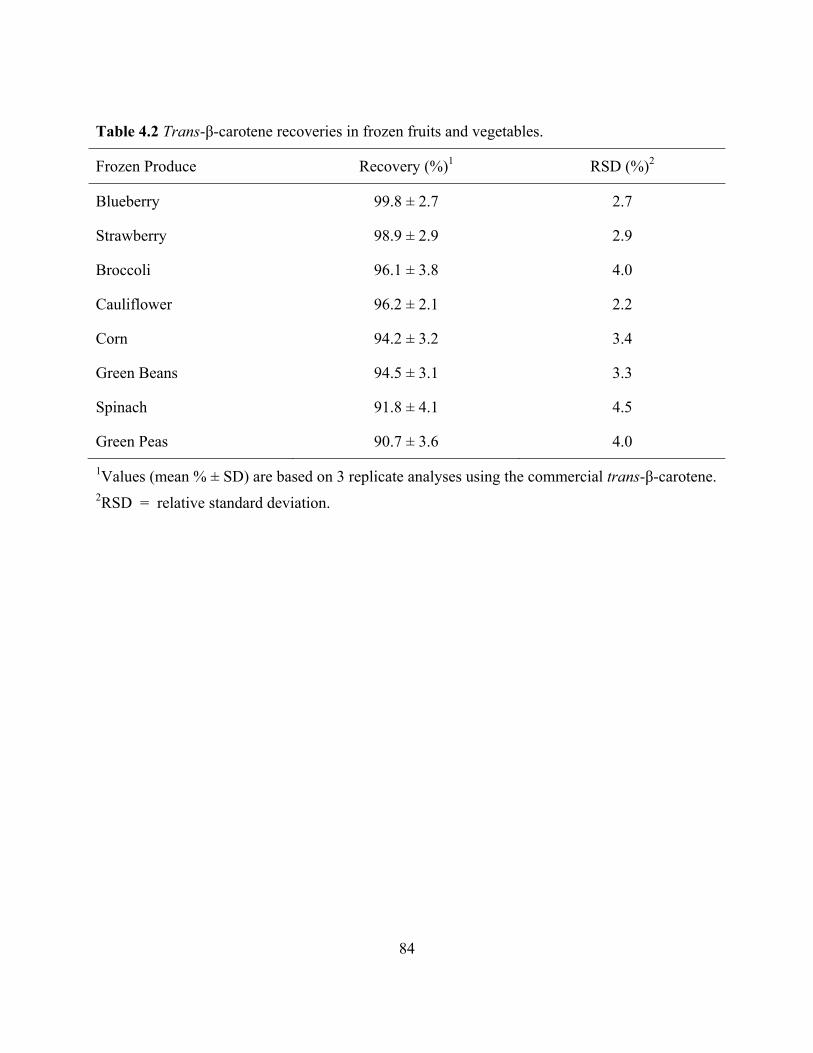
Table 4.2 Trans-β-carotene recoveries in frozen fruits and vegetables.
Frozen Produce Recovery (%)1 RSD (%)2
Blueberry 99.8 ± 2.7 2.7
Strawberry 98.9 ± 2.9 2.9
Broccoli 96.1 ± 3.8 4.0
Cauliflower 96.2 ± 2.1 2.2
Corn 94.2 ± 3.2 3.4
Green Beans 94.5 ± 3.1 3.3
Spinach 91.8 ± 4.1 4.5
Green Peas 90.7 ± 3.6 4.0
1Values (mean % ± SD) are based on 3 replicate analyses using the commercial trans-β-carotene. 2RSD = relative standard deviation.
85
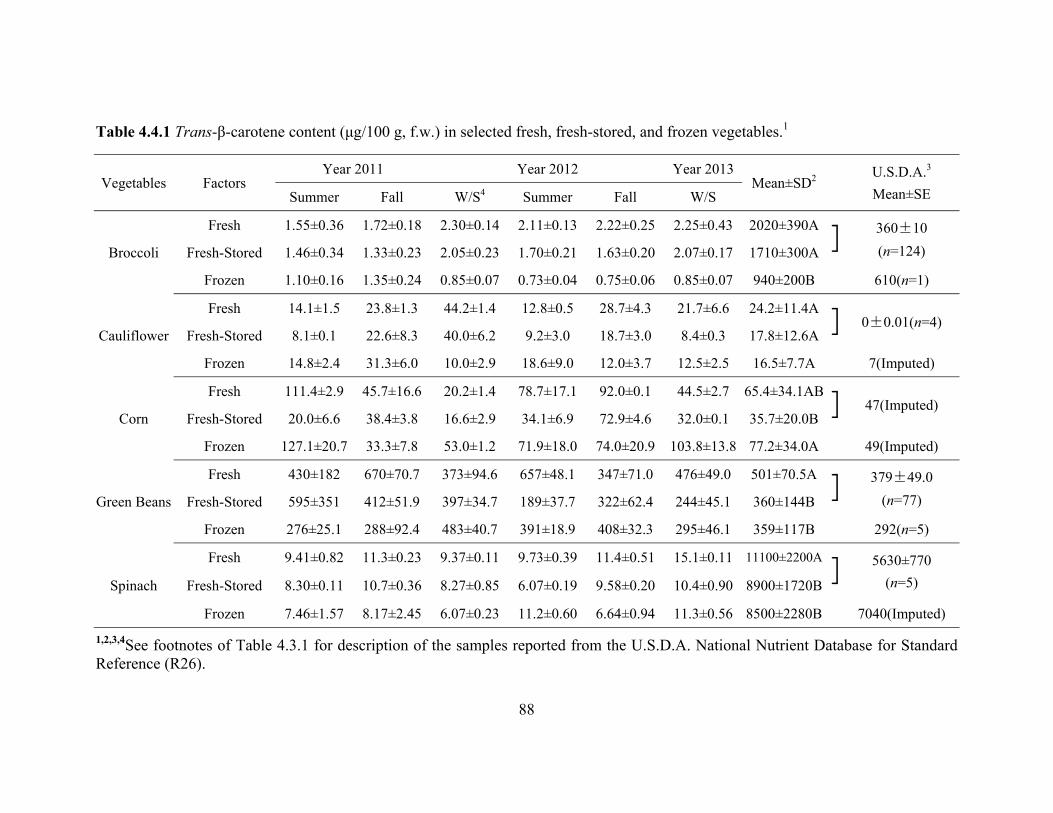
Table 4.3.1 Trans-β-carotene content (μg/100 g, f.w.) in selected fresh, fresh-stored, and frozen fruits.1
1f.w. – fresh weight. 2Mean±SD values calculated based on 18 individual observations. Those followed by a different letter within a column (for each sample) reflect significant differences (p≤0.05) according to ANOVA and means separation with Tukey’s Studentized Range via SAS software. 3U.S.D.A. National Nutrient Database for Standard Reference (R26) sample means ± standard error {SE} (n = number of data points) for: Broccoli, raw; Broccoli, frozen, chopped, unprepared; Cauliflower, raw; Cauliflower, frozen, unprepared; Corn, sweet, yellow, raw; Corn, sweet, yellow, frozen, kernels cut off cob, unprepared; Beans, snap, green, raw; Beans, snap, green, frozen, all styles, unprepared; Peas, green, raw; Peas, green, frozen, unprepared; Spinach, raw; Spinach, frozen, chopped or leaf, unprepared; Blueberries, raw; Blueberries, frozen, unsweetened; Strawberries, raw and Strawberries, frozen, unsweetened. 4W/S –Winter/Spring.
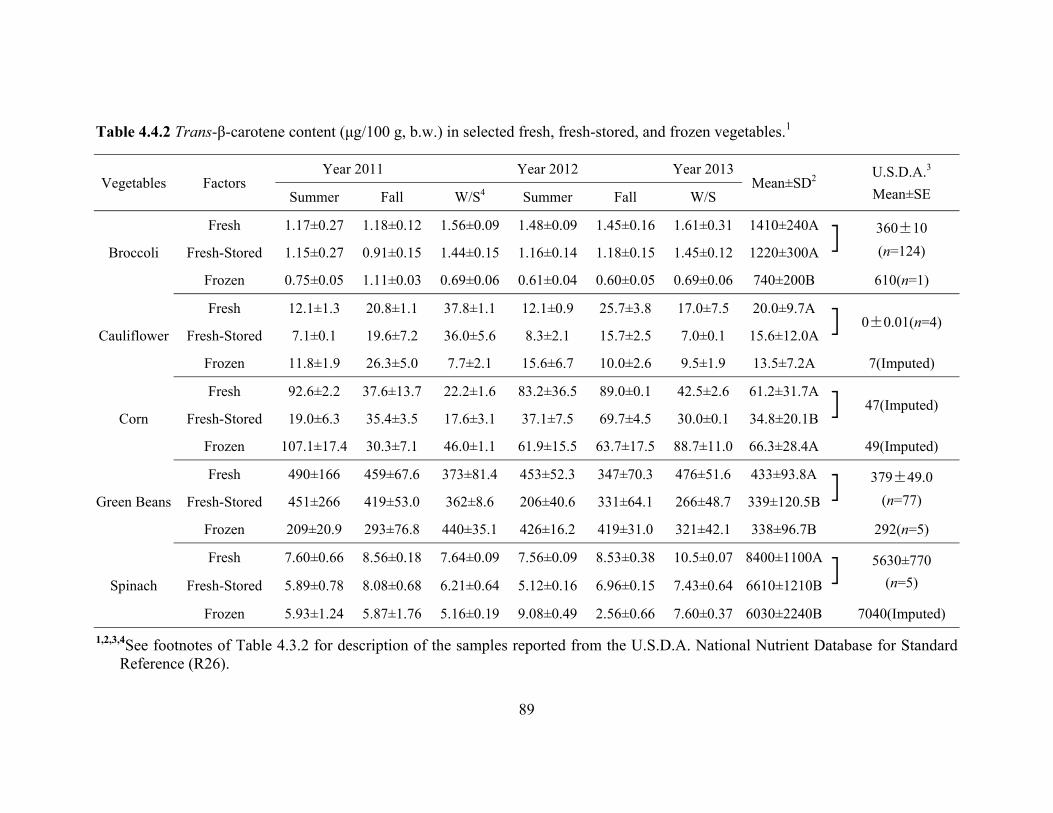
Table 4.3.2 Trans-β-carotene content (μg/100 g, b.w.) in selected fresh, fresh-stored, and frozen fruits.1
1b.w. – blanched weight. 2Mean±SD values calculated based on 18 individual observations. Those followed by a different letter within a column (for each sample) reflect significant differences (p≤0.05) according to ANOVA and means separation with Tukey’s Studentized Range via SAS software. 3U.S.D.A. National Nutrient Database for Standard Reference (R26) sample means ± standard error {SE} (n = number of data points) for: Broccoli, raw; Broccoli, frozen, chopped, unprepared; Cauliflower, raw; Cauliflower, frozen, unprepared; Corn, sweet, yellow, raw; Corn, sweet, yellow, frozen, kernels cut off cob, unprepared; Beans, snap, green, raw; Beans, snap, green, frozen, all styles, unprepared; Peas, green, raw; Peas, green, frozen, unprepared; Spinach, raw; Spinach, frozen, chopped or leaf, unprepared; Blueberries, raw; Blueberries, frozen, unsweetened; Strawberries, raw and Strawberries, frozen, unsweetened. 4W/S –Winter/Spring.
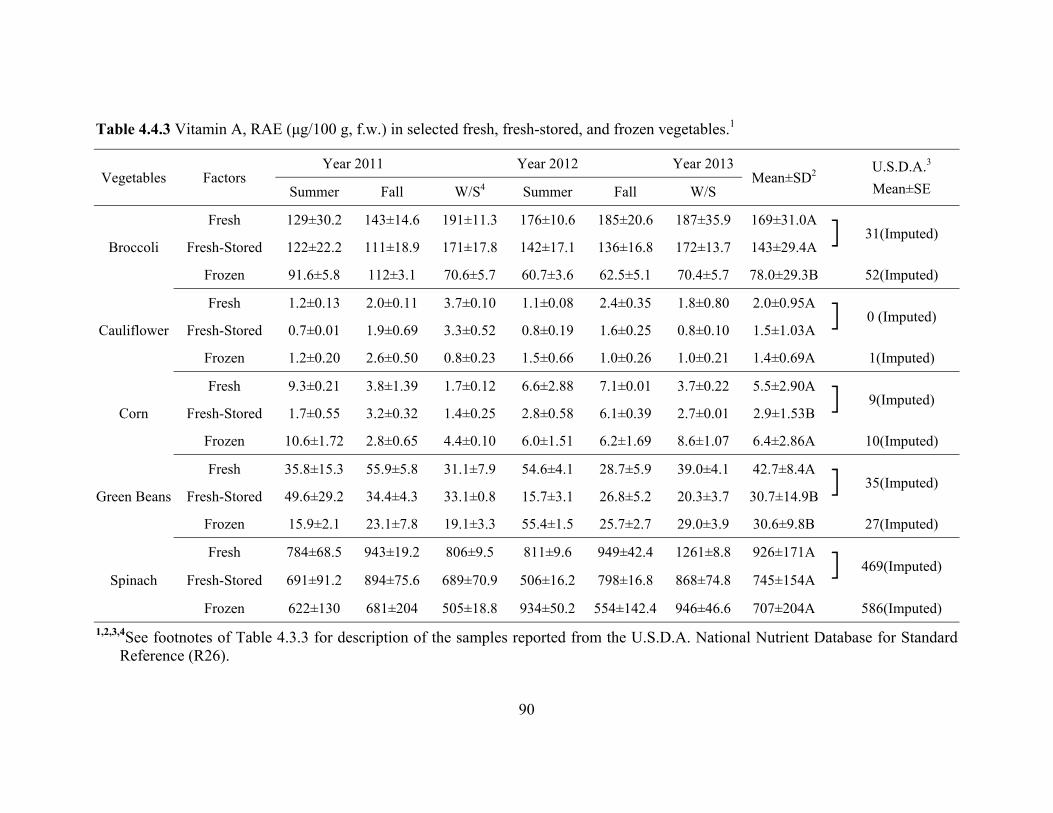
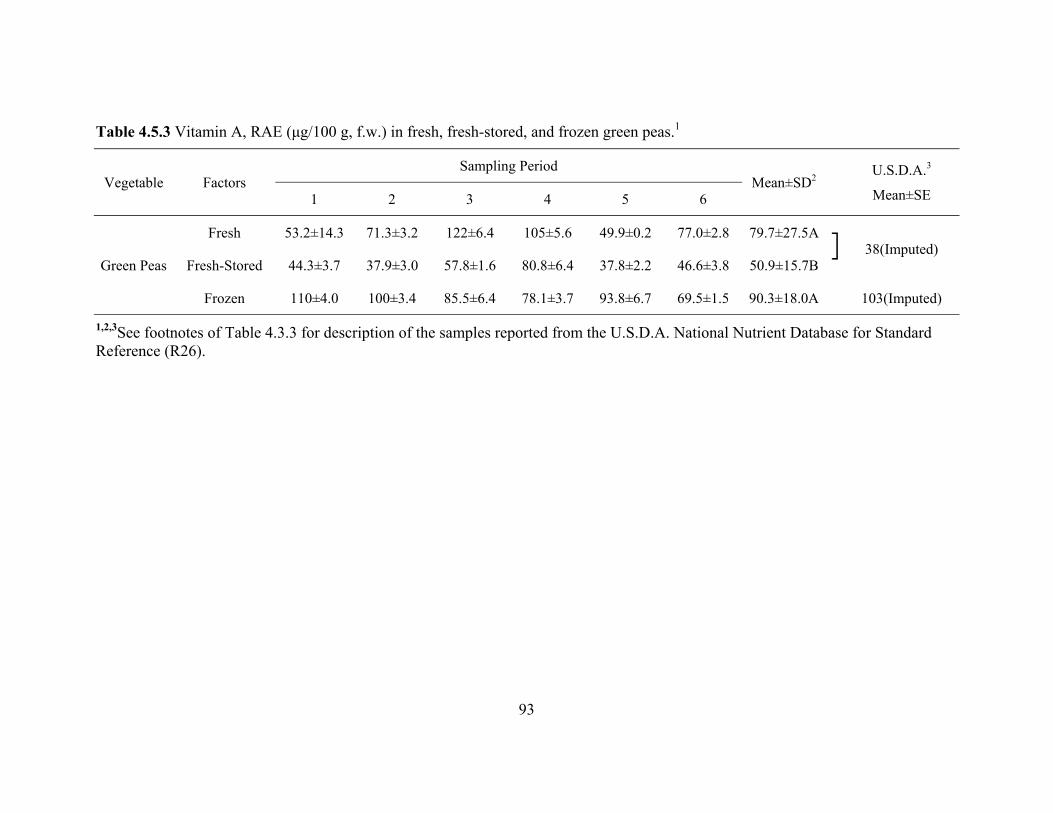
Table 4.3.3 Vitamin A, RAE (μg/100 g, f.w.) in selected fresh, fresh-stored, and frozen fruits.1
1f.w. – fresh weight. 2Mean±SD values calculated based on 18 individual observations. Those followed by a different letter within a column (for each sample) reflect significant differences (p≤0.05) according to ANOVA and means separation with Tukey’s Studentized Range via SAS software. 3U.S.D.A. National Nutrient Database for Standard Reference (R26) sample means ± standard error {SE} (n = number of data points) for: Broccoli, raw; Broccoli, frozen, chopped, unprepared; Cauliflower, raw; Cauliflower, frozen, unprepared; Corn, sweet, yellow, raw; Corn, sweet, yellow, frozen, kernels cut off cob, unprepared; Beans, snap, green, raw; Beans, snap, green, frozen, all styles, unprepared; Peas, green, raw; Peas, green, frozen, unprepared; Spinach, raw; Spinach, frozen, chopped or leaf, unprepared; Blueberries, raw; Blueberries, frozen, unsweetened; Strawberries, raw and Strawberries, frozen, unsweetened. 4W/S –Winter/Spring.
of the prepared phosphate buffer and water at a ratio of 1:20 (v/v) was used for background
correction. The purity of the folic acid in the test sample was calculated as follows:
E1%1cm = 10 × (Astd – Ablank)/C
where, Astd is the absorbance of the test solution; Ablank is the absorbance of the reagent blank;
and C is the concentration of the diluted folic acid stock solution (mg/mL).
The reported E1%1cm for folic acid at λ = 282 nm in a 0.1 M phosphate buffer at pH 7.0 is
611.7 (Eitenmiller, Landen, & Ye, 2007); thus, the purity of the standard prepared for the
experiment and its true concentration are calculated as follows:
Purity = the calculated E1%1cm/611.7 × 100
Concentration (mg/mL) = (exact mass of folic acid weighed in mg/100 mL) × purity/100
Preparation of the folic acid standard and calibration solutions
A working solution of folic acid standard (~2 ng/mL) was prepared freshly before each
microplate assay. Briefly, a tube of the folic acid stock solution (~200 μg/mL) was removed from
the refrigerator and tempered to room temperature. A 100-µL aliquot was transferred via a
Gilson Pipetman Neo® to a Pyrex® 100-mL Class A low-actinic (red) volumetric flask, diluted to
mark with deionized water and mixed well. Once mixed, a 1,000-µL aliquot of the first diluted
standard was transferred via a Gilson Pipetman Neo® to a second Pyrex® 100-mL Class A low-
actinic (red) volumetric flask; the flask was diluted to mark and mixed well. Working standards
and sample extracts were assayed under identical conditions for each microplate. Standard
curves were checked every day to ensure consistency in the microbiological assay.
114
Accuracy
In this study, a CRM from the European Commission Joint Research Center, Institute for
Reference Materials and Measurements, BCR® 485 (mixed vegetables), was purchased from the
Resource Technology Corporation (Laramie, WY). Accuracy was assessed by comparing the
data value obtained for a measurement to that of the accepted value of the CRM. Bias, which is
defined as the difference between the analytical value from that of the accepted value provided
on the CRM’s certificates of analysis, was also determined (Horwitz, 2003). The bias and %
accepted value were calculated as follows:
Bias = μ – x
Accepted value (%) = x/μ × 100
where, x is the analytical value; and μ is the accepted value provided by the certificate of
analysis of the reference sample.
Recovery is defined as the fraction of the analyte measured after addition of a known
quantity of the analyte to the sample. Recovery was determined on the basis of AOAC guidelines
(2000). Ground fruit and vegetable samples as well as the BCR® 485 (mixed vegetables) CRM
were spiked with known levels of folic acid. Final spiking levels per gram of sample were 1.57,
3.15, and 4.72 μg, which represent levels of 50, 100, and 150%. Each spiking experiment was
performed in triplicate. The % recovery of the added folic acid standard was calculated as
follows:
Recovery (%) = [(Cs – Cp)/Ca] × 100
where, Cs is the folic acid concentration in the spiked sample; Cp is the folic acid concentration
in the unspiked sample; and Ca is the mass of the folic acid standard added.
115
Precision
Precision, or reproducibility, is the degree to which repeated measurements under
unchanged conditions show the same results. BCR® 485 was employed as the CRM for
validation of folic acid analyses, as noted above. The precision of the assay was determined by
repeatability (intraday precision) and intermediate precision (interday precision) of the CRM.
Precision was determined from 22 replicates of the CRM over 4 days.
Precision can be approximated as the relative standard deviation between trials and can
be expressed as:
%RSD = (SD × 100)/ x
where, %RSD is the relative standard deviation; SD is the standard deviation; and x is the mean.
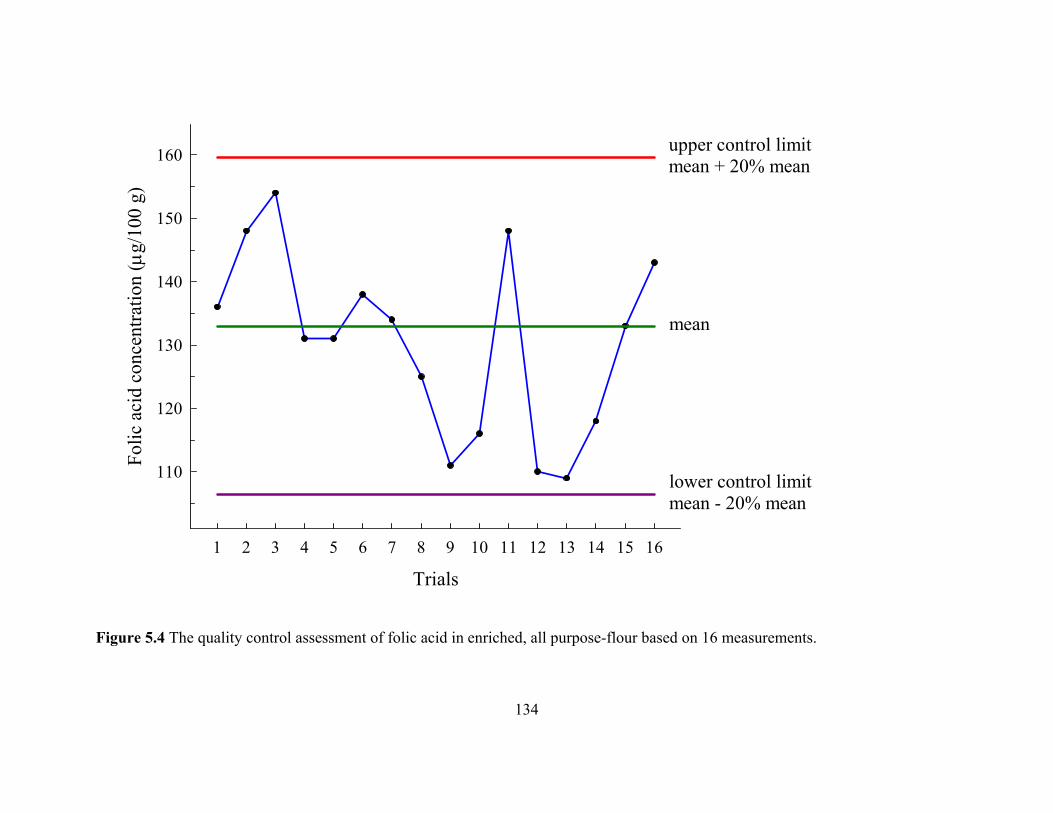
Quality control chart
As an internal quality control measure, the folic acid-fortified Gold Medal, enriched, all-
purpose flour (Kroger, Athens, GA) was extracted by the trienzyme assay described above. From
the nutrition label, 30 g of this flour contains 10% folic acid, based on the recommended daily
value of 400 µg. Therefore, the folic acid concentration in flour is ~133 µg/100 g flour. For QC
analysis, a mean line, upper control limit (UCL = mean + 20% of the mean), and lower control
limit (LCL = mean - 20% of the mean) were established. Each data point was plotted on the QC
chart with a corresponding number. When a value fell outside of either the UCL or LCL, the
assay was considered invalid and the sample analysis from the run discarded. Routine monitoring
of the QC chart was performed to ensure that there was no contaimination, excessive bacterial
growth, or other similar problems with the microplate.
116
5.5 Data Analysis
The folate contents in fresh, fresh-stored, and frozen samples were assessed within
blueberries, strawberries, broccoli, cauliflower, corn, green beans, spinach, and green peas. The
analyses were performed over the span of two years in 6 distinct time frames, namely Summer to
Fall 2011, Fall 2011 to Winter 2012, Winter to Spring 2012, Summer to Fall 2012, Fall 2012 to
Winter 2013, and Winter to Spring 2013 (see format of Table 5.1). Within each time period, the
folate content was measured in triplicate for all combinations of treatments and samples. The
data for each time frame, although reported individually in the results, are treated as replicates in
our statistical analysis of the differences among treatments. Therefore, the folate content of each
treatment/sample combination was assessed according to 18 replications.
For each of the 8 sample-types (i.e., each specific fruit or vegetable), one-way ANOVA
was performed to determine the presence of significant difference in folate contents according to
treatment (α=0.05). Data transformation was applied when necessary to adequately meet the
assumption of normal distribution for ANOVA, and the Weighted Least Squares method was
employed in the instances in which the equal variance assumption of the ANOVA was violated.
All necessary statistical diagnostic checks (e.g., residuals versus predicted value plot, Q–Q plot
of residuals, and histogram plot of residuals) were performed to verify acceptability of ANOVA
implementation. In the cases in which a statistically significant difference was observed among
the three treatments, the Tukey’s Studentized Range multiple comparisons test was performed to
determine which specific pairs of treatments (i.e., fresh vs. frozen, fresh vs. fresh-stored, and
fresh-stored vs. frozen) showed significant differences from one another (α=0.05).
117
All data analyses were performed using SAS software, version 9 of the SAS system for
Windows (SAS Institute Inc., Cary, NC).
5.6 Results and Discussion
Quality Control
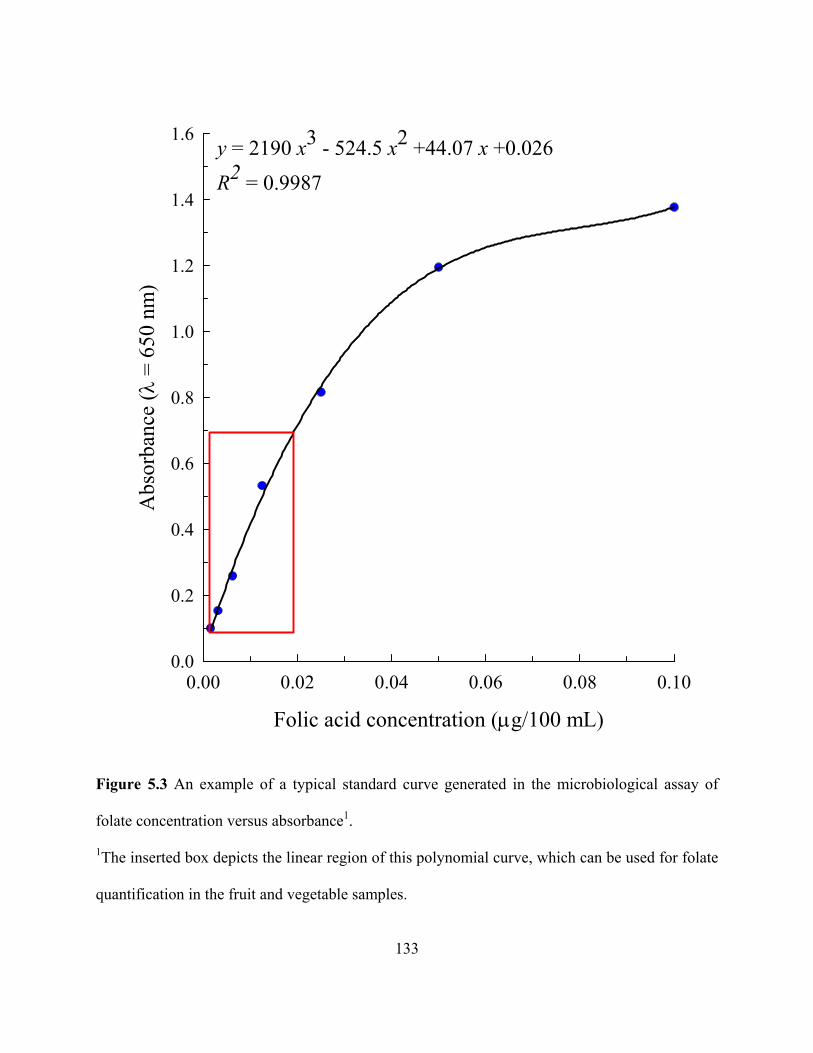
The purity of the folic acid stock standard was 98.0%. On the basis of the purity check,
the concentration in the stock standard solution was 196 μg/mL. For the daily working standard,
the stock solution was diluted with deionized water to give concentrations of 1.96 ng folic
acid/mL. The levels of folic acid equivalents in the fruit and vegetable samples were then
determined from the calibration curve. A typical calibration curve of folic acid concentration
versus absorbance is depicted in Figure 5.3. Non-linear regression gave a third-degree
polynomial equation of y = 2189.7x3 – 524.48x2 + 440.66x + 0.0263 with a correlation
coefficient (R2) of 0.9987. The microplate reader was programmed to calculate a polynomial
equation for the folic acid standard of each plate. In other words, a new standard curve was
generated for each plate assayed.
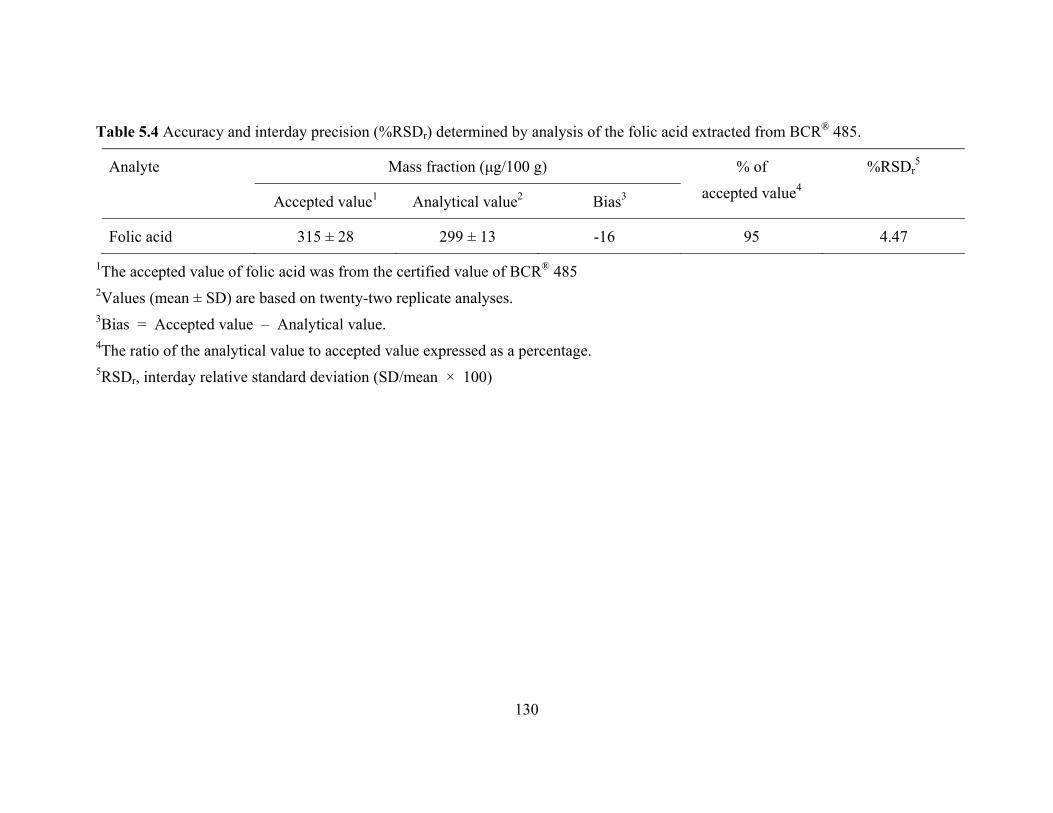
Accuracy
Accuracy and %RSDr measures for the folic acid analysis by the microplate protocol are
given in Table 5.4. Folic acid was extracted from BCR® 485 (mixed vegetables) and analyzed.
According to its certificate of analysis, the CRM contains 315 ± 28 μg of folic acid/100 g.
Comparison of the analytical value to the accepted value from the certified value of the CRM
was within the accepted range reported for BCR® 485. The bias value was negative. The ratio of
the analytical value to the accepted valued expressed as a percentage (% of accepted value) can
118
be used to evaluate accuracy. The percentage of analytical value to acceptable value was 95%.
Together, the accuracy and %RSDr measures indicated that the folic acid analyses of the fruit
and vegetable samples by the microplate assay were accurate and repeatable. The recoveries of
folic acid from BCR® 485 at spike levels of 50, 100, and 150% were 95 ± 4, 100 ± 9, and 107 ±
9%, respectively. The recoveries ranged from 92 to 108%. The high recoveries validate the
accuracy of the folic acid analysis performed. Noteworthy is that many nutrient profiling studies
fail to report on these parameters.
Precision
Intraday precision (repeatability) was determined by running 22 replicates of the CRM
over 4 days. The RSD of these data was calculated and shown to be less than 5%. The daily
(intraday) and day-to-day (interday) precision of the CRM gave the following results: based on
n=4, the folic acid analysis of the CRM showed a daily RSD of 5.62%. In terms of interday
precision, the folic acid analysis of BCR® 485 gave a RSDr of 4.47%. In both cases, the %RSD
values were determined to be well within the ±10% limit, indicating that the current method is
repeatable. A QC chart was also used to monitor the status of the assay. An example is depicted
in Figure 5.4; here, 16 folic acid concentrations from the QC flour sample were collected on 4
days over a two week period. All folic acid concentrations fell within the UCL and LCL, thereby
indicating that the experimental conditions were constant during this period.
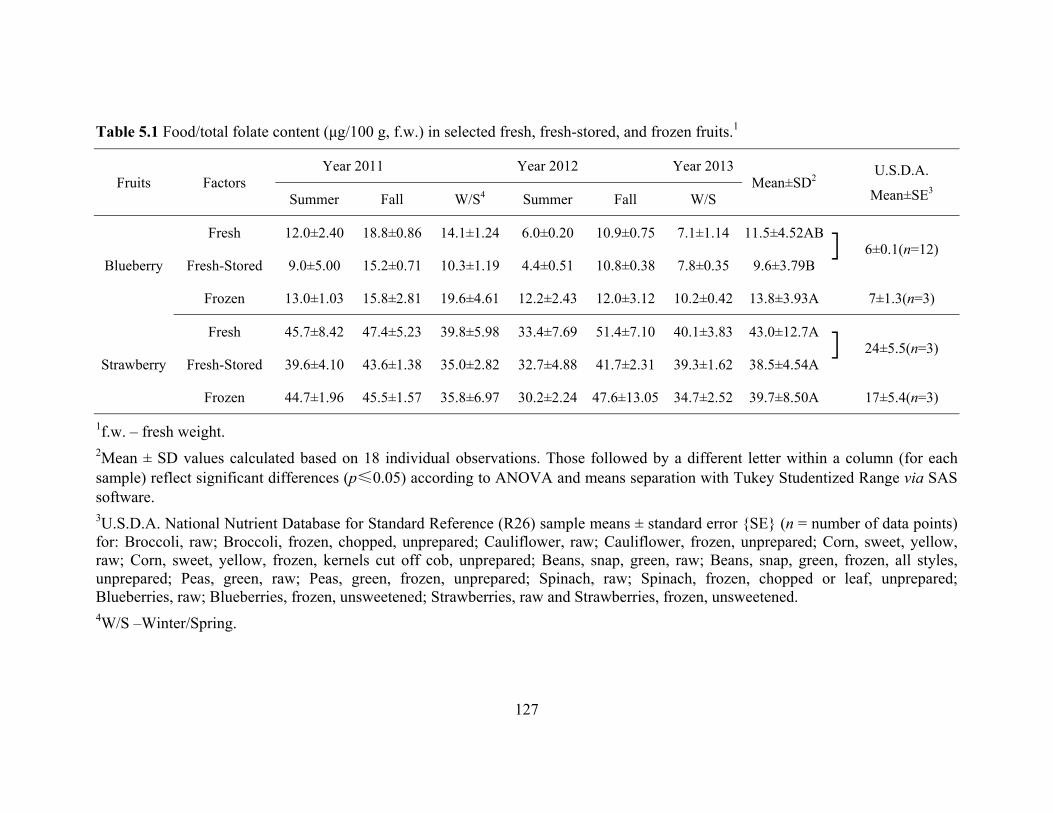
Table 5.1 reports the folate contents (as folic acid equivalents) in fresh, fresh-stored, and
frozen blueberries and strawberries; the mean values for blueberries were 11.5 ± 4.5, 9.6 ± 3.8,
and 13.8 ± 3.9 μg/100 g, f.w., respectively. For blueberries, the folate contents determined in this
study over a two year period were almost double of the corresponding values reported in the
119
U.S.D.A. National Nutrient Database for Standard Reference (R26), hereinafter referred to
simply as Database. It seems that the folate content of fresh blueberries in 2011 was greater than
that in 2012. Many different factors including the source of the blueberries, environmental
factors, and age of the “fresh” product at the time of purchase can cause such variation. Roughly
a 17% decrease of folate in fresh blueberries stored at 4 °C for 5 days after purchase was noted.
The mean folate content in frozen blueberries was greater than that of fresh and fresh-stored
blueberries. While the difference was not significant (p > 0.05) for fresh blueberries, it was,
however, for the fresh-stored samples. Moreover with the frozen blueberries, there was less
variation in the range of values over the time periods examined (i.e., 10.2 to 19.6 μg/100 g). This
conclusion is different from that reported in the Database.
The mean folate contents of fresh, fresh-stored, and frozen strawberries, reported in Table
5.1, were 43 ± 12.7, 38.5 ± 4.5, and 39.7 ± 8.5 μg/100 g, f.w., respectively. For all strawberries,
no significant difference (p > 0.05) was found in the folate contents. Roughly a 10% decrease in
the folate content of the fresh-bought strawberries was observed after 5 days of storage at 4 °C.
Our results indicate that the folate contents in both fresh and frozen products were 1.5 to 2×
greater than the corresponding Database values. Moreover, the folate data from this study was
found to be in line with those of other studies. For instance, Strålsjö, Witthöft, Sjöholm, &
Jägerstad (2003a) reported that the average folate concentration in 13 different strawberry
cultivars was 47 ± 9 µg/100 g, whereas the Database average in fresh strawberries was only 24 ±
5.5 µg/100 g; we report a mean of 43 ± 12.7 µg/100 g. Strålsjö, Åhlin, Witthöft, & Jastrevova
(2003) noted that the folate content in the best 8 cultivars (in terms of folate levels) varied from
73 (Lina) to 99 (Melody) µg/100 g. In a more recent study, Tulipani et al. (2008) reported that
120
the folate levels in 9 different strawberry cultivars ranged quite markedly from 12.8 to 96 µg/100
g. This study also listed greater folate contents compared to the Database. Using an HPLC assay,
Vahteristo, Lehikoinen, Ollilainen, & Varo (1997) reported a content of 36 µg folate/100 g fresh
strawberries.
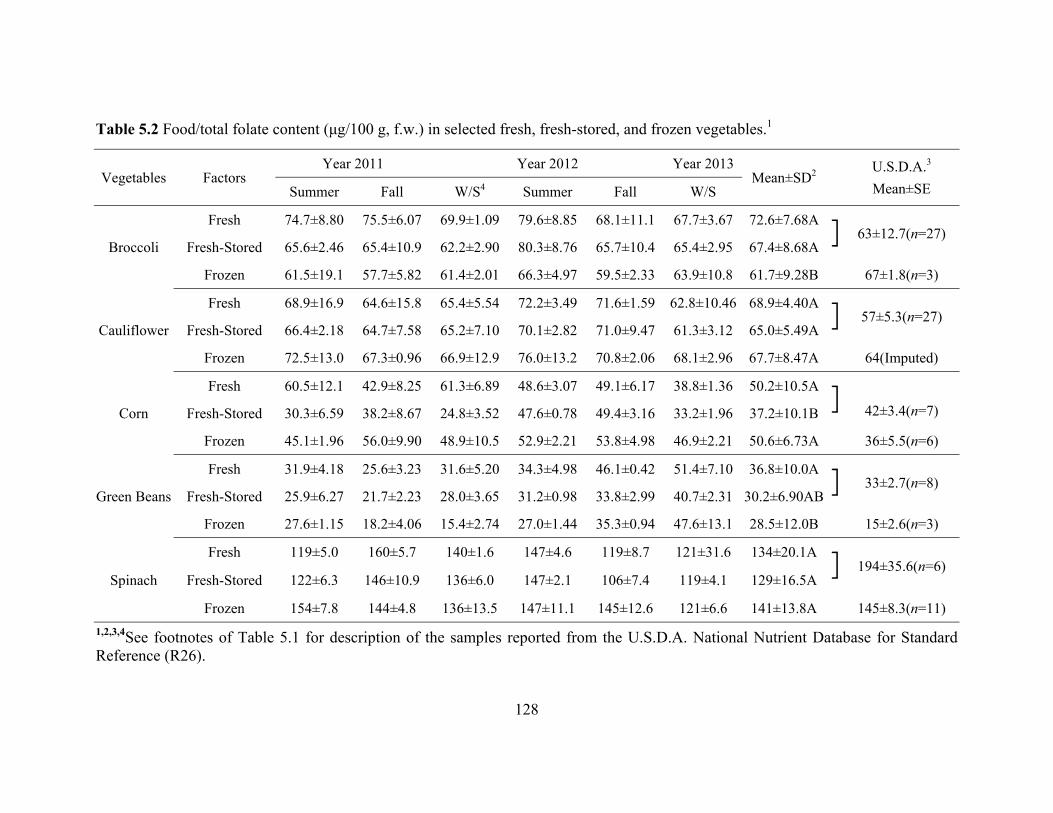
Table 5.2 summarizes the mean folate contents of fresh, fresh-stored, and frozen produce
based on the f.w. for broccoli, cauliflower, corn, green beans, and spinach. The mean values for
fresh, fresh-stored, and frozen broccoli were 72.6 ± 7.7, 67.4 ± 8.7, and 61.7 ± 9.3 μg folic acid
equivalents/100 g, f.w., respectively. There were no statistical (p > 0.05) differences between the
fresh and fresh-stored test samples, but frozen broccoli was lower in folate and statistically (p <
0.05) different from its fresh counterparts. Studies have indicated a loss of folate resulting from
blanching of fresh broccoli. Specifically, DeSouza and Eitenmiller (1986) observed losses of 60
and 9% after water and steam blanching, respectively, compared with fresh broccoli. It should be
noted that neither the fresh nor fresh-stored broccoli analyzed in this study was blanched, as
samples from the composite were immediately placed in a phosphate buffer. The frozen broccoli,
however, had been blanched prior to freezing and this may account for why its mean folate
content is statistically (p < 0.05) different from its fresh counterparts. For fresh broccoli, the
values determined in this study were slightly greater than the value of 63 ± 12.7 μg folic acid
equivalents/100 g, f.w. listed in the Database, based on 27 observations. Even though not
statistically different, roughly a 7.2% loss in folate content was noted in fresh broccoli stored at
4 °C for 5 days after purchase.
The mean folate contents for fresh, fresh-stored, and frozen cauliflower were 68.9 ± 4.4,
65.0 ± 5.5, and 67.7 ± 8.5 μg folic acid equivalents/100 g, f.w., respectively, and there were no
121
statistical (p > 0.05) differences. The folate content in fresh cauliflower was slightly greater than
the 57 ± 5 μg/100 g, f.w. value reported in the Database based on 27 observations. For the frozen
cauliflower samples analyzed in this study, the folate level was similar to the imputed value of
64 μg/100 g, f.w. listed in the Database. Fresh cauliflower stored at 4 °C for 5 days after
purchase showed only a 6% decrease in its folate. Other studies have reported higher folate
contents in fresh cauliflower than those in this work. For instance, Puupponen-Pimiä et al. (2003)
reported 122 μg folate/100 g fresh cauliflower, while Vahteristo et al. (1997) found 85 µg/100 g
fresh cauliflower. It was suggested that the difference in folate contents was due to variability in
the cultivars tested. It should be pointed out, however, that the microbiological assay for folate
can lead to erroneous data if the protocol is not followed carefully and a quality control plan is
not in place to monitor the repeatability and precision of the assay.
The mean folate contents for fresh, fresh-stored, and frozen corn were 50.2 ± 10.5, 37.2 ±
10.1, and 50.6 ± 6.7 μg folic acid equivalents/100 g, f.w., respectively. Even though the absolute
mean for frozen corn was higher than its fresh counterpart, the values were not statistically
(p >0.05) different. On the other hand, the folate in frozen corn was significantly (p < 0.05)
greater than that of the fresh-stored produce. Both the contents of folate in the fresh and frozen
corn were found to be higher than the Database values of 42 ± 3.4 and 36 ± 5.5 μg folic acid
equivalents/100 g, f.w., respectively. In this study, a 26% decrease in folate was noted in fresh
corn-on-the-cob stored at 4 °C for 5 days after purchase. Twenty-six was the highest percentage
of folate loss amongst the fresh fruits and vegetables examined in this study. Just as it was for
vitamin A, the findings suggest that there is a great nutritional advantage of frozen corn when it
comes to folate compared to fresh corn.
122
The mean folate contents for fresh, fresh-stored, and frozen green beans were 36.8 ± 10.0,
30.2 ± 6.9, and 28.5 ± 12.0 μg folic acid equivalents/100 g, f.w., respectively. The fresh green
beans possessed a statistically (p < 0.05) greater content of folate than the frozen produce, which
was not statistically (p > 0.05) different from that of the fresh-stored green beans. Again it should
be noted that neither the fresh nor fresh-stored green beans analyzed in this study was blanched,
as samples from the composite were immediately placed in a phosphate buffer. The frozen green
beans, however, were blanched prior to freezing and this may account for why its mean folate
content is statistically (p < 0.05) different from its fresh counterpart. The content of folate in
fresh green beans determined by this study was similar to the Database value of 33 ± 2.7 μg folic
acid equivalents/100 g, f.w. (n=8), but 2× that of the frozen value of 15 ± 2.6 (n=3). An 18%
decrease in folate was noted in fresh green beans stored at 4 °C for 5 days after purchase.
Of all of the fruits and vegetables examined, spinach contained the highest content of
folate. The mean values for the fresh, fresh-stored, and frozen produce were 134 ± 20.1, 129 ±
16.5, and 141 ± 13.8 μg folic acid equivalents/100 g, f.w., respectively. No statistical (p > 0.05)
differences were noted in the folate content of the spinach types. The spinach samples analyzed
in this study had levels of folate lower than that reported in the Database (194 ± 35.6, based on 6
observations). However, the result was consistent with the study by Rychlik (2004), who found
the folate in fresh spinach varied from 96.1 to 159.2 µg/100 g. Pandrangi and LaBorde (2004)
reported total folate in commercially-packaged spinach ranged between 84 and 225 µg/100 g
with a mean value of 160 ± 42 µg/100 g. The folate level for the frozen spinach was not
statistically (p > 0.05) different from the Database value of 145 ± 8.3, based on 6 observations.
De Souza and Eitenmiller (1986) reported a 60% loss in folic acid for blanched spinach, whereas
123
Cooper, Chen, & King (1983) found that blanching in boiling water for 3 min resulted in a 33%
loss compared with fresh spinach and microwave blanching without water, which only had a 14%
loss relative to fresh spinach. It indicated that blanching can result in great loss of folate, but
varying times and methods can lead to different quantities of folate being lost due to blanching.
It is interesting to note that the frozen spinach sample possessed the highest mean folate content,
albeit it not statistically (p > 0.05) different from the fresh samples; yet, it was the only blanched
sample. Roughly a 4% loss was found in fresh spinach on average after being stored at 4 °C for 5
days after purchase. On the other hand, Chen, Song, & Kirsch (1983) found a 26% decrease in
folate content of spinach stored at 4 °C for 7 days. These authors suggested that blanching and
immediate freezing of spinach can retain more than 80% of the folacin in the fresh spinach when
the air was excluded from the packaging.
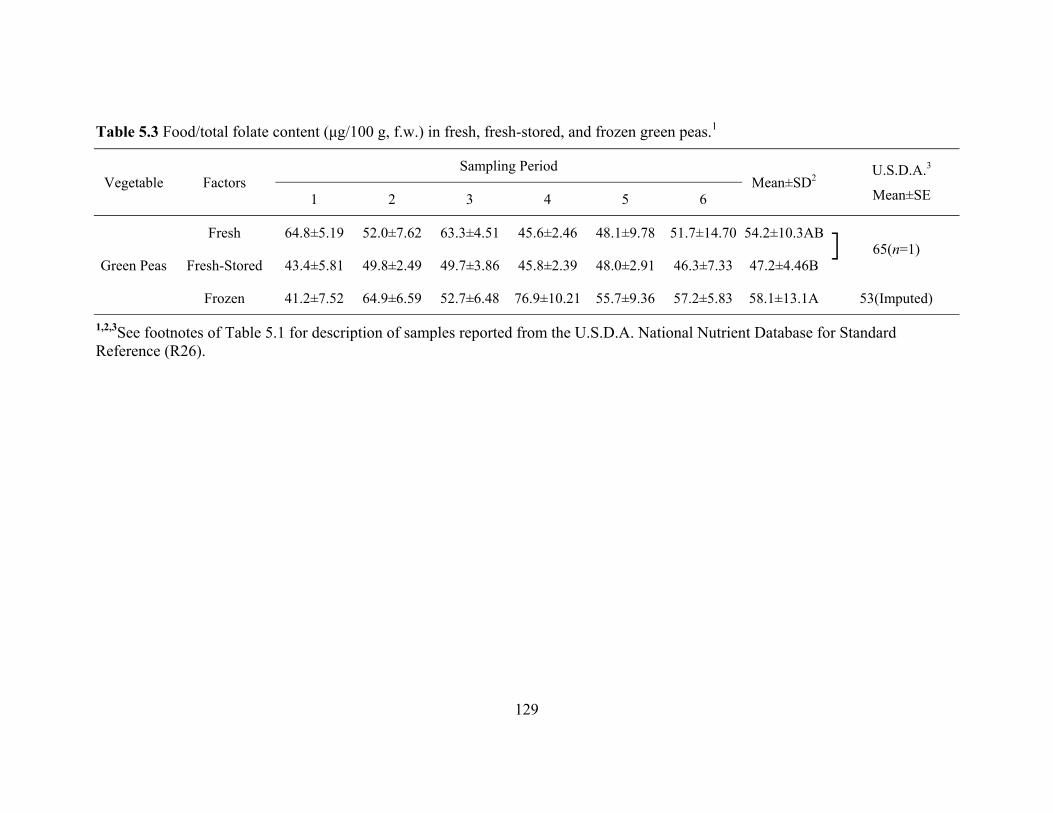
Unlike the other produce, fresh green peas (also referred to as English peas) could only
be procured in the spring of both years of the study; hence, Table 5.3 reports sampling times as
opposed to seasons and gives the folate content of fresh, fresh-stored, and frozen green peas
based on their fresh weight; the mean values were 54.2 ± 10.3, 47.2 ± 4.5, and 58.1 ± 13.1
μg/100 g, f.w., respectively. Even though the absolute mean for frozen green peas was higher
than its fresh counterpart (58.1 vs. 54.2 μg folic acid equivalents/100 g, f.w.), the values were not
statistically (p > 0.05) different. On the other hand, the folate in frozen green peas was
significantly (p < 0.05) greater than that of the fresh-stored produce. The content of folate
determined from this research for fresh green peas was found to be less than the Database value
of 65 μg folic acid equivalents/100 g, f.w. based on a single observation. Stea, Johansson,
Jägerstad, & Frølich (2006) found 47.9 µg/100 g of folate in raw green peas. In the case of
124
frozen green peas, the Database lists an imputed value of 53 μg folic acid equivalents/100 g, f.w.
Roughly a 13% loss was observed in fresh green peas after storage at 4 °C for 5 days. Selman
(1994) noted that the folate content in boiled green peas was much lower than raw green peas.
Although there might be some loss in blanching because of the water solubility of folate, the
high retention of folate in frozen storage compensated for this.
References
Center for Disease Control (CDC). (1999). Knowledge and use of folic acid by women of
childbearing age. Morbidity and Mortality Weekly Report 48:325–327.
Chen, T. S., Song, Y. O., & Kirsch, A. J. (1983). Effects of blanching, freezing and storage on
folacin content of spinach. Nutrition Reports International 28:317–24.
Cooper, R. G., Chen, T. S., & King, M.A. (1983).Thermal destruction of folacin in microwave
and conventional heating. Journal of the American Dietetic Association 73:406–410.
de Brouwer, V., Zhang, G-F., Storozhenko, S., van der Straeten, D., & Lambert, W. E. (2007).
pH stability of individual folates during critical sample preparation steps in prevision of the
analysis of plant folates. Phytochemical Analysis 18:496–508.
De Souza, S. C., & Eitenmiller, R. R. (1986). Effects of processing and storage on the folate
content of spinach and broccoli. Journal of Food Science 51:626–628.
Eitenmiller, R. R., Landen, W. O., Jr., & Ye, L. (2007). Vitamin Analysis for the Health and
Food Sciences, Second Edition. Boca Raton, FL: CRC Press.
125
Honein, M. A., Paulozzi, L. J., Mathews, T. J., Drickson, J. D., & Wong, L-Y. C. (2001). Impact
of folic acid fortification of the US food supply on the occurrence of neural tube defects.
Journal of the American Medical Association 285:2981–2986.
Konings, E. J. M., Roomans, H. H., Dorant, E., Goldbohm, R. A., Saris, W. H., & van den
Brandt, P. A. (2001). Folate intake of the Dutch population according to newly established
liquid chromatography data for foods. American Journal of Clinical Nutrition 73:765–776.
Lucock, M. (2000). Folic acid: nutritional biochemistry, molecular biology and role in disease
processes. Molecular Genetics and Metabolism 71:121–138.
Pandrangi, S., & LaBorde, L. F. (2004). Retention of folate, carotenoids, and other quality
characteristics in commercially packaged fresh spinach. Journal of Food Science 69:C702–
C707.
Phillips, K. M., Wunderlich, K. M., Holden, J. M., Exler, J., Gebhardt, S. E., Haytowitz, D. B.,
Beecher, G. R., & Doherty, R. F. (2005). Stability of 5-methyltetrahydrofolate in frozen fresh
fruits and vegetables. Food Chemistry 92:587–595.
Puupponen-Pimiä, R., Häkkinen, S., Aarni, M., Suortti, T., Lampi, A-M., Eurola, M., Piironen,
V., Nuutila, A. M., & Oksman-Caldentey, K-M. (2003). Blanching and long-term freezing
affect various bioactive compounds of vegetables in different ways. Journal of the Science of
Food and Agriculture 83:1389–1402.
Rychlik, M. (2004). Revised folate content of foods determined by stable isotope dilution assays.
Journal of Food Composition and Analysis 17:475–483.
Selman, J. D. (1994). Vitamin retention during blanching of vegetables. Food Chemistry 49:137-
147.
126
Stea, T. H., Johansson, M., Jägerstad, M., & Frølich, W. (2006). Retention of folates in cooked,
stored and reheated peas, broccoli and potatoes for use in modern large-scale service
systems. Food Chemistry 101:1095–1107.
Strålsjö, L., Åhlin, H., Witthöft, C. M., & Jastrevova, J. (2003). Folate determination in Swedish
berries by radioprotein-binding assay (RPBA) and high performance liquid chromatography
(HPLC). European Food Research and Technology 216:264–269.
Strålsjö, L. M., Witthöft, C. M., Sjöholm, I. M., & Jägerstad, M.I. (2003). Folate content in
strawberries (Fragaria × ananassa): Effects of cultivar, ripeness, year of harvest, storage,
and commercial processing. Journal of Agricultural and Food Chemistry 51:128–133.
Tulipani, S., Mezzetti, B., Capocasa, R., Bompadre, S., Beekwilder, J., Ric de Vos, C. H.,
Capanoglu, E., Bovy, A., & Battino, M. (2008). Antioxidants, phenolic compounds, and
nutritional quality of different strawberry genotypes. Journal of Agricultural and Food
Chemistry 56:696–704.
Vahteristo, L., Lehikoinen, K., Ollilainen, V., & Varo, P. (1997). Application of an HPLC assay
for the determination of folate derivatives in some vegetables, fruits and berries consumed in
Finland. Food Chemistry 59:589–591.
127
Table 5.1 Food/total folate content (μg/100 g, f.w.) in selected fresh, fresh-stored, and frozen fruits.1
1f.w. – fresh weight. 2Mean ± SD values calculated based on 18 individual observations. Those followed by a different letter within a column (for each sample) reflect significant differences (p≤0.05) according to ANOVA and means separation with Tukey Studentized Range via SAS software. 3U.S.D.A. National Nutrient Database for Standard Reference (R26) sample means ± standard error {SE} (n = number of data points) for: Broccoli, raw; Broccoli, frozen, chopped, unprepared; Cauliflower, raw; Cauliflower, frozen, unprepared; Corn, sweet, yellow, raw; Corn, sweet, yellow, frozen, kernels cut off cob, unprepared; Beans, snap, green, raw; Beans, snap, green, frozen, all styles, unprepared; Peas, green, raw; Peas, green, frozen, unprepared; Spinach, raw; Spinach, frozen, chopped or leaf, unprepared; Blueberries, raw; Blueberries, frozen, unsweetened; Strawberries, raw and Strawberries, frozen, unsweetened. 4W/S –Winter/Spring.
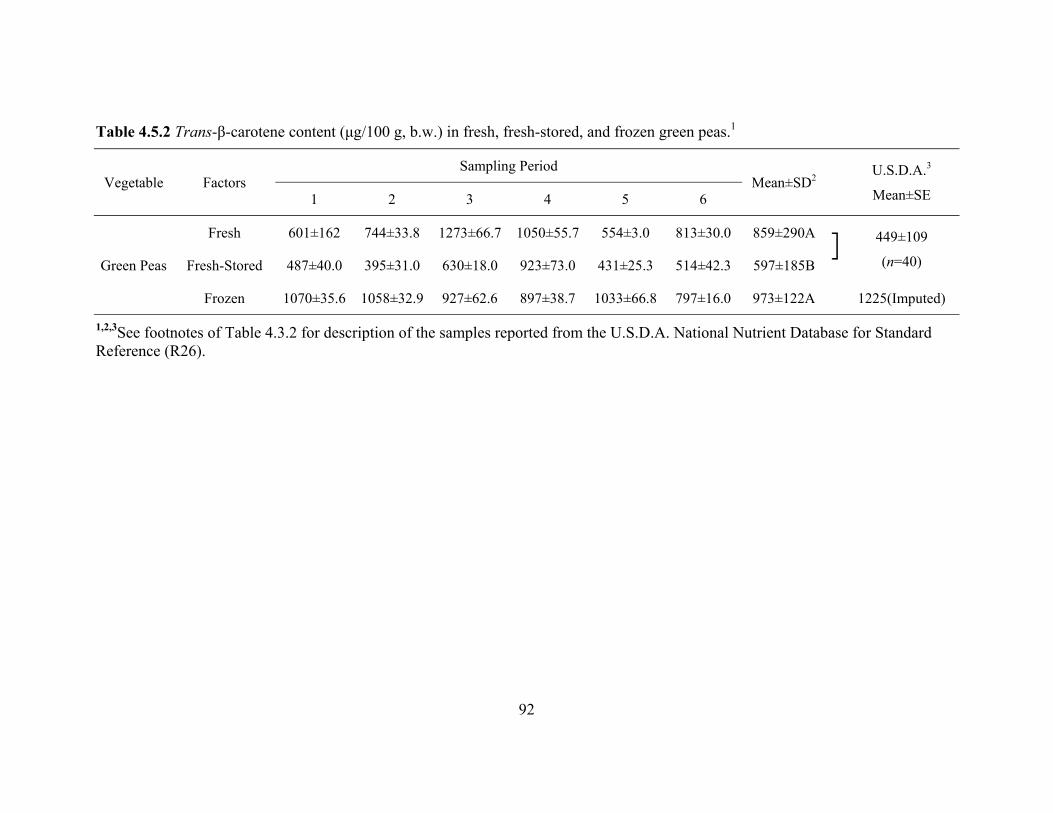
1,2,3See footnotes of Table 5.1 for description of samples reported from the U.S.D.A. National Nutrient Database for Standard Reference (R26).
130
Table 5.4 Accuracy and interday precision (%RSDr) determined by analysis of the folic acid extracted from BCR® 485.
Analyte Mass fraction (μg/100 g) % of
accepted value4
%RSDr5
Accepted value1 Analytical value2 Bias3
Folic acid 315 ± 28 299 ± 13 -16 95 4.47
1The accepted value of folic acid was from the certified value of BCR® 485 2Values (mean ± SD) are based on twenty-two replicate analyses. 3Bias = Accepted value – Analytical value. 4The ratio of the analytical value to accepted value expressed as a percentage. 5RSDr, interday relative standard deviation (SD/mean × 100)