44
Semi-Annual Report for FTSE Bursa Malaysia KLCI etf 30 June 2020

Semi-Annual Report for
FTSE Bursa Malaysia KLCI etf 30 June 2020
FTSE Bursa Malaysia KLCI etf
FTSE BURSA MALAYSIA KLCI etf
Semi-Annual Report
30 June 2020
FTSE Bursa Malaysia KLCI etf
TRUST DIRECTORY
Manager
AmFunds Management Berhad
9th & 10th Floor, Bangunan AmBank Group
55 Jalan Raja Chulan
50200 Kuala Lumpur
Board of Directors Jeyaratnam A/L Tamotharam Pillai
Dato’ Mustafa Bin Mohd Nor Tai Terk Lin
Sum Leng Kuang Goh Wee Peng
Investment Committee Sum Leng Kuang
Tai Terk Lin Dato’ Mustafa Bin Mohd Nor
Zainal Abidin Bin Mohd Kassim Goh Wee Peng
Trustee HSBC (Malaysia) Trustee Berhad
Auditors and Reporting Accountants Ernst & Young PLT
Taxation Adviser Deloitte Tax Services Sdn Bhd
FTSE Bursa Malaysia KLCI etf
CORPORATE DIRECTORY
AmFunds Management Berhad
Registered Office
22nd Floor, Bangunan AmBank Group
No. 55, Jalan Raja Chulan, 50200 Kuala Lumpur
Tel: 03-2036 2633
Head Office
9th & 10th Floor, Bangunan AmBank Group
No. 55, Jalan Raja Chulan, 50200 Kuala Lumpur
Tel: 03-2032 2888
Fax: 03-2031 5210
E-mail: [email protected]
Website: www.aminvest.com
Secretaries
Koh Suet Peng (MAICSA 7019861)
Zeenath Begum Binti Mohamed Mastan (LS0009462)
22nd Floor, Bangunan AmBank Group
No. 55 Jalan Raja Chulan
50200 Kuala Lumpur
HSBC (Malaysia) Trustee Berhad (1281-T)
Registered & Business Office
13th Floor, Bangunan HSBC, South Tower
No. 2, Leboh Ampang, 50100 Kuala Lumpur
Tel: 03-2075 7800
Fax: 03-2179 6511

FTSE Bursa Malaysia KLCI etf
CONTENTS
1 Manager’s Report
10 Statement of Financial Position
11 Statement of Comprehensive Income
12 Statement of Changes in Equity
13 Statement of Cash Flows
14 Notes to the Financial Statements
37 Statement by the Manager
38 Directory
1
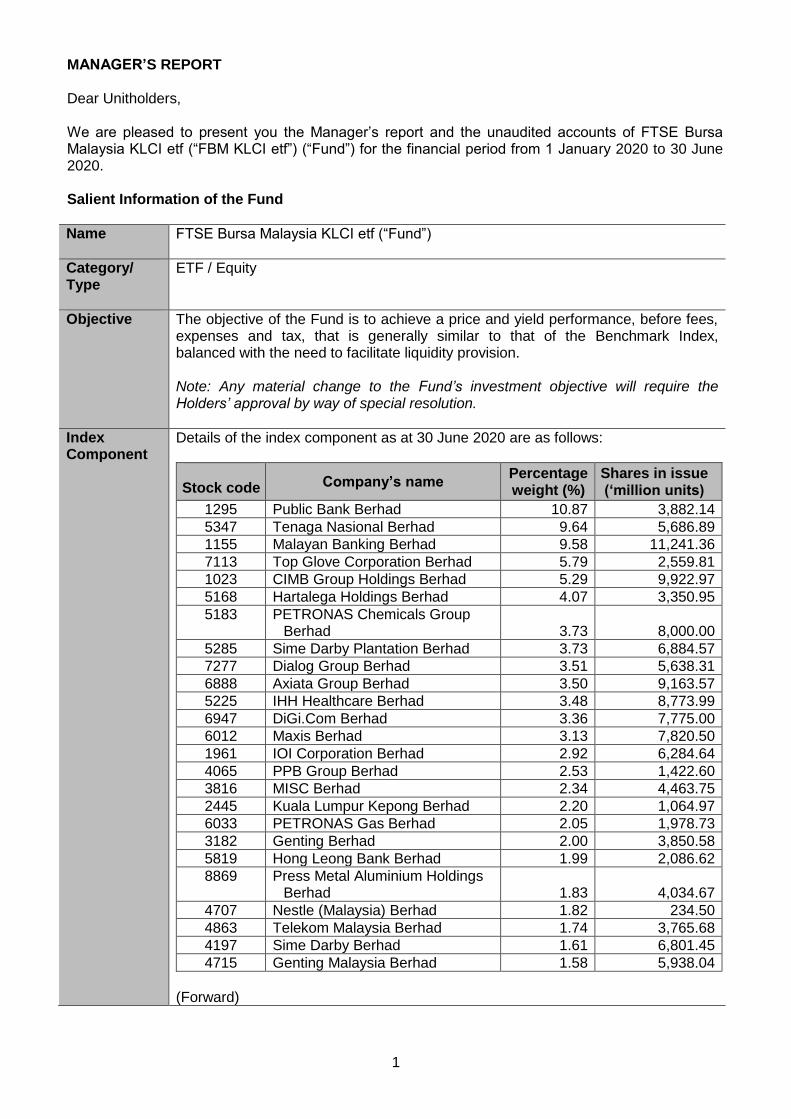
MANAGER’S REPORT Dear Unitholders, We are pleased to present you the Manager’s report and the unaudited accounts of FTSE Bursa Malaysia KLCI etf (“FBM KLCI etf”) (“Fund”) for the financial period from 1 January 2020 to 30 June 2020. Salient Information of the Fund
Name FTSE Bursa Malaysia KLCI etf (“Fund”)
Category/ Type
ETF / Equity
Objective The objective of the Fund is to achieve a price and yield performance, before fees, expenses and tax, that is generally similar to that of the Benchmark Index, balanced with the need to facilitate liquidity provision. Note: Any material change to the Fund’s investment objective will require the Holders’ approval by way of special resolution.
Index Component
Details of the index component as at 30 June 2020 are as follows:
Stock code Company’s name Percentage weight (%)
Shares in issue (‘million units)
1295 Public Bank Berhad 10.87 3,882.14
5347 Tenaga Nasional Berhad 9.64 5,686.89
1155 Malayan Banking Berhad 9.58 11,241.36
7113 Top Glove Corporation Berhad 5.79 2,559.81
1023 CIMB Group Holdings Berhad 5.29 9,922.97
5168 Hartalega Holdings Berhad 4.07 3,350.95
5183 PETRONAS Chemicals Group Berhad 3.73 8,000.00
5285 Sime Darby Plantation Berhad 3.73 6,884.57
7277 Dialog Group Berhad 3.51 5,638.31
6888 Axiata Group Berhad 3.50 9,163.57
5225 IHH Healthcare Berhad 3.48 8,773.99
6947 DiGi.Com Berhad 3.36 7,775.00
6012 Maxis Berhad 3.13 7,820.50
1961 IOI Corporation Berhad 2.92 6,284.64
4065 PPB Group Berhad 2.53 1,422.60
3816 MISC Berhad 2.34 4,463.75
2445 Kuala Lumpur Kepong Berhad 2.20 1,064.97
6033 PETRONAS Gas Berhad 2.05 1,978.73
3182 Genting Berhad 2.00 3,850.58
5819 Hong Leong Bank Berhad 1.99 2,086.62
8869 Press Metal Aluminium Holdings Berhad 1.83 4,034.67
4707 Nestle (Malaysia) Berhad 1.82 234.50
4863 Telekom Malaysia Berhad 1.74 3,765.68
4197 Sime Darby Berhad 1.61 6,801.45
4715 Genting Malaysia Berhad 1.58 5,938.04
(Forward)
2
Stock code Company’s name Percentage weight (%)
Shares in issue (‘million units)
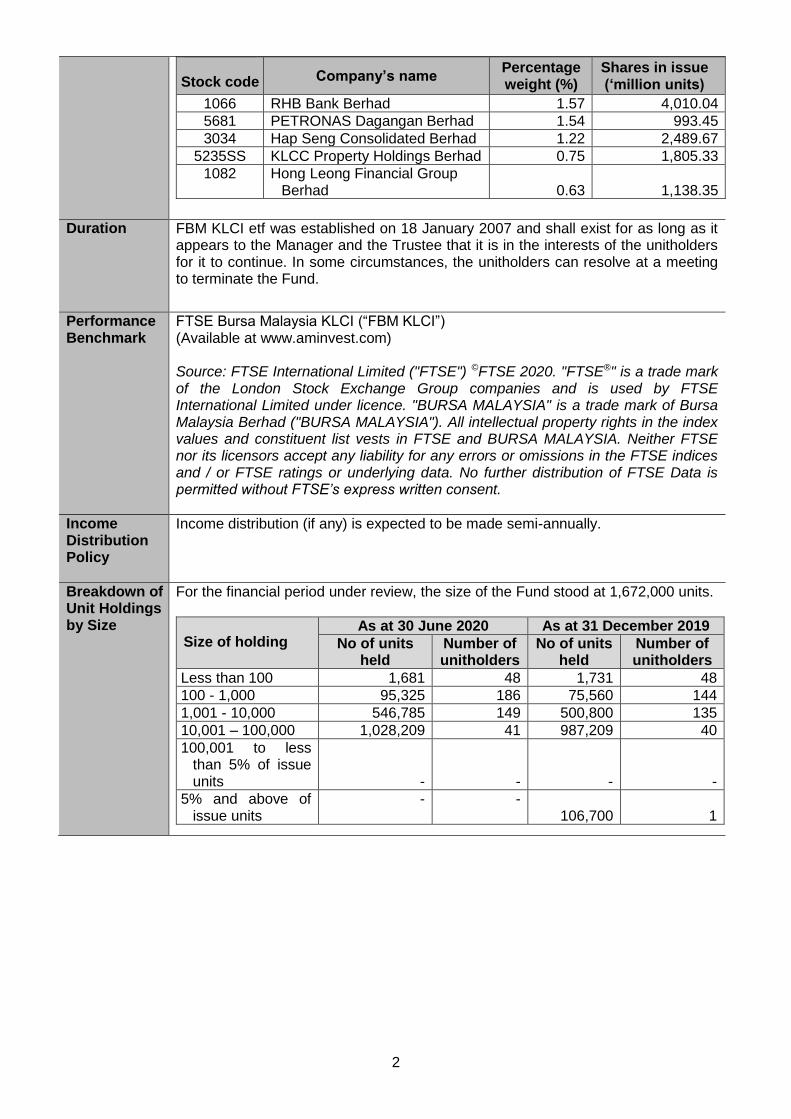
1066 RHB Bank Berhad 1.57 4,010.04
5681 PETRONAS Dagangan Berhad 1.54 993.45
3034 Hap Seng Consolidated Berhad 1.22 2,489.67
5235SS KLCC Property Holdings Berhad 0.75 1,805.33
1082 Hong Leong Financial Group Berhad 0.63 1,138.35
Duration FBM KLCI etf was established on 18 January 2007 and shall exist for as long as it appears to the Manager and the Trustee that it is in the interests of the unitholders for it to continue. In some circumstances, the unitholders can resolve at a meeting to terminate the Fund.
Performance Benchmark
FTSE Bursa Malaysia KLCI (“FBM KLCI”) (Available at www.aminvest.com) Source: FTSE International Limited ("FTSE") ©FTSE 2020. "FTSE®" is a trade mark of the London Stock Exchange Group companies and is used by FTSE International Limited under licence. "BURSA MALAYSIA" is a trade mark of Bursa Malaysia Berhad ("BURSA MALAYSIA"). All intellectual property rights in the index values and constituent list vests in FTSE and BURSA MALAYSIA. Neither FTSE nor its licensors accept any liability for any errors or omissions in the FTSE indices and / or FTSE ratings or underlying data. No further distribution of FTSE Data is permitted without FTSE’s express written consent.
Income Distribution Policy
Income distribution (if any) is expected to be made semi-annually.
Breakdown of Unit Holdings by Size
For the financial period under review, the size of the Fund stood at 1,672,000 units.
Size of holding As at 30 June 2020 As at 31 December 2019
No of units held
Number of unitholders
No of units held
Number of unitholders
Less than 100 1,681 48 1,731 48
100 - 1,000 95,325 186 75,560 144
1,001 - 10,000 546,785 149 500,800 135
10,001 – 100,000 1,028,209 41 987,209 40
100,001 to less than 5% of issue units
-
-
-
-
5% and above of issue units
- - 106,700
1
3
Fund Performance Data
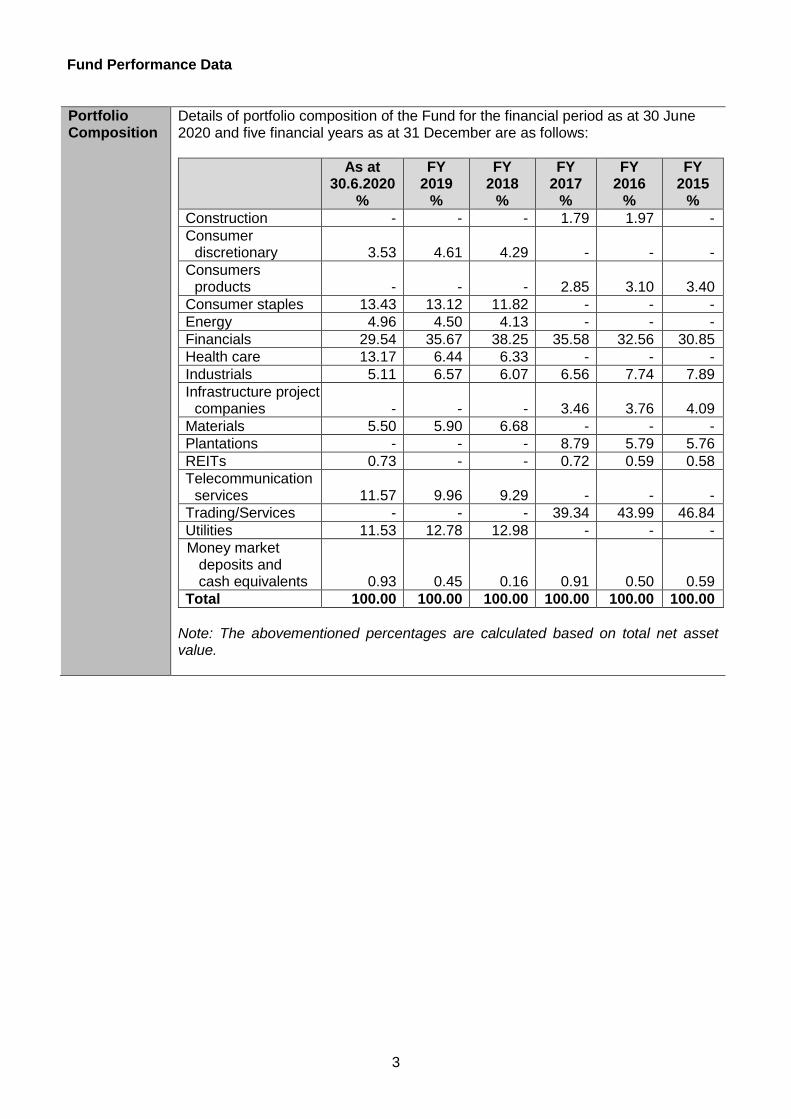
Portfolio Composition
Details of portfolio composition of the Fund for the financial period as at 30 June 2020 and five financial years as at 31 December are as follows:
As at 30.6.2020
%
FY 2019
%
FY 2018
%
FY 2017
%
FY 2016
%
FY 2015
%
Construction - - - 1.79 1.97 -
Consumer discretionary 3.53 4.61 4.29 - - -
Consumers products - - - 2.85 3.10 3.40
Consumer staples 13.43 13.12 11.82 - - -
Energy 4.96 4.50 4.13 - - -
Financials 29.54 35.67 38.25 35.58 32.56 30.85
Health care 13.17 6.44 6.33 - - -
Industrials 5.11 6.57 6.07 6.56 7.74 7.89
Infrastructure project companies - -
-
3.46
3.76
4.09
Materials 5.50 5.90 6.68 - - -
Plantations - - - 8.79 5.79 5.76
REITs 0.73 - - 0.72 0.59 0.58
Telecommunication services 11.57 9.96
9.29
-
-
-
Trading/Services - - - 39.34 43.99 46.84
Utilities 11.53 12.78 12.98 - - -
Money market deposits and cash equivalents 0.93 0.45 0.16 0.91 0.50 0.59
Total 100.00 100.00 100.00 100.00 100.00 100.00
Note: The abovementioned percentages are calculated based on total net asset value.
4
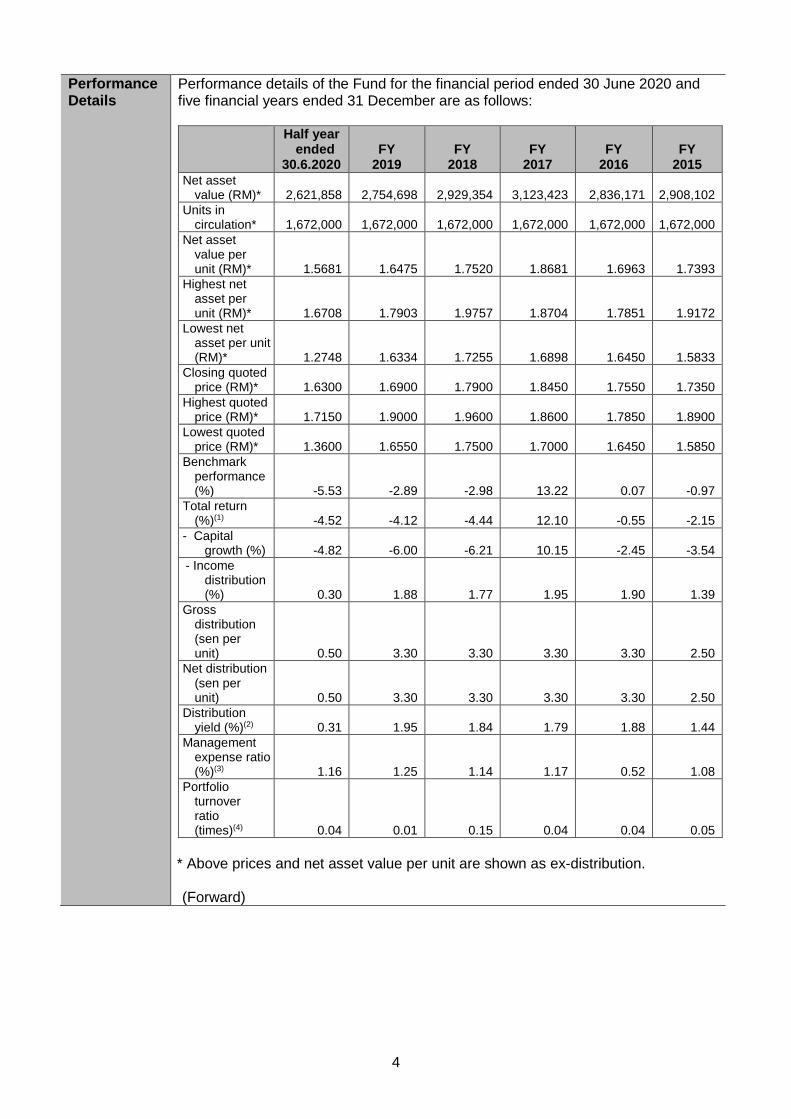
Performance Details
Performance details of the Fund for the financial period ended 30 June 2020 and five financial years ended 31 December are as follows: Half year
ended 30.6.2020
FY 2019
FY 2018
FY 2017
FY 2016
FY 2015
Net asset value (RM)* 2,621,858 2,754,698 2,929,354
3,123,423
2,836,171
2,908,102
Units in circulation* 1,672,000 1,672,000 1,672,000
1,672,000
1,672,000
1,672,000
Net asset value per unit (RM)* 1.5681 1.6475 1.7520 1.8681 1.6963 1.7393
Highest net asset per unit (RM)* 1.6708 1.7903 1.9757
1.8704 1.7851 1.9172
Lowest net asset per unit (RM)* 1.2748 1.6334 1.7255 1.6898 1.6450 1.5833
Closing quoted price (RM)* 1.6300 1.6900 1.7900 1.8450 1.7550 1.7350
Highest quoted price (RM)* 1.7150 1.9000 1.9600 1.8600 1.7850 1.8900
Lowest quoted price (RM)* 1.3600 1.6550 1.7500 1.7000 1.6450 1.5850
Benchmark performance (%) -5.53 -2.89 -2.98 13.22 0.07 -0.97
Total return (%)(1) -4.52 -4.12 -4.44 12.10 -0.55 -2.15
- Capital growth (%) -4.82 -6.00 -6.21 10.15 -2.45 -3.54
- Income distribution (%) 0.30 1.88 1.77 1.95 1.90 1.39
Gross distribution (sen per unit) 0.50 3.30 3.30 3.30 3.30 2.50
Net distribution (sen per unit) 0.50 3.30 3.30 3.30 3.30 2.50
Distribution yield (%)(2) 0.31 1.95 1.84 1.79 1.88 1.44
Management expense ratio (%)(3) 1.16 1.25 1.14 1.17 0.52 1.08
Portfolio turnover ratio (times)(4) 0.04 0.01 0.15 0.04 0.04 0.05
* Above prices and net asset value per unit are shown as ex-distribution. (Forward)
5
Note: (1) Total return is the actual return of the Fund for the respective financial
period/years computed based on the net asset value per unit and net of all fees.
(2) Distribution yield is calculated based on the total distribution for the years divided by the closing quoted price.
(3) Management expense ratio (“MER”) is calculated based on the total fees and expenses incurred by the Fund divided by the average fund size calculated on a daily basis. The MER decreased by 0.09% as compared to 1.25% per annum for the financial year ended 31 December 2019 mainly due to decrease in expenses.
(4) Portfolio turnover ratio (“PTR”) is calculated based on the average of the total acquisitions and total disposals of investment securities of the Fund divided by the average fund size calculated on a daily basis. The PTR increased by 0.03 times (>100.0%) as compared to 0.01 times for the financial year ended 31 December 2019 mainly due to increase in investing activities.
Average Total Return (as at 30 June 2020)
FBM KLCI etf(a)
%
FBM KLCI/ FBM30 Index(b)
%
One year -8.32 -10.16
Three years -3.31 -5.23
Five years -0.47 -2.53
Ten years 3.43 1.34
Annual Total Return
Financial Years Ended (31 December)
FBM KLCI etf(a) %
FBM KLCI(b) %
2019 -4.12 -2.89
2018 -4.44 -2.98
2017 12.10 13.22
2016 -0.55 0.07
2015 -2.15 -0.97
(a) Source: Novagni Analytics and Advisory Sdn. Bhd. (b) Effective from 6 July 2009, the FTSE Bursa Malaysia Large 30 Index
(“FBM30Index”) has been renamed FTSE Bursa Malaysia KLCI (“FBM KLCI”). (Available at www.aminvest.com)
The Fund performance is calculated based on the net asset value per unit of the Fund. Average total return of the Fund and its benchmark for a period is computed based on the absolute return for that period annualised over one year. Note: Past performance is not necessarily indicative of future performance and that unit prices and investment returns may go down, as well as up.
6
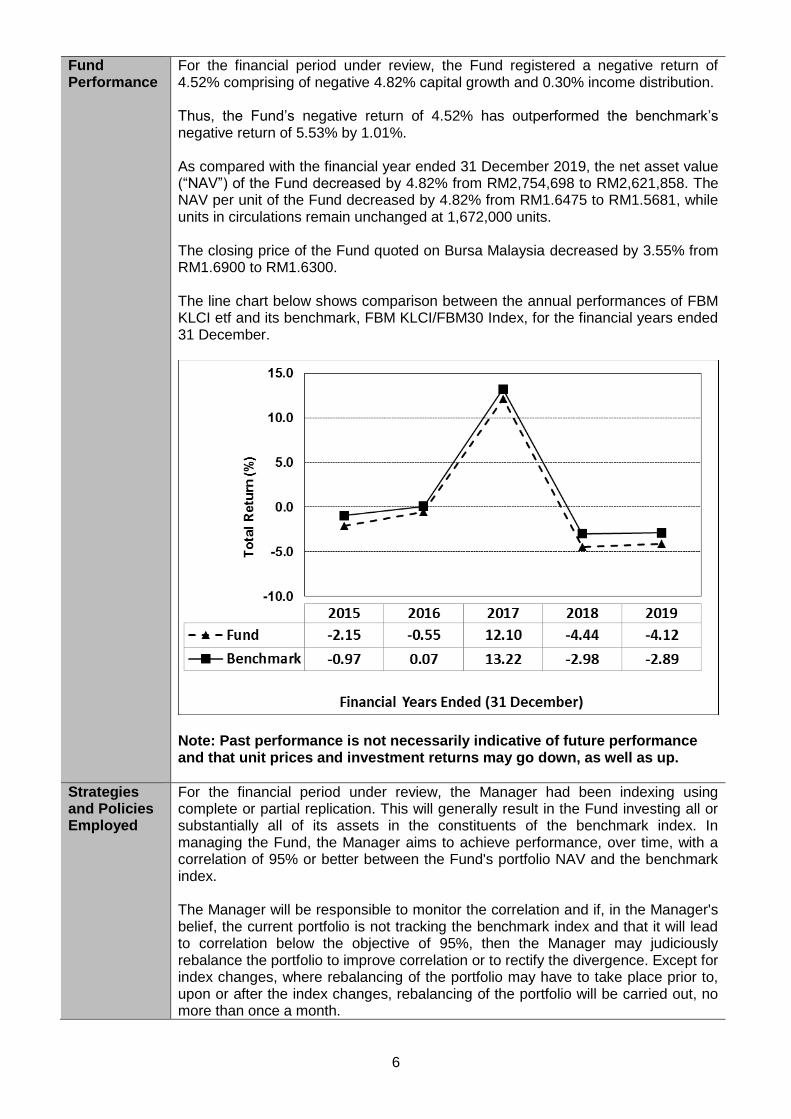
Fund Performance
For the financial period under review, the Fund registered a negative return of 4.52% comprising of negative 4.82% capital growth and 0.30% income distribution. Thus, the Fund’s negative return of 4.52% has outperformed the benchmark’s negative return of 5.53% by 1.01%. As compared with the financial year ended 31 December 2019, the net asset value (“NAV”) of the Fund decreased by 4.82% from RM2,754,698 to RM2,621,858. The NAV per unit of the Fund decreased by 4.82% from RM1.6475 to RM1.5681, while units in circulations remain unchanged at 1,672,000 units. The closing price of the Fund quoted on Bursa Malaysia decreased by 3.55% from RM1.6900 to RM1.6300. The line chart below shows comparison between the annual performances of FBM KLCI etf and its benchmark, FBM KLCI/FBM30 Index, for the financial years ended 31 December.
Note: Past performance is not necessarily indicative of future performance and that unit prices and investment returns may go down, as well as up.
Strategies and Policies Employed
For the financial period under review, the Manager had been indexing using complete or partial replication. This will generally result in the Fund investing all or substantially all of its assets in the constituents of the benchmark index. In managing the Fund, the Manager aims to achieve performance, over time, with a correlation of 95% or better between the Fund's portfolio NAV and the benchmark index. The Manager will be responsible to monitor the correlation and if, in the Manager's belief, the current portfolio is not tracking the benchmark index and that it will lead to correlation below the objective of 95%, then the Manager may judiciously rebalance the portfolio to improve correlation or to rectify the divergence. Except for index changes, where rebalancing of the portfolio may have to take place prior to, upon or after the index changes, rebalancing of the portfolio will be carried out, no more than once a month.
7
Where the Manager deems appropriate, the Manager may allow a Participating Dealer that has been pre-approved, to tender Zero Strike Call Options equivalent in value to an In-Kind Creation Basket or multiples thereof, in exchange for ETF units, to facilitate the liquidity provision process.
Portfolio Structure
This table below is the asset allocation of the Fund for the financial period/year under review.
As at 30.6.2020
%
As at 31.12.2019
%
Changes
%
Consumer discretionary 3.53 4.61 -1.08
Consumer staples 13.43 13.12 0.31
Energy 4.96 4.50 0.46
Financials 29.54 35.67 -6.13
Health care 13.17 6.44 6.73
Industrials 5.11 6.57 -1.46
Materials 5.50 5.90 -0.40
REITs 0.73 - 0.73
Telecommunication services 11.57 9.96 1.61
Utilities 11.53 12.78 -1.25
Money market deposits and cash equivalents 0.93 0.45 0.48
Total 100.00 100.00
During the financial period under review, the Fund reduced weighting in Financials, Industrials, Utilities and Consumer discretionary and re-deployed money into Health care, Telecommunication services, REITs, Energy and Consumer staples.
Cross Trade There were no cross trades undertaken during the financial period under review.
Distribution/ unit splits
During the financial period under review, the Fund declared income distribution, detailed as follows:
Date of distribution
Distribution per unit (sen)
NAV per unit Cum-Distribution
(RM)
NAV per unit Ex-Distribution
(RM)
23-Jun-20 0.50 1.5782 1.5732
There was no unit split declared for the financial period under review.
State of Affairs of the Fund
There has been neither significant change to the state of affairs of the Fund nor any circumstances that materially affect any interests of the unitholders during the financial period under review.
Rebates and Soft Commission
During the period, the management company received soft commissions by virtue of transactions conducted for the Fund, in the form of research services or quotation services that assist in investment decision making process which are of demonstrable benefit to unitholders of the Fund.
8
Market Review
The KLCI started 2020 with a loss of 3.6% MoM, in tandem the weak regional market performance. The bearish sentiment was most prevalent in small cap segment where the FBMSC Index plunged 6.3% MoM. The United States (US) Federal Reserve held its benchmark funds rate in a range between 1.5% to 1.75%. US 10year treasury yield collapsed 41bps to close at 1.51%, causing slight yield curve inversion of 3bps against 3month treasury yield. The pessimism stemmed from outbreak of coronavirus in Wuhan, China which prompted the World Health Organization (WHO) to declare the outbreak a global health emergency. As at 3 February, there were 17,388 cases and 362 death reported. The number of deaths in mainland China had overtaken the Severe Acute Respiratory Syndrome (SARS) epidemic of 2003. Foreign institutional investors net purchase MYR100m worth of Malaysian equities in January 2020. Sector wise, property, plantation and energy were the worst performing sectors, dropping between 7.2 to 8% MoM. Healthcare sector benefited from the coronavirus outbreak to gain 9.8% MoM. The KLCI registered a loss of 3.2% MoM in February, dragged down by the Dow which plunged 10.1% MoM. The bearish sentiment was most prevalent in mid/small cap where the FBM70 and FBMSC Index plunged 5.7% and 4.1% MoM respectively. Domestically, Malaysian were shocked by the sudden collapsed of the Pakatan Harapan (PH) Federal government when Parti Pribumi Bersatu (Bersatu) and 10 members of Parliament (MP) from PKR breakaway from the Harapan coalition to form a new coalition with the opposition led by United Malays National Organisation (UMNO) and Malaysian Islamic Party (PAS). In the confused and chaos state, Pakatan Prime Minister (PM), Tun Mahathir resigned as PM, which led to the appointment of Bersatu President, Tan Sri Muhyiddin as the new PM. Subsequently, Tun Mahathir claimed that he had the backing of 114 MPs or 51% of the 222-strong parliament to continue as PM. Tun Mahathir is now demanding the commencement of Parliament session, scheduled on 9 March, to ascertain who really has the majority support of MPs. The KLCI plunged 8.9% MoM in March 2020, dragged down by the Dow Jones which nose-dived 13.7% MoM. The bearish sentiment was most prevalent in the mid and small cap segment where the FBMSC and FBM70 Index dropped sharply by 27.7% and 18.0% MoM respectively. On 3 March 2020, Bank Negara Malaysia (BNM) delivered a second consecutive Overnight Policy Rate (OPR) cut of 25bps to 2.50%, in line with consensus expectation. The cut came shortly after the MYR20b COVID-19 fiscal stimulus package which was announced on 27 February 2020. With growth trend skewed to the downside from COVID-19 shut down globally, we see high likelihood of a further 50bps cut for the year. The KLCI increased 4.2% MoM in April 2020, in tandem with the Dow which spiked 11.1% MoM. The rebound was strongest in small/mid cap where the FBMSC and FBM70 Index were up sharply by 20.2% and 10.5% MoM respectively. In early April, BNM revised Malaysia's Gross domestic product (GDP) growth to between -2% to 0.5% in 2020, from the earlier 2% to 3% on 27 March 2020. Malaysia has decided to further extend the movement control order (MCO) by another 14 days until 12 May which has now been extended to 56 days. Based on the experience of Wuhan, China, the city lockdown was lifted in 77 days, based on that Malaysia’s MCO should be lifted by end of May. The KLCI gained 4.7% MoM in May 2020, in tandem with the Dow which went up 4.3% MoM. The rebound was strongest in small/mid cap where the FBMSC and FBM70 Index were up sharply by 9% and 13.2% MoM respectively. Corporate Malaysia reported 1Q2020 results, which were disappointing as analyst cut KLCI earnings by about 20%. Earnings growth for 2020 is projected to decline -15% YoY before recovering to +19% YoY in 2021. BNM has reduced the OPR by 50bps to 2.00%. This is the 4th cut since May 2019 in response to the weak economic. The
9
government relaxed the MCO to become conditional MCO but extended it to 9th June. The fragile political scene was given a knock by former Prime Minister, Tun Mahathir who puts forward vote of no confidence motion on PM Muhyiddin, which underlines the perilous state of the dubious wafer-thin majority Perikatan Nasional (PN) government.
The KLCI gained 1.9% MoM in June, in tandem with the Dow which went up 1.7% MoM. The positive sentiment in big caps was not shared in mid/small caps where the FBM70 and FBMSC Index were down by 1.9% MoM and 1.7% MoM respectively. The KLCI gain was driven by Top Glove and Public Bank. The Malaysian government announced preparations for a transition from the Conditional Movement Control Order (CMCO) ending on 9 June to the Recovery Movement Control Order (RMCO) set to last until 31 August amid a gradual decline in new COVID-19 cases and an expansion in testing and treatment capacity. To aid the post-MCO rehabilitation, the government announced an MYR35b Economic Recovery Plan (PENJANA), its fourth comprehensive package that brings the cumulative stimulus to MYR295b, or 20% of GDP. PENJANA broadly consists of MYR10b in direct fiscal spending, MYR8b in tax breaks and incentives, and the remainder through measures implemented by the quasi-public sector and GLC entities. The incentives will help boost near-term sales as the economy reopens.
Market Outlook
Despite the rising COVID-19 cases globally, global markets, especially the US market continue to march higher, ignoring the actual negative impact on the global economy. Investors should not discount the dampening effect of the 2nd wave that has led to lockdowns in various countries. Thanks to the global central banks, the ample liquidity continues to support the downside of the market but we believe investors would eventually come to their senses that the real economy outlook may not be as rosy as reflected by the equity market performance Year to date (YTD). Hence, our cautiousness remains.
Local market continues to do well vis-à-vis the regional peers and in fact is the best performer in the region on a YTD basis. Due to the wide economic impact of the COVID-19 pandemic, we believe that the recovery would take a longer period. Hence, investment calls going forward, will be based on a longer term investment horizon. Keys factors that will continue to support the local market are: a) the high market liquidity; b) recovery from the 1H20 low base effect from the COVID-19 pandemic; c) the strong local institutional and retail support for the equity market; d) preferred lower beta market during this “risk-off” period; e) being the 2nd highest dividend yield market in this region during this low
interest rate environment; and f) attractive valuation of selective mid and smaller cap stocks.
We remain defensive with reasonable amount of cash holding in preparation for any market weaknesses. Focus will be based on bottom-up approach with preference in sectors namely, consumer (non-discretionary), technology, gloves, selective construction, telco, plantation and Real Estate Investment Trusts (REITs).
Additional Information
The following information was updated:
1. Seohan Soo resigned as a Non-Independent, Non-Executive Director for AmFunds Management Berhad with effect from 1st January 2020.
Kuala Lumpur, Malaysia AmFunds Management Berhad 24 August 2020
FTSE Bursa Malaysia KLCI etf (“FBM KLCI etf”)
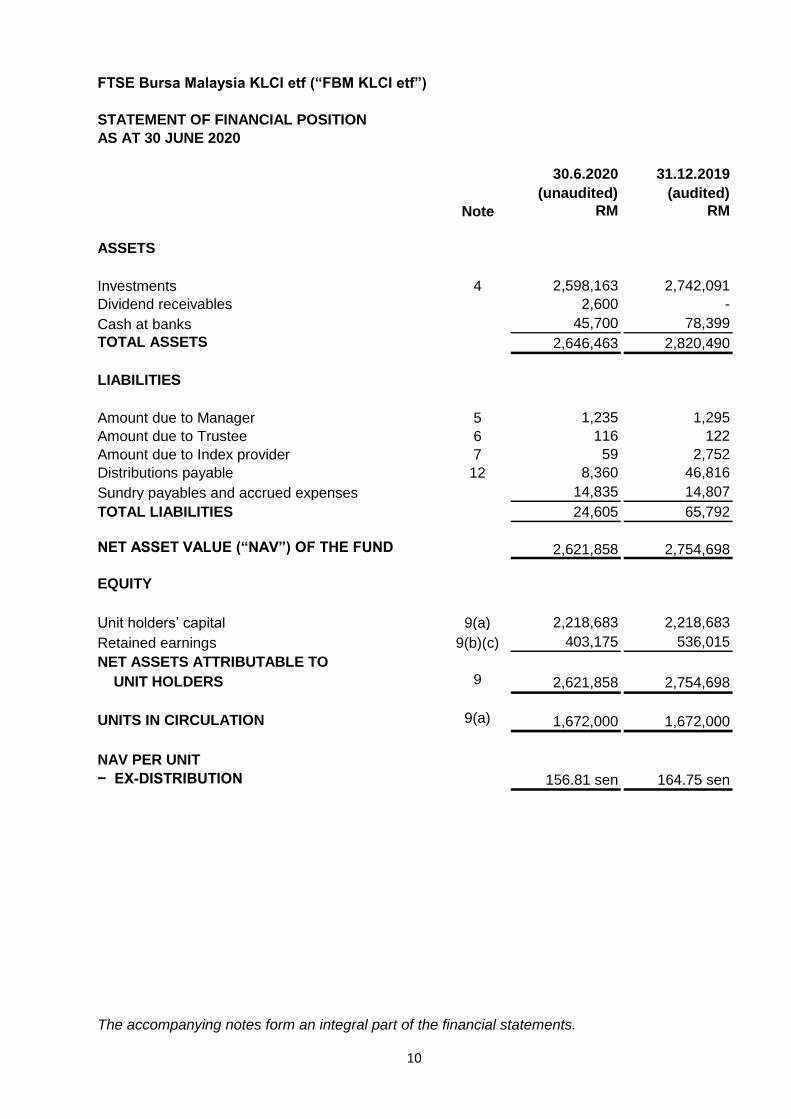
STATEMENT OF FINANCIAL POSITION
AS AT 30 JUNE 2020
30.6.2020 31.12.2019
(unaudited) (audited)
Note RM RM
ASSETS
Investments 4 2,598,163 2,742,091
Dividend receivables 2,600 -
Cash at banks 45,700 78,399
TOTAL ASSETS 2,646,463 2,820,490
LIABILITIES
Amount due to Manager 5 1,235 1,295
Amount due to Trustee 6 116 122
Amount due to Index provider 7 59 2,752
Distributions payable 12 8,360 46,816
Sundry payables and accrued expenses 14,835 14,807
TOTAL LIABILITIES 24,605 65,792
NET ASSET VALUE (“NAV”) OF THE FUND 2,621,858 2,754,698
EQUITY
Unit holders’ capital 9(a) 2,218,683 2,218,683
Retained earnings 9(b)(c) 403,175 536,015
NET ASSETS ATTRIBUTABLE TO
UNIT HOLDERS 9 2,621,858 2,754,698
UNITS IN CIRCULATION 9(a) 1,672,000 1,672,000
NAV PER UNIT
− EX-DISTRIBUTION 156.81 sen 164.75 sen
The accompanying notes form an integral part of the financial statements.
10
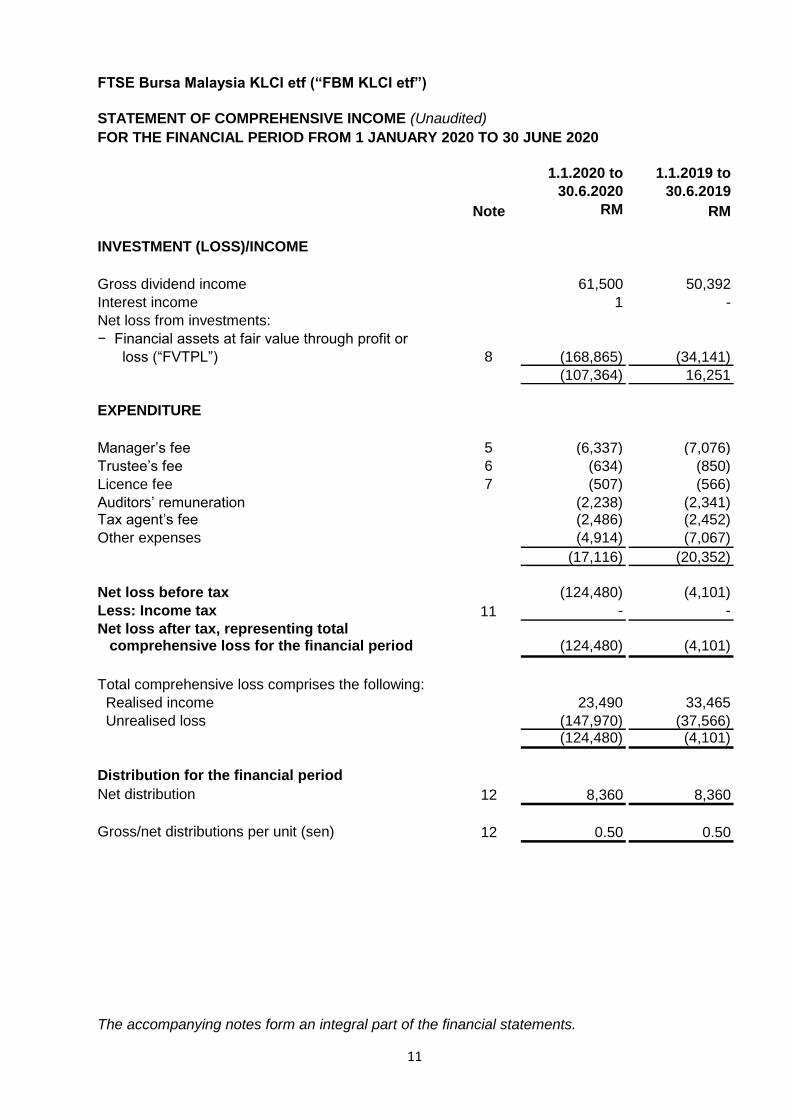
FTSE Bursa Malaysia KLCI etf (“FBM KLCI etf”)
STATEMENT OF COMPREHENSIVE INCOME (Unaudited)
FOR THE FINANCIAL PERIOD FROM 1 JANUARY 2020 TO 30 JUNE 2020
1.1.2020 to 1.1.2019 to
30.6.2020 30.6.2019
Note RM RM
INVESTMENT (LOSS)/INCOME
Gross dividend income 61,500 50,392
Interest income 1 -
Net loss from investments:
− Financial assets at fair value through profit or
loss (“FVTPL”) 8 (168,865) (34,141)
(107,364) 16,251
EXPENDITURE
Manager’s fee 5 (6,337) (7,076)
Trustee’s fee 6 (634) (850)
Licence fee 7 (507) (566)
Auditors’ remuneration (2,238) (2,341)Tax agent’s fee (2,486) (2,452)
Other expenses (4,914) (7,067)
(17,116) (20,352)
Net loss before tax (124,480) (4,101)
Less: Income tax 11 - -
Net loss after tax, representing total comprehensive loss for the financial period (124,480) (4,101)
Total comprehensive loss comprises the following:
Realised income 23,490 33,465
Unrealised loss (147,970) (37,566)(124,480) (4,101)
Distribution for the financial period
Net distribution 12 8,360 8,360
Gross/net distributions per unit (sen) 12 0.50 0.50
The accompanying notes form an integral part of the financial statements.
11
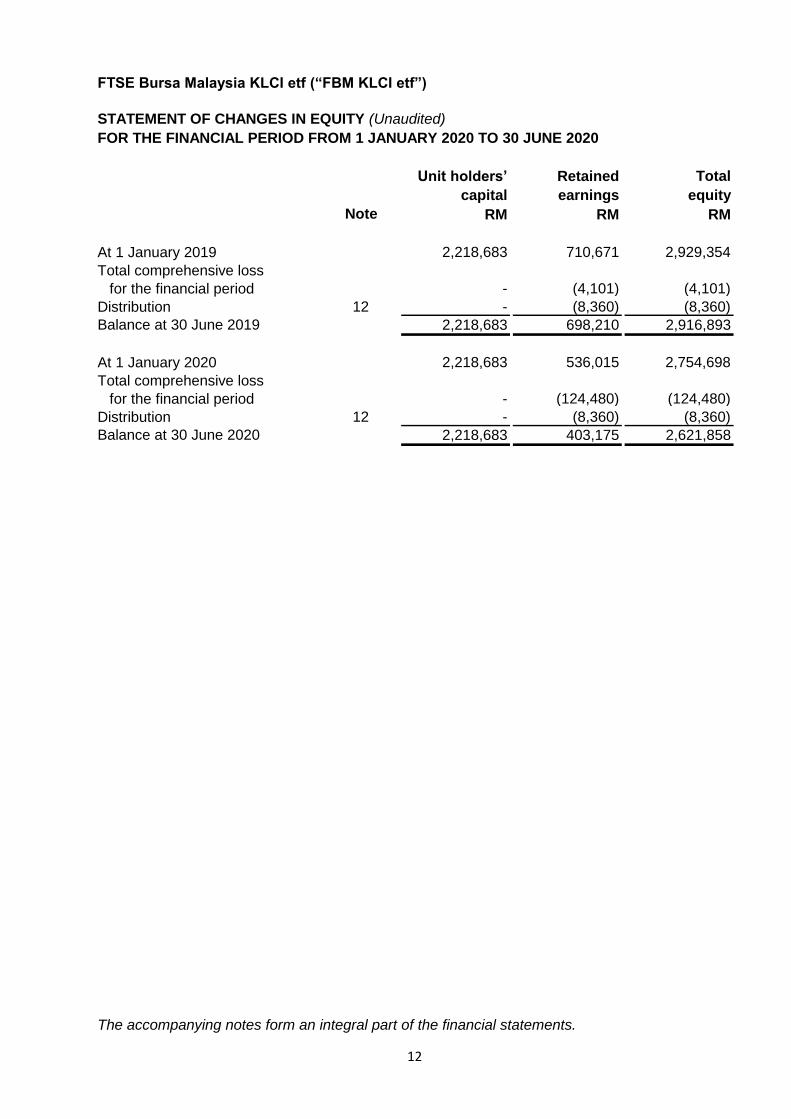
FTSE Bursa Malaysia KLCI etf (“FBM KLCI etf”)
STATEMENT OF CHANGES IN EQUITY (Unaudited)
FOR THE FINANCIAL PERIOD FROM 1 JANUARY 2020 TO 30 JUNE 2020
Unit holders’ Retained Total
capital earnings equity
Note RM RM RM
At 1 January 2019 2,218,683 710,671 2,929,354
Total comprehensive loss
for the financial period - (4,101) (4,101)
Distribution 12 - (8,360) (8,360)
Balance at 30 June 2019 2,218,683 698,210 2,916,893
At 1 January 2020 2,218,683 536,015 2,754,698
Total comprehensive loss
for the financial period - (124,480) (124,480)
Distribution 12 - (8,360) (8,360)
Balance at 30 June 2020 2,218,683 403,175 2,621,858
The accompanying notes form an integral part of the financial statements.
12
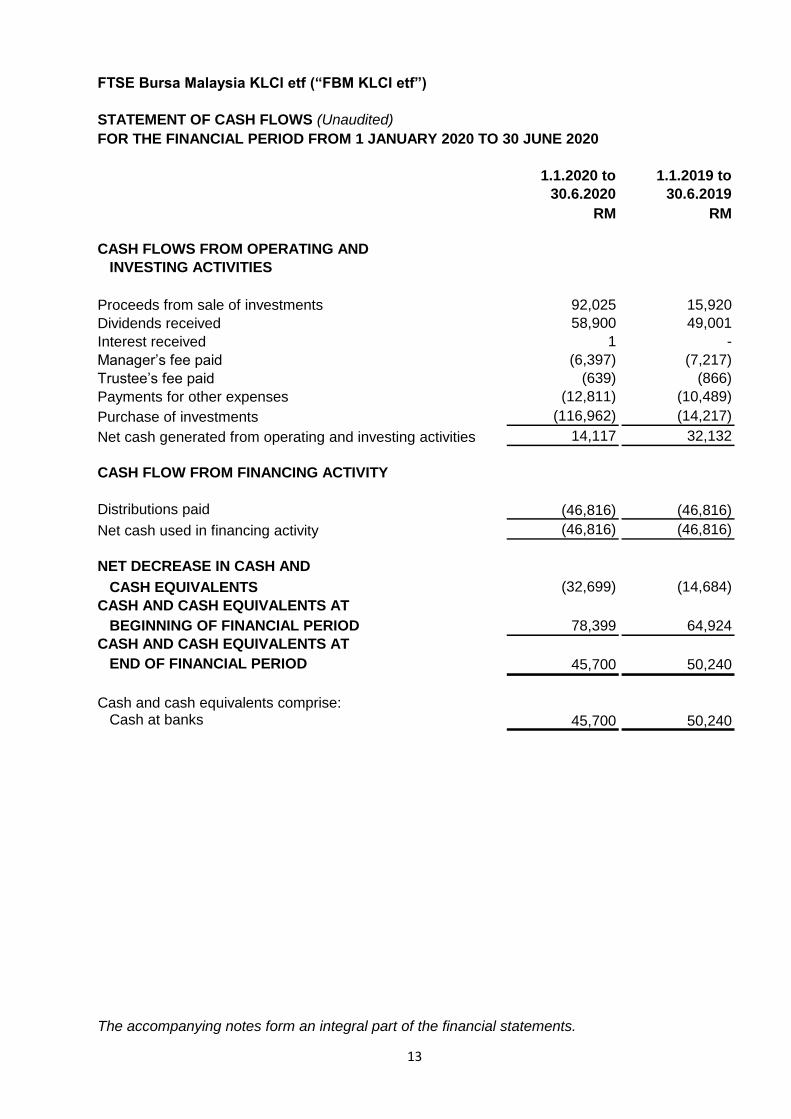
FTSE Bursa Malaysia KLCI etf (“FBM KLCI etf”)
STATEMENT OF CASH FLOWS (Unaudited)
FOR THE FINANCIAL PERIOD FROM 1 JANUARY 2020 TO 30 JUNE 2020
1.1.2020 to 1.1.2019 to
30.6.2020 30.6.2019
RM RM
CASH FLOWS FROM OPERATING AND
INVESTING ACTIVITIES
Proceeds from sale of investments 92,025 15,920
Dividends received 58,900 49,001
Interest received 1 -
Manager’s fee paid (6,397) (7,217)
Trustee’s fee paid (639) (866)
Payments for other expenses (12,811) (10,489)
Purchase of investments (116,962) (14,217)
Net cash generated from operating and investing activities 14,117 32,132
CASH FLOW FROM FINANCING ACTIVITY
Distributions paid (46,816) (46,816)
Net cash used in financing activity (46,816) (46,816)
NET DECREASE IN CASH AND
CASH EQUIVALENTS (32,699) (14,684)
CASH AND CASH EQUIVALENTS AT
BEGINNING OF FINANCIAL PERIOD 78,399 64,924
CASH AND CASH EQUIVALENTS AT
END OF FINANCIAL PERIOD 45,700 50,240
Cash and cash equivalents comprise:Cash at banks 45,700 50,240
The accompanying notes form an integral part of the financial statements.
13
FTSE Bursa Malaysia KLCI etf (“FBM KLCI etf”)
NOTES TO THE FINANCIAL STATEMENTSFOR THE FINANCIAL PERIOD FROM 1 JANUARY 2020 TO 30 JUNE 2020
1. GENERAL INFORMATION
2. BASIS OF PREPARATION OF FINANCIAL STATEMENTS
Standards effective during the financial period
Standards issued but not yet effective
FBM KLCI etf (“the Fund”) was established pursuant to a Deed dated 18 January 2007 as
amended by the Deeds Supplemental thereto (“the Deed”), between AmFunds Management
Berhad as the Manager, HSBC (Malaysia) Trustee Berhad as the Trustee and all unit
holders.
On 6 July 2009, the Fund’s benchmark, FTSE Bursa Malaysia Large 30 Index (“FBM30”) has
been renamed to FTSE Bursa Malaysia KLCI and concurrent with this change, the Fund also
announced the change of name to FTSE Bursa Malaysia KLCI etf (short name: FBM KLCI
etf). The Fund’s change of its name is pursuant to the Third Supplemental Deed dated 29
June 2009.
The financial statements were authorised for issue by the Manager on 24 August 2020.
The financial statements of the Fund have been prepared on a historical basis, except as
otherwise stated in the accounting policies and comply with Malaysian Financial Reporting
Standards 134: Interim Financial Reporting (“MFRS 134”) as issued by the Malaysian
Accounting Standards Board (“MASB”) and Securities Commission Malaysia’s Guidelines on
Exchange Traded Funds in Malaysia.
The adoption of MFRS which have been effective during the financial period did not have any
material financial impact to the financial statements.
The Fund will adopt the following MFRSs and Amendments to MFRSs when they become
effective in the respective financial periods and these MFRSs and Amendments to MFRSs
are not expected to have any material impact to the financial statements of the Fund upon
initial application.
The Fund was set up with the objective to achieve a price and yield performance, before
fees, expenses and tax, that is generally similar to that of the benchmark index, FTSE Bursa
Malaysia KLCI, balanced with the need to facilitate liquidity provision. As provided in the
Deeds, the “accrual period” or financial year shall end on 31 December and the units in the
Fund were first offered for sale on 7 June 2007.
14
FTSE Bursa Malaysia KLCI etf (“FBM KLCI etf”)
NOTES TO THE FINANCIAL STATEMENTSFOR THE FINANCIAL PERIOD FROM 1 JANUARY 2020 TO 30 JUNE 2020
2. BASIS OF PREPARATION OF FINANCIAL STATEMENTS (CONT’D.)
Standards issued but not yet effective (cont’d.)
Effective for
financial periods
beginning on or after
MFRS 17 Insurance Contracts 1 January 2021
Amendments to MFRS 101: Presentation of Financial Statements 1 January 2022
Classification of Liabilities as Current or Non-Current
Amendments to MFRSs contained in the document entitled 1 January 2022
“Annual Improvements to MFRS Standards 2018-2020”
Reference to the Conceptual Framework 1 January 2022
(Amendments to MFRS 3 Business Combinations)*
Property, Plant and Equipment – Proceeds before Intended Use 1 January 2022
(Amendments to MFRS 116 Property, Plant and Equipment)*
Onerous Contracts – Cost of Fulfilling a Contract 1 January 2022
(Amendments to MFRS 137 Provisions, Contingent Liabilities and
Contingent Assets)
Amendments to MFRS 10 and MFRS 128: Sale or Contribution Deferred
of Assets between an Investor and its Associate or Joint Venture
* These MFRS and Amendments to MFRSs are not relevant to the Fund.
3. SUMMARY OF SIGNIFICANT ACCOUNTING POLICIES
3.1 Income recognition
(i) Dividend income
(ii) Interest income
(iii) Gain or loss on disposal of investments
Dividend income is recognised when the Fund’s right to receive payment is
established.
Interest income on short-term deposits is recognised on an accrual basis using the
effective interest method.
On disposal of investments, the net realised gain or loss on disposal is measured
as the difference between the net disposal proceeds and the carrying amount of
the investments. The net realised gain or loss is recognised in profit or loss.
Income is recognised to the extent that it is probable that the economic benefits will flow
to the Fund and the income can be reliably measured. Income is measured at the fair
value of consideration received or receivable.
15
FTSE Bursa Malaysia KLCI etf (“FBM KLCI etf”)
NOTES TO THE FINANCIAL STATEMENTSFOR THE FINANCIAL PERIOD FROM 1 JANUARY 2020 TO 30 JUNE 2020
3. SUMMARY OF SIGNIFICANT ACCOUNTING POLICIES (CONT’D.)
3.2 Income tax
3.3 Functional and presentation currency
3.4 Statement of cash flows
The Fund adopts the direct method in the preparation of the statement of cash flows.
3.5 Distribution
3.6 Unit holders’ capital
Current taxes are recognised in profit or loss except to the extent that the tax relates to
items recognised outside profit or loss, either in other comprehensive income or directly
in equity.
Functional currency is the currency of the primary economic environment in which the
Fund operates that most faithfully represents the economic effects of the underlying
transactions. The functional currency of the Fund is Ringgit Malaysia (“RM”) which
reflects the currency in which the Fund competes for funds, issues and redeems units.
The Fund has also adopted RM as its presentation currency.
Current tax assets and liabilities are measured at the amount expected to be recovered
from or paid to the tax authorities. The tax rates and tax laws used to compute the
amount are those that are enacted or substantively enacted at the reporting date.
Cash equivalents are short-term, highly liquid investments that are readily convertible to
cash with insignificant risk of changes in value.
Distributions are at the discretion of the Fund. A distribution to the Fund’s unit holders is
accounted for as a deduction from realised income. A proposed distribution is
recognised as a liability in the period in which it is approved. Distribution is either
reinvested or paid in cash to the unit holders on the income payment date.
Reinvestment of units is based on the NAV per unit on the income payment date, which
is also the time of creation.
The unit holders’ capital of the Fund meets the definition of puttable instruments and is
classified as equity instruments under MFRS 132 Financial Instruments: Presentation
(“MFRS 132”).
16
FTSE Bursa Malaysia KLCI etf (“FBM KLCI etf”)
NOTES TO THE FINANCIAL STATEMENTSFOR THE FINANCIAL PERIOD FROM 1 JANUARY 2020 TO 30 JUNE 2020
3. SUMMARY OF SIGNIFICANT ACCOUNTING POLICIES (CONT’D.)
3.7 Financial assets – initial recognition and measurement
(i) Initial recognition
(ii) Initial measurement
(iii) “Day 1” profit or loss
3.8 Financial assets – classification and subsequent measurement
Financial assets and financial liabilities are recognised when the Fund becomes a
party to the contractual provisions of the instrument. Regular way purchases and
sales of financial assets are recognised using trade date accounting or settlement
date accounting. The method used is applied consistently for all purchases and
sales of financial assets that belong to the same category of financial assets.
All financial assets are recognised initially at fair value, in the case of financial
assets not recorded at FVTPL, transaction costs that are attributable to the
acquisition of the financial asset. All financial liabilities are recognised initially at
fair value and, in the case of financial liabilities not recorded at FVTPL, net of
directly attributable transaction costs.
At initial measurement, if the transaction price differs from the fair value, the Fund
immediately recognises the difference between the transaction price and fair value
(a “Day 1” profit or loss) in profit or loss provided that fair value is evidenced by a
quoted price in an active market for an identical asset or liability (i.e. Level 1 input)
or based on a valuation technique that uses only data from observable markets.
In all other cases, the difference between the transaction price and model value is
recognised in profit or loss on a systematic and rational basis that reflects the
nature of the instrument over its tenure.
The Fund subsequently measures its investments in equity investments and collective
investment schemes (“CIS”) at FVTPL. Dividends/distribution earned whilst holding the
investments are recognised in profit or loss when the right to the payment has been
established. Gains and losses on the investments, realised and unrealised, are included
in profit or loss.
17
FTSE Bursa Malaysia KLCI etf (“FBM KLCI etf”)
NOTES TO THE FINANCIAL STATEMENTSFOR THE FINANCIAL PERIOD FROM 1 JANUARY 2020 TO 30 JUNE 2020
3. SUMMARY OF SIGNIFICANT ACCOUNTING POLICIES (CONT’D.)
3.9 Financial assets under MFRS 9
(i) Classification and measurement
The Fund may classify its financial assets under the following categories:
Financial assets at amortised cost
Financial assets at FVOCI
Financial assets at FVTPL
The classification of financial assets depends on the Fund’s business model of
managing the financial assets in order to generate cash flows (“business model
test”) and the contractual cash flow characteristics of the financial instruments
(“SPPI test”). The business model test determines whether cash flows will result
from collecting contractual cash flows, selling the financial assets, or both and the
assessment is performed on a portfolio basis. The SPPI test determines whether
the contractual cash flows are solely for payments of principal and interest and the
assessment is performed on a financial instrument basis.
A financial asset is measured at amortised cost if it is held within a business model
whose objective is to hold financial assets in order to collect contractual cash flows
and its contractual terms give rise on specified dates to cash flows that are solely
payments of principal and interest on the principal amount outstanding. The Fund
includes in this category deposits with financial institutions, cash at banks,
amounts due from brokers/financial institutions, amount due from the Manager
and other receivables.
A financial asset is measured at fair value through other comprehensive income
(“FVOCI”) if its business model is both to hold the asset to collect contractual cash
flows and to sell the financial asset. In addition, the contractual terms of the
financial assets give rise on specified dates to cash flows that are solely payments
of principal and interest on the outstanding principal.
These investments are initially recorded at fair value and transaction costs are
expensed in the profit or loss. Subsequent to initial recognition, these investments
are remeasured at fair value. All fair value adjustments are initially recognised
through OCI. Debt instruments at FVOCI are subject to impairment assessment.
Any financial assets that are not measured at amortised cost or FVOCI are
measured at FVTPL. Subsequent to initial recognition, financial assets at FVTPL
are measured at fair value. Changes in the fair value of those financial instruments
are recorded in “Net gain or loss on financial assets at FVTPL”. Interest earned
and dividend revenue elements of such instruments are recorded separately in
“Interest income” and “Dividend income” respectively.
18
FTSE Bursa Malaysia KLCI etf (“FBM KLCI etf”)
NOTES TO THE FINANCIAL STATEMENTSFOR THE FINANCIAL PERIOD FROM 1 JANUARY 2020 TO 30 JUNE 2020
3. SUMMARY OF SIGNIFICANT ACCOUNTING POLICIES (CONT’D.)
3.9 Financial assets under MFRS 9 (cont’d.)
(i) Classification and measurement (cont’d.)
Financial assets at FVTPL (cont’d.)
3.10 Financial liabilities – classification and subsequent measurement
3.11 Derecognition of financial instruments
(i) Derecognition of financial asset
-
-
-
-
(ii) Derecognition of financial liability
A financial asset (or, where applicable a part of a financial asset or part of a group
of similar financial assets) is derecognised when:
the Fund has transferred substantially all the risks and rewards of the asset,
or
A financial liability is derecognised when the obligation under the liability is
discharged, cancelled or expired. Gains and losses are recognised in profit or loss
when the liabilities are recognised, and through the amortisation process.
the rights to receive cash flows from the asset have expired, or
Instruments that qualify for amortised cost or FVOCI may be irrevocably
designated as FVTPL, if doing so eliminates or significantly reduces a
measurement or recognition inconsistency. Equity instruments are normally
measured at FVTPL, nevertheless, the Fund is allowed to irrevocably designate
equity instruments that are not held for trading as FVOCI, with no subsequent
reclassification of gains or losses to profit or loss.
Financial liabilities issued by the Fund are classified as financial liabilities at amortised
cost, where the substance of the contractual arrangement results in the Fund having an
obligation either to deliver cash or another financial asset to the holder. After initial
measurement, financial liabilities are subsequently measured at amortised cost using
the effective interest method. Amortised cost is calculated by taking into account any
discount or premium on acquisition and fees or costs that are an integral part of the
effective interest rate.
the Fund has transferred its rights to receive cash flows from the asset or has
assumed an obligation to pay the received cash flows in full without material
delay to a third party under a “pass-through” arrangement; and either:
the Fund has neither transferred nor retained substantially all the risks and
rewards of the asset, but has transferred control of the asset.
For investments classified as FVOCI - debt instruments, the cumulative fair value
change recognised in OCI is recycled to profit or loss.
19
FTSE Bursa Malaysia KLCI etf (“FBM KLCI etf”)
NOTES TO THE FINANCIAL STATEMENTSFOR THE FINANCIAL PERIOD FROM 1 JANUARY 2020 TO 30 JUNE 2020
3. SUMMARY OF SIGNIFICANT ACCOUNTING POLICIES (CONT’D.)
3.12 Financial instruments – expected credit losses (“ECL”)
-
-
-
3.13 Determination of fair value
3.14 Classification of realised and unrealised gains and losses
Unrealised gains and losses comprise changes in the fair value of financial instruments
for the period and from reversal of prior period’s unrealised gains and losses for
financial instruments which were realised (i.e. sold, redeemed or matured) during the
reporting period.
The Fund assesses on a forward-looking basis the ECL associated with its financial
assets at amortised cost. The Fund recognises a loss allowance for such losses at each
reporting date. The measurement of ECL reflects:
an unbiased and probability-weighted amount that is determined by evaluating a
range of possible outcomes;
Realised gains and losses on disposals of financial instruments classified at FVTPL are
calculated using the weighted average method. They represent the difference between
an instrument’s initial carrying amount and disposal amount.
Financial assets together with the associated allowance are written off when it has
exhausted all practical recovery efforts and there is no realistic prospect of future
recovery. The Fund may also write-off financial assets that are still subject to
enforcement activity when there is no reasonable expectation of full recovery. If a write-
off is later recovered, the recovery is credited to profit or loss.
the time value of money; and
The ECL in respect of financial assets at amortised cost, if any, is recognised in profit or
loss.
reasonable and supportable information that is available without undue cost or
effort at the reporting date about past events, current conditions and forecasts of
future economic conditions.
For investments in quoted securities, fair value is determined based on the closing price
quoted on Bursa Malaysia Berhad. Purchased cost is the quoted price that the Fund
paid when buying its investments. The difference between purchased cost and fair value
is treated as unrealised gain or loss and is recognised in profit or loss. Unrealised gains
or losses recognised in profit or loss are not distributable in nature.
20
FTSE Bursa Malaysia KLCI etf (“FBM KLCI etf”)
NOTES TO THE FINANCIAL STATEMENTSFOR THE FINANCIAL PERIOD FROM 1 JANUARY 2020 TO 30 JUNE 2020
3. SUMMARY OF SIGNIFICANT ACCOUNTING POLICIES (CONT’D.)
3.15 Significant accounting estimates and judgments
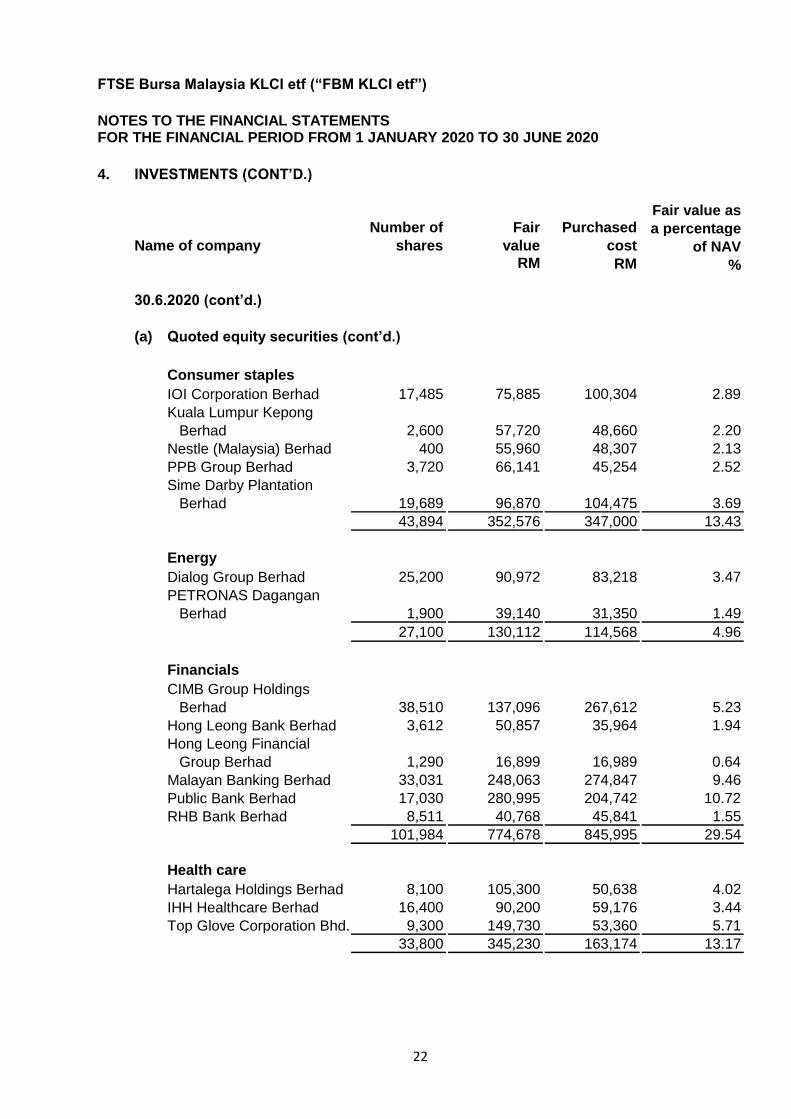
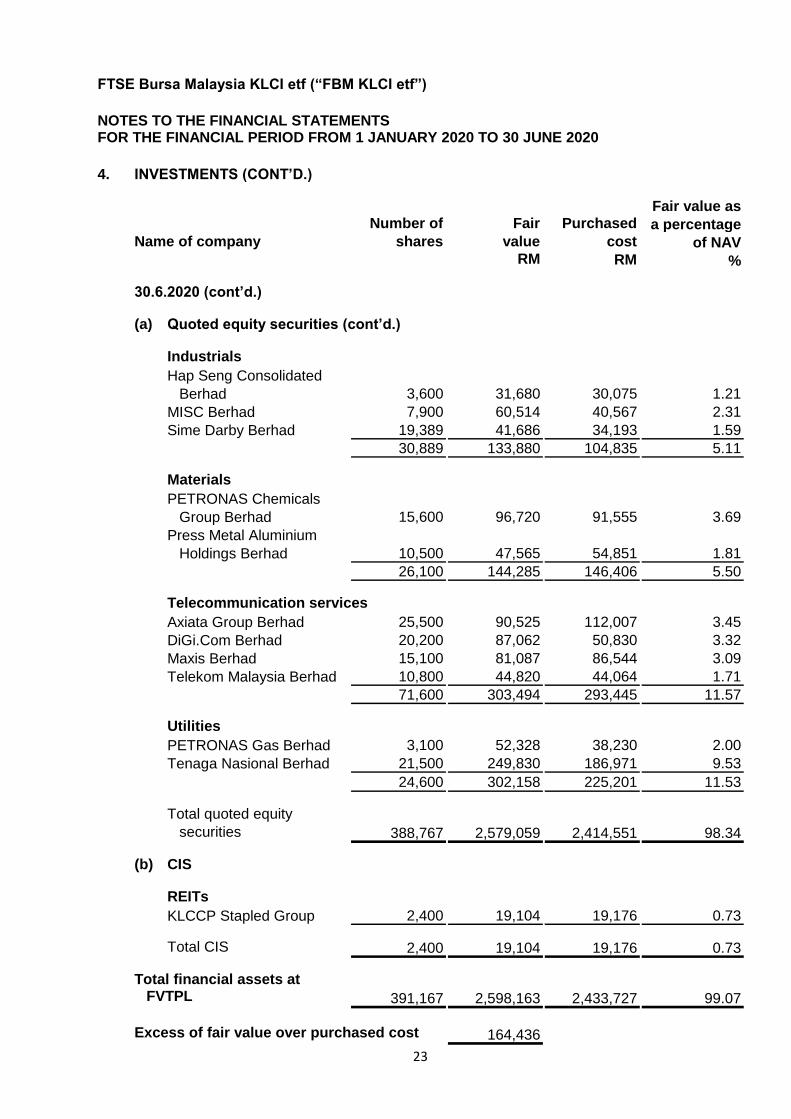
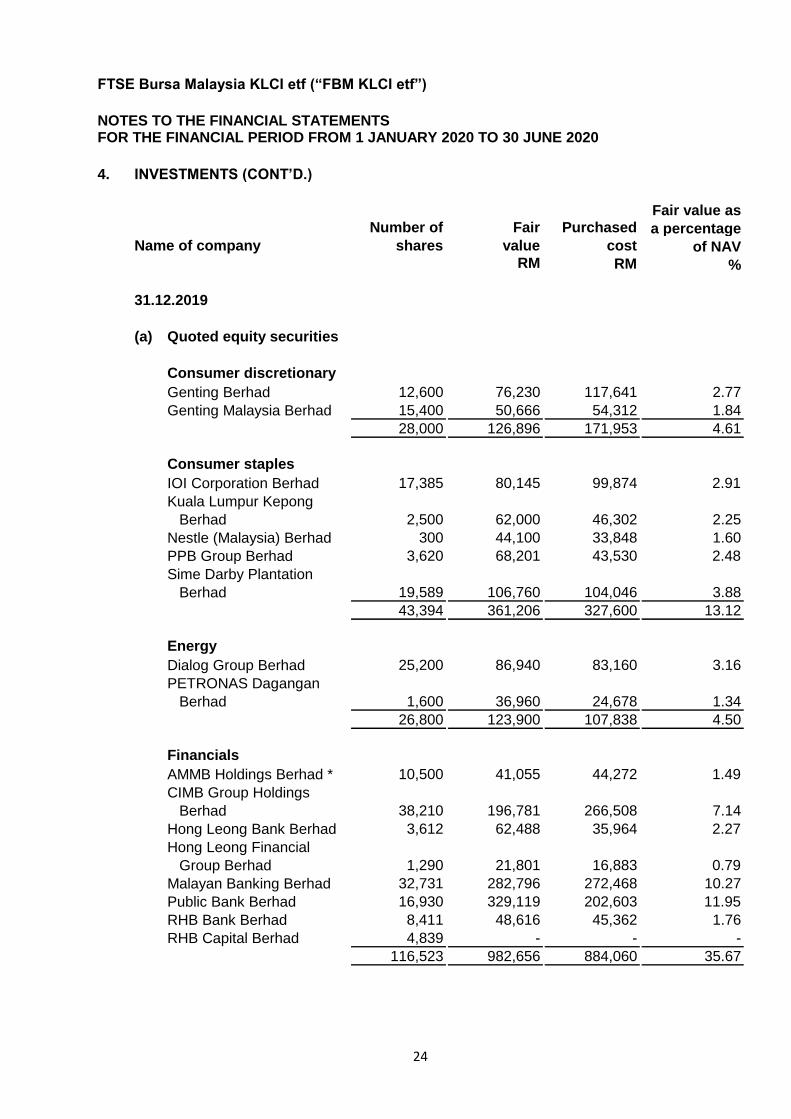
4. INVESTMENTS
30.6.2020 31.12.2019
Note RM RM
Financial assets at FVTPL
Quoted equity securities (a) 2,579,059 2,742,091
CIS (b) 19,104 -
2,598,163 2,742,091
Details of investments are as follows:
Fair value as Number of Fair Purchased a percentage
Name of company shares value cost of NAV RM RM %
30.6.2020
(a) Quoted equity securities
Consumer discretionary
Genting Berhad 12,600 51,660 117,641 1.97
Genting Malaysia Berhad 16,200 40,986 56,286 1.56
28,800 92,646 173,927 3.53
No major judgments have been made by the Manager in applying the Fund’s accounting
policies. There are no key assumptions concerning the future and other key sources of
estimation uncertainty at the reporting date, that have a significant risk of causing a
material adjustment to the carrying amounts of assets and liabilities within the next
financial period.
The preparation of the Fund’s financial statements requires the Manager to make
judgments, estimates and assumptions that affect the reported amounts of revenues,
expenses, assets and liabilities, and the disclosure of contingent liabilities at the
reporting date. However, uncertainty about these assumptions and estimates could
result in outcomes that could require a material adjustment to the carrying amount of the
asset or liability in the future.
The Fund classifies its investments as financial assets at FVTPL as the Fund may sell
its investments in the short-term for profit-taking or to meet unit holders’ cancellation of
units.
21
FTSE Bursa Malaysia KLCI etf (“FBM KLCI etf”)
NOTES TO THE FINANCIAL STATEMENTSFOR THE FINANCIAL PERIOD FROM 1 JANUARY 2020 TO 30 JUNE 2020
4. INVESTMENTS (CONT’D.)
Fair value as Number of Fair Purchased a percentage
Name of company shares value cost of NAV RM RM %
30.6.2020 (cont’d.)
(a) Quoted equity securities (cont’d.)
Consumer staples
IOI Corporation Berhad 17,485 75,885 100,304 2.89
Kuala Lumpur Kepong
Berhad 2,600 57,720 48,660 2.20
Nestle (Malaysia) Berhad 400 55,960 48,307 2.13
PPB Group Berhad 3,720 66,141 45,254 2.52
Sime Darby Plantation
Berhad 19,689 96,870 104,475 3.69
43,894 352,576 347,000 13.43
Energy
Dialog Group Berhad 25,200 90,972 83,218 3.47
PETRONAS Dagangan
Berhad 1,900 39,140 31,350 1.49
27,100 130,112 114,568 4.96
Financials
CIMB Group Holdings
Berhad 38,510 137,096 267,612 5.23
Hong Leong Bank Berhad 3,612 50,857 35,964 1.94
Hong Leong Financial
Group Berhad 1,290 16,899 16,989 0.64
Malayan Banking Berhad 33,031 248,063 274,847 9.46
Public Bank Berhad 17,030 280,995 204,742 10.72
RHB Bank Berhad 8,511 40,768 45,841 1.55
101,984 774,678 845,995 29.54
Health care
Hartalega Holdings Berhad 8,100 105,300 50,638 4.02
IHH Healthcare Berhad 16,400 90,200 59,176 3.44
Top Glove Corporation Bhd. 9,300 149,730 53,360 5.71
33,800 345,230 163,174 13.17
22
FTSE Bursa Malaysia KLCI etf (“FBM KLCI etf”)
NOTES TO THE FINANCIAL STATEMENTSFOR THE FINANCIAL PERIOD FROM 1 JANUARY 2020 TO 30 JUNE 2020
4. INVESTMENTS (CONT’D.)
Fair value as Number of Fair Purchased a percentage
Name of company shares value cost of NAV RM RM %
30.6.2020 (cont’d.)
(a) Quoted equity securities (cont’d.)
Industrials
Hap Seng Consolidated
Berhad 3,600 31,680 30,075 1.21
MISC Berhad 7,900 60,514 40,567 2.31
Sime Darby Berhad 19,389 41,686 34,193 1.59
30,889 133,880 104,835 5.11
Materials
PETRONAS Chemicals
Group Berhad 15,600 96,720 91,555 3.69
Press Metal Aluminium
Holdings Berhad 10,500 47,565 54,851 1.81
26,100 144,285 146,406 5.50
Telecommunication services
Axiata Group Berhad 25,500 90,525 112,007 3.45
DiGi.Com Berhad 20,200 87,062 50,830 3.32
Maxis Berhad 15,100 81,087 86,544 3.09
Telekom Malaysia Berhad 10,800 44,820 44,064 1.71
71,600 303,494 293,445 11.57
Utilities
PETRONAS Gas Berhad 3,100 52,328 38,230 2.00
Tenaga Nasional Berhad 21,500 249,830 186,971 9.53
24,600 302,158 225,201 11.53
Total quoted equity
securities 388,767 2,579,059 2,414,551 98.34
(b) CIS
REITs
KLCCP Stapled Group 2,400 19,104 19,176 0.73
Total CIS 2,400 19,104 19,176 0.73
Total financial assets at FVTPL 391,167 2,598,163 2,433,727 99.07
Excess of fair value over purchased cost 164,436
23
FTSE Bursa Malaysia KLCI etf (“FBM KLCI etf”)
NOTES TO THE FINANCIAL STATEMENTSFOR THE FINANCIAL PERIOD FROM 1 JANUARY 2020 TO 30 JUNE 2020
4. INVESTMENTS (CONT’D.)
Fair value as Number of Fair Purchased a percentage
Name of company shares value cost of NAV RM RM %
31.12.2019
(a) Quoted equity securities
Consumer discretionary
Genting Berhad 12,600 76,230 117,641 2.77
Genting Malaysia Berhad 15,400 50,666 54,312 1.84
28,000 126,896 171,953 4.61
Consumer staples
IOI Corporation Berhad 17,385 80,145 99,874 2.91
Kuala Lumpur Kepong
Berhad 2,500 62,000 46,302 2.25
Nestle (Malaysia) Berhad 300 44,100 33,848 1.60
PPB Group Berhad 3,620 68,201 43,530 2.48
Sime Darby Plantation
Berhad 19,589 106,760 104,046 3.88
43,394 361,206 327,600 13.12
Energy
Dialog Group Berhad 25,200 86,940 83,160 3.16
PETRONAS Dagangan
Berhad 1,600 36,960 24,678 1.34
26,800 123,900 107,838 4.50
Financials
AMMB Holdings Berhad * 10,500 41,055 44,272 1.49
CIMB Group Holdings
Berhad 38,210 196,781 266,508 7.14
Hong Leong Bank Berhad 3,612 62,488 35,964 2.27
Hong Leong Financial
Group Berhad 1,290 21,801 16,883 0.79
Malayan Banking Berhad 32,731 282,796 272,468 10.27
Public Bank Berhad 16,930 329,119 202,603 11.95
RHB Bank Berhad 8,411 48,616 45,362 1.76
RHB Capital Berhad 4,839 - - -
116,523 982,656 884,060 35.67
24
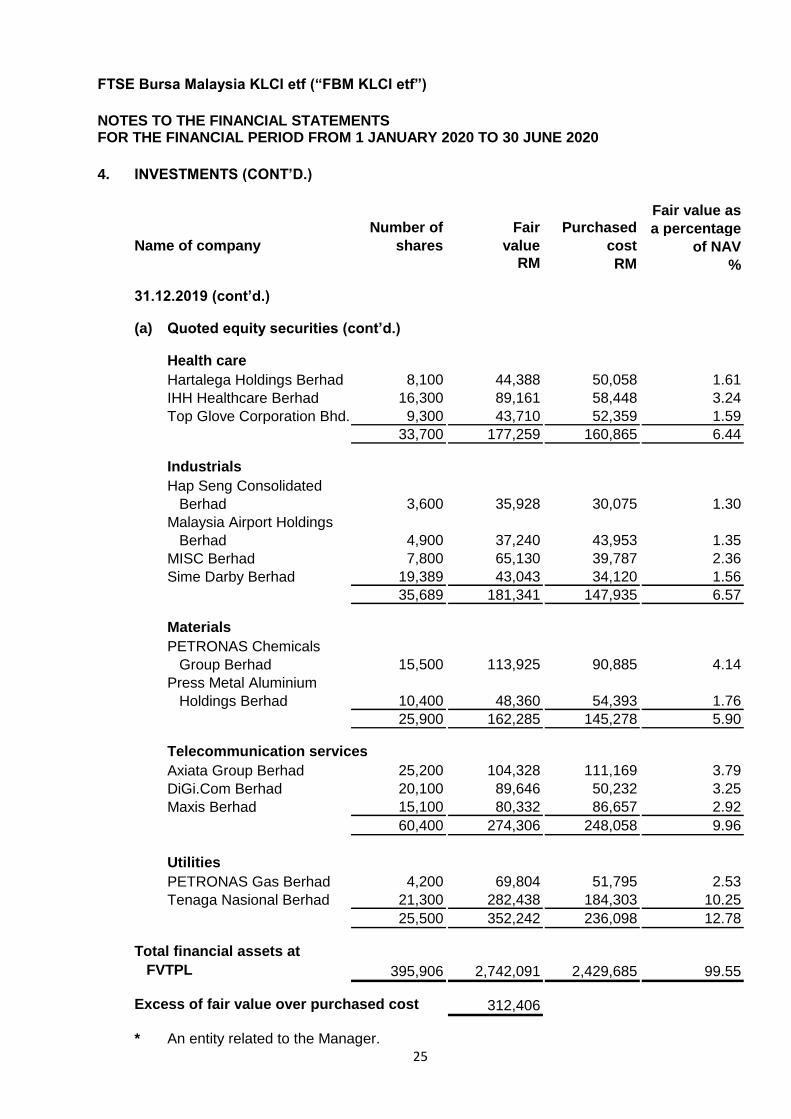
FTSE Bursa Malaysia KLCI etf (“FBM KLCI etf”)
NOTES TO THE FINANCIAL STATEMENTSFOR THE FINANCIAL PERIOD FROM 1 JANUARY 2020 TO 30 JUNE 2020
4. INVESTMENTS (CONT’D.)
Fair value as Number of Fair Purchased a percentage
Name of company shares value cost of NAV RM RM %
31.12.2019 (cont’d.)
(a) Quoted equity securities (cont’d.)
Health care
Hartalega Holdings Berhad 8,100 44,388 50,058 1.61
IHH Healthcare Berhad 16,300 89,161 58,448 3.24
Top Glove Corporation Bhd. 9,300 43,710 52,359 1.59
33,700 177,259 160,865 6.44
Industrials
Hap Seng Consolidated
Berhad 3,600 35,928 30,075 1.30
Malaysia Airport Holdings
Berhad 4,900 37,240 43,953 1.35
MISC Berhad 7,800 65,130 39,787 2.36
Sime Darby Berhad 19,389 43,043 34,120 1.56
35,689 181,341 147,935 6.57
Materials
PETRONAS Chemicals
Group Berhad 15,500 113,925 90,885 4.14
Press Metal Aluminium
Holdings Berhad 10,400 48,360 54,393 1.76
25,900 162,285 145,278 5.90
Telecommunication services
Axiata Group Berhad 25,200 104,328 111,169 3.79
DiGi.Com Berhad 20,100 89,646 50,232 3.25
Maxis Berhad 15,100 80,332 86,657 2.92
60,400 274,306 248,058 9.96
Utilities
PETRONAS Gas Berhad 4,200 69,804 51,795 2.53
Tenaga Nasional Berhad 21,300 282,438 184,303 10.25
25,500 352,242 236,098 12.78
Total financial assets at
FVTPL 395,906 2,742,091 2,429,685 99.55
Excess of fair value over purchased cost 312,406
* An entity related to the Manager.
25
FTSE Bursa Malaysia KLCI etf (“FBM KLCI etf”)
NOTES TO THE FINANCIAL STATEMENTSFOR THE FINANCIAL PERIOD FROM 1 JANUARY 2020 TO 30 JUNE 2020
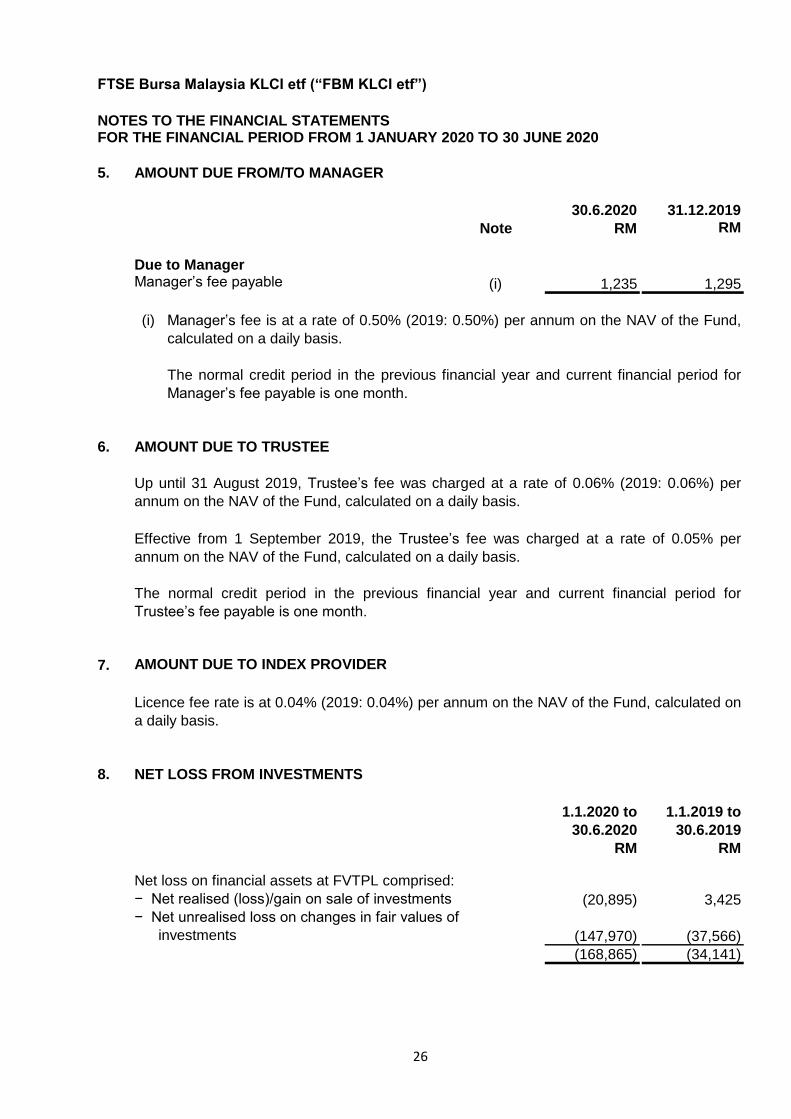
5. AMOUNT DUE FROM/TO MANAGER
30.6.2020 31.12.2019
Note RM RM
Due to ManagerManager’s fee payable (i) 1,235 1,295
(i)
6. AMOUNT DUE TO TRUSTEE
7. AMOUNT DUE TO INDEX PROVIDER
8. NET LOSS FROM INVESTMENTS
1.1.2020 to 1.1.2019 to
30.6.2020 30.6.2019
RM RM
Net loss on financial assets at FVTPL comprised:
− Net realised (loss)/gain on sale of investments (20,895) 3,425
− Net unrealised loss on changes in fair values of
investments (147,970) (37,566)
(168,865) (34,141)
Licence fee rate is at 0.04% (2019: 0.04%) per annum on the NAV of the Fund, calculated on
a daily basis.
Manager’s fee is at a rate of 0.50% (2019: 0.50%) per annum on the NAV of the Fund,
calculated on a daily basis.
The normal credit period in the previous financial year and current financial period for
Manager’s fee payable is one month.
Effective from 1 September 2019, the Trustee’s fee was charged at a rate of 0.05% per
annum on the NAV of the Fund, calculated on a daily basis.
The normal credit period in the previous financial year and current financial period for
Trustee’s fee payable is one month.
Up until 31 August 2019, Trustee’s fee was charged at a rate of 0.06% (2019: 0.06%) per
annum on the NAV of the Fund, calculated on a daily basis.
26
FTSE Bursa Malaysia KLCI etf (“FBM KLCI etf”)
NOTES TO THE FINANCIAL STATEMENTSFOR THE FINANCIAL PERIOD FROM 1 JANUARY 2020 TO 30 JUNE 2020
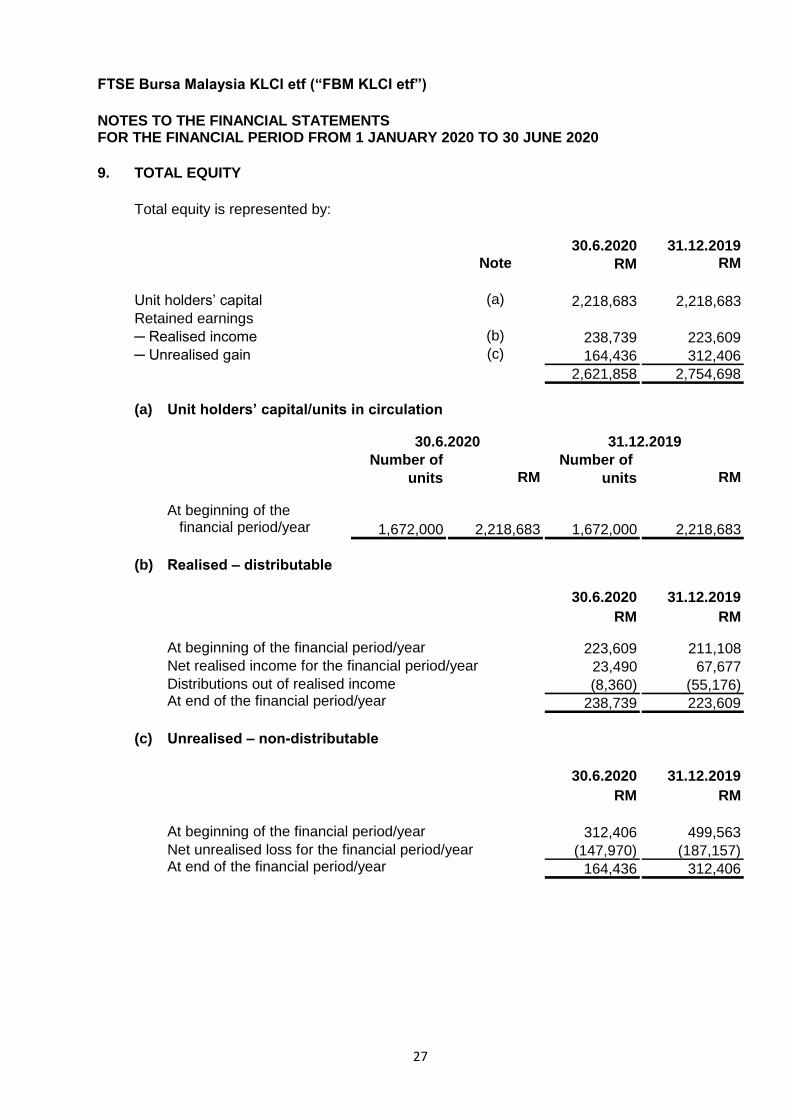
9. TOTAL EQUITY
Total equity is represented by:
30.6.2020 31.12.2019
Note RM RM
Unit holders’ capital (a) 2,218,683 2,218,683
Retained earnings
─ Realised income (b) 238,739 223,609
─ Unrealised gain (c) 164,436 312,406
2,621,858 2,754,698
(a)
30.6.2020 31.12.2019
Number of Number of
units RM units RM
At beginning of the financial period/year 1,672,000 2,218,683 1,672,000 2,218,683
(b) Realised – distributable
30.6.2020 31.12.2019
RM RM
At beginning of the financial period/year 223,609 211,108
Net realised income for the financial period/year 23,490 67,677
Distributions out of realised income (8,360) (55,176)At end of the financial period/year 238,739 223,609
(c) Unrealised – non-distributable
30.6.2020 31.12.2019
RM RM
At beginning of the financial period/year 312,406 499,563
Net unrealised loss for the financial period/year (147,970) (187,157)At end of the financial period/year 164,436 312,406
Unit holders’ capital/units in circulation
27
FTSE Bursa Malaysia KLCI etf (“FBM KLCI etf”)
NOTES TO THE FINANCIAL STATEMENTSFOR THE FINANCIAL PERIOD FROM 1 JANUARY 2020 TO 30 JUNE 2020
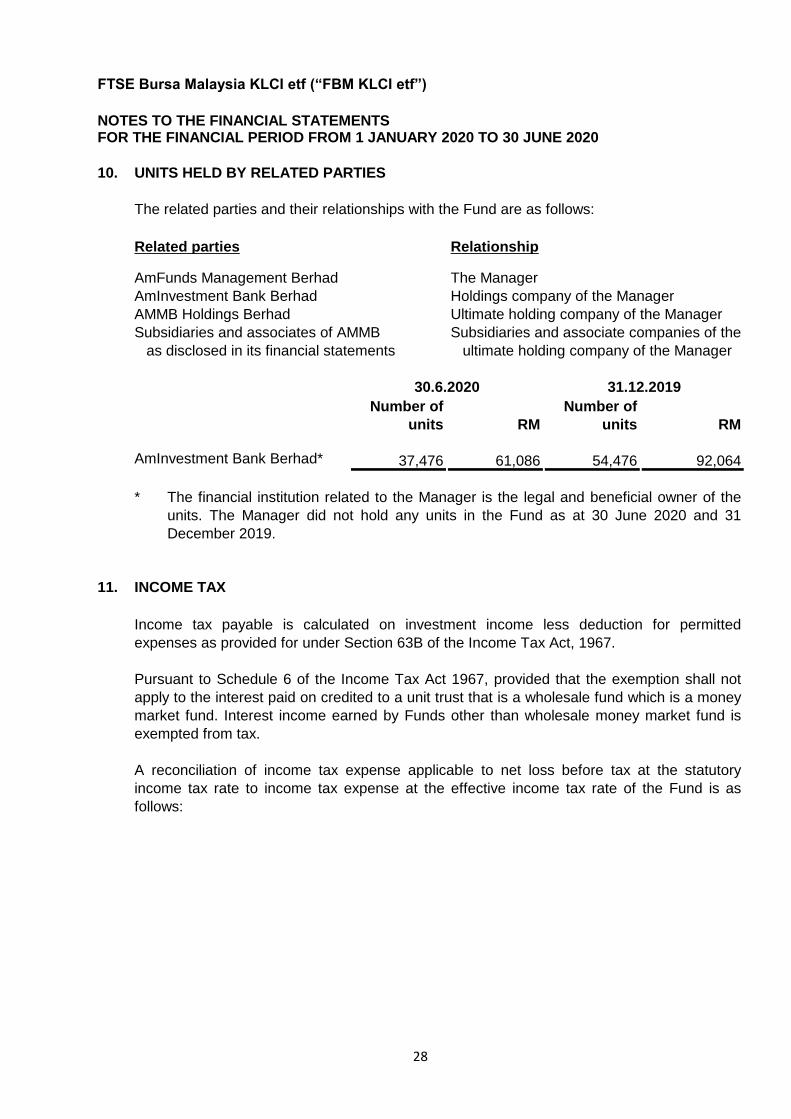
10. UNITS HELD BY RELATED PARTIES
The related parties and their relationships with the Fund are as follows:
Related parties Relationship
AmFunds Management Berhad The Manager
AmInvestment Bank Berhad Holdings company of the Manager
AMMB Holdings Berhad Ultimate holding company of the Manager
Subsidiaries and associates of AMMB Subsidiaries and associate companies of the
as disclosed in its financial statements ultimate holding company of the Manager
Number of Number of
units RM units RM
AmInvestment Bank Berhad* 37,476 61,086 54,476 92,064
*
11. INCOME TAX
30.6.2020 31.12.2019
The financial institution related to the Manager is the legal and beneficial owner of the
units. The Manager did not hold any units in the Fund as at 30 June 2020 and 31
December 2019.
Pursuant to Schedule 6 of the Income Tax Act 1967, provided that the exemption shall not
apply to the interest paid on credited to a unit trust that is a wholesale fund which is a money
market fund. Interest income earned by Funds other than wholesale money market fund is
exempted from tax.
A reconciliation of income tax expense applicable to net loss before tax at the statutory
income tax rate to income tax expense at the effective income tax rate of the Fund is as
follows:
Income tax payable is calculated on investment income less deduction for permitted
expenses as provided for under Section 63B of the Income Tax Act, 1967.
28
FTSE Bursa Malaysia KLCI etf (“FBM KLCI etf”)
NOTES TO THE FINANCIAL STATEMENTSFOR THE FINANCIAL PERIOD FROM 1 JANUARY 2020 TO 30 JUNE 2020
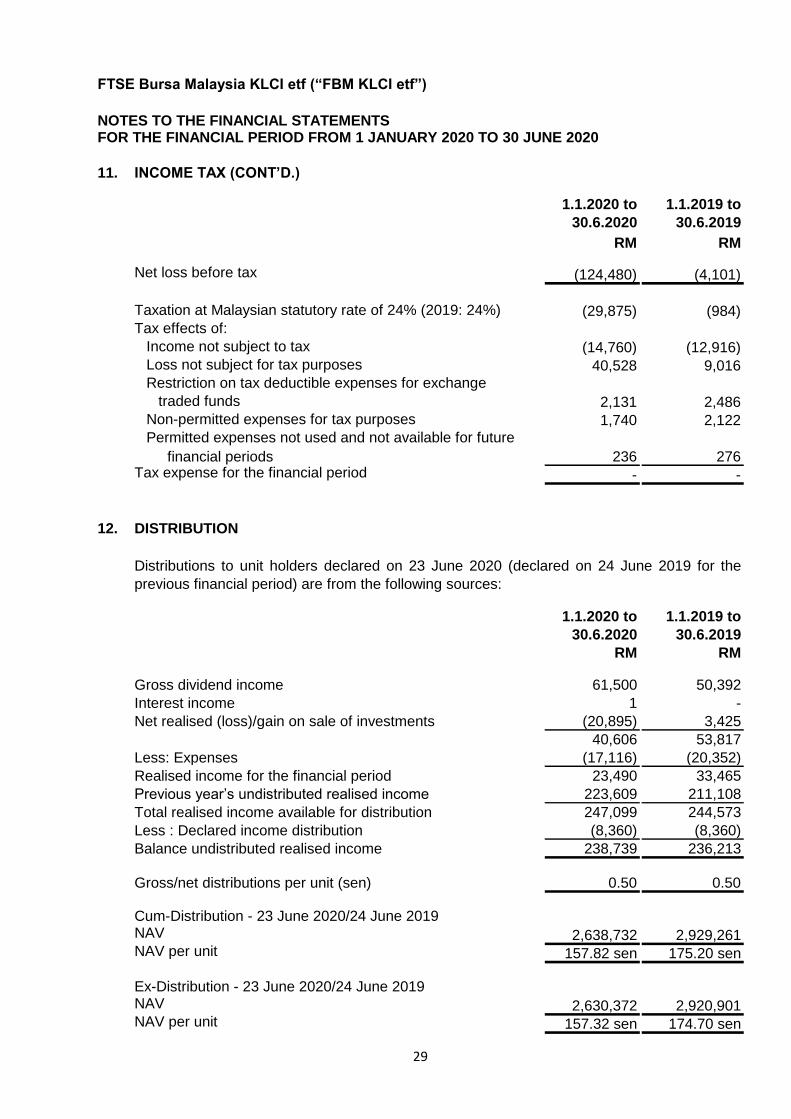
11. INCOME TAX (CONT’D.)
1.1.2020 to 1.1.2019 to
30.6.2020 30.6.2019
RM RM
Net loss before tax (124,480) (4,101)
Taxation at Malaysian statutory rate of 24% (2019: 24%) (29,875) (984)
Tax effects of:
Income not subject to tax (14,760) (12,916)
Loss not subject for tax purposes 40,528 9,016
Restriction on tax deductible expenses for exchange
traded funds 2,131 2,486
Non-permitted expenses for tax purposes 1,740 2,122
Permitted expenses not used and not available for future
236 276Tax expense for the financial period - -
12. DISTRIBUTION
1.1.2020 to 1.1.2019 to
30.6.2020 30.6.2019
RM RM
Gross dividend income 61,500 50,392
Interest income 1 -
Net realised (loss)/gain on sale of investments (20,895) 3,425
40,606 53,817
Less: Expenses (17,116) (20,352)
Realised income for the financial period 23,490 33,465
Previous year’s undistributed realised income 223,609 211,108
Total realised income available for distribution 247,099 244,573
Less : Declared income distribution (8,360) (8,360)
Balance undistributed realised income 238,739 236,213
Gross/net distributions per unit (sen) 0.50 0.50
Cum-Distribution - 23 June 2020/24 June 2019NAV 2,638,732 2,929,261NAV per unit 157.82 sen 175.20 sen
Ex-Distribution - 23 June 2020/24 June 2019NAV 2,630,372 2,920,901NAV per unit 157.32 sen 174.70 sen
Distributions to unit holders declared on 23 June 2020 (declared on 24 June 2019 for the
previous financial period) are from the following sources:
financial periods
29
FTSE Bursa Malaysia KLCI etf (“FBM KLCI etf”)
NOTES TO THE FINANCIAL STATEMENTSFOR THE FINANCIAL PERIOD FROM 1 JANUARY 2020 TO 30 JUNE 2020
12. DISTRIBUTION (CONT’D.)
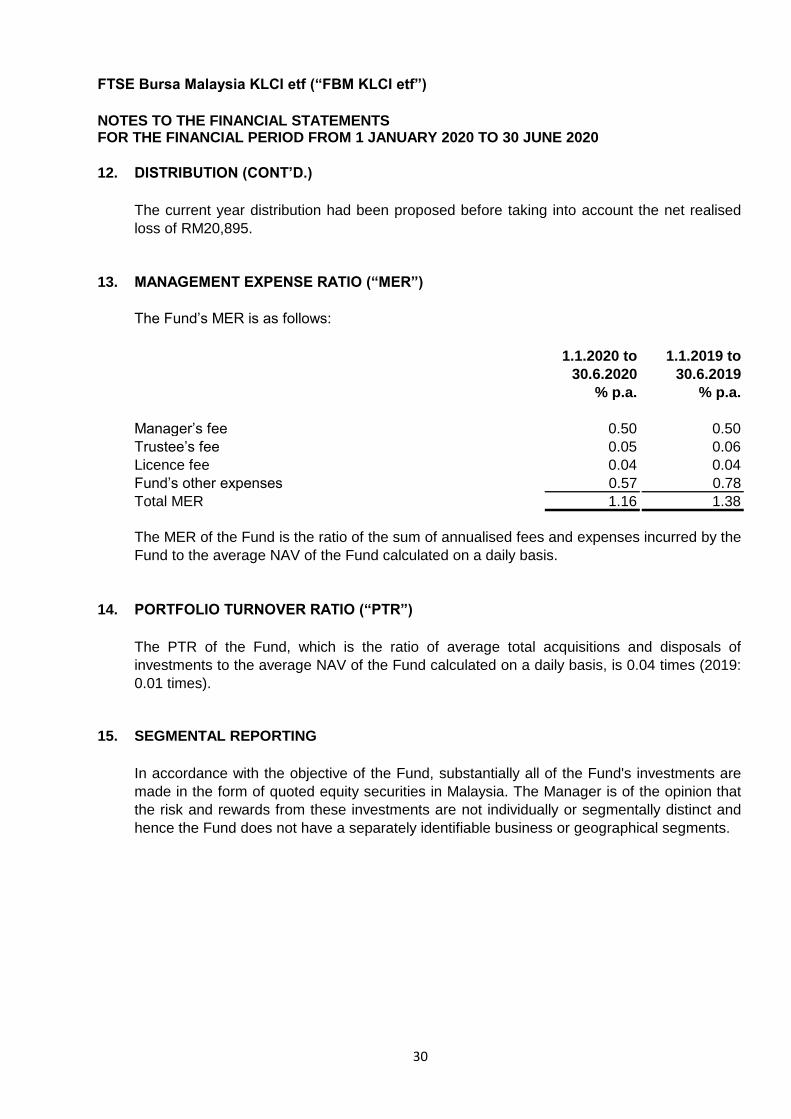
13. MANAGEMENT EXPENSE RATIO (“MER”)
The Fund’s MER is as follows:
1.1.2020 to 1.1.2019 to
30.6.2020 30.6.2019
% p.a. % p.a.
Manager’s fee 0.50 0.50
Trustee’s fee 0.05 0.06
Licence fee 0.04 0.04
Fund’s other expenses 0.57 0.78
Total MER 1.16 1.38
14. PORTFOLIO TURNOVER RATIO (“PTR”)
15. SEGMENTAL REPORTING
In accordance with the objective of the Fund, substantially all of the Fund's investments are
made in the form of quoted equity securities in Malaysia. The Manager is of the opinion that
the risk and rewards from these investments are not individually or segmentally distinct and
hence the Fund does not have a separately identifiable business or geographical segments.
The PTR of the Fund, which is the ratio of average total acquisitions and disposals of
investments to the average NAV of the Fund calculated on a daily basis, is 0.04 times (2019:
0.01 times).
The MER of the Fund is the ratio of the sum of annualised fees and expenses incurred by the
Fund to the average NAV of the Fund calculated on a daily basis.
The current year distribution had been proposed before taking into account the net realised
loss of RM20,895.
30
FTSE Bursa Malaysia KLCI etf (“FBM KLCI etf”)
NOTES TO THE FINANCIAL STATEMENTS
FOR THE FINANCIAL PERIOD FROM 1 JANUARY 2020 TO 30 JUNE 2020
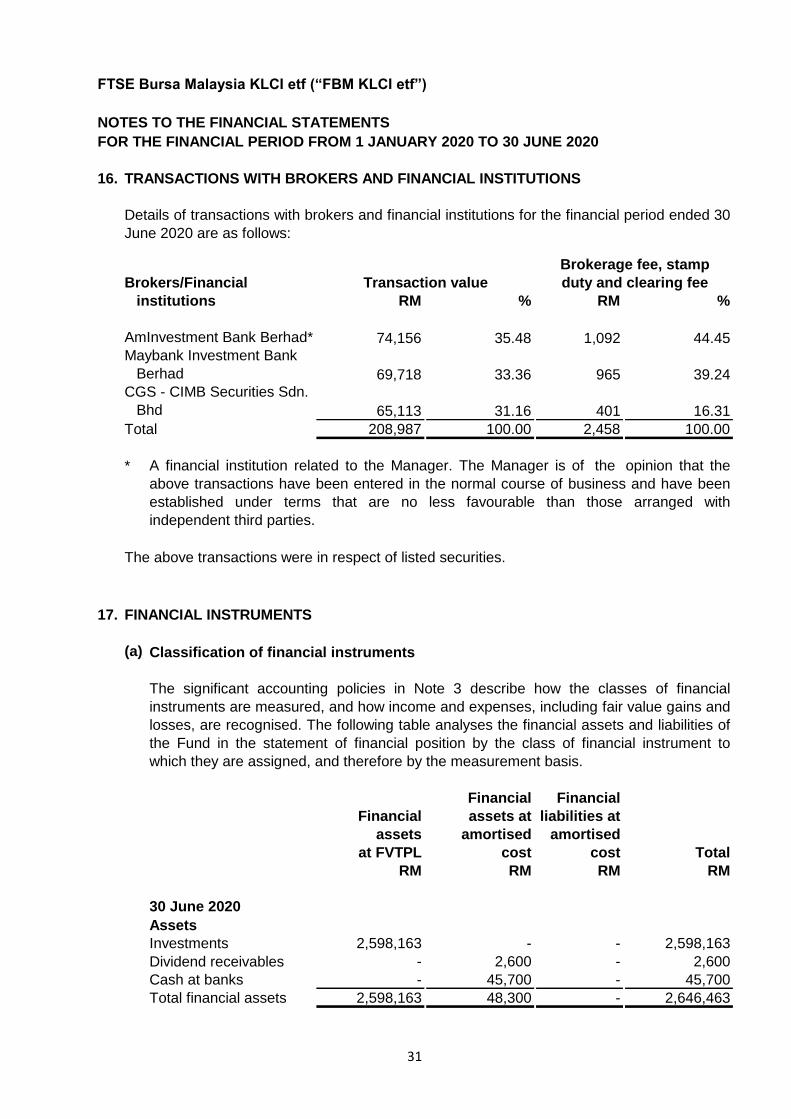
16. TRANSACTIONS WITH BROKERS AND FINANCIAL INSTITUTIONS
Brokers/Financial
institutions RM % RM %
AmInvestment Bank Berhad* 74,156 35.48 1,092 44.45
Maybank Investment Bank
Berhad 69,718 33.36 965 39.24
CGS - CIMB Securities Sdn.
Bhd 65,113 31.16 401 16.31
Total 208,987 100.00 2,458 100.00
*
17. FINANCIAL INSTRUMENTS
(a) Classification of financial instruments
Financial Financial
Financial assets at liabilities at
assets amortised amortised
at FVTPL cost cost Total
RM RM RM RM
Assets
Investments 2,598,163 - - 2,598,163
Dividend receivables - 2,600 - 2,600
Cash at banks - 45,700 - 45,700
Total financial assets 2,598,163 48,300 - 2,646,463
duty and clearing feeTransaction value
Details of transactions with brokers and financial institutions for the financial period ended 30
June 2020 are as follows:
Brokerage fee, stamp
A financial institution related to the Manager. The Manager is of the opinion that the
above transactions have been entered in the normal course of business and have been
established under terms that are no less favourable than those arranged with
independent third parties.
The above transactions were in respect of listed securities.
The significant accounting policies in Note 3 describe how the classes of financial
instruments are measured, and how income and expenses, including fair value gains and
losses, are recognised. The following table analyses the financial assets and liabilities of
the Fund in the statement of financial position by the class of financial instrument to
which they are assigned, and therefore by the measurement basis.
30 June 2020
31
FTSE Bursa Malaysia KLCI etf (“FBM KLCI etf”)
NOTES TO THE FINANCIAL STATEMENTS
FOR THE FINANCIAL PERIOD FROM 1 JANUARY 2020 TO 30 JUNE 2020
17. FINANCIAL INSTRUMENTS (CONT’D.)
(a) Classification of financial instruments (cont’d.)
Financial Financial
Financial assets at liabilities at
assets amortised amortised
at FVTPL cost cost Total
RM RM RM RM
Liabilities
Amount due to Manager - - 1,235 1,235
Amount due to Trustee - - 116 116
Amount due to Index
provider - - 59 59
Distribution payable - - 8,360 8,360
Sundry payables and
accrued expenses - - 14,835 14,835
Total financial liabilities - - 24,605 24,605
31 December 2019
Assets
Investments 2,742,091 - - 2,742,091
Cash at banks - 78,399 - 78,399
Total financial assets 2,742,091 78,399 - 2,820,490
Liabilities
Amount due to Manager - - 1,295 1,295
Amount due to Trustee - - 122 122
Amount due to Index
provider - - 2,752 2,752
Distribution payable - - 46,816 46,816
Sundry payables and
accrued expenses - - 14,807 14,807
Total financial liabilities - - 65,792 65,792
Income, expense, gains
and losses
1.1.2020 to 1.1.2019 to
30.6.2020 30.6.2019
RM RM
Net loss from financial assets at FVTPL (168,865) (34,141)
Income, of which derived from:
– Gross dividend income from financial assets at FVTPL 61,500 50,392
– Interest income from financial assets at amortised cost 1 -
30 June 2020
32
FTSE Bursa Malaysia KLCI etf (“FBM KLCI etf”)
NOTES TO THE FINANCIAL STATEMENTS
FOR THE FINANCIAL PERIOD FROM 1 JANUARY 2020 TO 30 JUNE 2020
17. FINANCIAL INSTRUMENTS (CONT’D.)
(b) Financial instruments that are carried at fair value
Level 1: quoted (unadjusted) prices in active markets for identical assets or liabilities;
Level 2:
Level 3:
Level 1 Level 2 Level 3 Total
RM RM RM RM
30 June 2020
Financial assets at
FVTPL 2,598,163 - - 2,598,163
31 December 2019
Financial assets at
FVTPL 2,742,091 - - 2,742,091
(c)
• Deposit with financial institution
• Cash at banks
• Amount due to Manager
• Amount due to Trustee
• Amount due to Index provider
• Distribution payable
• Sundry payables and accrued expenses
The Fund’s financial assets and liabilities are carried at fair value.
The Fund uses the following hierarchy for determining and disclosing the fair value of
financial instruments by valuation technique:
other techniques for which all inputs which have a significant effect on the
recorded fair values are observable; either directly or indirectly; or
techniques which use inputs which have a significant effect on the recorded fair
value that are not based on observable market data.
The following table shows an analysis of financial instruments recorded at fair value by
the level of the fair value hierarchy:
Financial instruments that are not carried at fair value and whose carrying
amounts are reasonable approximation of fair value
The following are classes of financial instruments that are not carried at fair value and
whose carrying amounts are reasonable approximation of fair value due to their short
period to maturity or short credit period:
There are no financial instruments which are not carried at fair values and whose
carrying amounts are not reasonable approximation of their respective fair values.
33

FTSE Bursa Malaysia KLCI etf (“FBM KLCI etf”)
NOTES TO THE FINANCIAL STATEMENTS
FOR THE FINANCIAL PERIOD FROM 1 JANUARY 2020 TO 30 JUNE 2020
18. FINANCIAL RISK MANAGEMENT OBJECTIVES AND POLICIES
(a) Market risk
(i) Price risk
Percentage movements in
price by: 30.6.2020 31.12.2019
RM RM
-5.00% (129,908) (137,105)
+5.00% 129,908 137,105
Financial markets have experienced and may continue to experience significant volatility
resulting from the spread of a novel coronavirus known as Covid-19. The outbreak of
Covid-19 has resulted in travel and border restrictions, quarantines, supply chain
disruptions, lower consumer demand and general market uncertainty. The outcome of
global and local financial markets are highly uncertain and cannot be predicted at this
point in time. Due to this, the Manager of the Fund is unable to reliably estimate the
quantitative impact of Covid-19 towards the Fund’s performance for the next twelve
months. The Manager of the Fund will continue to actively monitor the developments in
the market to minimise any potential impact to the Fund.
Risk management is carried out by closely monitoring, measuring and mitigating the above
said risks, careful selection of investments coupled with stringent compliance to investment
restrictions as stipulated by the Capital Market and Services Act 2007, Securities
Commission’s Guidelines on Exchange Traded Funds and the Deed as the backbone of risk
management of the Fund.
The Fund is exposed to a variety of risks that include market risk, credit risk, liquidity risk,
single issuer risk, regulatory risk, management risk and non-compliance risk.
The Fund’s principal exposure to market risk arises primarily due to changes in the
market environment, global economic and geo-political developments.
Sensitivity of the Fund’s
NAV
The result below summarised the price risk sensitivity of the Fund’s NAV due to
movements of price by -5.00% and +5.00% respectively:
Price risk refers to the uncertainty of an investment’s future prices. In the event of
adverse price movements, the Fund might endure potential loss on its quoted
investments. In managing price risk, the Manager actively monitors the performance
and risk profile of the investment portfolio.
The Funds’s market risk is affected primarily by the following risks:
34

FTSE Bursa Malaysia KLCI etf (“FBM KLCI etf”)
NOTES TO THE FINANCIAL STATEMENTS
FOR THE FINANCIAL PERIOD FROM 1 JANUARY 2020 TO 30 JUNE 2020
18. FINANCIAL RISK MANAGEMENT OBJECTIVES AND POLICIES (CONT’D.)
(b) Credit risk
(c) Liquidity risk
(d) Single issuer risk
(e) Regulatory risk
(f) Management risk
Credit risk is the risk that the counterparty to a financial instrument will cause a financial
loss to the Fund by failing to discharge an obligation. Credit risk applies to short-term
deposits and dividends receivable. The issuer of such instruments may not be able to
fulfill the required interest payments or repay the principal invested or amount owing.
These risks may cause the Fund’s investments to fluctuate in value.
Liquidity risk is defined as the risk that the Fund will encounter difficulty in meeting
obligations associated with financial liabilities that are settled by delivering cash or
another financial asset. Exposure to liquidity risk arises because of the possibility that the
Fund could be required to pay its liabilities or redeem its units earlier than expected. The
Fund maintains sufficient level of liquid assets, after consultation with the Trustee, to
meet anticipated payments and cancellations of units by unit holders. Liquid assets
comprise of deposits with licensed financial institutions and other instruments, which are
capable of being converted into cash within 5 to 7 days. The Fund’s policy is to always
maintain a prudent level of liquid assets so as to reduce liquidity risk.
Poor management of the Fund may cause considerable losses to the Fund that in turn
may affect the NAV of the Fund.
Cash at banks are held for liquidity purposes and are not exposed to significant credit
risk.
Internal policy restricts the Fund from investing in securities issued by any issuer of not
more than a certain percentage of its NAV. Under such restriction, the risk exposure to
the securities of any single issuer is diversified and managed based on internal/external
ratings.
Any changes in national policies and regulations may have effects on the capital market
and the NAV of the Fund.
The Fund’s financial liabilities have contractual maturities of not more than six months.
35
FTSE Bursa Malaysia KLCI etf (“FBM KLCI etf”)
NOTES TO THE FINANCIAL STATEMENTS
FOR THE FINANCIAL PERIOD FROM 1 JANUARY 2020 TO 30 JUNE 2020
18. FINANCIAL RISK MANAGEMENT OBJECTIVES AND POLICIES (CONT’D.)
(g) Non-compliance risk
19. CAPITAL MANAGEMENT
The primary objective of the Fund’s capital management is to ensure that it maximises unit
holders’ value by expanding its fund size to benefit from economies of scale and achieving
growth in NAV from the performance of its investments.
The Fund manages its capital structure and makes adjustments to it, in light of changes in
economic conditions. To maintain or adjust the capital structure, the Fund may issue new or
bonus units, make distribution payment, or return capital to unit holders by way of redemption
of units.
No changes were made in the objective, policies or processes during the financial periods
ended 30 June 2020 and 31 December 2019.
This is the risk of the Manager, the Trustee or the Fund not complying with internal
policies, the Deed of the Fund, securities law or guidelines issued by the regulators. Non-
compliance risk may adversely affect the investments of the Fund when the Fund is
forced to rectify the non-compliance.
36
FTSE Bursa Malaysia KLCI etf (“FBM KLCI etf”)
STATEMENT BY THE MANAGER
For and on behalf of the Manager
GOH WEE PENG
Executive Director
Kuala Lumpur, Malaysia
24 August 2020
I, Goh Wee Peng, as the Director of AmFunds Management Berhad (the “Manager”), do hereby
state that in the opinion of the Manager, the accompanying financial statements are drawn up in
accordance with Malaysian Financial Reporting Standards so as to give a true and fair view of
the financial position of FTSE Bursa Malaysia KLCI etf (“FBM KLCI etf”) (the “Fund”) as at 30
June 2020 and the comprehensive income, the changes in equity and cash flows for the financial
period then ended and comply with the requirements of the Deeds.
37

38
DIRECTORY Head Office 9th & 10th Floor, Bangunan AmBank Group 55, Jalan Raja Chulan, 50200 Kuala Lumpur Tel: (03) 2032 2888 Facsimile: (03) 2031 5210 Email: [email protected] Postal Address AmFunds Management Berhad P.O Box 13611, 50816 Kuala Lumpur
For enquiries about this or any of the other Funds offered by AmFunds Management Berhad Please call 2032 2888 between 8.45 a.m. to 5.45 p.m. (Monday to Thursday),
Friday (8.45 a.m. to 5.00 p.m.)


![5th Kepong Open Taekwondo Championship 2014[1]](https://static.documents.pub/doc/80x56/577ccd3c1a28ab9e788bdb6e/5th-kepong-open-taekwondo-championship-20141.jpg)

