22
Constanza Jacazio Senior Gas Analyst International Energy Agency Climate change and the shifting energy mix

Constanza Jacazio
Senior Gas Analyst
International Energy Agency
Climate change and the shifting energy mix

© OECD/IEA 2015 © OECD/IEA 2015
Costanza Jacazio,
Senior Gas analyst, IEA
November 2015
Natural gas in a sustainable energy system

© OECD/IEA 2015
The usual gas industry view is:
Coal to gas switch in power generation is a large and cost efficient climate policy option
Consequently we should raise the CO2 price to make gas competitive
Renewable targets/subsidies distort markets
In any case, gas is the ideal back up for renewables so it is needed anyway

© OECD/IEA 2015
Meanwhile views from the green community
Gas is a fossil fuel which will have to be phased out
Cheap gas risks locking out renewables
Earthquakes, methane leakage, water contamination - fracking is bad
“the utility death spiral” – with solar and batteries we will not need large energy companies anyway
© OECD/IEA 2015
EU and USA: the biggest gas consuming sector is not electricity

© OECD/IEA 2015
Industrial gas demand: a modern society without plastics and fertiliser?
© OECD/IEA 2015
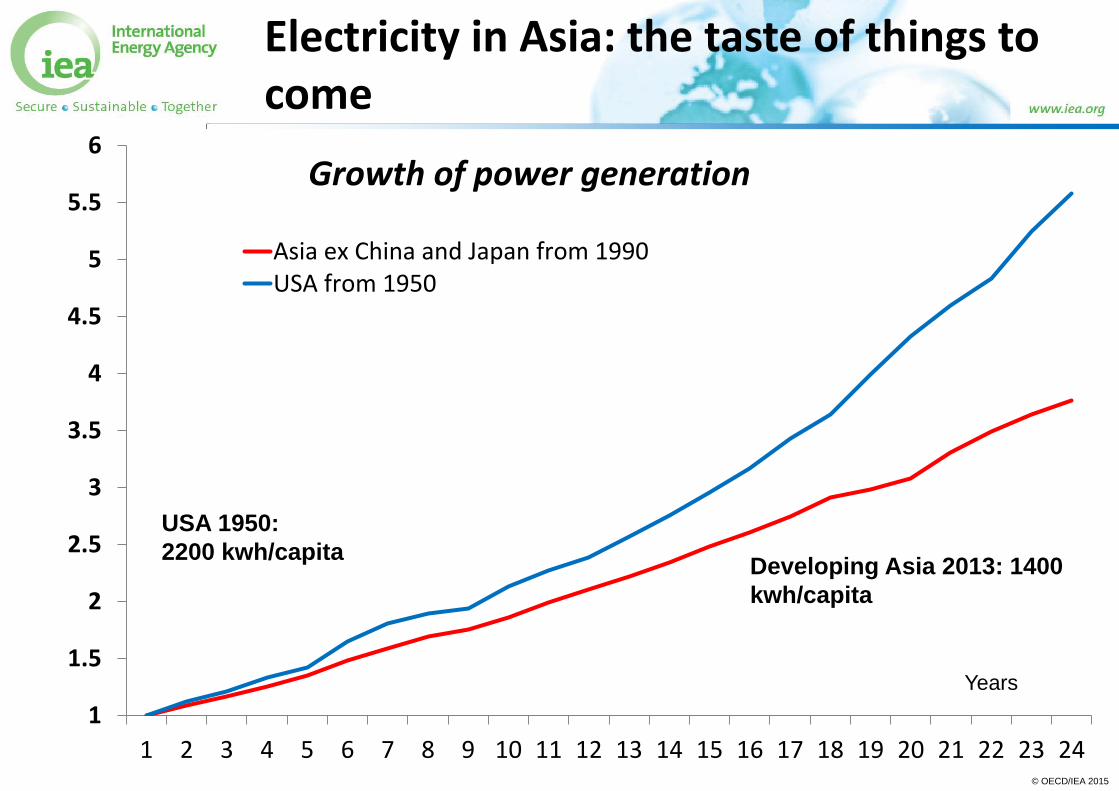
Electricity in Asia: the taste of things to come
1
1.5
2
2.5
3
3.5
4
4.5
5
5.5
6
1 2 3 4 5 6 7 8 9 10 11 12 13 14 15 16 17 18 19 20 21 22 23 24
Asia ex China and Japan from 1990USA from 1950
Growth of power generation
Developing Asia 2013: 1400
kwh/capita
USA 1950:
2200 kwh/capita
Years
© OECD/IEA 2015
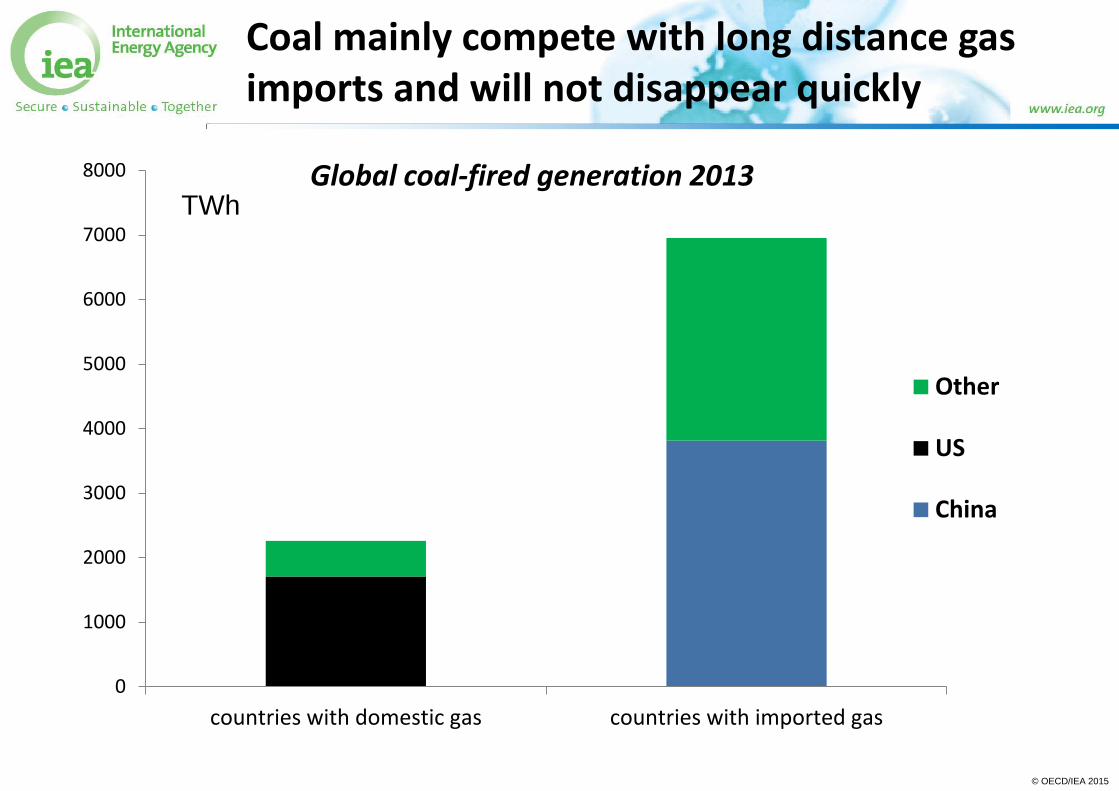
Coal mainly compete with long distance gas imports and will not disappear quickly
0
1000
2000
3000
4000
5000
6000
7000
8000
countries with domestic gas countries with imported gas
Other
US
China
Global coal-fired generation 2013 TWh

© OECD/IEA 2015
60 $/MWh
Is LNG still competitive with wind and solar?
Onshore wind
SA
52 $/MWh
US
48 $/MWh
China
80 - 100 $/MWh
Brazil
54 $/MWh
Turkey
73 $/MWh
Germany
67-100 $/MWh
Ireland
69 $/MWh
Australia
65 $/MWh
UK
120 $/MWh
India
88 $/MWh
Chile
89 $/MWh
85 $/MWh
US
~75 $/MWh
Utility PV
SA
65 $/MWh
Brazil
81 $/MWh
Dubai
<60 $/MWh
UK
120 $/MWh
Recent long-term remuneration contract prices (e.g. auctions or FITs)
Combination of technology cost reduction, better resources, appropriate regulatory framework attracting financing
Long-term PPAs and price competition effective drivers
Egypt
41 $/MWh

© OECD/IEA 2015
Electrification in Asia without coal?
0
1
2
3
4
5
India, Indonesia, Vietnam Malaysia
15 times EU wind and solar or 6 times EU gas imports from Russia
Per capita electricity supply, Mwh/year

© OECD/IEA 2015
Integration of renewables: innovation in the “software” of clean energy
Better forecasting algorithms
Close to real time operation
Improved grid monitoring and TSO collaboration
System friendly renewables

© OECD/IEA 2015
Very large capacity with very low load factors
0
100
200
300
400
500
600
700
800
capacity, GW generation, Twh

© OECD/IEA 2015
Does cheap gas kill renewable investment?
© OECD/IEA 2015
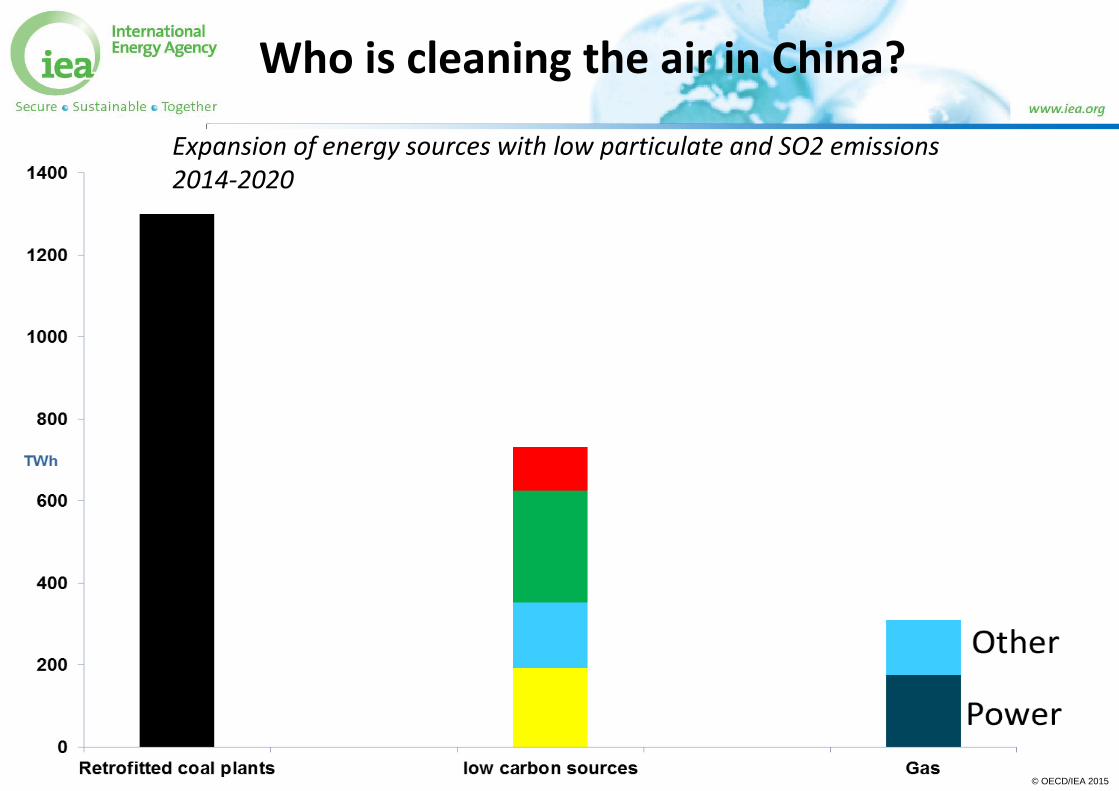
Who is cleaning the air in China?
Expansion of energy sources with low particulate and SO2 emissions 2014-2020
© OECD/IEA 2015
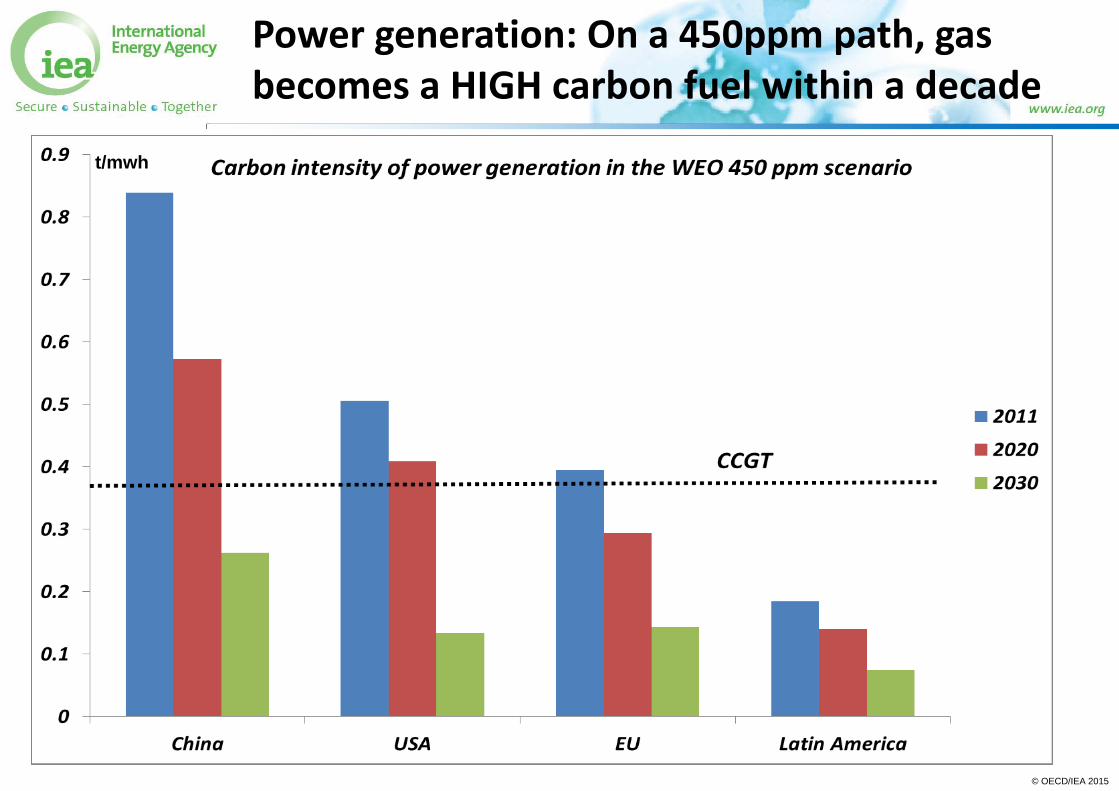
Power generation: On a 450ppm path, gas becomes a HIGH carbon fuel within a decade
t/mwh

© OECD/IEA 2015
Supply security concerns
Conflict with potential
gas supply security
implications
Gas production or
infrastructure
affected by conflict
or terrorism
© OECD/IEA 2015
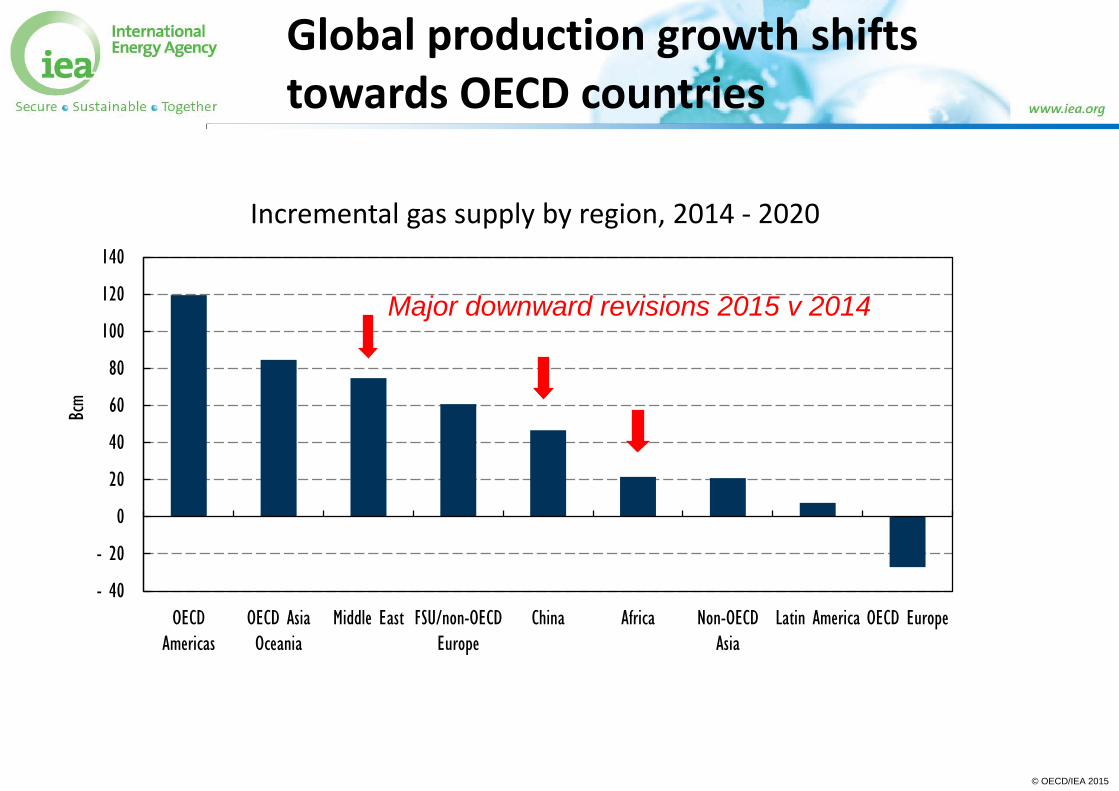
Global production growth shifts towards OECD countries
Incremental gas supply by region, 2014 - 2020
- 40
- 20
0
20
40
60
80
100
120
140
OECD
Americas
OECD Asia
Oceania
Middle East FSU/non-OECD
Europe
China Africa Non-OECD
Asia
Latin America OECD Europe
Bcm
Major downward revisions 2015 v 2014
© OECD/IEA 2015
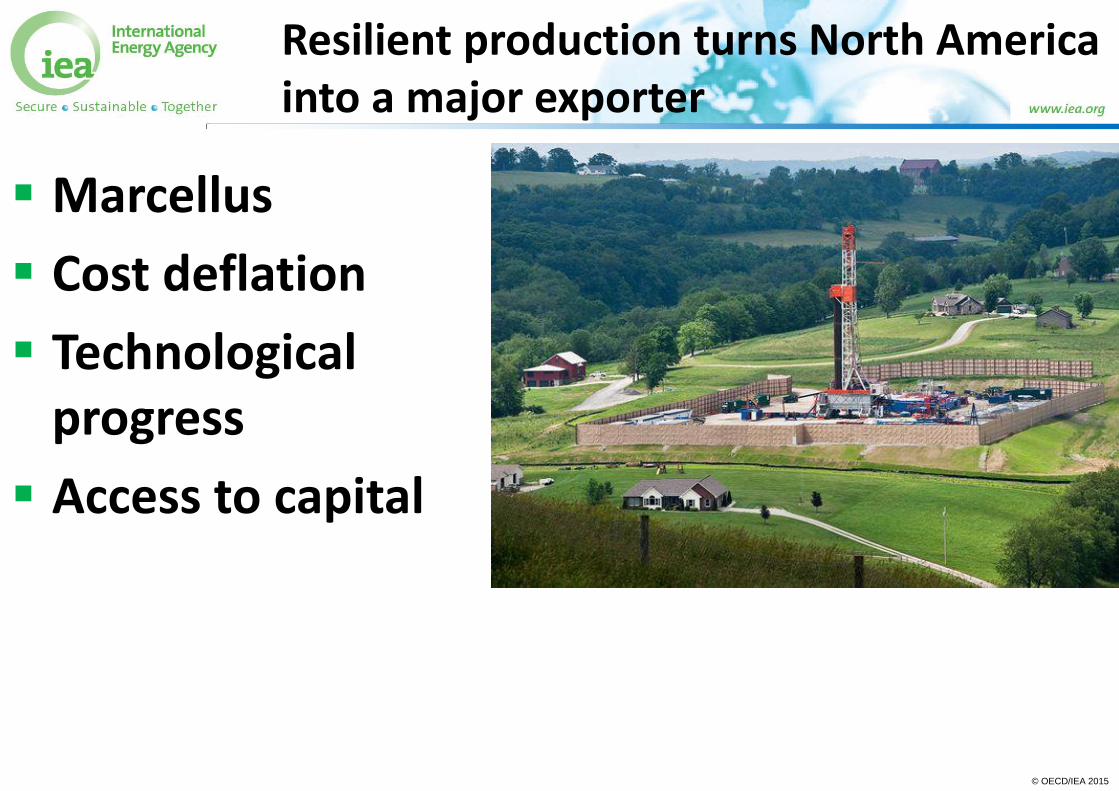
Resilient production turns North America into a major exporter
Marcellus
Cost deflation
Technological progress
Access to capital
© OECD/IEA 2015
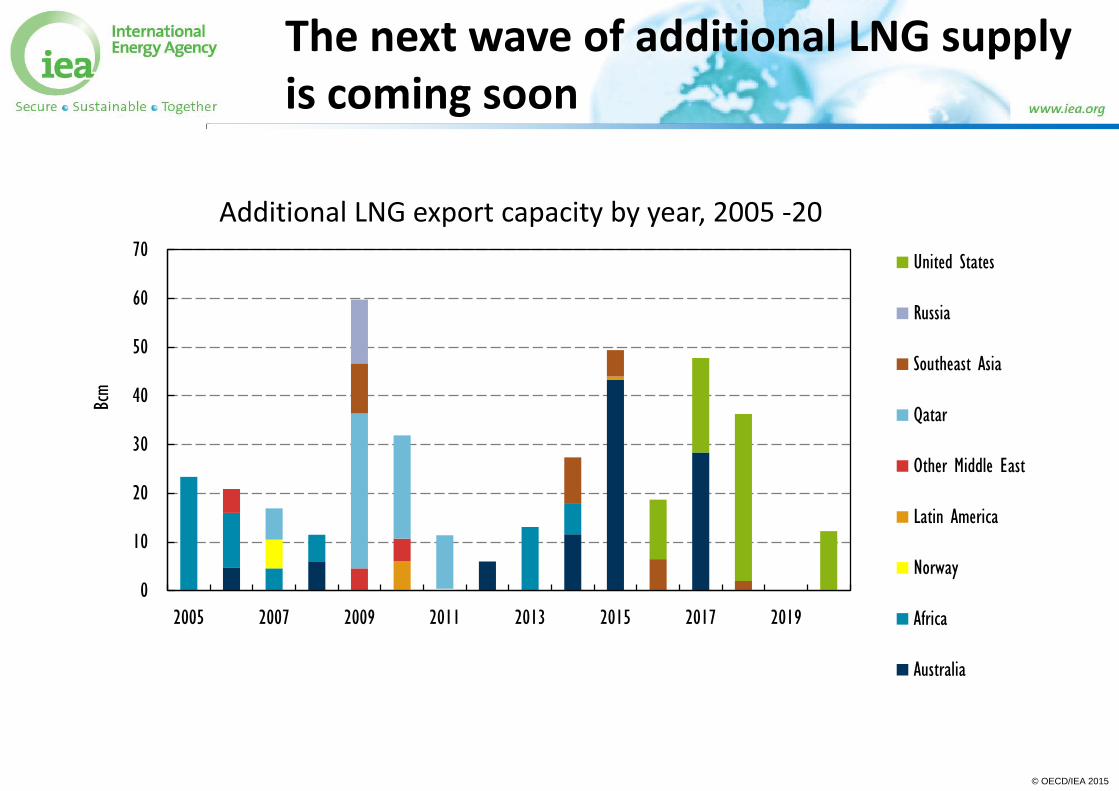
The next wave of additional LNG supply is coming soon
Additional LNG export capacity by year, 2005 -20
0
10
20
30
40
50
60
70
2005 2007 2009 2011 2013 2015 2017 2019
Bcm
United States
Russia
Southeast Asia
Qatar
Other Middle East
Latin America
Norway
Africa
Australia

© OECD/IEA 2015
Methane leakage can move gas from solution to part of the problem
0
200
400
600
800
1000
1200
1400
coal gas
worst case leakage best case leakage
combustion
kg/MWh
Greenhouse gas emissions from power generation

Use the footer function to insert the presentation title and date here
This document is for investment professionals only and should not be relied upon by private investors.
This document has been approved by Sarasin & Partners LLP of Juxon House, 100 St Paul’s Churchyard, London, EC4M 8BU, a limited liability
partnership registered in England & Wales with registered number OC329859 which is authorised and regulated by the Financial Conduct Authority
with firm reference number 475111 and passported under MiFID to provide investment services in the Republic of Ireland.
Please note that the value of shares and the income from them can fall as well as rise and you may not get back the amount originally
invested. This can be as a result of market movements and also of variations in the exchange rates between currencies.
All details in this document are provided for marketing and information purposes only and should not be misinterpreted as investment advice or
taxation advice. This document is not an offer or recommendation to buy or sell shares in the fund. You should not act or rely on this document but
should seek independent advice and verification in relation to its contents. Neither Sarasin & Partners LLP nor any other member of Bank J. Safra
Sarasin Ltd. accepts any liability or responsibility whatsoever for any consequential loss of any kind arising out of the use of this document or any
part of its contents. The views expressed in this document are those of Sarasin & Partners LLP and these are subject to change without notice.
Where the data in this document comes partially from third party sources the accuracy, completeness or correctness of the information contained in
this publication is not guaranteed, and third party data is provided without any warranties of any kind. Sarasin & Partners LLP shall have no liability
in connection with third party data.
© 2015 Sarasin & Partners LLP – all rights reserved. This document can only be distributed or reproduced with permission from Sarasin & Partners
LLP. Please contact [email protected].
Important Information

Use the footer function to insert the presentation title and date here
Sarasin & Partners LLP
Juxon House
100 St. Paul’s Churchyard
London EC4M 8BU
T: +44 (0)20 7038 7000
F: +44 (0)20 7038 6850
www.sarasinandpartners.com


![PDF Energy Analyst 27[1].04.10-Presentation Final](https://static.documents.pub/doc/80x56/577d344c1a28ab3a6b8d8315/pdf-energy-analyst-2710410-presentation-final.jpg)


