Louisiana State University LSU Digital Commons LSU Doctoral Dissertations Graduate School 2015 Sensory Perception of Saltiness and Bierness in Oil-in-Water Emulsions Damir Dennis Torrico Louisiana State University and Agricultural and Mechanical College Follow this and additional works at: hps://digitalcommons.lsu.edu/gradschool_dissertations Part of the Life Sciences Commons is Dissertation is brought to you for free and open access by the Graduate School at LSU Digital Commons. It has been accepted for inclusion in LSU Doctoral Dissertations by an authorized graduate school editor of LSU Digital Commons. For more information, please contact[email protected]. Recommended Citation Torrico, Damir Dennis, "Sensory Perception of Saltiness and Bierness in Oil-in-Water Emulsions" (2015). LSU Doctoral Dissertations. 507. hps://digitalcommons.lsu.edu/gradschool_dissertations/507
Transcript
Louisiana State UniversityLSU Digital Commons
LSU Doctoral Dissertations Graduate School
2015
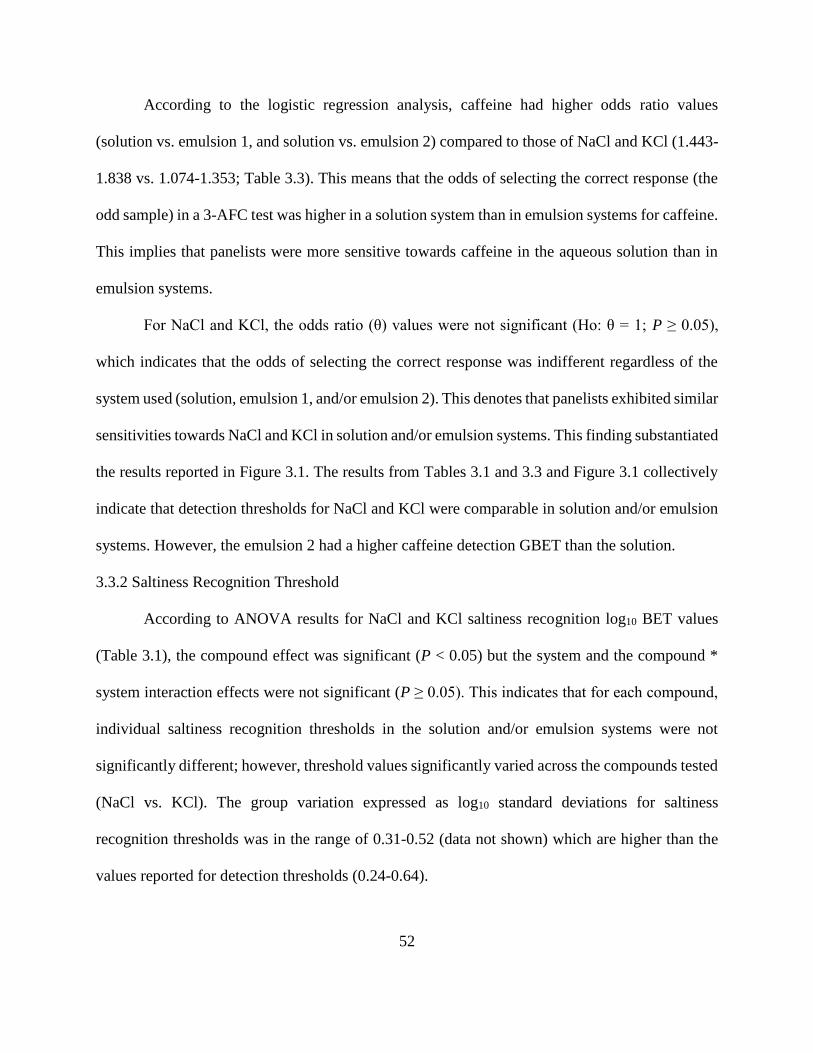
Sensory Perception of Saltiness and Bitterness inOil-in-Water EmulsionsDamir Dennis TorricoLouisiana State University and Agricultural and Mechanical College
Follow this and additional works at: https://digitalcommons.lsu.edu/gradschool_dissertations
Part of the Life Sciences Commons
This Dissertation is brought to you for free and open access by the Graduate School at LSU Digital Commons. It has been accepted for inclusion inLSU Doctoral Dissertations by an authorized graduate school editor of LSU Digital Commons. For more information, please [email protected].
Recommended CitationTorrico, Damir Dennis, "Sensory Perception of Saltiness and Bitterness in Oil-in-Water Emulsions" (2015). LSU Doctoral Dissertations.507.https://digitalcommons.lsu.edu/gradschool_dissertations/507
2.3 Other Ingredients Used to Reduce Sodium ......................................................................... 16 2.4 Human Perception of Saltiness and Bitterness ................................................................... 17
EFFECTS IN A SENSORY THRESHOLD STUDY .................................................................. 40 3.1 Introduction ......................................................................................................................... 40 3.2 Materials and Methods ........................................................................................................ 42
3.3.4 Preliminary Results on Effect of Gender on Sensory Thresholds ............................. 57 3.4 Conclusions ......................................................................................................................... 59 3.5 References ........................................................................................................................... 59
CHAPTER 4. OIL AND TASTANT CONCENTRATIONS AFFECT SALTINESS AND
BITTERNESS PERCEPTION OF OIL-IN-WATER EMULSIONS ........................................... 62 4.1 Introduction ......................................................................................................................... 62 4.2 Materials and Methods ........................................................................................................ 64
4.2.1 Preparation of Sample Solutions and Emulsions ...................................................... 64
4.2.2 Emulsions Physical Properties .................................................................................. 66 4.2.3 Sensory Analysis ....................................................................................................... 66 4.2.4 Design of the Experiment and Statistical Analysis ................................................... 69
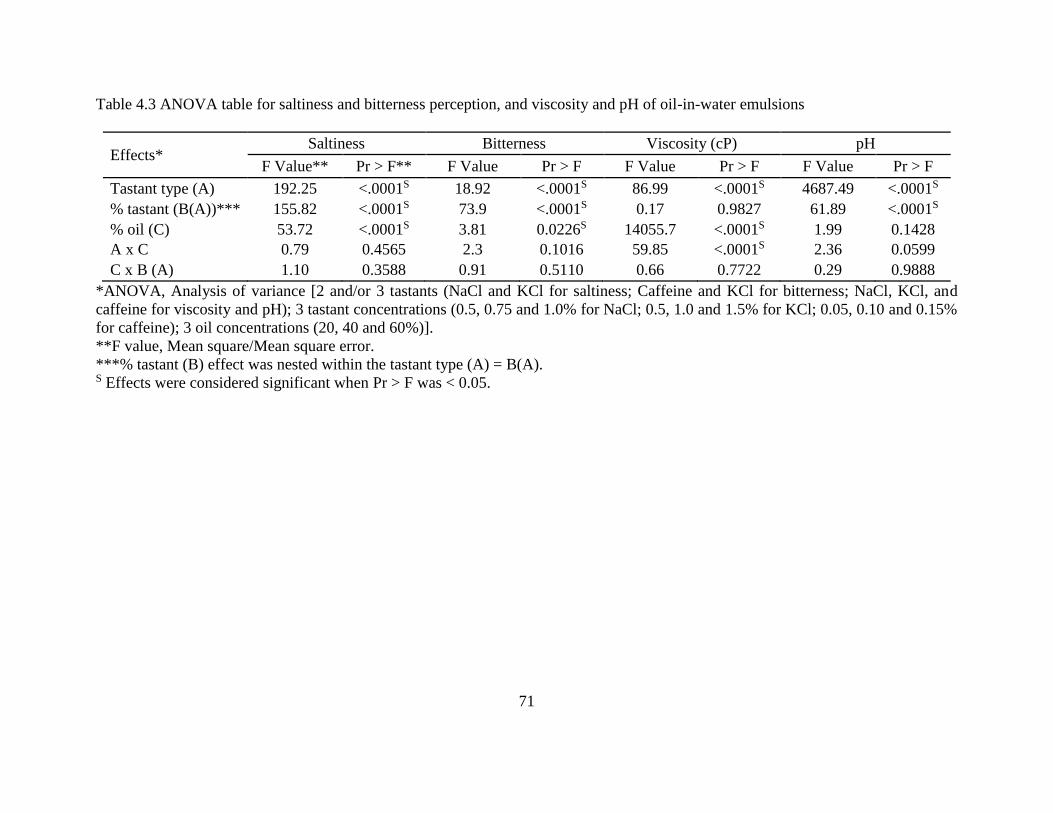
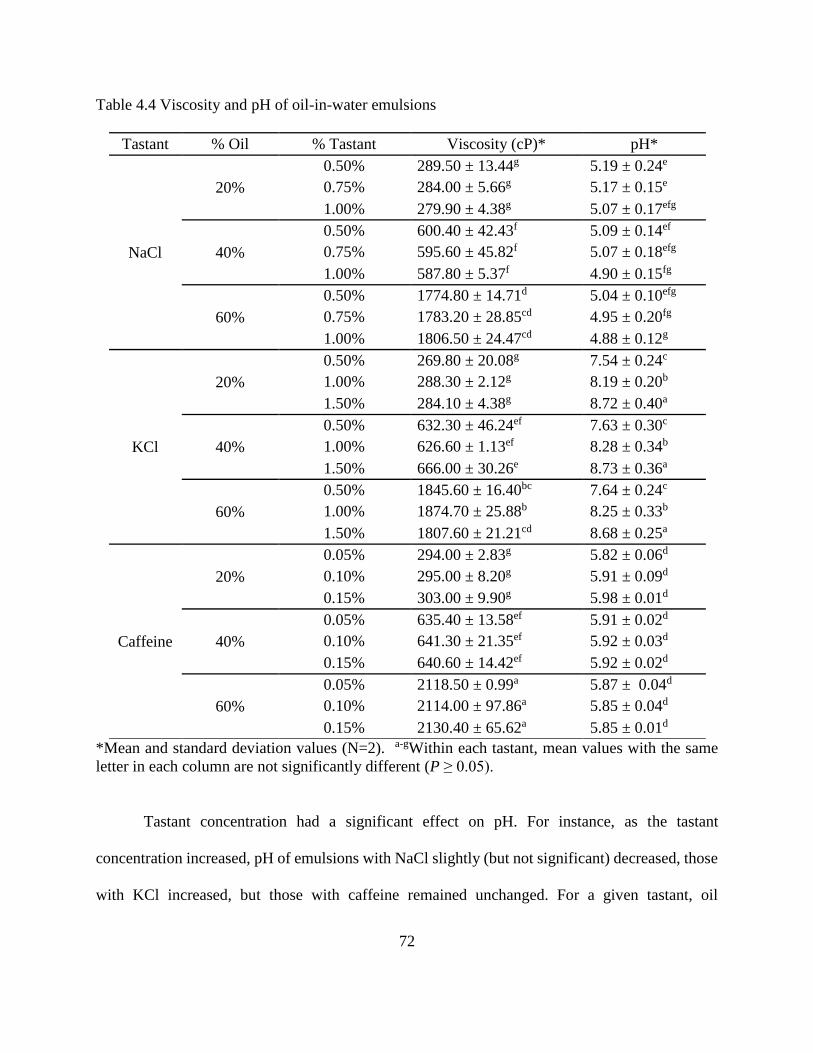
4.3 Results and Discussion ....................................................................................................... 70
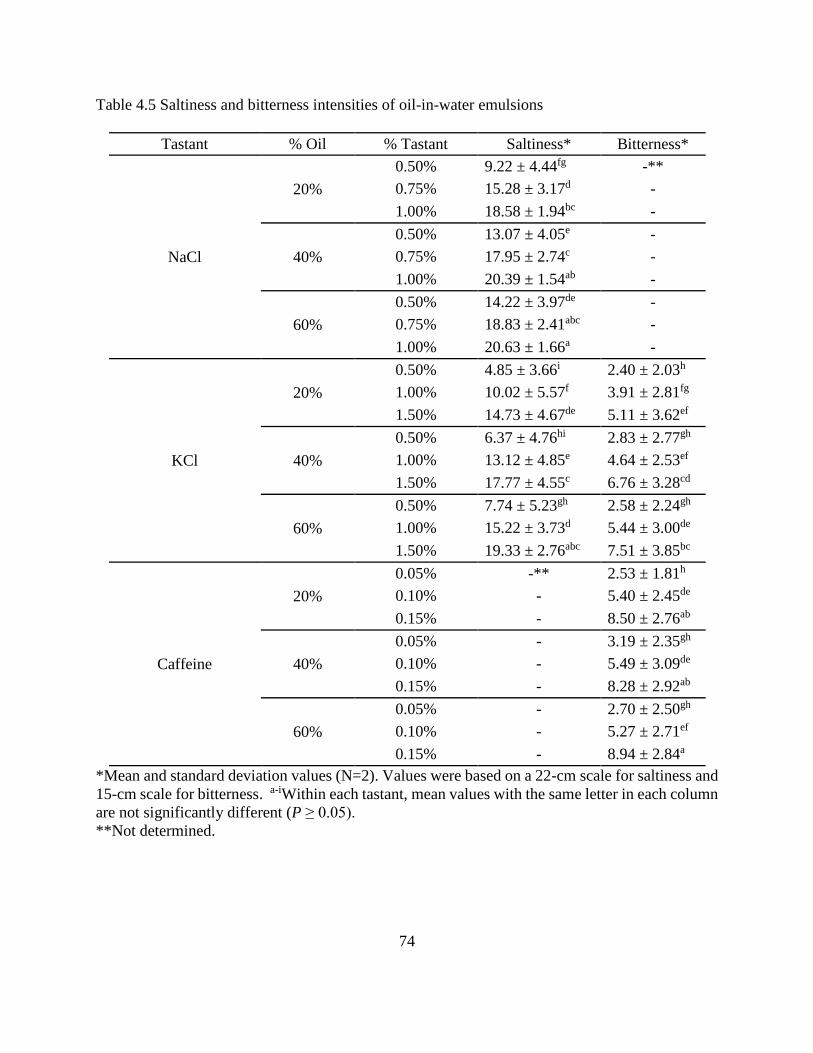
4.3.1 Viscosity and pH of Emulsions ................................................................................. 70 4.3.2 Saltiness Intensity of Emulsions................................................................................ 73
5.2.3 Taste Analysis Using the Electronic-Tongue (E-tongue) .......................................... 95 5.2.4 Design of the Experiment and Statistical Analysis ................................................... 95
5.3 Results and Discussion ....................................................................................................... 96
5.3.1 Saltiness Perception Using Descriptive Panel ........................................................... 96 5.3.2 Bitterness Perception Using Descriptive Panel ....................................................... 100
5.3.3 Saltiness and Bitterness Measured by the E-tongue ................................................ 106 5.4 Conclusions ....................................................................................................................... 110
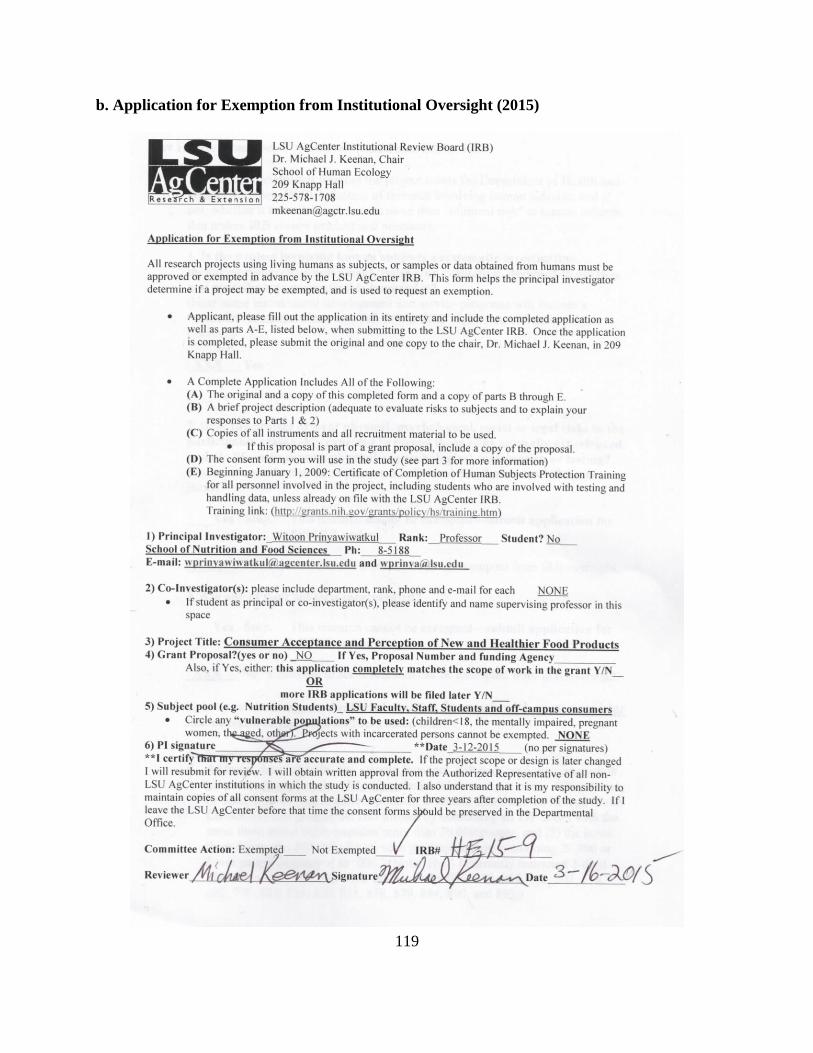
a. Application for Exemption from Institutional Oversight (2011) ........................................ 117 b. Application for Exemption from Institutional Oversight (2015) ........................................ 119
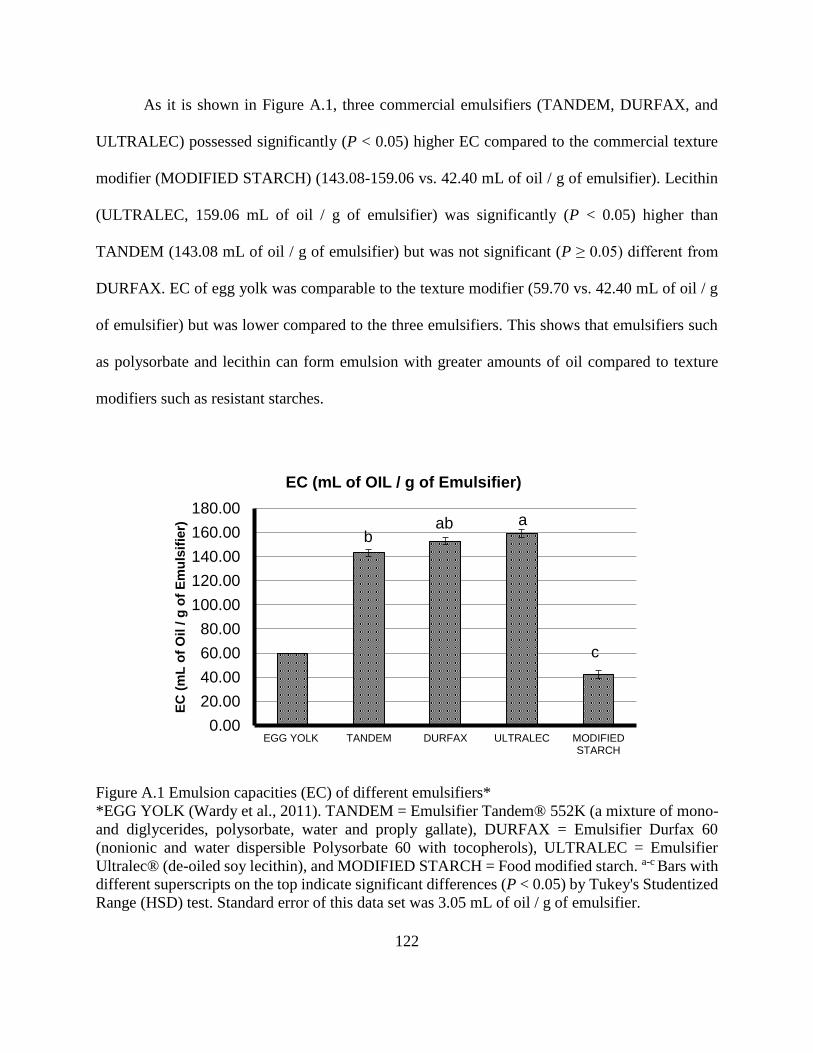
APPENDIX B: PRELIMINARY WORK ON EMULSION CHARACTERISTICS ................ 121 a. Emulsion Capacity .............................................................................................................. 121 b. Emulsion Viscosity ............................................................................................................. 123
EFFECTS IN A SENSORY THRESHOLD STUDY IN CHAPTER 3 ..................................... 126 a. Research Consent Form ...................................................................................................... 126 b. Warm-up Session Questionnaire ........................................................................................ 127
c. Threshold Evaluation Form ................................................................................................ 129 d. Sample Calculation of the Detection Group Best-Estimate Threshold of NaCl for the
Method of Limits ............................................................................................................... 130 e. Presentation for Panelists at the End of the Experiment ..................................................... 131 f. Pooled within Canonical Structure (r’s) Describing Variables that Underlie Group
APPENDIX D: EFFECT OF OIL AND TASTANT CONCENTRATIONS ON
PERCEPTIONS OF SALTINESS AND BITTERNESS IN OIL-IN-WATER
EMULSIONS IN CHAPTER 4 .................................................................................................. 134 a. Research Consent Form ...................................................................................................... 134
b. Preliminary Evaluation Form for Screening ....................................................................... 135 c. Orientation Session Presentation ........................................................................................ 137
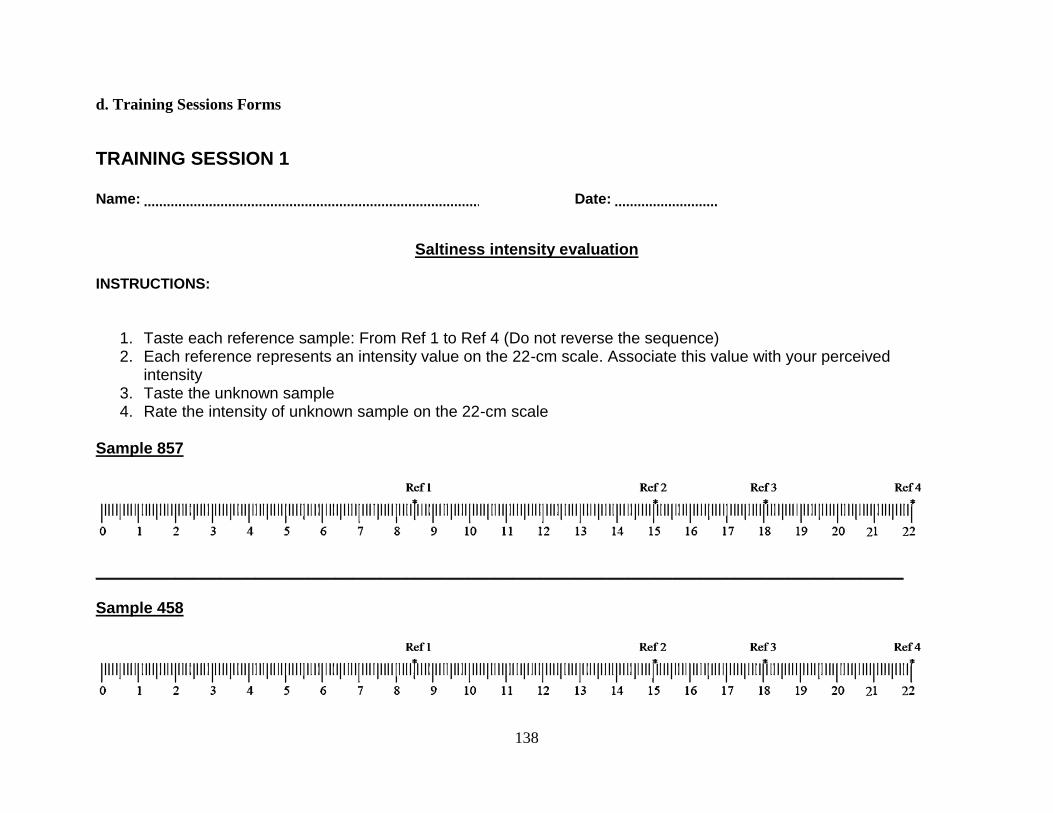
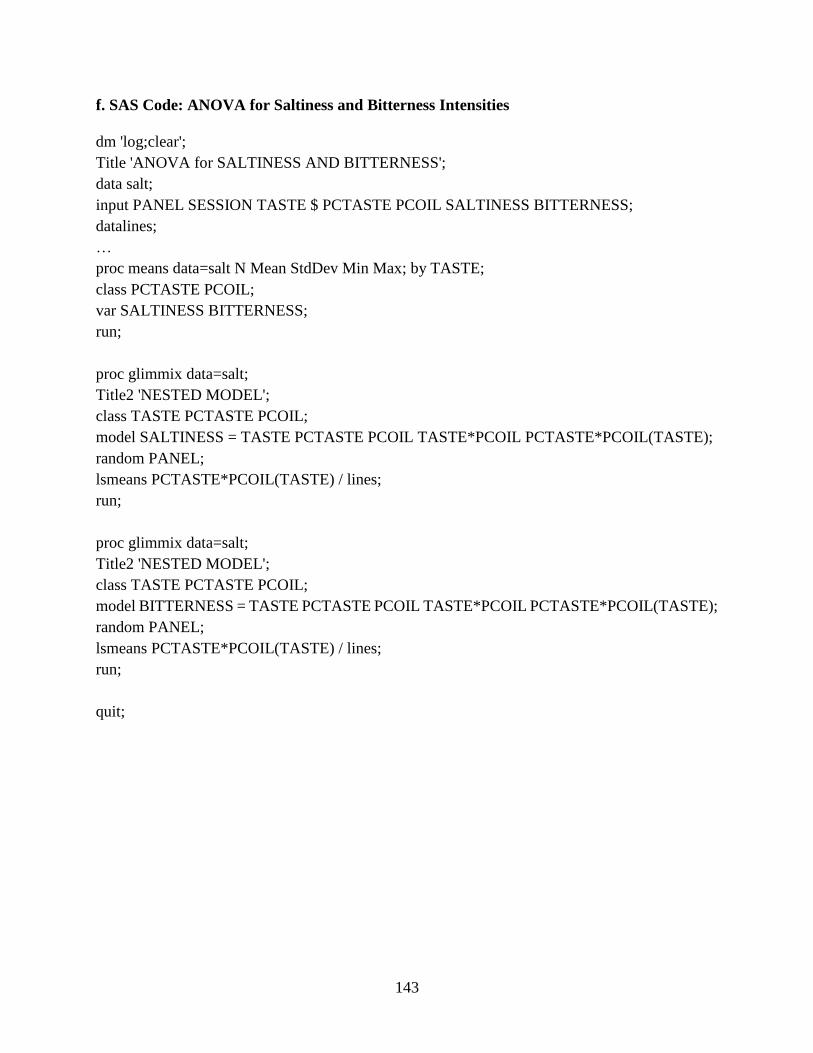
d. Training Sessions Forms ..................................................................................................... 138 e. Samples Evaluation Forms .................................................................................................. 140 f. SAS Code: ANOVA for Saltiness and Bitterness Intensities .............................................. 143
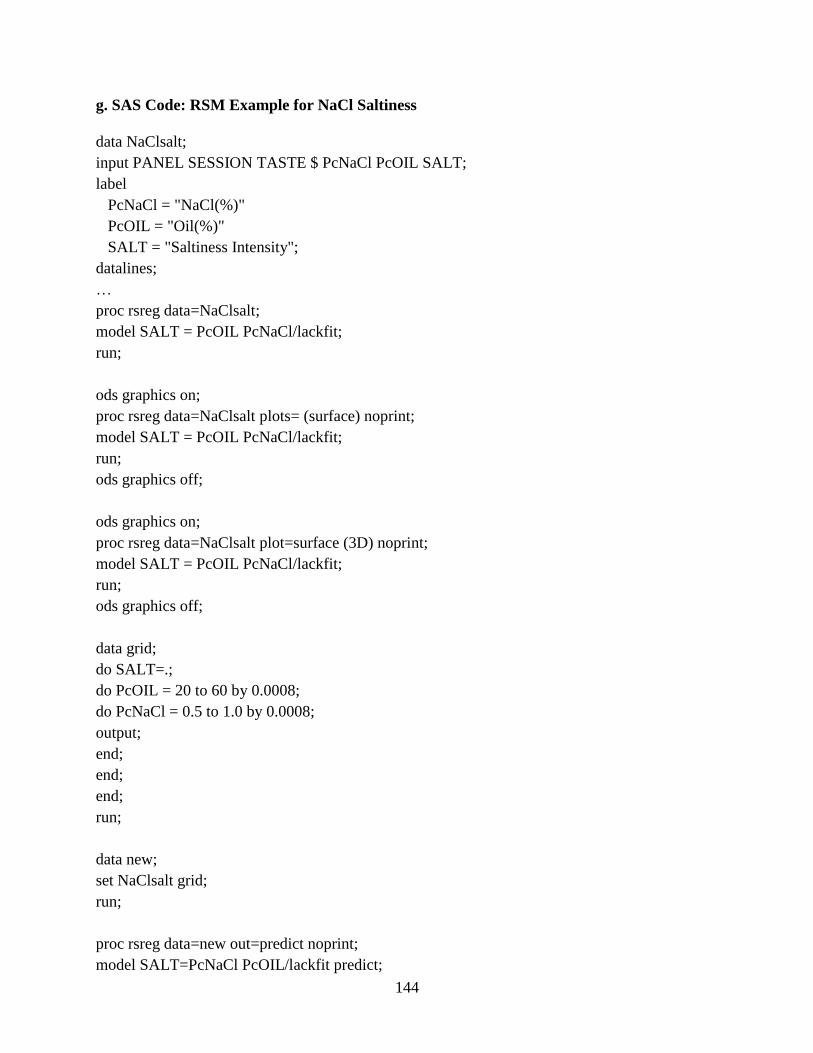
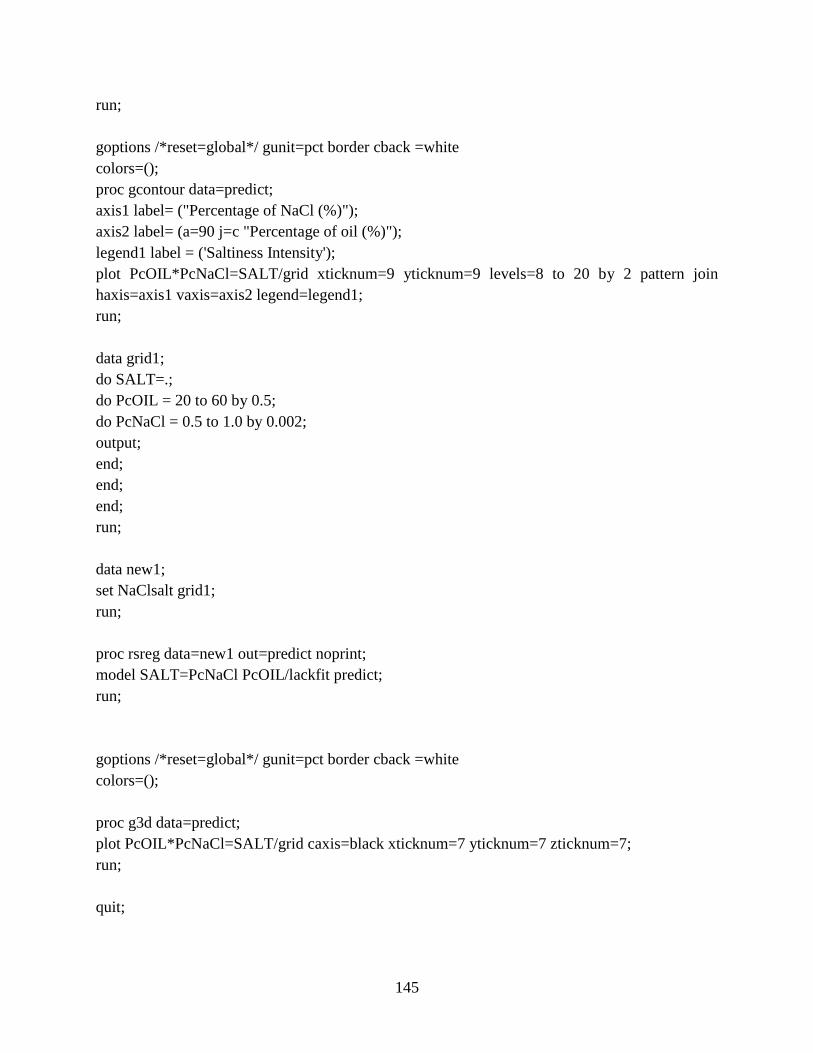
g. SAS Code: RSM Example for NaCl Saltiness .................................................................... 144 h. SAS Code: MANOVA Example for Saltiness ................................................................... 146
APPENDIX E: PSYCHOPHYSICAL EFFECTS OF INCREASING OIL
CONCENTRATIONS IN SALTINESS AND BITTERNESS PERCEPTIONS
OF OIL-IN-WATER EMULSIONS IN CHAPTER 5 ............................................................... 148
a. SAS Code: Analysis of Covariance for the Linear and Steven’s Power Models ............... 148
VITA ........................................................................................................................................... 149
Naim M, Nir S, Spielman A, Noble A, Peri I, Rodin S, Samuelov-Zubare M. 2002. Hypothesis of
receptor-dependent and receptor-independent mechanisms for bitter and sweet taste
transduction: implications for slow taste onset and lingering aftertaste. Paper presented at
the ACS Symposium Series.
Nakaya K, Kohata T, Doisaki N, Ushio H, Ohshima T. 2006. Effect of oil droplet sizes of oil‐in‐water emulsion on the taste impressions of added tastants. Fisheries Sci 72(4):877–83.
Pietinen P, Valsta LM, Hirvonen T, Sinkko H. 2008. Labelling the salt content in foods: a useful
tool in reducing sodium intake in Finland. Public Health Nutr 11(4):335–40.
Ramisetty K, Shyamsunder R. 2011. Effect of ultrasonication on stability of oil in water emulsions.
Int J Drug Deliv 3:133–42.
Reddy KA, Marth EH. 1991. Reducing the sodium content of foods: A Review. J Food Protect
54(2): 138–50.
Rosett TR, Shirley L, Schmidt SJ, Klein BP. 1994. Na+ binding as measured by Na-23 nuclear-
magnetic-resonance spectroscopy influences the perception of saltiness in gum solutions.
J Food Sci 59(1):206–10.
Shamil S, Wyeth LJ, Kilcast D. 1991-1992. Flavour release and perception in reduced-fat foods.
Food Qual Prefer 3(1):51–60.
Shepherd R, Wharf SG, Farleigh CA. 1989. The effect of a surface coating of table salt of varying
grain-size on perceived saltiness and liking for pate. Int J Food Sci Tech 24:333–40.
Sinopoli DA, Lawless HT. 2012. Taste properties of potassium chloride alone and in mixtures with
sodium chloride using a check-all-that-apply method. J Food Sci 77(9):S319–22.
Smith AK, June H, Noble AC. 1996. Effects of viscosity on the bitterness and astringency of grape
seed tannin. Food Qual Prefer 7(3):161–6.
Thurgood JE, Martini S. 2010. Effects of three emulsion compositions on taste thresholds and
intensity ratings of five taste compounds. J Sens Stud 25(6):861–75.
Vingerhoeds MH, de Wijk RA, Zoet FD, Nixdorf RR, van Aken GA. 2008. How emulsion
composition and structure affect sensory perception of low-viscosity model emulsions.
Food Hydrocolloid 22(4):631–46.
Walters DE, Roy G. 1996. Taste interactions of sweet and bitter compounds flavor-food
interactions. American Chemical Society. Vol. 633. p 130–42.
Webster JL, Dunford EK, Hawkes C, Neal BC. 2011. Salt reduction initiatives around the world.
J Hypertens 29(6):1043–50.
Wendin K, Ellekjær MR, Solheim R. 1999. Fat content and homogenization effects on flavour and
texture of mayonnaise with added aroma. Food Sci Technol-Leb 32(6):377–83.
Winger RJ, Ren L. 2008. Solubility of sodium and potassium iodates in saturated salt solutions.
Food Chem 113(2):600–1.
Woods AT, Poliakoff E, Lloyd DM, Dijksterhuis GB, Thomas AT. 2010. Flavor expectation: the
effect of assuming homogeneity on drink perception. Chemosens Percept 3(3-4):174–81.
39
Woteki C, Raper N, Riddick H. 1982. Sodium intake of individuals. In: Freeman TM, Gregg OW,
editors. Sodium intake - dietary concerns. St. Paul, MN: American Association of Cereal
Chemists. p 105–15.
40
CHAPTER 3. OIL-IN-WATER EMULSION EXHIBITS BITTERNESS-SUPPRESSING EFFECTS IN
A SENSORY THRESHOLD STUDY
3.1 Introduction
High sodium consumption is a major contributor to high blood pressure which is a leading
cause of stroke, coronary heart diseases, heart attack, and kidney failure (CDC 2013). Sodium
reduction can be achieved by modification of the food structure, thereby, improving the perception
of saltiness (Busch and others 2013). In liquid products, this approach includes modification of
certain physical properties including viscosity and overall salt distribution. The use of inert fillers
that concentrate salt in the aqueous phase, and the development of products with non-
homogeneous distributions of salt can increase the overall perception of saltiness in foods, hence,
reducing sodium. Perceived taste intensities can change as a function of viscosity for the majority
of taste stimuli; this results in lower taste intensities as the aqueous solution viscosity increases
(Moskowitz and Arabie 1970; Christensen 1980; Smith and others 1996).
Various natural and processed foods consist of either partial or entire emulsions, or have
been in an emulsified state during their production. An emulsion is a mixture of two immiscible
liquids in which one liquid is dispersed as small spherical droplets (discontinuous phase) in the
other (the continuous phase). The diameter of droplets usually lies between 0.1 and 100 μm
(McClement 2005; Leal-Calderon and others 2007). Ramisetty and Shyamsunder (2011) found
that emulsions prepared by ultrasonic systems presented smaller droplet sizes compared to
emulsions prepared by mechanical agitation. Smaller droplet sizes are thermodynamically more
stable and have different rheological properties. The oil droplet size distribution of an emulsion
can be adjusted and has a major effect on several physicochemical and sensory properties including
shelf-life, appearance, texture, and flavor (Floury and others 2000; McClement 2005).
41
Concentration of fat and/or oil can affect sensory characteristics of food products. Several
studies reported that oil had suppressive effects on taste (Malone and others 2003). Shamil and
others (1992) reported that reductions of fat in cheese can lead to an increase in bitterness and
astringency with reductions in saltiness perception. Wendin and others (1999) reported that a
decrease in mayonnaise oil content can decrease sourness due to the decreased concentration of
acetic acid in the water phase. Modifying some emulsion characteristics including flavor, fat/oil
content, viscosity, droplet size, and the type of emulsifier may affect the sensory perception of
emulsions (Vingerhoeds and others 2008). Vingerhoeds and others (2008) reported that emulsion
droplet size did not have a significant effect on odor, taste, and aftertaste. In contrast, Nakaya and
others (2006) reported that bitter taste intensities of tuna oil emulsions with smaller droplet sizes
(diameter = 1.00 µm) were lower than that of larger oil droplets (diameter = 5.50 µm). This
supported the hypothesis that smaller oil droplets may have a bitterness suppressing effect.
Many studies on emulsion are focused on textural characteristics, and those focused on
flavor studies were related to aroma release rather than effects of oil on the taste perception
(Malone and others 2003). Oil in emulsions may affect taste perception due to two mechanisms
with opposite effects. First, oil can form a barrier between the taste compounds and receptors,
hence, decreasing the perceived intensity. Second, oil may increase the concentration of water
soluble taste compounds in the aqueous phase, creating a more intense taste perception (Metcalf
and Vickers 2002). A simple model of oil-in-water emulsion is useful to understand effects of
emulsion characteristics on taste. Some studies found that oil of emulsion systems can suppress
sweet and bitter tastes whereas others reported that perceived saltiness can increase with increasing
oil concentration in emulsions (Malone and others 2003; Metcalf and Vickers 2002).
42
There is not a clear understanding of how emulsion characteristics may affect the saltiness
and/or bitterness taste perceptions in foods. The thresholds measurements are useful for
determining an individual or group mean sensitivity to a given stimulus, including tastants and/or
odor compounds (Bi and Ennis 1998; Lawless 2010). Thus, the objective of this research was to
evaluate sensory detection and recognition thresholds of NaCl, caffeine, and KCl in aqueous
solution vs. oil-in-water emulsion systems. In particular, this study was conducted to demonstrate
that oil-in-water emulsions could exhibit bitterness suppressing effects. Additionally, gender
effects on detection and recognition (saltiness and bitterness) thresholds were preliminarily
assessed.
3.2 Materials and Methods
3.2.1 Panelists
The research protocol for this study was approved (IRB# HE 12-19) by the Louisiana State
University Agricultural Center Institutional Review Board. Untrained panelists (Hoehl and others
2013) from a pool of faculty, staff, and students of the Louisiana State University were recruited.
Pre-screening was done using the following criteria: availability, health, general product attitudes,
sensory awareness, and rating ability. Based on an interview, panelists with taste and smell
disorders or kidney/liver problems were excluded from this study.
Panelists were further screened by acuity sensory tests in which they had to demonstrate
ability to detect, recognize, and describe sensory characteristics of salty and bitter compounds
(NaCl, caffeine, and KCl). Furthermore, they were tested for their ability to evaluate intensities
using ranking and rating tests. A panel (N = 15) of 7 males and 8 females with an age range of 20-
30 years was selected for this study.
43
3.2.2 Sample Solutions and Emulsions
3.2.2.1 Solutions Preparation
Sodium chloride and potassium chloride solutions were prepared using NaCl (Morton
International, INC., Chicago, IL, USA) and KCl (99% FCC grade, Extracts & Ingredients, LTD.,
Union, NJ, USA) in odorless and tasteless spring water (Ozarka®, Nestlé Waters North America,
Greenwich, CT, USA) at seven concentrations with a fixed ratio of two-fold increments: 0.005,
0.01, 0.02, 0.04, 0.08, 0.16, and 0.32 g in 100 mL (0.86, 1.71, 3.42, 6.84, 13.69, 27.38, and 54.76
mM for NaCl, and 0.67, 1.34, 2.68, 5.37, 10.73, 21.46, 42.92 mM for KCl). Caffeine solutions
were prepared using caffeine (caffeine anhydrous 80 mesh, AnMar, Bridgeport, CT, USA) in
Ozarka® spring water at seven concentrations with a fixed ratio of two-fold increments: 0.0025,
0.005, 0.01, 0.02, 0.04, 0.08, and 0.16 g in 100 mL (0.13, 0.26, 0.51, 1.03, 2.06, 4.12, and 8.24
mM). Distilled water was not suitable as it may cause a cardboard-like flavor and can introduce a
bitter taste (Jellinek 1985). The highest concentration was prepared and diluted to attain the lower
concentrations. The concentration scale increased in geometric increments so that any two adjacent
concentration steps were separated by a constant factor, and this allowed the correct responses of
a group of panelists to be distributed over three to four concentration steps (ASTM 2008). The
range of concentrations was selected by pretesting in order to ensure that panelists thresholds fell
in the range. Each aqueous solution was prepared and stored in 1 L glass bottles and kept at 25 °C
for no more than 2 hours. Prior to serving, 25 mL of emulsion was poured into plastic cups with
lids that were coded with three-digit random numbers.
3.2.2.2 Emulsions Preparation
To prepare oil in water emulsions, the texture modifier Tic Pretested®Ticaloid®210-S
powder (tasteless; gum acacia and xanthan gum; Tic Gums®, Inc., White Marsh, MD, USA) was
44
used to increase the viscosity of the aqueous phase of the emulsion; it was used at 1% concentration
of the total emulsion, and mixed with the aqueous phase. The emulsifier Tandem® 552K (tasteless;
a mixture of mono- and di-glycerides, polysorbate, water and propyl gallate) was obtained from
Caravan® ingredients (Lenexa, KS, USA); it was used at 1% concentration of the total emulsion
and mixed with the oil phase. NaCl, caffeine, or KCl were dissolved in the aqueous portion
(water+Tic gum) of the emulsion, and then mixed with canola oil (at 20% by weight of the
emulsion; CWP, Cal Western Packaging Corp., Memphis, TN, USA) and the emulsifier to produce
ascending concentrations of the tastants (NaCl, caffeine, or KCl) equal to their solution
counterparts. Two types of emulsions were prepared. Emulsion 1 (viscosity = 257 cP) was
prepared using mechanical stirring (Ika Ultra-Turrax® T18 basic, IKA-Werke GmbH and Co. KG,
Staufen, Germany) at approximate 15,000 rpm. Emulsion 2 (viscosity = 59 cP) was prepared using
the method for Emulsion 1 but with an additional ultrasonication processing step using a sonicator
(Vibracell 750 VCX, Sonics & Materials, Inc. CT, USA) with a total input energy of 25,000 J and
an amplitude of wave generated by the probe of 85% (pulse on = 2 s and pulse off = 1 s). The
volume used for ultrasonication was 175 mL of the emulsion. Each emulsion was prepared and
stored in 1 L glass bottles and kept at 25 °C for no more than 2 hours. Prior to serving, 25 mL of
emulsion was poured into plastic cups with lids that were coded with three-digit random numbers.
Two emulsion types were selected for this study due to their significant differences in
apparent viscosity. For viscosity measurement, 100 mL of emulsion samples was placed in a 200
mL beaker and viscosity in centipoise (cP) was measured at 20±0.5 °C with a viscometer (model
DV-II+, Brookfield Engineering Labs Inc., Middleboro, MA, USA) at 50 rpm using a RV-IV
spindle, with data gathered in Wingather V2.1 software (Brookfield Engineering Labs Inc.).
45
3.2.3 Threshold Measurements Using the Method of Limits (ML)
For each tastant (NaCl, caffeine or KCl), there were seven sets (i.e., seven concentrations)
of solution and/or emulsion samples; each set was presented once in the order of increasing
concentration. For each set, subjects were presented with three samples, of which two were
controls (spring water or emulsion without tastant) and one was the solution and/or emulsion with
tastant (NaCl, caffeine, or KCl). Unsalted crackers and spring water were also served for palate
cleansing during the test. Two independent replicates (sessions) were performed on different days.
A total of 126 sample sets (3 tastants x 3 sample types x 7 sets x 2 replicates) were evaluated over
9 weeks period. In this study, the 3-AFC ascending concentration series method of limits with a
slight modification of the ASTM E-679 (ASTM 2008) was applied. The panelists were first asked
to select the odd sample (detection threshold) and then further identified specific tastes of the odd
sample that exhibited recognizable difference (recognition threshold). The choices of recognizable
tastes included four basic tastes (sweet, salty, sour, bitter) and unidentified/water (in case the
panelists were unable to identify specific tastes). All threshold evaluations were performed in
partitioned booths illuminated with cool, natural, fluorescent lights. Evaluation sessions were
conducted at 10:00 am (2 hours before the regular lunch time of panelists), and panelists were
advised not to drink, eat, or smoke one hour prior to the test. To avoid biases, panelists did not
receive any monetary incentive for participation; however, at the end of the study, all panelists
were invited to an appreciation dinner reception, and their contributions were acknowledged. The
Compusense five (Compusense Inc., Guelph, Canada) computerized data collection system was
used to develop the questionnaire, and to collect the data.
46
3.2.4 Threshold Data Analysis
3.2.4.1 Individual Best-Estimate Thresholds (BET)
A series of each panelist judgments was tabulated with a sequence containing “0” for an
incorrect choice or “+” for a correct choice, which was arranged in the order of judgments of
ascending concentrations of NaCl, caffeine, and/or KCl. As the distribution is typically skewed, a
geometric mean rather than an arithmetic mean was used to measure the center location of the
distribution (ASTM E-679-04; ASTM 2008). Therefore, the best-estimate threshold (BET)
concentration for the detection threshold was the geometric mean of the last missed (0)
concentration and the next (adjacent) higher concentration (+). The BET concentration for the
recognition threshold was the geometric mean of the two lowest concentrations at which correct
responses occurred and a recognizable taste was identified. The final individual thresholds were
obtained by the arithmetic average of the individual threshold values from two independent
replications.
3.2.4.2 Group Best-Estimate Thresholds (GBET)
For the geometric mean method, the group best-estimate threshold (GBET) was obtained
by the arithmetic average of summation of the logarithm with base 10 (log10) of the individual
BET values. The log10 standard deviation provided a measure of the group variation (ASTM 2008).
The arithmetic average of GBETs of two replicates (group sessions) was reported. This method
was used for estimating detection threshold as well as recognition thresholds for saltiness and
bitterness.
3.2.5 Statistical Analysis
Analysis of variance (ANOVA) and the post-hoc Tukey's Studentized Range (HSD) test
were performed at α = 0.05 to compare the mean threshold differences between different solutions
47
and emulsions systems for a given stimulus and threshold test. For an alternative method of
analyzing the responses, logistic regression analysis was performed, modelling the panel selection
of correct responses (from the 3-AFC test) using the system (solutions over the emulsions 1 and
2) and concentration of the tastant (ascending concentration of NaCl, caffeine, and KCl in the
aqueous or emulsion system; continuous variable) as regression variables of the model. All
statistical analyses were performed using Statistical Analysis Software® (SAS 2012).
3.3 Results and Discussion
3.3.1 Detection Threshold
The ANOVA table (Table 3.1) summarizes the effects of different taste compounds (NaCl,
caffeine, and/or KCl) and systems (solution, emulsion 1, and emulsion 2) on the log10 BET values
sorted by the type of threshold test performed (detection, saltiness recognition, and/or bitterness
recognition). For the detection log10 BET values, the system effect was significant (P < 0.05) but
the compound and the compound * system interaction effects were not significant. This indicates
that individual detection thresholds of the different compounds tested (NaCl, caffeine, and KCl)
were not significantly different (P ≥ 0.05), but threshold values significantly (P < 0.05) varied
across the systems (solution vs. emulsions). The group variation expressed as log10 standard
deviations for detection thresholds was in the range of 0.24-0.64 (data not shown).
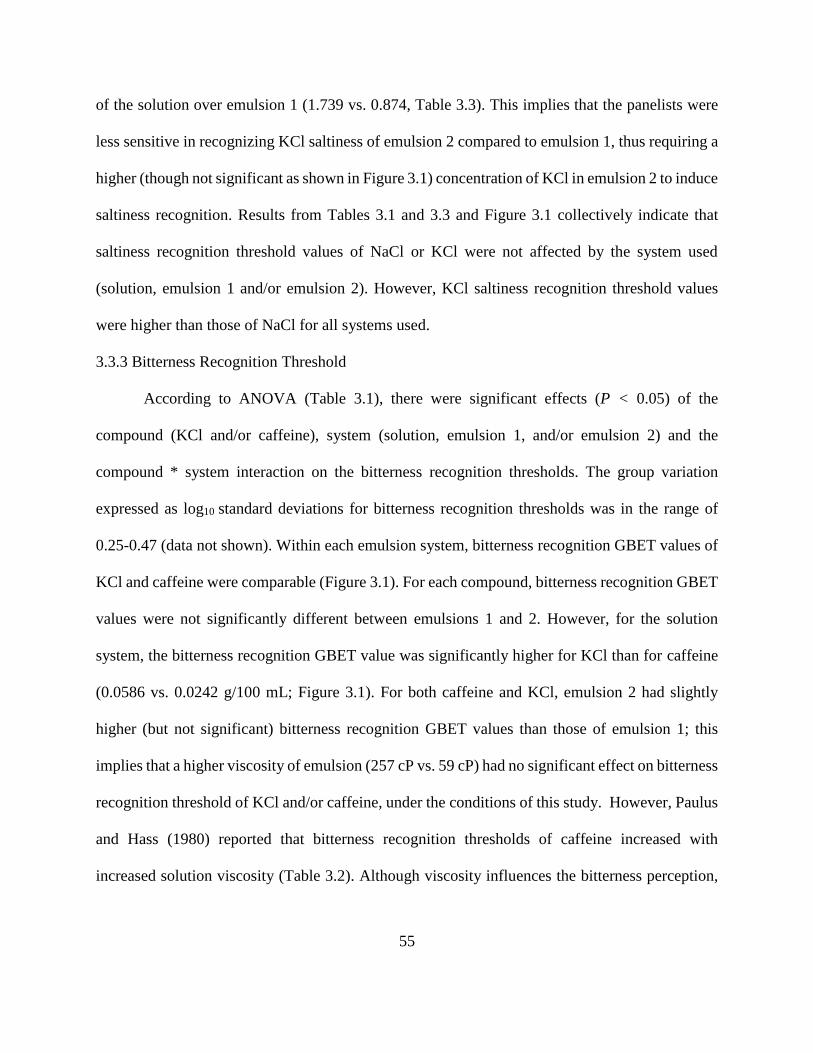
NaCl and KCl detection GBET values (0.0197-0.0286 vs. 0.0215-0.0354 g/100 mL; Figure
3.1) were not significantly different (P ≥ 0.05) regardless of the system (solution, emulsion 1,
and/or emulsion 2). Caffeine detection GBET of water solution was not significantly different (P
≥ 0.05) from that of emulsion 1 (0.0181 vs.0.0284g/100 mL) but was significantly lower than that
of emulsion 2 (0.0516 g/100 mL). No significant differences (P ≥ 0.05) for caffeine detection
GBET were found between emulsions 1 and 2. Generally, detection GBET values (0.0197-0.0516)
48
were lower than those of saltiness (0.0470-0.1070 g/mL) and bitterness (0.0242-0.1025 g/100 mL)
recognition GBET values for all the systems (Figure 3.1).
Variations in the detection threshold values of NaCl, KCl and caffeine in solutions have
been reported (Table 3.2). However, the study on the thresholds of KCl is limited. Mojet and
others (2001) reported the detection threshold of KCl at 0.034-0.037 g/100 mL for 22 young
subjects (19-33 years old).
Table 3.1 ANOVA table of the log10 of the Best Estimate Thresholds (BET’s) values for detection,
saltiness recognition, and bitterness recognition thresholds
Type III Tests of fixed effects for detection BET’s
Effect1 Num DF2 Den DF2 F Value2 Pr > F2
Compound 2 237.9 2.71 0.0685
System 2 238.7 10.48 <.00013
Compound*System 4 237.9 2.07 0.0854
Type III Tests of fixed effects for saltiness recognition BET’s
Effect1 Num DF2 Den DF2 F Value2 Pr > F2
Compound 1 154.2 39.64 <.00013
System 2 154.7 1.82 0.1656
Compound*System 2 154.2 1.55 0.2157
Type III Tests of fixed effects for bitterness recognition BET’s
Effect1 Num DF2 Den DF2 F Value2 Pr > F2
Compound 1 152.9 11.66 0.00083
System 2 153.7 27.14 <.00013
Compound*System 2 152.9 5.37 0.00563 1 Three tested compounds (NaCl, Caffeine and KCl) and three systems (solution, emulsion 1
[viscosity = 257 cP] and emulsion 2 [viscosity = 59 cP]). For saltiness recognition BET, only NaCl
and KCl were tested. For bitterness recognition BET, only caffeine and KCl were tested. Panelist
(N = 15) were considered as a random effect in the model. Two independent replicates were
performed. 2 DF, Degrees of freedom; Num = Numerator; Den = Denominator; F value = Mean square/Mean
square error. 3 Effects were significant when the probability (Pr > F) was < 0.05.
49
Figure 3.1 Group Best Estimate Thresholds (GBET’s in g/100mL) for different threshold types [Detection (D), Saltiness Recognition (S)
and Bitterness Recognition (B)] of three compounds (NaCl, caffeine and KCl) a-d Bars with different superscripts on the top indicate significant differences (P < 0.05) within each threshold type (D, S, or B) determined
by the Tukey's Studentized Range (HSD) test. Each GBET is an average of two values (replicates). Emulsion 1 = viscosity of 257 cP and
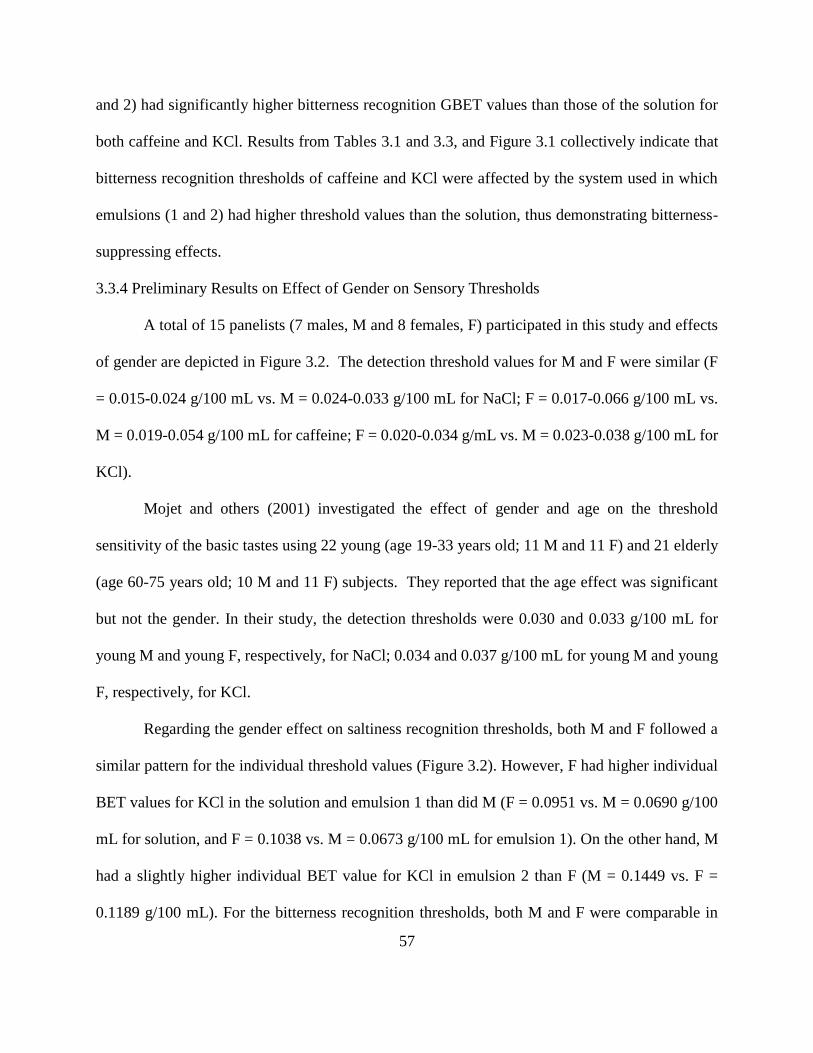
Table 3.2 A comparative table for detection and recognition (saltiness and bitterness) threshold
determinations
Authors Panelist
description System* Tastant
Type of
threshold*
Threshold
value
(g/100 mL)
Hatae and
others (2009)
40 young
females Solution NaCl Detection 0.004
Gomez and
others (2004) 21 females
Solution NaCl Detection 0.038
Solution NaCl Recognition 0.038
Weiffenbach
(1995)
69 females (24-
82 years old) Solution NaCl Detection 0.018
Gonázlez
Viñas and
others (1998)
21 tasters
Solution NaCl Detection 0.021
Solution Caffeine Detection 0.010
Paulus and
Hass (1980)
14 subjects (5
males and 9
females)
Solution (1cP) NaCl Detection 0.040
Solution (1cP) Caffeine Detection 0.008
Solution (100cP) NaCl Detection 0.042-0.061
Solution (100cP) Caffeine Detection 0.008-0.010
Solution (1cP) NaCl Recognition 0.082
Solution (1cP) Caffeine Recognition 0.015
Solution (100cP) NaCl Recognition 0.091-0.125
Solution (100cP) Caffeine Recognition 0.016-0.031
Mojet and
others (2001) 22 panelists
Solution NaCl Detection 0.030-0.033
Solution KCl Detection 0.034-0.037
Thurgood
and Martin
(2010)
11 panelists (5
males and 6
females; 21-61
years old)
Solution NaCl Recognition 0.011
Emulsion (20%) NaCl Recognition 0.022
Solution Quinine Recognition 0.0003
Emulsion (20%) Quinine Recognition 0.0011
The present
study
15 panelists (7
males and 8
females; 20-30
years old)
Solution (1cP) NaCl Detection 0.020
Emulsion (257cP) NaCl Detection 0.022
Solution (1cP) NaCl Recognition 0.049
Emulsion (257cP) NaCl Recognition 0.047
Solution (1cP) Caffeine Detection 0.018
Emulsion (257cP) Caffeine Detection 0.028
Solution (1cP) Caffeine Recognition 0.024
Emulsion (257cP) Caffeine Recognition 0.075
*Saltiness recognition threshold for NaCl, and bitterness recognition threshold for caffeine or
quinine.
51
In this study, the KCl detection GBET value in a water solution was 0.0215 g/100 mL.
Hatae and others (2009) reported that the NaCl group detection threshold for 40 subjects was 0.004
g/100 mL, which was lower than that (0.018 g/100 mL) for 69 subjects reported by Weiffenbach
and others (1995). Gonázlez Viñas and others (1998) estimated group detection threshold values
of 0.021 g/100 mL for NaCl and 0.010 g/100 mL for caffeine in solutions using the method of
limits (ASTM E-679). Keast and Roper (2007) reported a caffeine detection threshold value of
0.0233 g/100 mL using 33 subjects. Drewnowski (2001) estimated caffeine detection threshold in
water solutions at 0.0094 g/100 mL. Paulus and Hass (1980) found that the detection thresholds
of 14 subjects were 0.040 and 0.008 g/100 mL, respectively, for NaCl and caffeine in aqueous
solutions (viscosity = 1 cP); they further reported that the detection thresholds increased with
increased solution viscosity (Table 3.2).
NaCl and caffeine detection threshold values reported for the solution system in this study
(Figure 3.1) are similar to those reported by Weiffenbach and others (1995), Gonázlez Viñas and
others (1998), and Keast and Roper (2007). Contrary to what Paulus and Hass (1980) found
regarding the viscosity effect on thresholds, Figure 3.1 shows that the lower viscosity (59 cP)
emulsion 2 had higher (but not significant) detection thresholds compared to that of the higher
viscosity (257 cP) emulsion 1, for all compounds evaluated. Malone and others (2003) explained
that the existence of an oil phase in the oil-in-water emulsion reduces the volume of water in
emulsion samples compared to aqueous solution samples. This results in an increase of the
perceived taste intensity. However, another perception mechanism could involve the mouth-
coating of the taste receptor by the oil phase, which results in a decrease of the perceived taste
intensity.
52
According to the logistic regression analysis, caffeine had higher odds ratio values
(solution vs. emulsion 1, and solution vs. emulsion 2) compared to those of NaCl and KCl (1.443-
1.838 vs. 1.074-1.353; Table 3.3). This means that the odds of selecting the correct response (the
odd sample) in a 3-AFC test was higher in a solution system than in emulsion systems for caffeine.
This implies that panelists were more sensitive towards caffeine in the aqueous solution than in
emulsion systems.
For NaCl and KCl, the odds ratio (θ) values were not significant (Ho: θ = 1; P ≥ 0.05),
which indicates that the odds of selecting the correct response was indifferent regardless of the
system used (solution, emulsion 1, and/or emulsion 2). This denotes that panelists exhibited similar
sensitivities towards NaCl and KCl in solution and/or emulsion systems. This finding substantiated
the results reported in Figure 3.1. The results from Tables 3.1 and 3.3 and Figure 3.1 collectively
indicate that detection thresholds for NaCl and KCl were comparable in solution and/or emulsion
systems. However, the emulsion 2 had a higher caffeine detection GBET than the solution.
3.3.2 Saltiness Recognition Threshold
According to ANOVA results for NaCl and KCl saltiness recognition log10 BET values
(Table 3.1), the compound effect was significant (P < 0.05) but the system and the compound *
system interaction effects were not significant (P ≥ 0.05). This indicates that for each compound,
individual saltiness recognition thresholds in the solution and/or emulsion systems were not
significantly different; however, threshold values significantly varied across the compounds tested
(NaCl vs. KCl). The group variation expressed as log10 standard deviations for saltiness
recognition thresholds was in the range of 0.31-0.52 (data not shown) which are higher than the
values reported for detection thresholds (0.24-0.64).
53
Table 3.3 Odds ratio estimates1 for selecting the correct response (the odd sample) in a 3AFC test for each threshold type (Detection,
Saltiness Recognition and Bitterness Recognition) and for each compound (NaCl, caffeine and KCl)
Odds ratio estimates
Test Compound System (solution vs. emulsion 1)2 System (solution vs. emulsion 2)2
Estimate1 Pr > χ2 Estimate1 Pr > χ2
Detection NaCl 1.261 0.336 1.353 0.217
Caffeine 1.443 0.090 1.8383 0.005
KCl 1.074 0.772 1.280 0.317
Saltiness
Recognition NaCl 1.318 0.294 1.541 0.112
KCl 0.874 0.594 1.7393 0.042
Bitterness
Recognition Caffeine 5.9883 <.0001 11.4943 <.0001
KCl 1.7043 0.035 2.5643 0.0004 1 Based on the logistic regression analysis using systems (solutions and emulsions) and concentration of the tastant as regression variables.
The analysis of maximum likelihood estimates was used to obtain the parameter estimates. 2 Three systems were: solution, emulsion 1 (viscosity = 257 cP) and emulsion 2 (viscosity = 59 cP). 3 Parameter estimates were considered significant when the probability of the Wald χ2 was < 0.05.
54
For NaCl saltiness recognition threshold, the GBET values (0.0471-0.0501 g/100 mL) were
not significantly different among the three systems (solution, emulsion 1 and emulsion 2; Figure
3.1). Similar observations were found for KCl saltiness recognition GBET values (0.0822-0.1070
g/100 mL; Figure 3.1). However, for all systems, KCl saltiness recognition GBET values were
significantly higher (P < 0.05) than those of NaCl. NaCl provides the most pure salty taste of all
salts; other salts taste significantly more sour or bitter in addition to salty (Smith and van der
Klaauw 1995). The saltiness pureness of NaCl may explain its lower recognition threshold values
compared to those of KCl (Figure 3.1).
Gomez and others (2004) reported that the detection and recognition thresholds of NaCl in
solution were the same (0.038 g/100 mL); this was not observed in our current study (0.0197 vs.
0.0495 g/100 mL; Figure 3.1). Variations in the saltiness recognition threshold values of NaCl in
solutions have been reported (Table 3.2). Paulus and Hass (1980) found that saltiness recognition
threshold of NaCl increased with increased solution viscosity from 0.082 g/100 mL in a 1 cP
solution to 0.091-0.125 g/100 mL in a 100 cP solution. However, in our study, increased viscosity
of emulsion 1 (257 cP) did not significantly increase the saltiness recognition GBET value
compared to that of emulsion 2 (59 cP) (Figure 3.1). This is supported by the work of Thurgood
and Martin (2010) who reported that NaCl saltiness recognition thresholds in the solution vs. the
oil in water emulsion (20% soybean oil) were not significantly different (0.0110 vs. 0.0220 g/100
mL).
The odds ratio values were not significant (Ho: θ = 1; P ≥ 0.05) for NaCl (Table 3.3), which
implies that the odds of selecting the correct response (recognizing the saltiness in the 3-AFC test)
was similar regardless of the system used (solution, emulsion 1 and/or emulsion 2). For KCl, the
odds ratio value of the solution over emulsion 2 was significant and about 2-fold higher than that
55
of the solution over emulsion 1 (1.739 vs. 0.874, Table 3.3). This implies that the panelists were
less sensitive in recognizing KCl saltiness of emulsion 2 compared to emulsion 1, thus requiring a
higher (though not significant as shown in Figure 3.1) concentration of KCl in emulsion 2 to induce
saltiness recognition. Results from Tables 3.1 and 3.3 and Figure 3.1 collectively indicate that
saltiness recognition threshold values of NaCl or KCl were not affected by the system used
Malone ME, Appelqvist IAM, Norton IT. 2003. Oral behaviour of food hydrocolloids and
emulsions. Part 2. Taste and aroma release. Food Hydrocolloids 17(6):775-84.
McClement DJ editor. 2005. Food emulsions: Principles, practices, and techniques. Boca Raton,
FL: CRC Press.
Metcalf KL, Vickers ZM. 2002. Taste intensities of oil‐in‐water emulsions with varying fat
content. J Sens Stud 17(5)379-90.
Mojet J, Christ-Hazelhof E, Heidema J. 2001. Taste perception with age: generic or specific losses
in threshold sensitivity to the five basic tastes?. Chem Senses 26(7)845-60.
61
Moskowitz HR, Arabie P. 1970. Taste intensity as a function of stimulus concentration and solvent
viscosity. J Texture Stud 1(4):502-10.
Nakaya K, Kohata T, Doisaki N, Ushio H, Ohshima T. 2006. Effect of oil droplet sizes of oil‐in‐water emulsion on the taste impressions of added tastants. Fisheries Sci 72(4):877-83.
Paulus K, Haas E. 1980. The influence of solvent viscosity on the threshold values of primary
tastes. Chem Senses 5(1):23-32.
Ramisetty K, Shyamsunder R. 2011. Effect of ultrasonication on stability of oil in water emulsions.
Int J Drug Delivery 3(1):133-42.
SAS (2012). SAS/STAT User's Guide. Version 9.4. Cary, NC: SAS Institute Inc.
Shamil S, Wyeth LJ, Kilcast D. 1992. Flavour release and perception in reduced-fat foods. Food
Qual Prefer 3(1):51-60.
Smith AK, June H, Noble AC. 1996. Effects of viscosity on the bitterness and astringency of grape
seed tannin. Food Qual Prefer 7(3-4):161-166.
Smith DV, van der Klaauw NJ. 1995. The perception of saltiness is eliminated by NaCl adaptation:
Implications for gustatory transduction and coding. Chem Senses 20(5):545-57.
Thurgood JE, Martini S. 2010. Effects of three emulsion compositions on taste thresholds and
intensity ratings of five taste compounds. J Sens Stud 25(6):861-75.
Vingerhoeds MH, de Wijk RA, Zoet FD, Nixdorf RR, van Aken GA. 2008. How emulsion
composition and structure affect sensory perception of low-viscosity model emulsions.
Food Hydrocolloids 22(4):631-46.
Weiffenbach JM, Schwartz LK, Atkinson JC, Fox PC. 1995. Taste performance in Sjogren's
syndrome. Physiol Behav 57(1):89-96.
Wendin K, Ellekjær MR, Solheim R. 1999. Fat content and homogenization effects on flavour and
texture of mayonnaise with added aroma. LWT-Food Sci Technol 32(6):377-83.
62
CHAPTER 4. OIL AND TASTANT CONCENTRATIONS AFFECT SALTINESS AND BITTERNESS
PERCEPTION OF OIL-IN-WATER EMULSIONS
4.1 Introduction
High sodium consumption is a major contributor to high blood pressure which is the
leading cause of stroke, coronary heart diseases, and kidney failure in the US (CDC 2015).
Reducing sodium has proven to be a difficult task as salt (NaCl), the major contributor of sodium,
not only plays an important role in taste, but is also used for preservation, structuring and other
functional purposes (Kilcast and Angus 2007). One approach to sodium reduction is the use of salt
substitutes such as potassium chloride (KCl) (Liem and others 2011), but KCl has a drawback of
imparting bitterness and metallic aftertaste (Sinopoli and Lawless 2012). Another sodium
reduction approach includes the modification of food structure for improving sodium release and
saltiness perception (Kuo and Lee 2014; Busch and others 2013; Stieger and van de Velde 2013;
Thurgood and Martini 2010). In liquid and semi-solid foods, this approach includes the
modification of physical properties such as microstructure, viscosity, overall salt distribution, and
the use of inert fillers that concentrate salt in the aqueous phase (Busch and others 2013; Stieger
and van de Velde 2013), which can also be applied to emulsion systems.
Several natural and processed foods consist of either partial or entire emulsions, or they
have been in an emulsified state during their production (McClement 2005). To our knowledge,
most emulsion researches have focused on texture and flavor/aroma releases rather than perception
of the basic tastes. From this limited research, two contrasting postulates regarding the effects of
oil on taste perception have been proposed. First, oil can form a physical barrier (mouth-coating)
between the tastants and receptor cells, and hence decreasing the perceived intensity (Lynch and
other 1993; Metcalf and Vickers 2002). Second, oil may increase the concentration of water-
63
soluble tastants, and hence creating a more intense taste perception (Metcalf and Vickers 2002).
Moreover, oil may affect taste perception by increasing viscosity, and altering the diffusion
coefficients and retention times of taste substances in the oral cavity (Mela and others 1994;
Barylko-Pikielna and others 1994). Consequently, sensory perception of basic tastes can be
affected by physical properties of emulsions (Suzuki and others 2014; Rietberg and others 2012;
Dresselhuis and others 2008).
The effects of oil addition on saltiness perception in emulsions were described (Suzuki and
others 2014). As NaCl and KCl are water-soluble, they are expected to be fully partitioned in the
aqueous phase, resulting in increased perceived saltiness in emulsions with higher oil
concentrations (Kuo and Lee 2014; Koriyama and others 2002). Malone and others (2003) reported
that saltiness perception in emulsions was dependent on the concentration of salt in the aqueous
phase, the total aqueous phase volume in the emulsion, and the formation of an oily mouth-coating
that reduces the mass transfer of the tastant to the taste receptors.
In previous investigations, contrasting conclusions were found regarding the effects of oil
on bitterness perception. Keast (2008) stated that increasing milk fat content increased the
bitterness of caffeine. He attributed this effect to the interaction of caffeine molecules with milk
proteins and carbohydrates. Pripp and others (2004) concluded that increasing oil viscosity was
not effective in reducing bitterness of olive oil phenolics. They hypothesized that, at high oil
viscosity, the mass transport of tastants decreased, and hence a lower tastant concentration at the
interface between sample and taste receptors. Metcalf and Vickers (2002) reported that emulsions
with added oil had less bitter taste and more intense sweet, salty, sour, and umami tastes than those
with added water. The majority of bitter compounds are hydrophobic and they can reside in
lipophilic environments. Therefore, oil may suppress bitterness through a dilution effect of the
64
bitter compounds in the water-phase of emulsions (Coupland and Hayes 2014; Metcalf and Vickers
2002). Moreover, the type and characteristics of the oil may affect the perceived bitterness (Kuo
and Lee 2014). For instance, Koriyama and others (2002) concluded that bitterness suppression of
quinine sulfate was higher for tuna oil compared to that of soybean and corn oils.
Suzuki and others (2014) studied the effect of lipid content on saltiness perception in oil-
in-water emulsion systems. However, they only measured salty taste quality using NaCl, and no
other research has attempted to investigate saltiness perception of NaCl and KCl, and bitterness
perception of caffeine and KCl in emulsion systems. Therefore, the objective of this study was to
evaluate saltiness of NaCl and KCl, and bitterness of KCl and caffeine in emulsions prepared with
different concentrations of canola oil (20, 40 or 60%) and tastants [NaCl (0.50, 0.75 or 1.00%),
KCl (0.50, 1.00, or 1.50%), or caffeine (0.05, 0.10, or 0.15%)] using a trained SpectrumTM
descriptive panel.
4.2 Materials and Methods
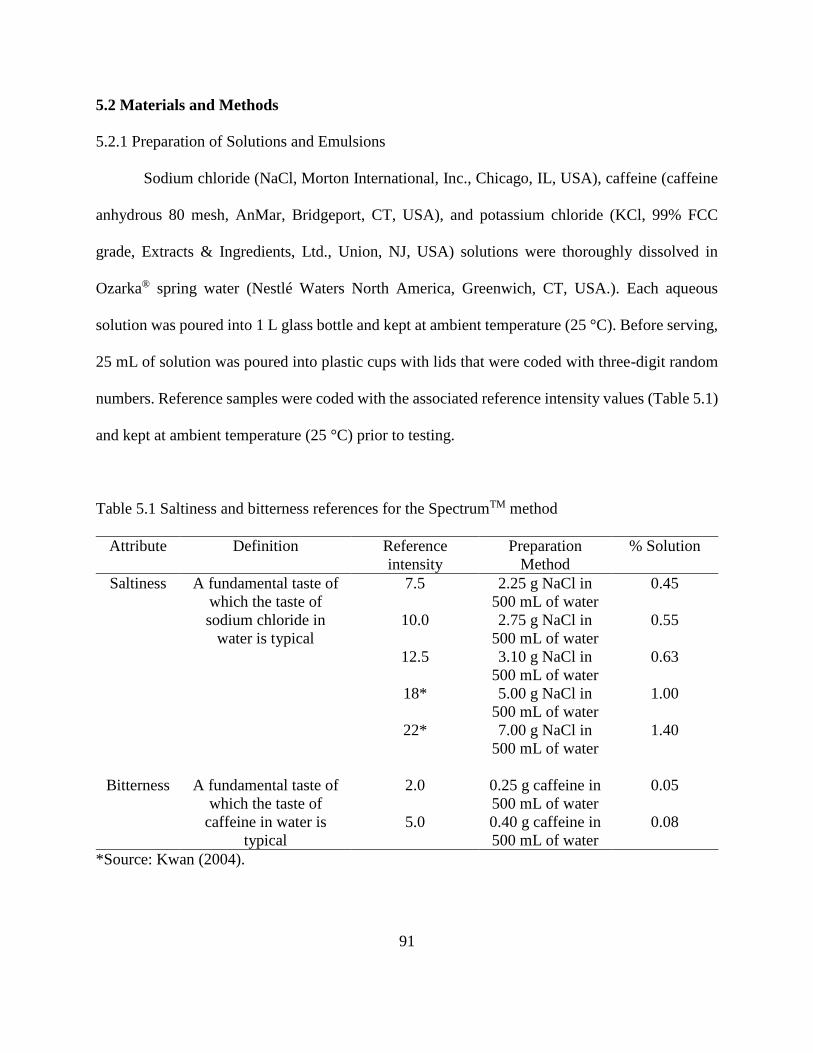
4.2.1 Preparation of Sample Solutions and Emulsions
grade, Extracts & Ingredients, Ltd., Union, NJ, USA) solutions were thoroughly dissolved in
Ozarka® spring water (Nestlé Waters North America, Greenwich, CT, USA.). Each aqueous
solution was poured into 1 L glass bottle and kept at ambient temperature (25 °C). Before serving,
25 mL of solution was poured into plastic cups with lids that were coded with three-digit random
numbers. Reference samples were coded with the associated reference intensity values (Table 5.1)
and kept at ambient temperature (25 °C) prior to testing.
Table 5.1 Saltiness and bitterness references for the SpectrumTM method
Attribute Definition Reference
intensity
Preparation
Method
% Solution
Saltiness A fundamental taste of
which the taste of
sodium chloride in
water is typical
7.5 2.25 g NaCl in
500 mL of water
0.45
10.0 2.75 g NaCl in
500 mL of water
0.55
12.5 3.10 g NaCl in
500 mL of water
0.63
18* 5.00 g NaCl in
500 mL of water
1.00
22* 7.00 g NaCl in
500 mL of water
1.40
Bitterness A fundamental taste of
which the taste of
caffeine in water is
typical
2.0 0.25 g caffeine in
500 mL of water
0.05
5.0 0.40 g caffeine in
500 mL of water
0.08
*Source: Kwan (2004).
92
For preparing the emulsions, one texture modifier and one emulsifier were used. The
texture modifier Tic Pretested®Ticaloid®210 S Powder (gum acacia and xanthan gum; Tic Gums®,
Inc., White Marsh, MD, USA) was used to increase the viscosity of the aqueous phase of the
emulsion. The emulsifier Tandem® 552K (a mixture of mono- and diglycerides, polysorbate, water
and proply gallate) was obtained from Caravan® ingredients (Lenexa, KS, USA). A concentration
of 1% of Tic gum was mixed with the aqueous phase, and 1% of Tandem emulsifier was mixed
with the oil phase. NaCl, KCl, or caffeine were first dissolved in the aqueous portion (water+Tic
gum) of the emulsion, and then mixed with canola oil (CWP, Cal Western Packaging Corp.,
Memphis, TN, USA) and the emulsifier. Final concentrations of each tastant and oil are shown in
Table 5.2. Emulsions were mixed for 10 minutes at high-speed using a hand-held blender (Model
# 59780R, Hamilton Beach® Brands Canada, Inc., Picton, Onratio, Canada). Each emulsion was
poured into 1 L glass bottle and kept at ambient temperature (25 °C) prior to testing. Before
serving, 25 mL of emulsion was poured into plastic cups with lids that were coded with three-digit
random numbers. Viscosity of emulsions was measured in centipoise (cP) at 20±0.5 °C using a
viscometer (model DV-II+, Brookfield Engineering Labs Inc., Middleboro, MA, USA) at 50 rpm
using a RV-IV spindle, with data gathered in Wingather V2.1 software (Brookfield Engineering
Labs Inc.).Two independent batches for each emulsion were prepared.
5.2.2 Sensory Analysis
5.2.2.1 Panelist Recruitment
The research protocol for this study was approved (IRB# HE 15-9) by the Louisiana State
University Agricultural Center Institutional Review Board. Panelists from a pool of faculty, staff,
and students at Louisiana State University were recruited and pre-screened using the following
criteria: availability, health, general product attitudes, sensory awareness, and rating ability.
93
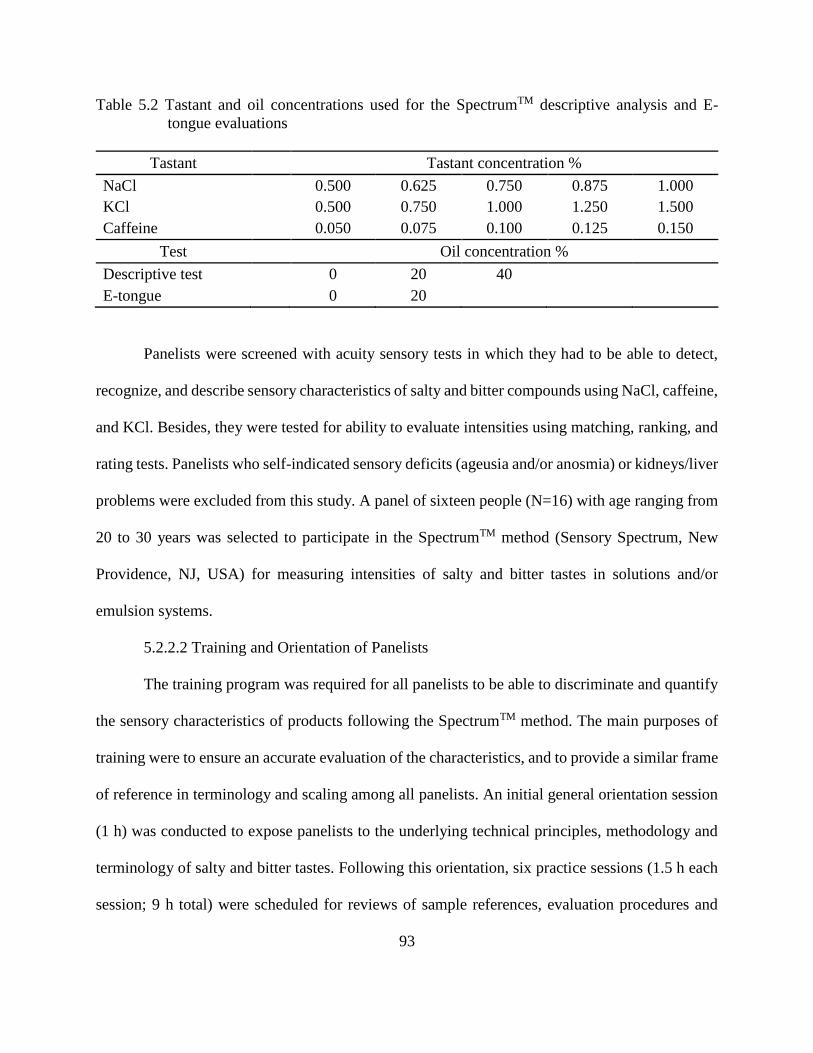
Table 5.2 Tastant and oil concentrations used for the SpectrumTM descriptive analysis and E-
tongue evaluations
Tastant Tastant concentration %
NaCl 0.500 0.625 0.750 0.875 1.000
KCl 0.500 0.750 1.000 1.250 1.500
Caffeine 0.050 0.075 0.100 0.125 0.150
Test Oil concentration %
Descriptive test 0 20 40
E-tongue 0 20
Panelists were screened with acuity sensory tests in which they had to be able to detect,
recognize, and describe sensory characteristics of salty and bitter compounds using NaCl, caffeine,
and KCl. Besides, they were tested for ability to evaluate intensities using matching, ranking, and
rating tests. Panelists who self-indicated sensory deficits (ageusia and/or anosmia) or kidneys/liver
problems were excluded from this study. A panel of sixteen people (N=16) with age ranging from
20 to 30 years was selected to participate in the SpectrumTM method (Sensory Spectrum, New
Providence, NJ, USA) for measuring intensities of salty and bitter tastes in solutions and/or
emulsion systems.
5.2.2.2 Training and Orientation of Panelists
The training program was required for all panelists to be able to discriminate and quantify
the sensory characteristics of products following the SpectrumTM method. The main purposes of
training were to ensure an accurate evaluation of the characteristics, and to provide a similar frame
of reference in terminology and scaling among all panelists. An initial general orientation session
(1 h) was conducted to expose panelists to the underlying technical principles, methodology and
terminology of salty and bitter tastes. Following this orientation, six practice sessions (1.5 h each
session; 9 h total) were scheduled for reviews of sample references, evaluation procedures and
94
results. A 15- or 22-cm line scale anchored at the ends with the terms “none” and “extreme” was
used, where panelists indicated the perceived intensities by marking a vertical line on the scale.
For reference samples, sodium chloride solutions were used for salty references and caffeine
solutions were used for bitter references. Reference intensity scores, preparation methods and
concentrations of each reference are shown in Table 5.1. Once panelists had completed their
training, practice samples were provided to them to evaluate. This practicing time lasted 10 to 15
h or until their scores were <10% standard deviation from the known intensity scale values.
5.2.2.3 Product Evaluation
A total of 12 sessions were performed to evaluate all solution and emulsion samples over
a period of 8 wks. All sample evaluations were performed in partitioned sensory booths illuminated
with cool, natural, fluorescent lights. Besides, evaluation sessions were conducted at 10:00 am (2
h before the regular lunch time of panelists), and panelists were advised not to drink, eat, or smoke
1 h prior to the test. To avoid biases, panelists did not receive any monetary incentive for
participation; however, at the end of the study, all panelists were acknowledged for their
contributions at an appreciation dinner reception. Unsalted, plain crackers and water were provided
to cleanse the palate during the evaluation. A 15-cm anchored scale was used to measure the
bitterness intensities where 0 = none and 15 = extreme. A 22-cm anchored scale was used to
measure the saltiness intensities where 0 = none and 22 = extreme (Kwan 2004). Two replications
of each sample were performed for both saltiness and bitterness perceptions. Individual scores
were collected and analyzed statistically. The Compusense five (Compusense Inc., Guelph,
Canada) computerized data collection system was used to develop the questionnaire, and to collect
the data.
95
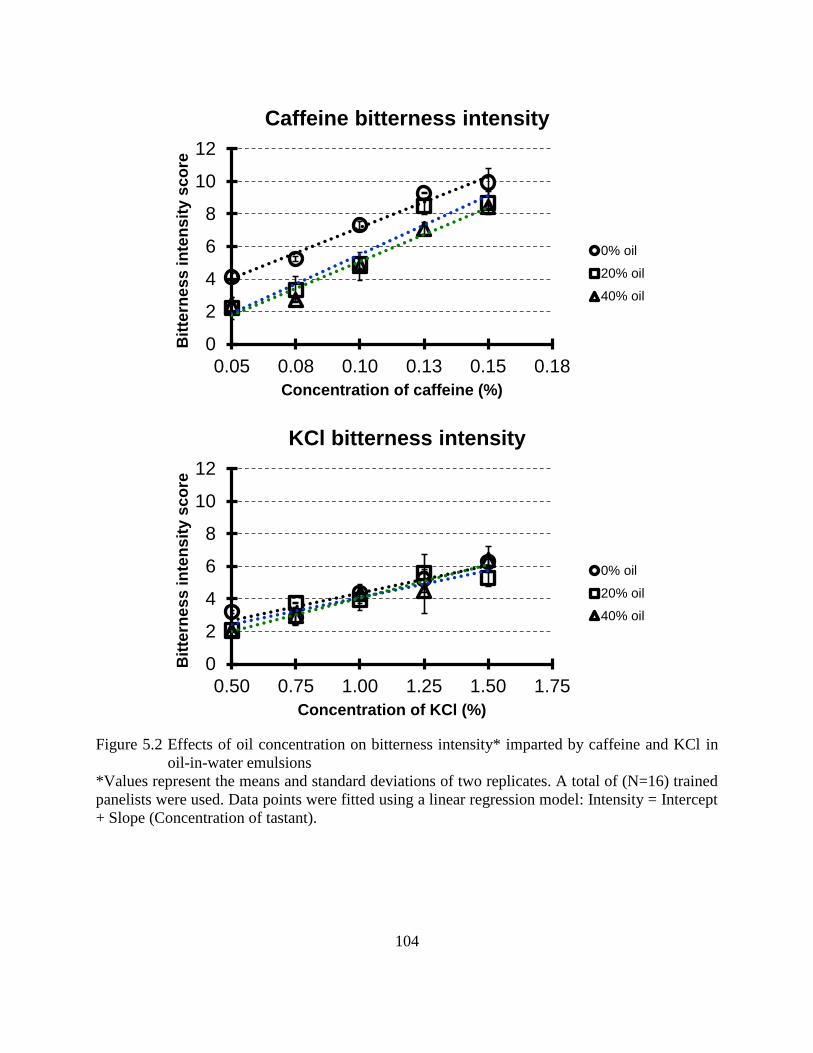
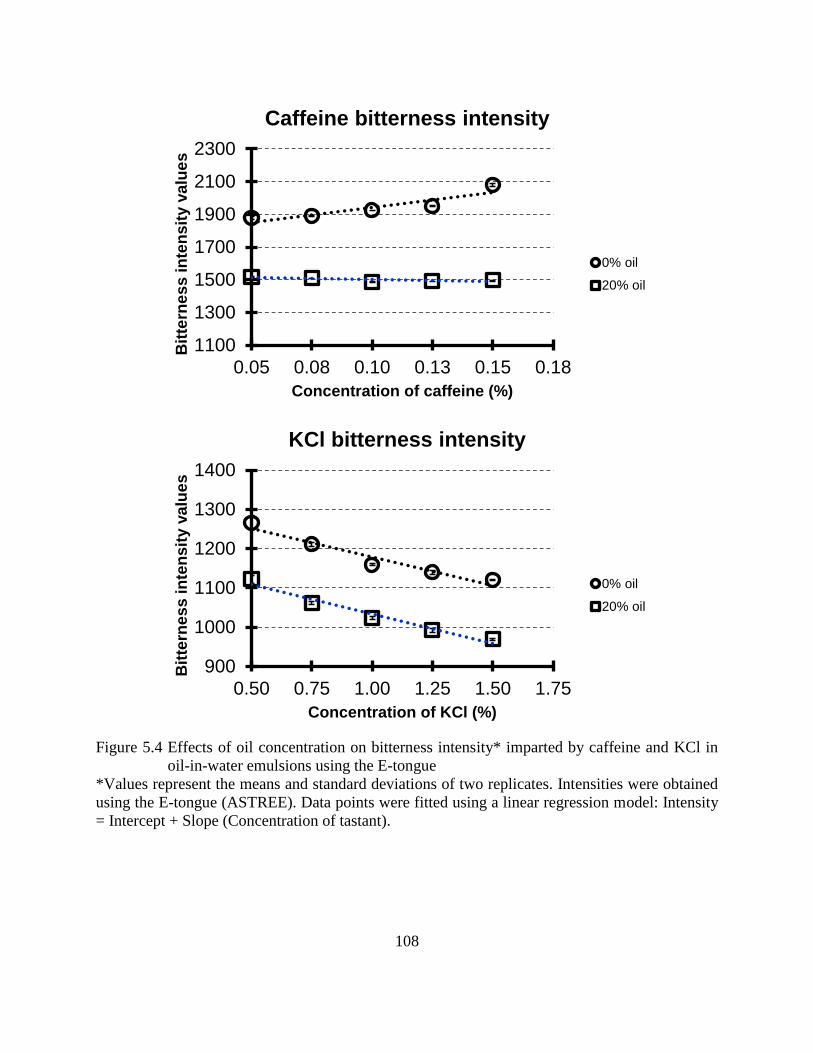
5.2.3 Taste Analysis Using the Electronic-Tongue (E-tongue)
To compare the descriptive panel and the E-tongue analysis, the same tastant (NaCl,
caffeine, or KCl) concentrations of solutions and 20% oil emulsions tested for human evaluations
were measured using an α-Astree II electronic tongue (Alpha M.O.S. Co., Toulouse, France). Data
were collected from two liquid cross-selective sensors. Each sensor had a specific organic
membrane that could produce a response to salty and bitter taste qualities. Any interactions at the
membrane interface were detected by the sensor and converted into an electronic signal.
Electrodes were dipped in a 75 mL sample for 120 sec, and data were recorded using the Alpha
M.O.S. software. Three measurements were taken from each of the two independent replications
of the solution and emulsion systems. Emulsions with 40% oil were not measured since their
viscosities were above the recommended specifications for the sensors.
5.2.4 Design of the Experiment and Statistical Analysis
A randomized complete block design (RCBD), considering the panelists as blocks, with a
full factorial treatment arrangement was used to systematically investigate the main effects and
interactions of two emulsion factors [five levels of tastant concentration by three levels of oil
concentration (0, 20 and 40%) for the descriptive panel evaluation and five levels of tastant
concentration by two levels of oil concentration (0 and 20%) for the E-tongue evaluation] on the
saltiness and bitterness intensities (Table 5.2). The independent variable was the concentration of
tastant. The dependent variables were either saltiness or bitterness intensities. The experimental
results of the RCBD with a full factorial treatment arrangement were analyzed using a two-way
Analysis of variance (ANOVA) to determine differences in saltiness and bitterness intensities of
solution and emulsion systems. Data from the descriptive panel and E-tongue evaluations of each
oil concentration were fitted using linear regressions as in [Intensity = Intercept + Slope
96
(Concentration of tastant)], where Intensity referred to either saltiness or bitterness intensity
values; Concentration of tastant referred to the concentration of NaCl, KCl, or caffeine in the
solution or emulsion systems; Intercept was the Intensity value when the Concentration of tastant
was 0; Slope was the rate of change of the Intensity as the Concentration of tastant changed by
one unit.
Data from the descriptive panel were also fitted using the Stevens’ power functions [Ψ =
k (Φ)n], where Ψ was the response (intensity) to stimuli of concentration (Φ). The constant k was
a scaling constant that reconciled the units used to measure Ψ and Φ, whereas the constant n was
a measure of the growth rate of the perceived intensity as a function of the stimulus concentration
(Moskowitz and Arabie 1970; Meilgaard and others 2006; Suzuki and others 2014). Coefficients
of determination of the regression models (R2) were also obtained. Analysis of Covariance
(ANCOVA) was used to evaluate differences between solution and emulsion systems for the fitted
linear and Steven’s power models. Statistical Analysis Software® (SAS 2012) at α=0.05 was used
for the regression analyses of the experimental data.
5.3 Results and Discussion
5.3.1 Saltiness Perception Using Descriptive Panel
The estimated parameters for saltiness intensities of NaCl and/or KCl solutions and oil-in-
water emulsions (20 and/or 40% of oil) using linear regressions and the Stevens’ power law are
shown in Table 5.3. For saltiness linear regression, data were fitted with R2 values of 0.88-0.94
for NaCl, and 0.91-0.94 for KCl solutions or emulsions. In general, estimated linear slopes for
NaCl systems were higher compared to those of KCl (23.78 vs. 15.47, 18.19 vs. 14.19, and 15.68
vs. 13.40 for 0, 20, and 40% oil systems, respectively).
97
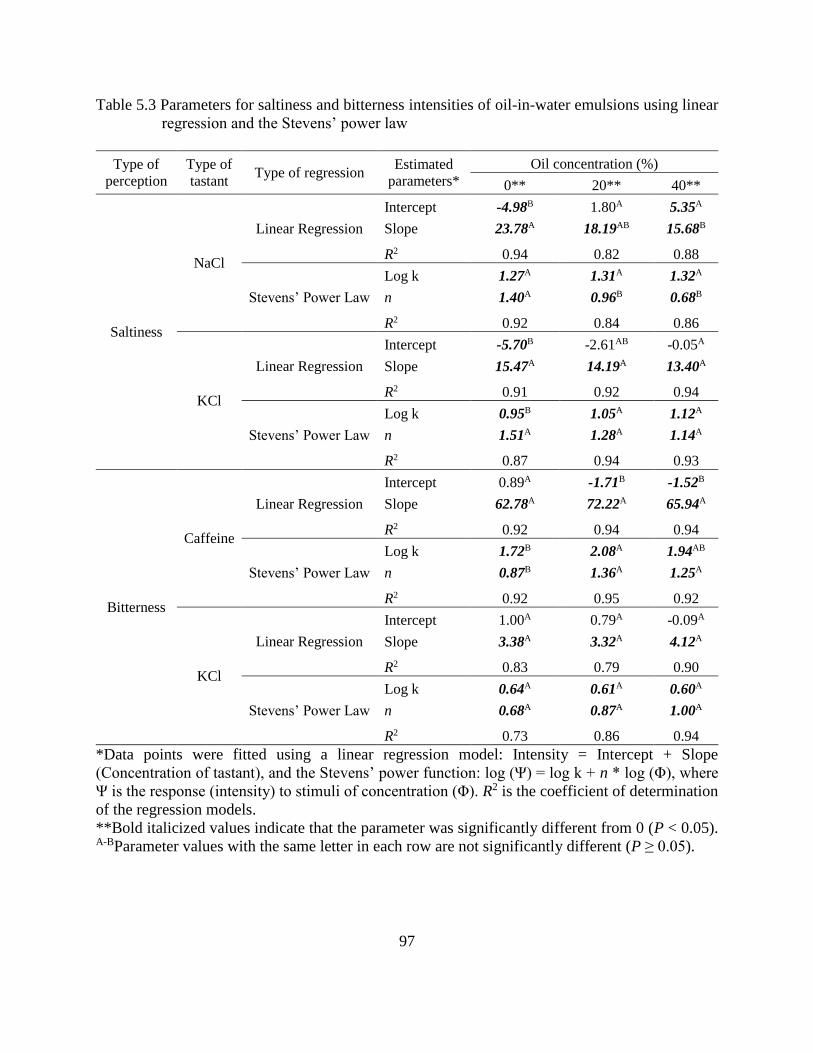
Table 5.3 Parameters for saltiness and bitterness intensities of oil-in-water emulsions using linear
regression and the Stevens’ power law
Type of
perception
Type of
tastant Type of regression
Estimated
parameters*
Oil concentration (%)
0** 20** 40**
Saltiness
NaCl
Linear Regression
Intercept -4.98B 1.80A 5.35A
Slope 23.78A 18.19AB 15.68B
R2 0.94 0.82 0.88
Stevens’ Power Law
Log k 1.27A 1.31A 1.32A
n 1.40A 0.96B 0.68B
R2 0.92 0.84 0.86
KCl
Linear Regression
Intercept -5.70B -2.61AB -0.05A
Slope 15.47A 14.19A 13.40A
R2 0.91 0.92 0.94
Stevens’ Power Law
Log k 0.95B 1.05A 1.12A
n 1.51A 1.28A 1.14A
R2 0.87 0.94 0.93
Bitterness
Caffeine
Linear Regression
Intercept 0.89A -1.71B -1.52B
Slope 62.78A 72.22A 65.94A
R2 0.92 0.94 0.94
Stevens’ Power Law
Log k 1.72B 2.08A 1.94AB
n 0.87B 1.36A 1.25A
R2 0.92 0.95 0.92
KCl
Linear Regression
Intercept 1.00A 0.79A -0.09A
Slope 3.38A 3.32A 4.12A
R2 0.83 0.79 0.90
Stevens’ Power Law
Log k 0.64A 0.61A 0.60A
n 0.68A 0.87A 1.00A
R2 0.73 0.86 0.94
*Data points were fitted using a linear regression model: Intensity = Intercept + Slope
(Concentration of tastant), and the Stevens’ power function: log (Ψ) = log k + n * log (Φ), where
Ψ is the response (intensity) to stimuli of concentration (Φ). R2 is the coefficient of determination
of the regression models.
**Bold italicized values indicate that the parameter was significantly different from 0 (P < 0.05). A-BParameter values with the same letter in each row are not significantly different (P ≥ 0.05).
98
This indicated that for a given change in concentration of either NaCl or KCl, the change
in saltiness intensity was higher for NaCl compared to that of KCl. Besides, the estimated NaCl
linear slopes decreased significantly (P < 0.05) with increasing oil concentrations (from 23.78 at
0% oil to 15.68 at 40% oil). This indicates that the addition of oil in the systems reduced the rate
of change in saltiness intensities imparted by NaCl. For instance, doubling NaCl concentration
from 0.5 to 1.0% would produce a greater change (1.30-1.50 times higher) in saltiness perception
in solutions compared to that in emulsion systems. On the other hand, the estimated KCl linear
slopes decreased slightly but not significantly (P ≥ 0.05) with increasing oil concentrations (15.47
at 0% oil to 13.40 at 40% oil).
Data fitted using the Stevens’ power law showed R2 values of 0.84-0.92 for NaCl and 0.87-
0.94 for KCl solutions and/or emulsions (Table 5.3). In general, the estimated exponent n values
were higher for KCl systems compared to those of NaCl systems (1.51 vs. 1.40, 1.28 vs. 0.96, 1.14
vs. 0.68 for 0, 20, and 40% oil systems, respectively). The exponent n parameter determines the
type of response obtained for a specific stimulus; for instance, if n is greater than 1.0, the response
toward a specific stimulus accelerates with concentration, whereas if n is lower than 1.0, the
response decelerates with concentration (Shallenberger 1993). If the n exponent appears to be 1.0,
the intensity of the taste is linearly related to the stimulus concentration (Moskowitz and Arabie
1970). The intercept k may change from experiment to experiment without affecting the exponent
(Stevens 1969). For the present study, the estimated n indicated that oil had a decelerating effect
(n = 0.68-0.96) on the saltiness perception of NaCl. However, oil imparted an accelerating effect
(n = 1.14-1.28) on the saltiness perception of KCl (Table 5.3). These findings indicated profound
differences between NaCl and KCl in terms of the perceived saltiness intensity in oil-in-water
emulsions. Compared with NaCl, KCl demonstrated to be less susceptible to the taste decelerating
99
effect imparted by oil, i.e., the effects of oil on the saltiness perception of NaCl were larger
compared to that of KCl, which substantiated the results of the linear regression mentioned above.
Suzuki and others (2014) concluded that the response toward NaCl saltiness intensity
decreased as an oil phase was introduced in the system. They reported estimated n values of 0.87,
0.66, and 0.47 for 0, 20, and 40% oil systems, respectively. Differences in results reported by
Suzuki and others (2014) and in the present study could be attributed to the different methods of
scaling used (magnitude estimation rating vs. linear scale rating), and the different experimental
conditions for preparing the emulsions. Moskowitz and Arabie (1970) stated that the estimated n
for saltiness of solutions was approximately 1.40 (similar to the value found in the present study),
suggesting that the perceived saltiness intensity increased as a positively accelerating function of
concentration. Moreover, Moskowitz and Arabie (1970) found that the rate of saltiness intensity
perception was diminished when the apparent solvent viscosity increased (from 1 to 1000 cP).
Viscosities in the present study increased from 1.0 cP for 0% oil to 280-290 cP for 20% oil, and to
588-600 cP for 40% oil in NaCl systems. Thus, the decelerating effect in salty taste imparted by
oil was partially due to the increased viscosity of the emulsion systems. Hughes and others (1997)
stated that fats and/or oils as hydrophobic compounds acted as barriers against sodium migration,
hence disfavor its release. Moreover, oil was found to coat the tongue surface, thus preventing the
taste buds from accessing sodium in the oral cavity (Lynch and others 1993).
For the present study, linear model approximations (R2 = 0.82-0.94) fitted the data as
closely as power function models (R2 = 0.84-0.94). Hence, both models may explain the behavior
of taste intensities across the tested tastant concentrations. However, when using linear models,
making conclusion outside the range of concentrations tested can be misleading since the
relationship between perceived intensity and tastant concentration may not be linear outside this
100
range and extrapolation can lead to errors in prediction. Comparisons of different systems (0, 20,
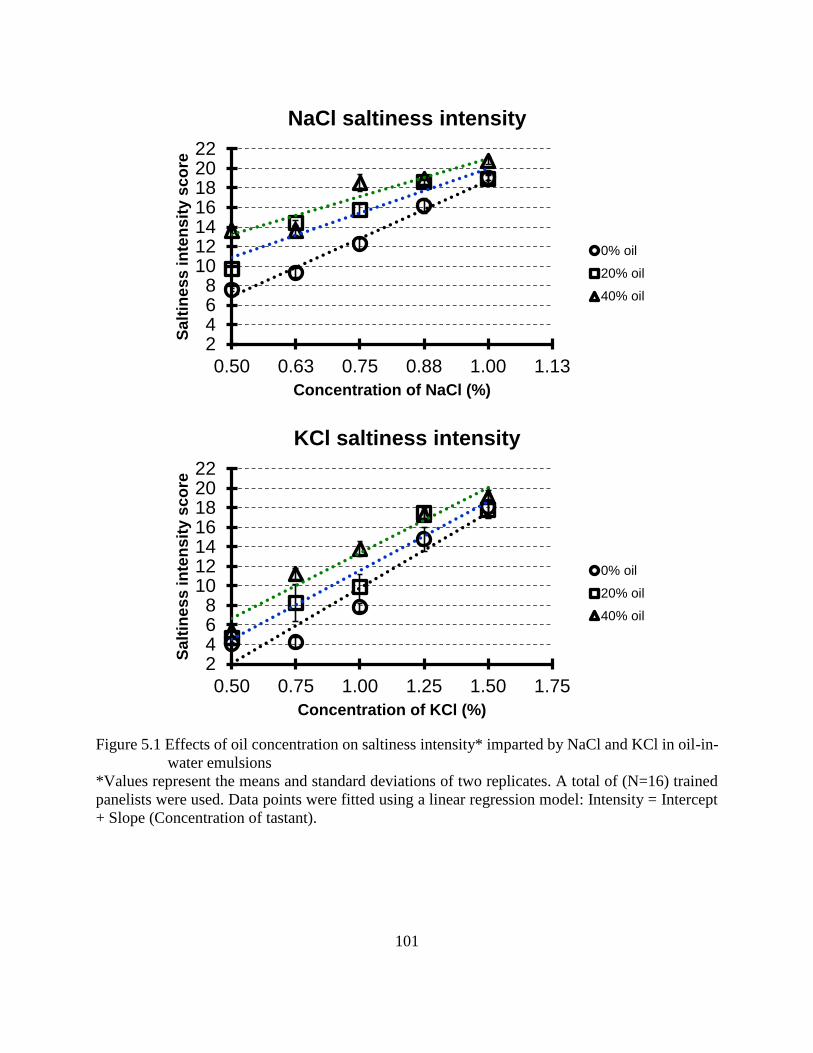
and/or 40% oil) on the saltiness perception of NaCl and KCl are shown in Figure 5.1. For both
salts, increasing oil concentrations increased saltiness intensities at various salt concentrations.
However, the effect of oil on saltiness perception decreased with simultaneously increasing oil and
salt concentrations; this effect was more obvious for NaCl than KCl. Moreover, at a given salt
concentration, saltiness intensities were higher for NaCl than for KCl regardless the systems used
(0, 20, and/or 40% oil; Figure 5.1). For instance, 0.75% NaCl vs. 0.75% KCl had saltiness intensity
values of 18.50 vs. 11.19, 15.72 vs. 8.25, and 12.29 vs. 4.20 for 0, 20, and 40% oil systems,
respectively (Figure 5.1).
For a practical use, a table of saltiness equivalence was created to demonstrate
concentrations of KCl and NaCl (only emulsions) systems needed to achieve similar saltiness
intensities of NaCl in water solutions (Table 5.4). This table was created using the linear regression
models established in Table 5.3 for solution and emulsion systems. For instance, to achieve a
saltiness intensity similar to 0.50% NaCl in solutions, it would require a concentration of 0.82%
KCl in solutions. In the same manner, to achieve a saltiness intensity similar to 1.00% NaCl in
solutions, it would require a concentration of 1.41% KCl in 40% oil emulsion systems. However,
considerations that KCl imparts bitterness and metallic aftertaste must be taken into account when
formulating a sodium-reduced product.
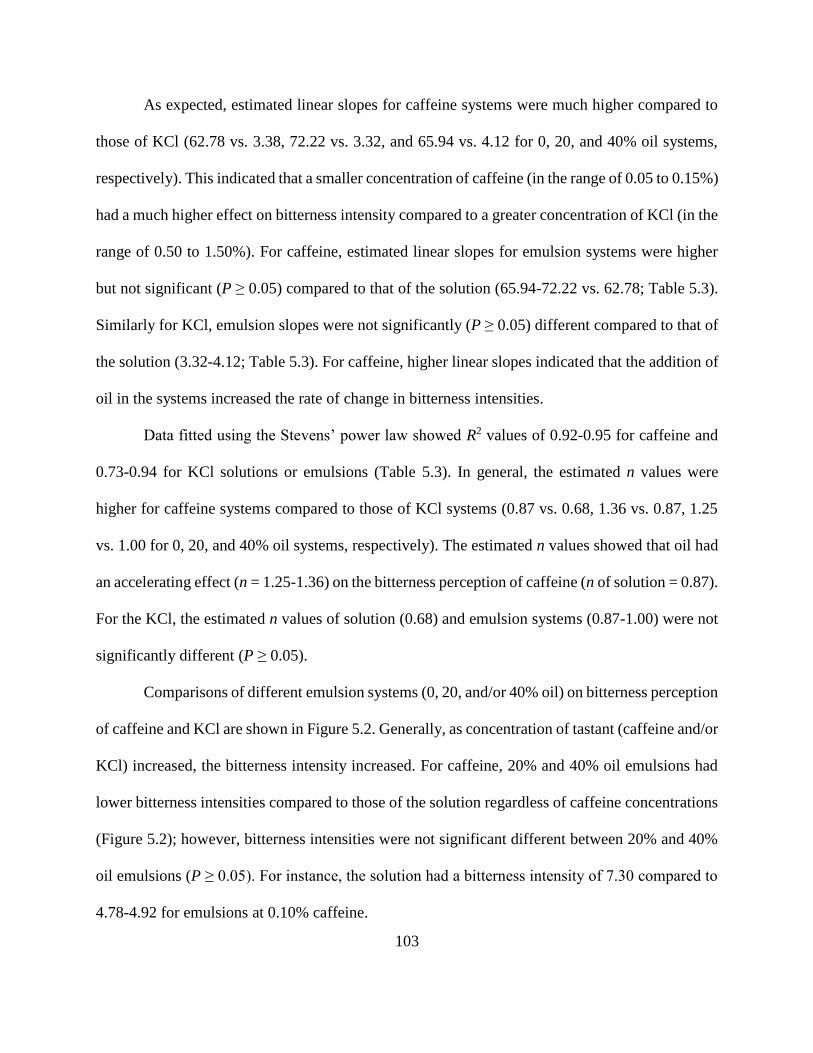
5.3.2 Bitterness Perception Using Descriptive Panel
The estimated parameters for bitterness intensity of caffeine or KCl in solutions and oil-in-
water emulsions (20 and/or 40% of oil) using a linear regression and the Stevens’ power law are
shown in Table 5.3. Data fitted using a linear regression showed R2 values of 0.92-0.94 for
caffeine, and 0.83-0.90 for KCl solutions and/or emulsions.
101
Figure 5.1 Effects of oil concentration on saltiness intensity* imparted by NaCl and KCl in oil-in-
water emulsions
*Values represent the means and standard deviations of two replicates. A total of (N=16) trained
panelists were used. Data points were fitted using a linear regression model: Intensity = Intercept
+ Slope (Concentration of tastant).
2468
10121416182022
0.50 0.63 0.75 0.88 1.00 1.13
Sa
ltin
es
s in
ten
sit
y s
co
re
Concentration of NaCl (%)
NaCl saltiness intensity
0% oil
20% oil
40% oil
2468
10121416182022
0.50 0.75 1.00 1.25 1.50 1.75
Sa
ltin
es
s in
ten
sit
y s
co
re
Concentration of KCl (%)
KCl saltiness intensity
0% oil
20% oil
40% oil
102
Table 5.4 Saltiness intensity equivalence between NaCl and KCl concentrations based on the SpectrumTM descriptive panel
*Means ± standard deviations of 3 measurements. a-d Means with different superscripts in a column indicate significant differences (P < 0.05) by Tukey's Studentized Range (HSD) test.
**Emulsions were prepared by using 0.5% of Durfax 60 emulsifier. EC = Emulsion capacity
***Homogenized at 9,400 psi. The other emulsions were nonhomogenized unless specified otherwise.
I, _________________________, agree to participate in the research entitled “Sensory Threshold analysis on Solution and Emulsion systems”, which is being conducted by Witoon Prinyawiwatkul, Professor of the Department of Food Science at Louisiana State University Agricultural Center, phone number (225)-578-5188. I understand that participation is entirely voluntary and whether or not I participate will not affect how I am treated on my job. I can withdraw my consent at any time without penalty or loss of benefits to which I am otherwise entitled and have the results of the participation returned to me, removed from the experimental records, or destroyed. 15 panelists will participate in this research. For this particular research, about 7-12 min. participation per session for a total of 19 sessions will be required for each subject. The following points have been explained to me: 1. In any case, it is my responsibility to report prior to participation to the investigators any allergies I may
have. 2. The reason for the research is to gather information on sensory thresholds of sodium chloride (NaCl),
caffeine, and/or potassium chloride (KCl). The benefit that I may expect from it is a satisfaction that I have contributed to solution and evaluation of problems relating to such examinations.
3. The procedures are as follows: Coded samples will be placed in front of me, and I will evaluate them by normal standard methods and indicate my evaluation on score sheets. All procedures are standard methods as published by the American Society for Testing and Materials.
4. Participation entails minimal risk: The only risk which can be envisioned is the allergic reaction toward NaCl (regular salt), caffeine, KCl, Canola oil, and/or emulsifier products. Individuals who have kidney problem should not participate in this study.
5. The results of this study will not be released in any individual identifiable form without my prior consent unless required by law.
6. The investigator will answer any further questions about the research, either now or during the course of the project.
The study has been discussed with me and all my questions have been answered. I understand that additional questions regarding the study should be directed to the investigator listed above. In addition, I understand that research at Louisiana State University AgCenter that involves human participation is carried out under the oversight of the Institutional Review Board for Human Research Subject Protection. Questions or problems regarding these activities should be addressed to Dr. Michael Keenan of LSU AgCenter at (225) 578-1708. I agree with the terms above and acknowledge. I have been given a copy of the consent form.
_________________________ ________________________________ Signature of Investigator Signature of Participant Witness: __________________ Date: ___________________________
127
b. Warm-up Session Questionnaire
Name: Date:
NOTE:
1) Take the whole sample into the mouth.
2) Swirl it for 2-3 seconds.
3) Expectorate and answer the question.
4) Rinse your mouth with water between samples.
Part I. Familiarizing with the tastes
Sample O no salty or bitter taste
Samples B and C salty taste (C is more saltier than B)
Samples D and E bitter taste (E is more bitter than D)
Samples F and G salty and bitter tastes (G is more salty and bitter than F)
Part II. Circle the taste(s) that you perceived
458 Sweet Salty Sour Bitter Unidentified No Taste
835 Sweet Salty Sour Bitter Unidentified No Taste
223 Sweet Salty Sour Bitter Unidentified No Taste
573 Sweet Salty Sour Bitter Unidentified No Taste
128
Part III. Identify tastes
Name: Date:
NOTE:
1) Take the whole sample into the mouth.
2) Swirl it for 2-3 seconds.
3) Expectorate and answer the question.
4) Rinse your mouth with water between samples.
Circle the taste(s) that you perceived
352 Sweet Salty Sour Bitter Unidentified No Taste
725 Sweet Salty Sour Bitter Unidentified No Taste
443 Sweet Salty Sour Bitter Unidentified No Taste
587 Sweet Salty Sour Bitter Unidentified No Taste
129
c. Threshold Evaluation Form
Name: Date:
SESSION 1 INSTRUCTION:
1) Taste the samples from left to right. Two samples are identical; one is different.
2) Circle the ODD/DIFFERENT sample.
3) Identify the taste(s) of the odd sample that exhibits recognizable difference, only if you
perceived.
Otherwise, circle “unidentified”.
NOTE: 1) Take the whole sample into the mouth.
2) Swirl it for 2-3 seconds.
3) Expectorate and answer the question.
4) Rinse your mouth with water between samples.
Set Circle the odd sample Circle the taste(s) which exhibits
* Based on the pooled within group variances with P < 0.05 of Wilks’ Lambda from MANOVA. Bolded and italicized values indicate
attributes largely contributing to the overall differences among all treatments (NaCl, KCl and caffeine emulsions at different
concentrations). Can 1 and Can 2 refer to the pooled within canonical structure in the 1st and 2nd canonical discriminant functions,
respectively.
134
APPENDIX D: EFFECT OF OIL AND TASTANT CONCENTRATIONS ON
PERCEPTIONS OF SALTINESS AND BITTERNESS IN OIL-IN-WATER EMULSIONS
IN CHAPTER 4
a. Research Consent Form
I, _________________________, agree to participate in the research entitled “Sensory Evaluation of Solution and Emulsion Systems”, which is being conducted by Witoon Prinyawiwatkul, Professor of the Department of Food Science at Louisiana State University Agricultural Center, phone number (225)-578-5188.
I understand that participation is entirely voluntary and whether or not I participate will not affect how I am treated on my job. I can withdraw my consent at any time without penalty or loss of benefits to which I am otherwise entitled and have the results of the participation returned to me, removed from the experimental records, or destroyed. 15 panelists will participate in this research. For this particular research, about 15-20 min. participation per session will be required for each subject.
The following points have been explained to me:
7. In any case, it is my responsibility to report prior to participation to the investigators any allergies I may have.
8. The reason for the research is to gather information on sensory thresholds of sodium chloride (NaCl), caffeine, and/or potassium chloride (KCl). The benefit that I may expect from it is a satisfaction that I have contributed to solution and evaluation of problems relating to such examinations.
9. The procedures are as follows: Coded samples will be placed in front of me, and I will evaluate them by normal standard methods and indicate my evaluation on score sheets. All procedures are standard methods as published by the American Society for Testing and Materials.
10. Participation entails minimal risk: The only risk which can be envisioned is the allergic reaction toward NaCl (regular salt), caffeine, KCl, Canola/Olive oil, and/or emulsifier products. Individuals who have kidney problem should not participate in this study.
11. The results of this study will not be released in any individual identifiable form without my prior consent unless required by law.
12. The investigator will answer any further questions about the research, either now or during the course of the project.
The study has been discussed with me and all my questions have been answered. I understand that additional questions regarding the study should be directed to the investigator listed above. In addition, I understand that research at Louisiana State University AgCenter that involves human participation is carried out under the oversight of the Institutional Review Board for Human Research Subject Protection. Questions or problems regarding these activities should be addressed to Dr. Michael Keenan of LSU AgCenter at (225) 578-1708. I agree with the terms above and acknowledge. I have been given a copy of the consent form.
4) You will be presented with 6 labeled samples (samples 1 to 6).
5) Please taste the sample starting with sample 1.
6) Identify the taste(s) of the sample, only if you perceived, and circle the taste that the
sample exhibits (you can check more than one taste).
Otherwise, circle “unidentified”.
NOTE: 5) Take the whole sample into the mouth.
6) Swirl it for 2-3 seconds.
7) Expectorate and answer the question.
8) Rinse your mouth with water between samples.
Sample Circle the taste(s) that the sample Remarks
1 Sweet – Salty – Sour – Bitter - Unidentified
2 Sweet – Salty – Sour – Bitter - Unidentified
3 Sweet – Salty – Sour – Bitter - Unidentified
4 Sweet – Salty – Sour – Bitter - Unidentified
5 Sweet – Salty – Sour – Bitter - Unidentified
6 Sweet – Salty – Sour – Bitter - Unidentified
136
Name: Date:
PART 2 INSTRUCTION:
1) You will be presented with 3 sets of 2 labeled samples in a random order.
2) Please taste the sample in the order presented, from left to right.
3) Rank samples for intensity. No ties allowed!
Set 1
- Rank the solutions in a descending order of saltiness
>
Saltier Less salty
Set 2
- Rank the solutions in a descending order of bitterness
>
More bitter Less bitter
Set 3
- Rank the solutions in a descending order of saltiness
>
Saltier Less salty
- Rank the solutions in a descending order of bitterness
>
More bitter Less bitter
137
c. Orientation Session Presentation
138
d. Training Sessions Forms
TRAINING SESSION 1
Name: Date:
Saltiness intensity evaluation INSTRUCTIONS:
1. Taste each reference sample: From Ref 1 to Ref 4 (Do not reverse the sequence) 2. Each reference represents an intensity value on the 22-cm scale. Associate this value with your perceived
intensity 3. Taste the unknown sample 4. Rate the intensity of unknown sample on the 22-cm scale
1. Taste each reference sample: From Ref 1 to Ref 3 (Do not reverse the sequence)
2. Each reference represents an intensity value on the 15-cm scale. Associate this value with your perceived intensity
3. Taste the unknown sample 4. Rate the intensity of unknown sample on the 15-cm scale
Sample 357
Sample 564
3
3
140
e. Samples Evaluation Forms
EVALUATION SESSION 1
Name: Date:
Saltiness intensity evaluation INSTRUCTIONS:
5. Taste each reference sample: From Ref 1 to Ref 4 (Do not reverse the sequence) 6. Each reference represents an intensity value on the 22-cm scale. Associate this value with your perceived
intensity 7. Taste the unknown sample 8. Rate the intensity of unknown sample on the 22-cm scale