24
Sentiment-Based Commercial Real Estate Forecasting with Google Search Volume Data Marian Alexander Dietzel | Nicole Braun | Wolfgang Schaefers ERES Conference Bucharest 2014
| Date post: | 11-Dec-2015 |
| Category: |
Documents |
| Upload: | anita-blacknall |
| View: | 217 times |
| Download: | 1 times |

Sentiment-Based Commercial Real Estate Forecasting with Google Search Volume DataMarian Alexander Dietzel | Nicole Braun | Wolfgang SchaefersERES Conference Bucharest 2014

2
Textmasterformate durch Klicken bearbeitenSentiment-Based Commercial Real Estate Forecasting with Google Search Volume Data
AGENDA
1. Motivation and Theoretical Background
2. Research Design and Methodology
2.1. Data
2.2. Models
4. Empirical Results
5. Conclusion

3
Textmasterformate durch Klicken bearbeiten
Beracha, E. and Wintoki, J. (2012), “Predicting Future Home Price Changes Using Current Google Search Data,” Journal of Real Estate Research, forthcoming.
Hohenstatt, R., Käsbauer, M. and Schäfers, W. (2011), “’Geco’ and its Potential for Real Estate Research: Evidence from the U.S. Housing Market”, Journal of Real Estate Research, Vol. 33 No. 4., pp. 471-506.
Hohenstatt, R. and Käsbauer, M. (2013), “GECO’s Weather Forecast’ for the U.K. Housing Market: To What Extent Can We Rely on Google ECOnometrics?”, Journal of Real Estate Research, forthcoming.
Wu, L. and Brynjolfsson, E. (2009), “The Future of Prediction: How Google Searches Foreshadow Housing Prices and Sales”, Working papers, Wharton School, University of Pennsylvania
Housing Market Predictions with Google Trends Data
Motivation and Theoretical Background
All studies find empirical evidence that Google Trends data have predictive power and improve the forecast accuracy for housing markets (USA and UK).

4
Textmasterformate durch Klicken bearbeiten
Motivation and Theoretical Background
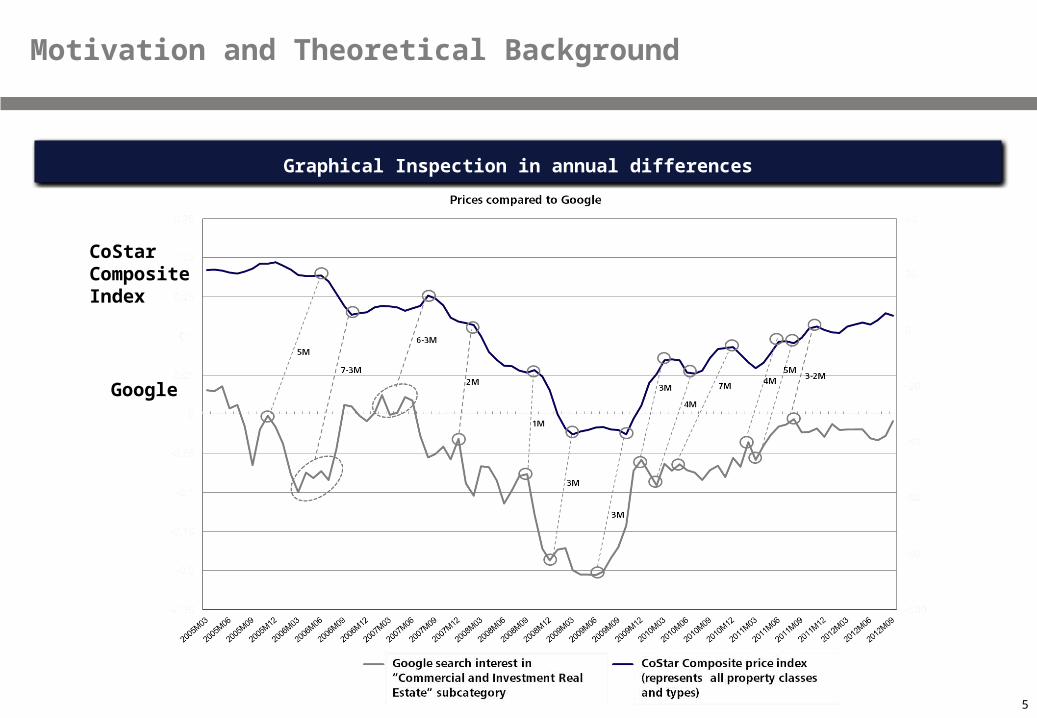
Can Google Trends data also improve Commercial Real Estate Market Forecasts?
Research Question
5
Textmasterformate durch Klicken bearbeitenGraphical Inspection in annual differences
Motivation and Theoretical Background
CoStar Composite Index

6
Textmasterformate durch Klicken bearbeitenGraphical Inspection in annual differences
Motivation and Theoretical Background
CoStar Composite transactions
7
Textmasterformate durch Klicken bearbeiten
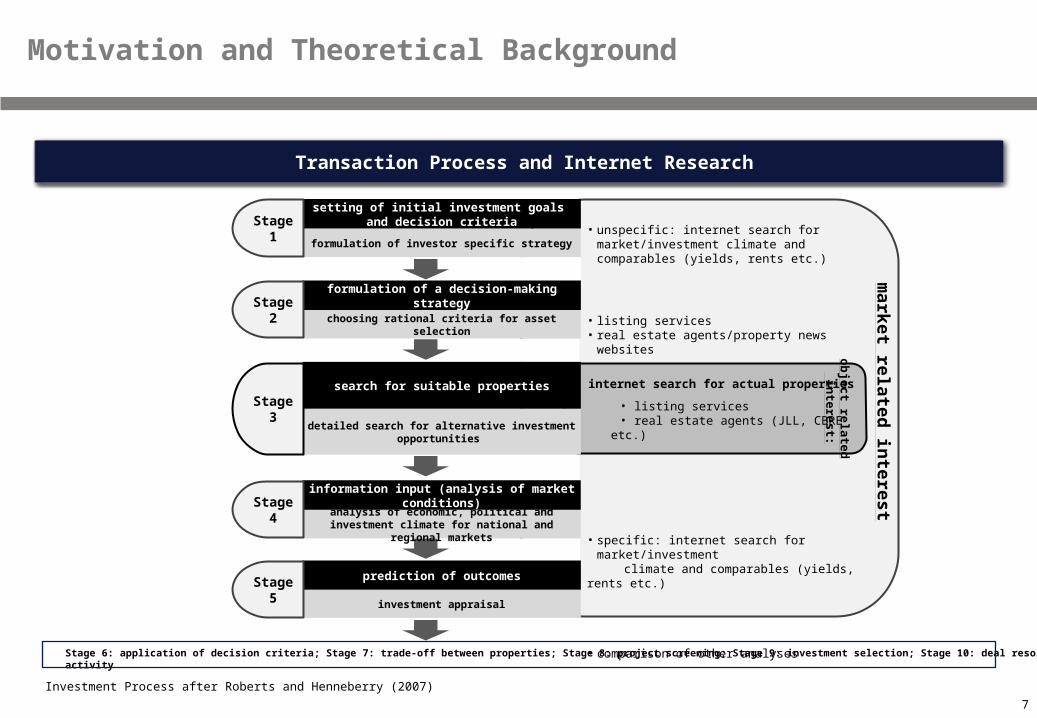
• unspecific: internet search for market/investment climate and comparables (yields, rents etc.)
• listing services • real estate agents/property news websites
• specific: internet search for market/investment
climate and comparables (yields, rents etc.)
• comparison of other analyses
internet search for actual properties
• listing services • real estate agents (JLL, CBRE etc.)
setting of initial investment goals and decision criteria
formulation of investor specific strategy
Stage 1
formulation of a decision-making strategy
choosing rational criteria for asset selection
Stage 2
search for suitable properties
detailed search for alternative investment opportunities
Stage 3
prediction of outcomes
investment appraisal
Stage 5
information input (analysis of market conditions)
analysis of economic, political and investment climate for national and regional
markets
Stage 4
market related
interest
ob
jec
t rela
ted
inte
res
t:
Stage 6: application of decision criteria; Stage 7: trade-off between properties; Stage 8: project screening; Stage 9: investment selection; Stage 10: deal resolution and post investment activity
Transaction Process and Internet Research
Motivation and Theoretical Background
Investment Process after Roberts and Henneberry (2007)

8
Textmasterformate durch Klicken bearbeitenGoogle Data
Research Design and Methodology
Search Volume Indices (SVI) derived from Google Trends (http://www.google.com/trends/)
Normalized values, scaled measured between 0 and 100
The weekly data covers search queries conducted from Sunday to Saturday.
Google Trends makes the newest weekly data available with an approximate two day delay.
9
Textmasterformate durch Klicken bearbeitenMacro Data
Research Design and Methodology
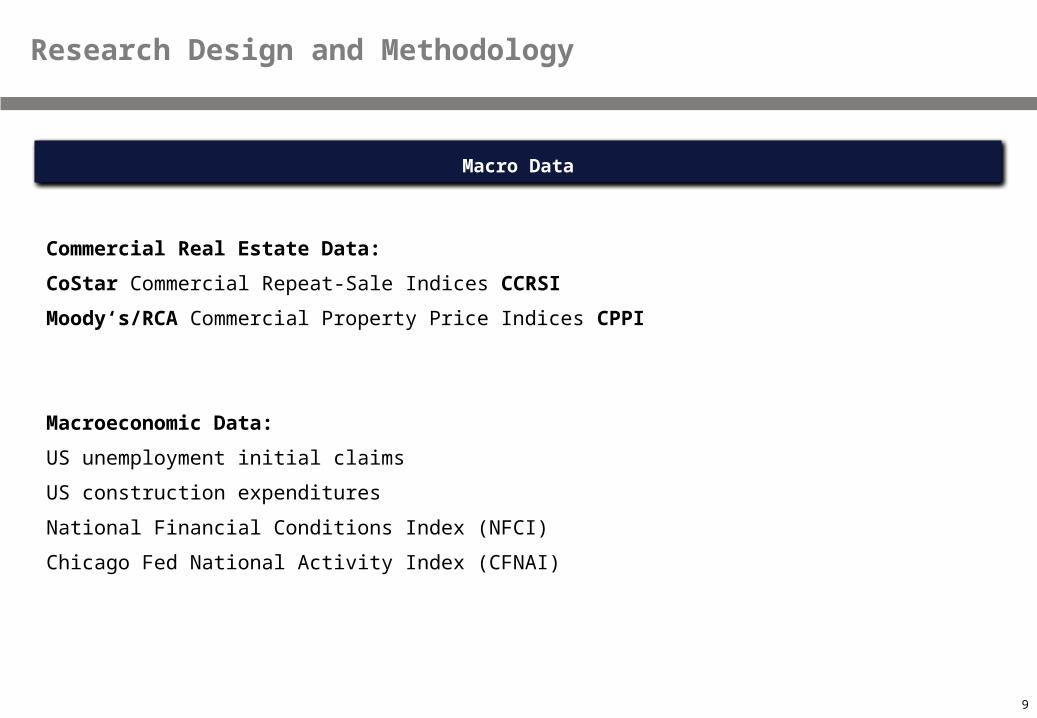
Commercial Real Estate Data:
CoStar Commercial Repeat-Sale Indices CCRSI
Moody‘s/RCA Commercial Property Price Indices CPPI
Macroeconomic Data:
US unemployment initial claims
US construction expenditures
National Financial Conditions Index (NFCI)
Chicago Fed National Activity Index (CFNAI)
10
Textmasterformate durch Klicken bearbeiten
Google Index Search Interest Search Terms
general interest
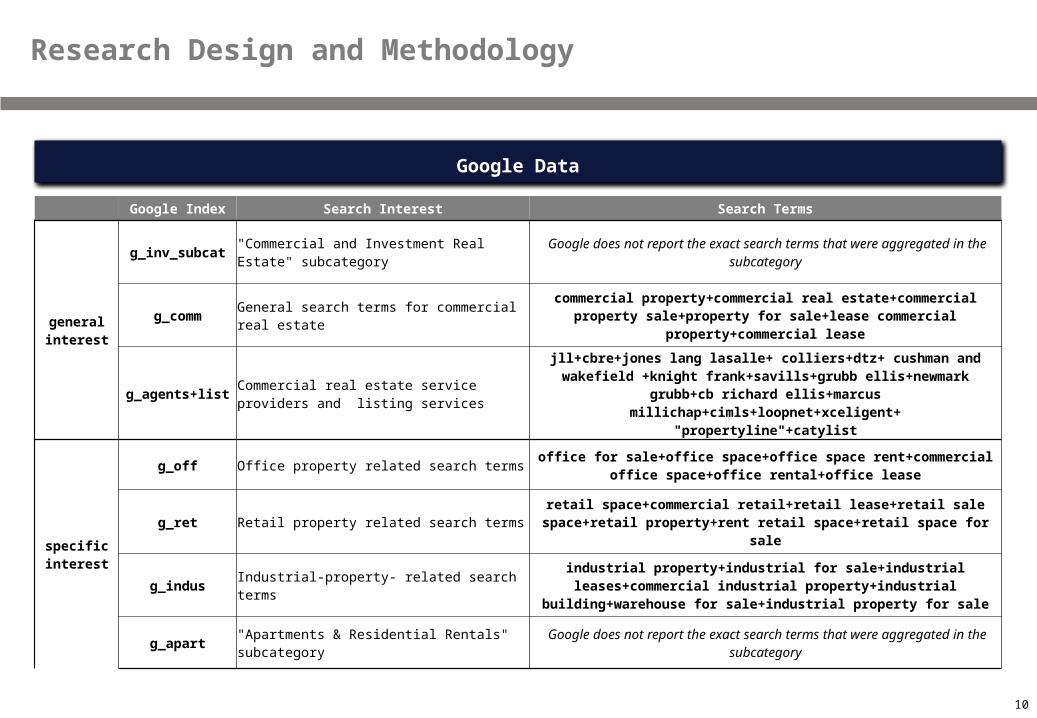
g_inv_subcat"Commercial and Investment Real Estate" subcategory
Google does not report the exact search terms that were aggregated in the subcategory
g_commGeneral search terms for commercial real estate
commercial property+commercial real estate+commercial property sale+property for sale+lease commercial
property+commercial lease
g_agents+listCommercial real estate service providers and listing services
jll+cbre+jones lang lasalle+ colliers+dtz+ cushman and wakefield +knight frank+savills+grubb ellis+newmark
grubb+cb richard ellis+marcus millichap+cimls+loopnet+xceligent+
"propertyline"+catylist
specific interest
g_off Office property related search termsoffice for sale+office space+office space rent+commercial
office space+office rental+office lease
g_ret Retail property related search termsretail space+commercial retail+retail lease+retail sale
space+retail property+rent retail space+retail space for sale
g_indus Industrial-property- related search termsindustrial property+industrial for sale+industrial leases+commercial industrial property+industrial
building+warehouse for sale+industrial property for sale
g_apart "Apartments & Residential Rentals" subcategory
Google does not report the exact search terms that were aggregated in the subcategory
Google Data
Research Design and Methodology

11
Textmasterformate durch Klicken bearbeitenModels
Research Design and Methodology
model forecasted variable independent variables
Macro Data Transactions Google Data
Prices
baselineb1 Prices x
b2 Prices x x
googleg1 Prices x
g2 Prices x x x
Macro Data Prices Google Data
Transactio
ns
baselineb1 Transactions x
b2 Transactions x x
googleg1 Transactions x
g2 Transactions x x x
12
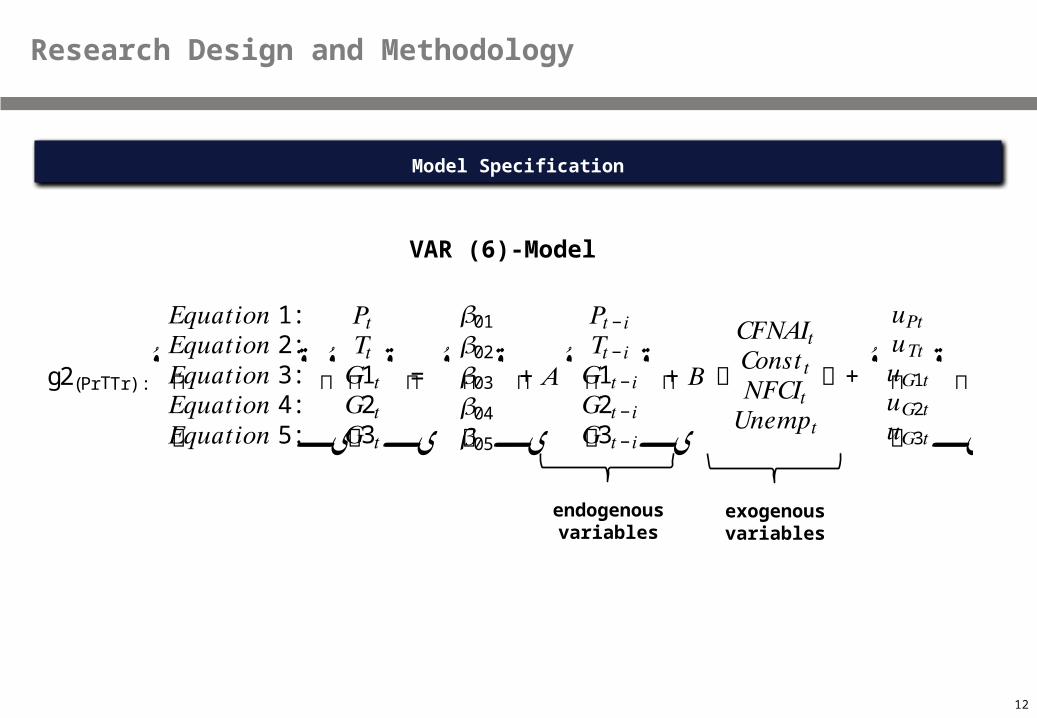
Textmasterformate durch Klicken bearbeitenModel Specification
Research Design and Methodology
g2(Pr Tr) Τ :ۉ
ۈۇ
𝐸𝑞𝑢𝑎𝑡𝑖𝑜𝑛 1:𝐸𝑞𝑢𝑎𝑡𝑖𝑜𝑛 2:𝐸𝑞𝑢𝑎𝑡𝑖𝑜𝑛 3:𝐸𝑞𝑢𝑎𝑡𝑖𝑜𝑛 4:𝐸𝑞𝑢𝑎𝑡𝑖𝑜𝑛 5: ی
ۋ ۊ
ۉ
ۈۇ
𝑃𝑡𝑇𝑡𝐺1𝑡𝐺2𝑡𝐺3𝑡 ی
ۋ =ۊ
ۉ
ۈۇ
𝛽01𝛽02𝛽03𝛽04𝛽05 ی
ۋ+ۊ 𝐴
ۉ
ۈۇ
𝑃𝑡−𝑖𝑇𝑡−𝑖𝐺1𝑡−𝑖𝐺2𝑡−𝑖𝐺3𝑡−𝑖 ی
ۋ+ۊ 𝐵 ൮𝐶𝐹𝑁𝐴𝐼𝑡𝐶𝑜𝑛𝑠𝑡𝑡𝑁𝐹𝐶𝐼𝑡𝑈𝑛𝑒𝑚𝑝𝑡
൲+ۉ
ۈۇ
𝑢𝑃𝑡𝑢𝑇𝑡𝑢𝐺1𝑡𝑢𝐺2𝑡𝑢𝐺3𝑡 ی
ۋ ۊ
VAR (6)-Model
endogenous variables
exogenous
variables

13
Textmasterformate durch Klicken bearbeitenPrice Forecasts
Empirical Results
Dependent Variable MacroTransactions
/ Prices Google Adj. R² MSEMSE
Reduction * U1 Theil *
b1 x 0.461 4.1108 -12% 0.062
b2 x x 0.473 3.6868 0% 0.059
g1 x 0.515 2.7364 26% 0.051
g2 x x x 0.484 2.4670 33% 0.048
b1 x 0.498 3.7666 -15% 0.059
b2 x x 0.526 3.2691 0% 0.055
g1 x 0.568 2.3054 29% 0.046
g2 x x x 0.561 1.9800 39% 0.043
b1 x 0.538 10.8856 -13% 0.080
b2 x x 0.559 9.5989 0% 0.076
g1 x 0.641 6.1344 36% 0.060
g2 x x x 0.665 4.4380 54% 0.052
co_inv
baseline
co_comp
baseline
co_gen
baseline
Prices
* The reduction of the MSE and U1 Theil is always measured in relation to the best baseline model (usually b2). A positive value stands for an improvement in forecasting accuracy in comparison to the baseline model.

14
Textmasterformate durch Klicken bearbeitenTransaction Forecasts
Empirical Results
Dependent Variable MacroTransactions
/ Prices Google Adj. R² MSEMSE
Reduction * U1 Theil *
b1 x 0.276 0.0024 -31% 0.210
b2 x x 0.392 0.0018 0% 0.188
g1 x 0.386 0.0016 10% 0.170
g2 x x x 0.448 0.0013 29% 0.155
b1 x 0.304 0.0021 -23% 0.177
b2 x x 0.386 0.0017 0% 0.164
g1 x 0.421 0.0014 16% 0.143
g2 x x x 0.474 0.0011 33% 0.132
b1 x 0.343 0.0074 -4% 0.191
b2 x x 0.306 0.0072 0% 0.188
g1 x 0.451 0.0052 28% 0.155
g2 x x x 0.466 0.0047 35% 0.149
co_inv
baseline
co_comp
baseline
co_gen
baseline
Transactions
* The reduction of the MSE and U1 Theil is always measured in relation to the best baseline model (usually b2). A positive value stands for an improvement in forecasting accuracy in comparison to the baseline model.

15
Textmasterformate durch Klicken bearbeitenRobustness across Real Estate Sectors
Robustness Check
Dependent Variable MacroTransactions
/ Prices Google Adj. R² MSEMSE
Reduction * U1 Theil *
b1 x 0.852 2.5167 -23% 0.027
b2 x x 0.844 2.0522 0% 0.025
g1 x 0.880 1.9803 4% 0.024
g2 x x x 0.864 1.3859 32% 0.020
b1 x 0.204 8.7869 -31% 0.071
b2 x x 0.314 6.7246 0% 0.062
g1 x 0.196 7.2237 -7% 0.065
g2 x x x 0.380 4.5788 32% 0.051
b1 x 0.766 1.1233 -34% 0.028
b2 x x 0.796 0.8397 0% 0.024
g1 x 0.754 0.9747 -16% 0.026
g2 x x x 0.816 0.6001 29% 0.020
b1 x 0.891 0.9711 -16% 0.019
b2 x x 0.894 0.8375 0% 0.018
g1 x 0.902 0.7271 13% 0.016
g2 x x x 0.914 0.4731 44% 0.013
mo_indus
baseline
multifamily mo_apart
baseline
office
industrial
retail mo_ret
baseline
mo_off
baseline
Prices
* The reduction of the MSE and U1 Theil is always measured in relation to the best baseline model (usually b2). A positive value stands for an improvement in forecasting accuracy in comparison to the baseline model.

16
Textmasterformate durch Klicken bearbeitenRobustness across Real Estate Sectors
Robustness Check
Dependent Variable MacroTransactions
/ Prices Google Adj. R² MSEMSE
Reduction * U1 Theil *
b1 x 0,290 0,0242 -17% 0,287
b2 x x 0,340 0,0206 0% 0,260
g1 x 0,304 0,0188 9% 0,246
g2 x x x 0,387 0,0152 26% 0,220
b1 x 0,355 0,0365 -23% 0,378
b2 x x 0,408 0,0296 0% 0,335
g1 x 0,424 0,0265 10% 0,305
g2 x x x 0,451 0,0223 25% 0,279
b1 x 0,357 0,0253 -20% 0,313
b2 x x 0,407 0,0211 0% 0,277
g1 x 0,368 0,0202 4% 0,267
g2 x x x 0,416 0,0168 20% 0,242
b1 x 0,397 0,0071 -25% 0,188
b2 x x 0,452 0,0057 0% 0,165
g1 x 0,456 0,0048 16% 0,151
g2 x x x 0,485 0,0040 31% 0,136
Transactions
baseline
office
industrial
retail mo_ret
baseline
mo_off
mo_indus
baseline
multifamily mo_apart
baseline
* The reduction of the MSE and U1 Theil is always measured in relation to the best baseline model (usually b2). A positive value stands for an improvement in forecasting accuracy in comparison to the baseline model.
17
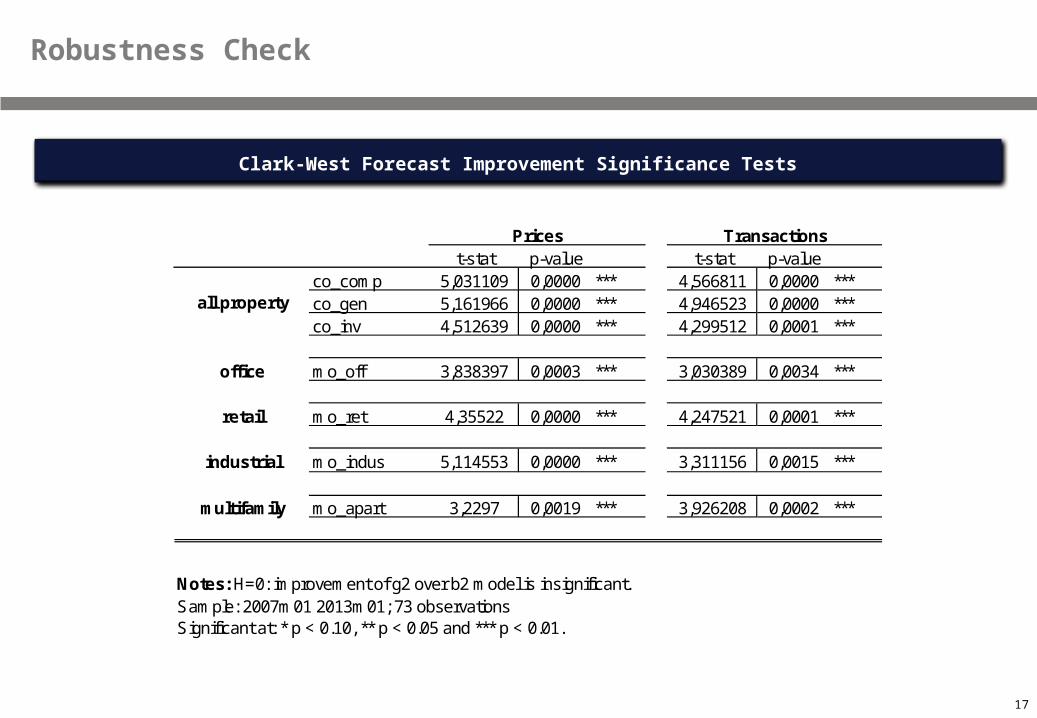
Textmasterformate durch Klicken bearbeitenClark-West Forecast Improvement Significance Tests
Robustness Check
t-stat p-value t-stat p-valueco_comp 5,031109 0,0000 *** 4,566811 0,0000 ***co_gen 5,161966 0,0000 *** 4,946523 0,0000 ***co_inv 4,512639 0,0000 *** 4,299512 0,0001 ***
office mo_off 3,838397 0,0003 *** 3,030389 0,0034 ***
retail mo_ret 4,35522 0,0000 *** 4,247521 0,0001 ***
industrial mo_indus 5,114553 0,0000 *** 3,311156 0,0015 ***
multifamily mo_apart 3,2297 0,0019 *** 3,926208 0,0002 ***
Notes: H=0: improvement of g2 over b2 model is insignificant. Sample: 2007m01 2013m01; 73 observationsSignificant at: * p < 0.10, ** p < 0.05 and *** p < 0.01.
all property
Prices Transactions
18
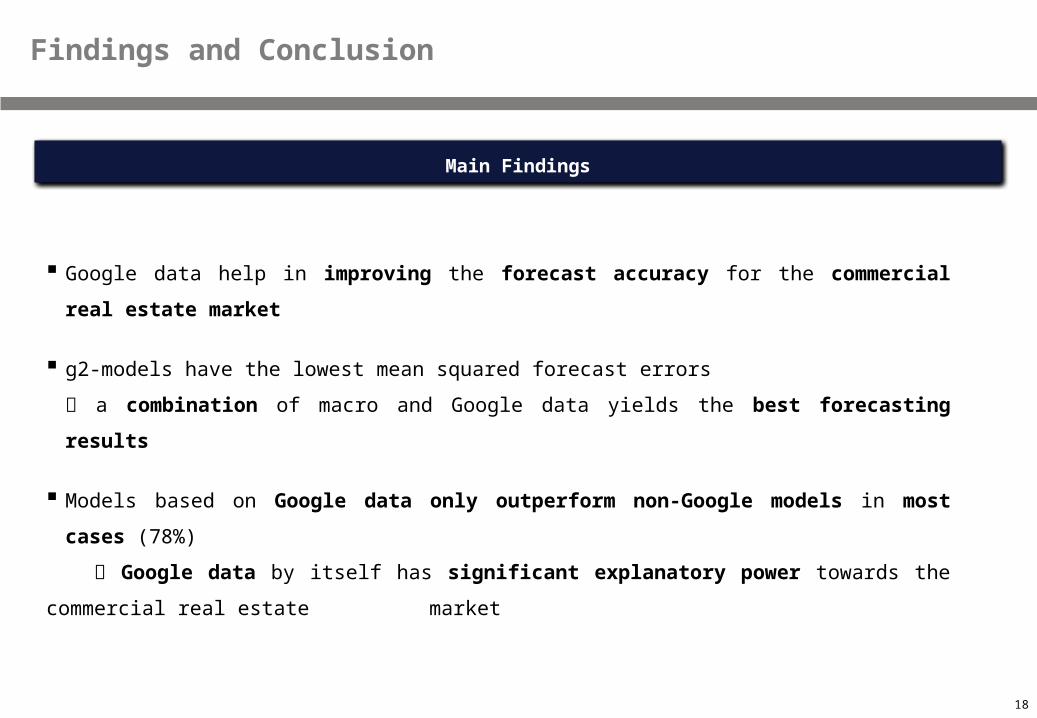
Textmasterformate durch Klicken bearbeitenMain Findings
Findings and Conclusion
Google data help in improving the forecast accuracy for the commercial real
estate market
g2-models have the lowest mean squared forecast errors
a combination of macro and Google data yields the best forecasting results
Models based on Google data only outperform non-Google models in most cases
(78%)
Google data by itself has significant explanatory power towards the
commercial real estate market

19
Textmasterformate durch Klicken bearbeitenSentiment-Based Commercial Real Estate Forecasting with Google Search Volume Data
Questions
Thank you for your attention!
Questions?
20
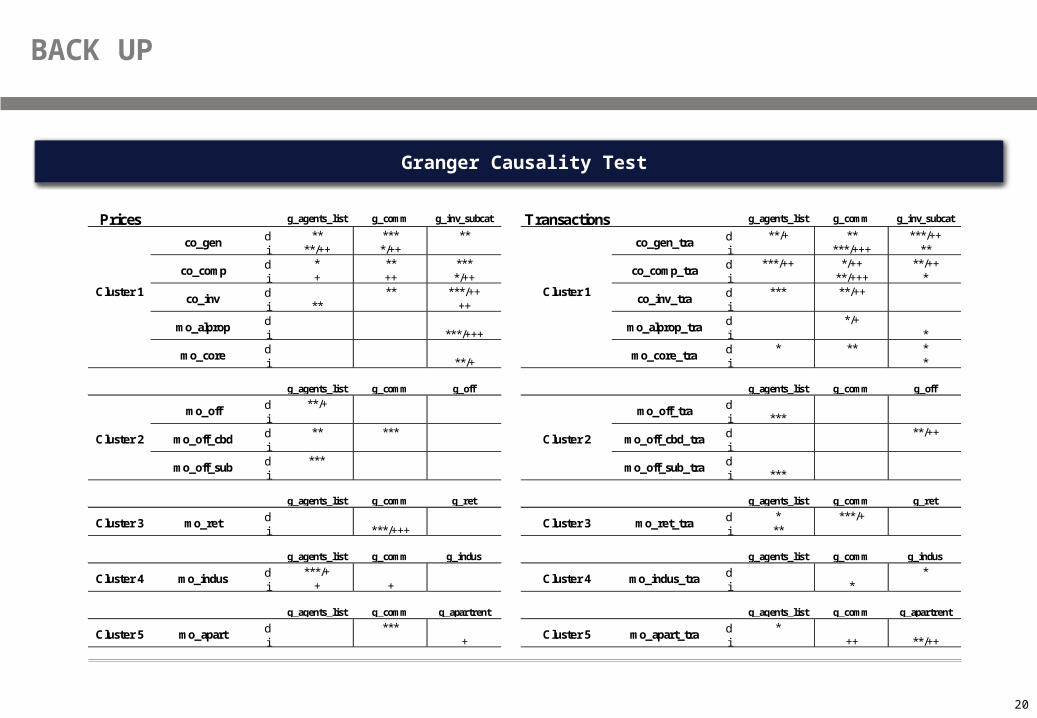
Textmasterformate durch Klicken bearbeitenGranger Causality Test
Prices g_agents_list g_comm g_inv_subcat Transactions g_agents_list g_comm g_inv_subcat
d ** *** ** d **/+ ** ***/++i **/++ */++ i ***/+++ **d * ** *** d ***/++ */++ **/++i + ++ */++ i **/+++ *d ** ***/++ d *** **/++i ** ++ id d */+i ***/+++ i *d d * ** *i **/+ i *
g_agents_list g_comm g_off g_agents_list g_comm g_off
d **/+ di i ***d ** *** d **/++i id *** di i ***
g_agents_list g_comm g_ret g_agents_list g_comm g_ret
d d * ***/+i ***/+++ i **
g_agents_list g_comm g_indus g_agents_list g_comm g_indus
d ***/+ d *i + + i *
g_agents_list g_comm g_apartrent g_agents_list g_comm g_apartrent
d *** d *i + i ++ **/++
Cluster 5 mo_apart Cluster 5 mo_apart_tra
Cluster 3 mo_ret Cluster 3 mo_ret_tra
Cluster 4 mo_indus Cluster 4 mo_indus_tra
Cluster 1
co_gen
Cluster 1
co_gen_tra
co_comp co_comp_tra
co_inv co_inv_tra
mo_alprop mo_alprop_tra
mo_core mo_core_tra
mo_off_cbd mo_off_cbd_tra
mo_off_sub mo_off_sub_tra
Cluster 2 Cluster 2
mo_off mo_off_tra
BACK UP

21
Textmasterformate durch Klicken bearbeiten
Prices RE Indices Transactions RE Indices
g_agents_list g_comm g_inv_subcat g_agents_list g_comm g_inv_subcatco_gen 7 7 7 co_gen_tra 4 5 3co_comp 7 7 7 co_comp_tra 4 4 3co_inv 7 7 7 co_inv_tra 4 3 2mo_alprop 5 6 5 mo_alprop_tra 4 2 3mo_core 5 6 5 mo_core_tra 5 6 2
g_agents_list g_comm g_off g_agents_list g_comm g_offmo_off 6 6 6 mo_off_tra 4 3 2mo_off_cbd 7 6 6 mo_off_cbd_tra 2 1 2mo_off_sub 4 2 2 mo_off_sub_tra 3 2 2
g_agents_list g_comm g_ret g_agents_list g_comm g_retmo_ret 7 3 3 mo_ret_tra 3 3 8
g_agents_list g_comm g_indus g_agents_list g_comm g_indusmo_indus 2 7 5 mo_indus_tra 6 1 7
g_agents_list g_comm g_apartrent g_agents_list g_comm g_apartrentmo_apart 8 6 6 mo_apart_tra 5 2 6Cluster 5
Google SVI
Cluster 1
Cluster 2
Cluster 3
Cluster 4
Cluster 5
Cluster 4
Google SVI
Cluster 1
Cluster 2
Cluster 3
Lag Order
BACK UP

22
Textmasterformate durch Klicken bearbeitenClark-West Forecast Significance Test
BACK UP
Prices t-stat p-value Transaction
s t-stat p-value
Cluster 1
co_comp 5.031109 0.0000***
Cluster 1
co_comp_tra 4.566811 0.0000***co_gen 5.161966 0.0000*** co_gen_tra 4.946523 0.0000***co_inv 4.512639 0.0000*** co_inv_tra 4.299512 0.0001***
mo_alprop 3.453596 0.0009*** mo_alprop_tra 3.19397 0.0021***
mo_core 3.341429 0.0013*** mo_core_tra 2.690448 0.0089***
Cluster 2
mo_off 3.838397 0.0003***
Cluster 2
mo_off_tra 3.030389 0.0034***
mo_off_cbd 3.204947 0.0020*** mo_off_cbd_tra 3.181805 0.0022***
mo_off_sub 3.653564 0.0005*** mo_off_sub_tra 3.399589 0.0011***
Cluster 3 mo_ret 4.35522 0.0000*** Cluster 3 mo_ret_tra 4.247521 0.0001*** Cluster 4 mo_indus 5.114553 0.0000*** Cluster 4 mo_indus_tra 3.311156 0.0015*** Cluster 5 mo_apart 3.2297 0.0019*** Cluster 5 mo_apart_tra 3.926208 0.0002***
Notes: H=0: improvement of g2 over b2 model is insignificant. Sample: 2007m01 2013m01; 73 observationsSignificant at: * p < 0.10, ** p < 0.05 and *** p < 0.01.
23
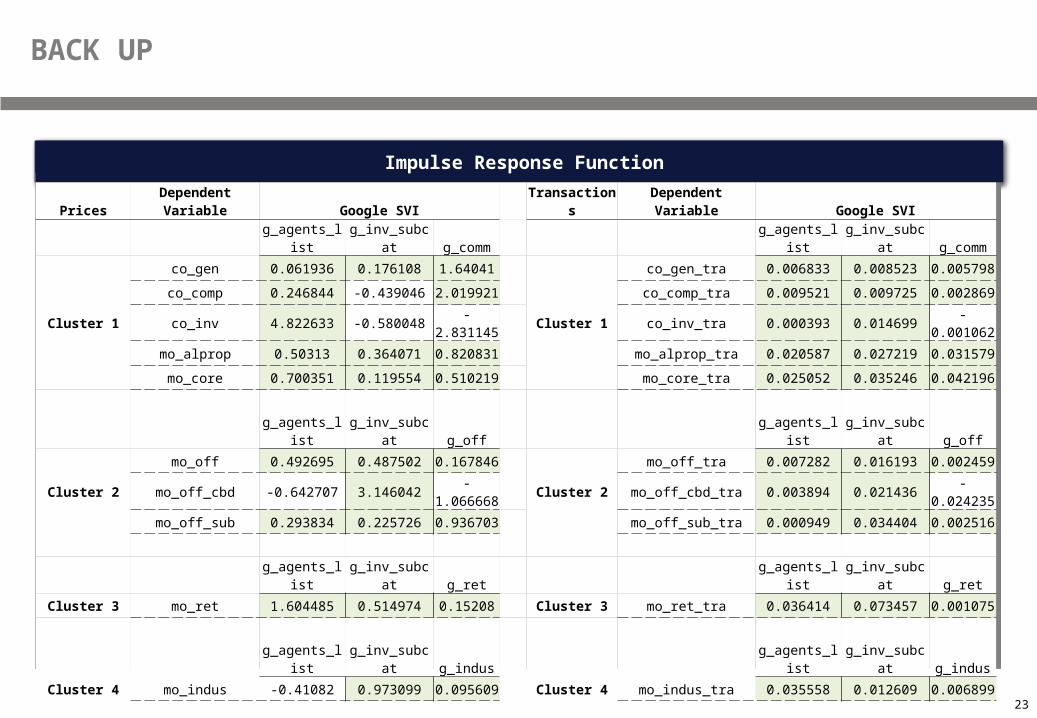
Textmasterformate durch Klicken bearbeitenImpulse Response Function
BACK UP
PricesDependent
Variable Google SVI Transaction
sDependent
Variable Google SVI
g_agents_lis
t g_inv_subcat g_comm g_agents_lis
t g_inv_subcat g_comm
Cluster 1
co_gen 0.061936 0.176108 1.64041
Cluster 1
co_gen_tra 0.006833 0.008523 0.005798
co_comp 0.246844 -0.439046 2.019921 co_comp_tra 0.009521 0.009725 0.002869
co_inv 4.822633 -0.580048-
2.831145 co_inv_tra 0.000393 0.014699-
0.001062
mo_alprop 0.50313 0.364071 0.820831 mo_alprop_tra 0.020587 0.027219 0.031579
mo_core 0.700351 0.119554 0.510219 mo_core_tra 0.025052 0.035246 0.042196
g_agents_list g_inv_subcat g_off
g_agents_list g_inv_subcat g_off
Cluster 2
mo_off 0.492695 0.487502 0.167846
Cluster 2
mo_off_tra 0.007282 0.016193 0.002459
mo_off_cbd -0.642707 3.146042-
1.066668 mo_off_cbd_tra 0.003894 0.021436-
0.024235
mo_off_sub 0.293834 0.225726 0.936703 mo_off_sub_tra 0.000949 0.034404 0.002516
g_agents_list g_inv_subcat g_ret
g_agents_list g_inv_subcat g_ret
Cluster 3 mo_ret 1.604485 0.514974 0.15208 Cluster 3 mo_ret_tra 0.036414 0.073457 0.001075
g_agents_list g_inv_subcat g_indus
g_agents_list g_inv_subcat g_indus
Cluster 4 mo_indus -0.41082 0.973099 0.095609 Cluster 4 mo_indus_tra 0.035558 0.012609 0.006899
g_agents_list g_inv_subcat
g_apartrent
g_agents_list g_inv_subcat
g_apartrent
Cluster 5 mo_apart 0.737968 0.408705-
0.052707 Cluster 5 mo_apart_tra 0.000585 0.010047-
0.012387

24
Textmasterformate durch Klicken bearbeitenMacro Data
Transactions
co_comp_tra Transactions underlying CoStar Composite CoStar
co_gen_tra Transactions underlying CoStar General Commercial CoStar
co_inv_tra Transactions underlying CoStar Investment Grade CoStar
mo_alprop_tra Transactions underlying Moody's/RCA Tier 1 National Moody's/RCA
mo_core_traTransactions underlying Moody's/RCA Tier 2 Core Commercial Moody's/RCA
mo_off_tra Transactions underlying Moody's/RCA Tier 4 Office Moody's/RCA
mo_off_cbd_tra Transactions underlying Moody's/RCA Tier 4 Office CBD Moody's/RCA
mo_off_sub_traTransactions underlying Moody's/RCA Tier 4 Office Suburban Markets Moody's/RCA
mo_ret_tra Transactions underlying Moody's/RCA Tier 4 Retail Moody's/RCA
mo_indus_tra Transactions underlying Moody's/RCA Tier 4 Industrial Moody's/RCA
mo_apart_tra Transactions underlying Moody's/RCA Tier 2 Apartment Moody's/RCA
Macro Data
mcr_const Construction Expenditures US Census Bureau
mcr_unempU.S Labor Department report of initial state jobless benefit claims
US Department of Labor
mcr_nfci National Financial Conditions Index (NFCI)**Federal Reserve Bank of Chicago
mcr_cfnai
Chicago Fed National Activity Index (CFNAI), a monthly index designed to gauge overall economic activity and related inflationary pressure ***
Federal Reserve Bank of Chicago
BACK UP


