Tank Characterization Report for Single-Shell Tank 241 -T-I 09
Todd M. Brown Westinghouse Hanford Company, Richland. WA 99352 U. S . Department o f Energy Contract DE-AC06-87RL10930
EDT/ECN: EDT-617544 UC: 2070 Org Code: 79400 Charge Code: N4G4D B&R Code: EW 3120074 Tota l Pages: ,/# Key Words: Tank Charac te r i za t i on Report. TCR. S ing le -She l l Tank. S i n g l e - S h e l l , SST, Tank 241-T-109, Tank T-109, T-109, T Farm
Abs t rac t : Th is document summarizes t h e i n fo rma t ion on t h e h i s t o r i c a l uses, present s t a t u s , and t h e sampling and ana lys i s r e s u l t s o f waste s to red i n Tank 241-T-109. Pa r t y Agreement Mi lestone M-44-09.
This r e p o r t supports t h e requirements o f T r i -
TRADEMARK DISCLAIMER. Reference here in t o any spec i f i c comnercial product, process, o r serv ice by t rade name, trademark, manufacturer, o r otheruise, does not necessar i ly cons t i t u te o r imply i t s endorsement, r e c m n d a t i o n , or favor ing by the United States G o v e r m n t o r any agency thereof or i t s cont ractors o r subcontractors.
P r in ted i n the Uni ted States o f America. To obta in copies o f t h i s d o c m n t , contact: YHC/BCS Document Control Services, P.O. Box 1970, Maits top H6-08, Richland UA 99352, Phone ( 5 0 9 ) 372-2420; Fax ( 5 0 9 ) 376-4989.
Approved for Public Release
A-6400-073 ( 1 0 / 9 5 ) GEF321
WHC-SD-WM-ER-559, Rev. 0
UC-2070
Tank Characterization Report for Single-Shell Tank 241 -T-l09
T. M. Brown L. M. Sasaki R. D. Crornar Westinghouse Hanford Company
N. G. Colton Pacific Northwest National Laboratory
J. L. Stroup ICF Kaiser Engineers Hanford
J. D. Franklin
L. J. Fergestrorn
Los Alamos Technical Associates
Technical Resources International, Inc.
Date Published
September 1996
Prepared for the US. De artment of Energy Assistant Secretary for Ehronmental Management
Westinghouse P.O BOX 1970 0 Hanford Company Richland. Washington
Management and Operations Contractor for the US. Department of Energy under Contract DE-AC06-87RL10930
Approved for public release; distribution is unlimited
ASTM BL BNW Btulhr Ci CiIL CI cm DOE DQO DSC EB Ecology FIC ft g glL glmL HDW HTCE IC ICP in. IX
Pglg
Jk kg
kgal kglL
kL kW L LANL LEL LL m M
LIST OF TERMS
first cycle decontamination waste microcuries per gram microcuries per gallon microgram micrograms per gram American Society for Testing and Materials B Plant low-level waste Battelle Northwest waste British thermal units per hour curies curies per liter confidence interval centimeter U. S. Department of Energy data quality objectives differential scanning calorimetry evaporator bottoms Washington State Department of Ecology Food Instrument Corporation feet gram grams per liter grams per milliliter Hanford defined waste historical tank content estimate ion chromatography inductively coupled plasma spectroscopy inch ion exchange waste joules per gram kilogram kilograms per liter kilogallon kiloliter kilowatt liter Los Alamos National Laboratory lower explosive limit lower limit meter moles per liter
viii
WHC-SD-WM-ER-559 Rev. 0
mm mradlhr MT PPm SAP SST TlSltCk TBP TCP TCR TGA TIC TLM TOC TWRS UL UR W WSTRS wt%
LIST OF TERMS (Continued)
millimeter millirads per hour metric ton parts per million sampling and analysis plan single-shell tank 242-T Evaporator saltcake waste, 1951-55 tributyl phosphate tank characterization plan tank characterization report thermogravimetric analysis total inorganic carbon tank layer model total organic carbon Tank Waste Remediation System upper limit uranium recovery waste watts waste status and transaction record summary weight percent
ix
WHC-SD-WM-ER-559 Rev. 0
This page intentionally left blank.
X
WHC-SD-WM-ER-559 Rev. 0
1.0 INTRODUCTION
One of the major functions of the Tank Waste Remediation System (TWRS) is to characterize wastes in support of waste management and disposal activities at the Hanford Site. Analytical data from sampling and analysis, along with other available information about a tank, are compiled and maintained in a tank characterization report (TCR). This report and its appendices serve as the TCR for single-shell tank 241-T-109. The objectives of this report are: 1) to use characterization data in response to technical issues associated with 241-T-109 waste; and 2) to provide a standard characterization of this waste in terms of a best-basis inventory estimate. The response to technical issues is summarized in Section 2.0, and the best-basis inventory estimate is presented in Section 3.0. Recommendations regarding safety status and additional sampling needs are provided in Section 4.0. Supporting data and information are contained in the appendices. This report also supports the requirements of the Hanford Federal Facility Agreement and Consenr Order (Ecology et al. 1996) milestone M-44-09.
1.1 SCOPE
Characterization information presented in this report originated from sample analyses and known existing (historical) sources. While only the results of recent sample events will be used to fulfill the requirements of the data quality objectives (DQOs), other information can be used to support (or question) conclusions derived from these results. Historical information for tank 241-T-109, provided in Appendix A, included surveillance information, records pertaining to waste transfers and tank operations, and expected tank contents derived from a process knowledge model.
The recent sampling events listed in Table 1-1, as well as sample data obtained prior to 1989, are summarized in Appendix B along with the sampling results. The results of the 1995 sampling events, also reported in the laboratory data package (Conner 1995a), satisfied the data requirements specified in the tank characterization plan (TCP) for this tank (Conner 1995b). The statistical analysis and numerical manipulation of data used in issue resolution are reported in Appendix C. Appendix D contains the evaluation to establish the best basis for the inventory estimate and the statistical analysis performed for this evaluation. A bibliography that resulted from an in-depth literature search of all known information sources applicable to tank 241-T-109 and its respective waste types is contained in Appendix E. The reports listed in Appendix E may be found in the Tank Characterization Resource Center.
1-1
WHC-SD-WM-ER-559 Rev. 0
Table 1-1. Summary of Recent Sampling.
qtpptd- 1% h e 1 Location
Vapor sample I Gas I Tank headspace, (81 15/95) Riser 6, 6 m
(20 ft) below top of riser
95-AUG-040 1(8/18/95) I I Auger Solid Riser 2 95-AUG-041
I(8121195) I Vapor sample Gas Tank headspace, (519196) Riser 6, 6 m
(20 ft) below top of riser
nla
No segmentation
Divided sample in half (upper and lower)
nla
nla
Unknown (probably only top of waste)
Good recovery. Bottom 2.5 to 13 cm (1 to 5 in.) of the waste may not be represented.
nla
nla
67.5
232.5
nla
1.2 TANK BACKGROUND
Tank 241-T-109 is located in the 200 West Area T Tank Farm on the Hanford Site. It is the last tank in a three-tank cascade series. The tank went into service in 1945, receiving first cycle decontamination waste cascaded from tank 241-T-108. Supernate was transferred from the tank in 1951. During 1952 and 1953, uranium recovery waste was cascaded into tank 241-T-109. Supernate was transferred both into and out of the tank during 1953 and 1954, and in 1954, the tank received saltcake waste from the 242-T Evaporator. Additional supernate transfers into and out of the tank occurred from 1969 through 1976. The final transfer of waste occurred in 1983, when liquids were pumped from the tank in support of stabilization efforts.
A description of tank 241-T-109 is summarized in Table 1-2. The tank has an operating capacity of 2,010 kL, (530 kgal), and presently contains an estimated 220 kL, (58 kgal) of non-complexed waste (Hanlon 1996). The tank is not on the Watch List (Public Law 101-510).
1-2
WHC-SD-Wh4-ER-559 Rev. 0
Supernatant volume
Saltcake volume*
Sludge volume?
0 kL (0 kgal)
0 kL (0 kgal)
220 kL. (58 kgal)
Table 1-2. Descnption of Tank 241-T-109.
Diameter 22.9 m (75.0 ft)
Operating depth 5.2 m (17 ft)
I Capacity 2,010 kL (530 keal) I
I ~ o t a l waste volume' 220 kL (58 kgal)
Assumed leaker
Note: 'Waste volume is estimated from surface level measurements.
zAltbough Hanlon (1996) reports that the tank contains all sludge waste, it is evident fmm the transfer history (Agnew et al. 1996b) and the auger samples (Comer 199%) that the majority of the waste is probably saltcake.
1-3
WHC-SD-WM-ER-559 Rev. 0
This page intentionally left blank.
1-4
WHC-SD-WM-ER-559 Rev. 0
2.0 RESPONSE TO TECHNICAL ISSUES
Two technical issues have been identified for tank 241-T-109 (Brown et al. 1995). They are:
Does the waste pose or contribute to any recognized potential safety problems?
Is the waste inventory generated by a model based on process knowledge and historical information (Agnew et al. 1996b) representative of the current tank waste inventory?
The TCP (Conner 1995b) provides the types of sampling and analysis used to address the above issues. Data from the recent analysis of two auger samples and tank vapor space flammability measurements, as well as available historical information, provided the means to respond to these two issues. This response is detailed in the following sections. See Appendix B for sample and analysis data for tank 241-T-109.
2.1 SAFETY SCREENING
The data needed to screen the waste in tank 241-T-109 for potential safety problems is documented in Tank Sufety Screening Data Quality Objective, Rev. 2 (Dukelow et al. 1995). These potential safety problems are exothermic conditions in the waste; flammable gases in the waste and/or tank headspace; and criticality conditions in the waste. Each of these conditions is addressed separately below. Because tank 241-T-109 is not a Watch List tank, the safety screening DQO was the only safety-related DQO associated with the sampling effort.
2.1.1 Exothermic Conditions (Energetics)
The first requirement outlined in the safety screening DQO (Dukelow et al. 1995) is to ensure that there are not enough exothermic constituents (organic or ferrocyanide) in tank 241-T-109 to cause a safety hazard. Because of this requirement, energetics in the tank 241-T-109 waste were evaluated. The safety screening DQO required that the waste sample profile be tested for energetics every 24 cm (9.5 in.) to determine if the energetics exceed the safety threshold limit. The threshold limit for energetics is 480 Jlg on a dry weight basis. Results obtained using differential scanning calorimetry indicated that no exotherms were apparent for any of the three samples (95-AUG-40, 95-AUG-41 upper, and 95-AUG-41 lower) (Conner 1995a). Note that auger sample 95-AUG-40 was not subdivided into an upper and lower sample because of the low recovery. Thus, the requirement of testing energetics for every 24 cm (9.5 in.) of the sample profile was met only for one of the two samples.
2-1
WHC-SD-WM-ER-559 Rev. 0
Historically, there is no evidence that any exothermic agent should exist in this waste. Waste transfer records indicate that the major waste type expected to be in the tank is T1 saltcake, with a small possibility that some first-concentration-cycle waste from the bismuth phosphate process may be in the bottom of the tank (Agnew et al. 1996a). Neither of these waste types is expected to have organic or ferrocyanide constituents. Analysis of a sample taken in 1974 (Sant 1974) also showed no evidence of exotherms (see Appendix B).
2.1.2 Flammable Gas
Vapor phase measurements, taken in the tank headspace prior to the auger samples in August 1995 and again in May 1996, indicated that no flammable gas was detected (0 percent of the lower flammability limit). Data from these vapor phase measurements are presented in Appendix B.
2.1.3 Criticality
The safety threshold limit is 1 g 239Pu per liter of waste. Assuming that all alpha is from u9Pu and assuming a density of 1.55 g/mL, 1 g/L of activity. The auger samples were analyzed in accordance with an earlier revision of the safety screening DQO (Babad et al. 1995) which did not require density measurements. Because density was not measured, the density estimated by Agnew et al. (1996b) was used. Waste samples were tested for total alpha activity for each auger sample. Concentrations in all samples were well below this limit. Additionally, as required by the DQO, the upper limit of the one-sided 95 percent confidence interval for these results was less than 1 g/L. The method used to calculate confidence limits is contained in Appendix C.
2.2 HISTORICAL EVALUATION
is equivalent to 40 pCi/g of alpha
The purpose of the historical evaluation is to determine whether the model based on process knowledge and historical information (Brevick et al. 1995, Agnew et al. 1996b) predicts tank inventories that are in agreement with current tank inventories. If the historical model can be shown to accurately predict the waste characteristics as observed through sample characterization, then there is a possibility that the amount of total sampling and analysis needed may be reduced. Data requirements for this evaluation are documented in Historical Model Evaluation Data Requirements, Rev. 0-A (Simpson and McCain 1995).
A “gateway” analysis is a quick check to ensure that the data obtained from sampling support the remainder of the historical evaluation analysis. Failure of the gateway analysis indicates that the model waste composition estimate is not comparable to the sample data and that the tank is not a good tank on which to perform the historical DQO. If the gateway analysis fails, the remainder of the sampling and analysis for the historical DQO will not be applied to the tank. If the gateway analysis passes, then further analyses will be performed on the
2-2
WHC-SD-WM-ER-559 Rev. 0
waste samples as specified in the historical model evaluation DQO. Results of the historical model evaluation DQO will be used to quantify the errors associated with the historical tank content estimates (HTCE).
The gateway analysis was applied to each of the auger samples taken from tank 241-T-109 in August 1995. The gateway analytes for tank 241-T-109 are sodium, water, nitrate, phosphate, and fluoride. These analytes were chosen because the tank waste is predicted to be composed entirely of saltcake waste generated from the 242-T evaporator from 1951 through 1955 (TlSltCk). The gateway analysis required two tests be performed for each sample. The first test was to determine if the gateway analytes contributed to more than 85 percent (by mass) of the total waste. The second test was to determine if the concentration of each of the gateway analytes was over 10 percent of the predicted concentration (as specified in the DQO). The gateway analysis for tank 241-T-109 is shown in Appendix C.
The first test in the gateway analysis passed; water, sodium, and phosphate alone contributed to over 90 percent of the waste mass. The second test, however, failed for each segment. In sample 95-AUG-40, the fluoride was less than 10 percent of the predicted value. In the 95-AUG-41 upper and lower samples, the nitrate was less than 10 percent of the predicted value. Phosphate appeared to be the predominant anion in all samples. If the historical model evaluation DQO had used the average of the two auger samples, both fluoride and nitrate would have been greater than 10 percent of the predicted value and the samples would have passed the second test.
Because the gateway analysis for tank 241-T-109 failed, the remainder of the sample analyses specified in the historical model evaluation DQO will not be performed for the tank. The likely reason for the gateway analysis failure is that the model predicts the presence of just one waste type (TlSltCk) when other wastes were also received by the tank. Further evaluation will be performed later to determine the specific reason why the gateway analysis failed. See Section D1.4 in Appendix D for conclusions about the tank waste contents.
2.3 OTHER TECHNICAL ISSUES
A factor in assessing tank safety is the heat generation and temperature of the waste. Heat is generated in the tanks from radioactive decay. An estimate of the tank heat load based on the 1995 sample event was not possible because radionuclide analyses were not required. However, the heat load estimate based on the tank process history was 44.7 W (153 Btu/hr) (Agnew et al. 1996b). The heat load estimate based on the tank headspace temperature was 518 W (1,770 Btu/hr) (Kummerer 1994). Both of these estimates are quite low, and are well below the limit of 11,700 W (40,000 Btu/hr) that separates high- and low-heat-load tanks (Bergmann 1991.)
2-3
WHC-SD-WM-ER-559 Rev. 0
2.4 SUMMARY
The results from all analyses performed to address potential safety issues showed that no primary analyte exceeded safety decision threshold limits. Some uncertainty exists as to whether or not the auger samples included waste from the bottom of the tank. There is, however, no indication that any waste type other than TlSltCk or first concentration cycle waste exists in the tank. Both these waste types have no exothermic constituents and do not represent a safety hazard. The gateway analysis for the historical evaluation DQO failed; thus, no further analyses from the historical DQO will be applied to this tank. The analyses results are summarized in Table 2-1.
Table 2-1. Summary of Safety Screenine. and Historical Evaluation Results.
screening
(gateway analysis)
Flammable gas
Criticality
Total mass of indicators of total waste mass.
Comparison of Failed. each indicator
Vapor measurement reported 0 percent of lower flammability limit. (Combustible gas meter).
All analyses well below 41 pCilg total alpha (within 95 percent confidence limit on each sample).
Passed - Indicator analytes contribute over 95 percent
2-4
WHC-SD-WM-ER-559 Rev. 0
3.0 BEST-BASIS INVENTORY ESTIMATE
Information about the chemical and/or physical properties of tank wastes is used to perform safety analyses, engineering evaluations, and risk assessments associated with waste management activities, as well as to address regulatory issues. Waste management activities include overseeing tank farm operations and identifying, monitoring, and resolving safety issues associated with these operations and with the tank wastes. Disposal activities involve designing equipment, processes, and facilities for retrieving wastes and processing the wastes into a form that is suitable for long-term storage. Chemical inventory information generally is derived using two approaches: 1) component inventories are estimated using the results of sample analyses; and 2) component inventories are predicted using a model based on process knowledge and historical information. The most recent model was developed by Los Alamos National Laboratory (LANL) (Agnew et al. 1996b). Not surprisingly, information derived from these two different approaches is often inconsistent.
An effort is underway to provide waste inventory estimates that will serve as standard characterization information for the various waste management activities (Kupfer et al. 1995). As part of this effort, an evaluation of available chemical information for tank 241-T-109 was performed that included:
Data from recent analyses of two auger samples collected in August 1995 (Conner 1995a)
Data from the analysis of supernatant sample T-2289 collected in 1974
The solids composite inventory estimate for this tank generated from the LANL model (Agnew et al. 1996b), also referred to as the historical tank content estimate (HTCE).
Results from this evaluation, detailed in Appendix D, support using the sampling data as the basis for the best estimate inventory for tank 241-T-109 for the following reasons:
1. The inventory estimate generated by the LANL model is based on a single defined salt waste stream (TlSltCk) and does not take into account any solids contributions andlor waste dilution effects from the 1,431 kL (378 kgal) of waste transferred from T-108 to T-109 in 1973. This 1,431 kL is not considered to be TlSltCk and would most likely alter the composition of the 515 kL (136 kgal) of salt waste in the tank at that time.
2. Phosphate concentration values, which appear consistent for all analyzed segments, suggest that phosphates formed the bulk of the precipitated solids. The predicted concentration value for this major component is less than half of
the lower limit of the two-sided 95 percent confidence interval on the mean. The LANL assumption that only 40 percent of the phosphate in the T1 waste stream precipitates appears to be conservative.
Best-basis inventory estimates for tank 241-T-109 are presented in Tables 3-1 and 3-2. While samples were analyzed for numerous analytes, only those detected in the waste are. included in these. tables. Table 3-1 provides an inventory estimate in terms of percent (expected) chemical species. Note that this waste is predominantly sodium phosphate and should not be mixed with waste types that could result in phosphate gels. Table 3-2 lists compound inventories along with the analytical concentrations that were used to calculate these. inventories. A tank volume of 220 kL (58 kgal) (Hanlon 1996) and a density of 1.55 glmL (Agnew et al. 1996b) were used to calculate these inventories.
2.9
2.9
0.074 - 2.3
0.076 - 0.75
0.48 - 1.8
1.6
Table 3-1. Best-Basis Inventory Estimate for Tank 241-T-109 (Percent Nonradioactive Chemical Species).
Water I 48 G u m phosphate’ I 40 - 44
Notes: ’Range accounts for range in sodium sulfate, sodium nitrite, and sodium carbonate inventories; refer to (2) and (3) below.
%.ow value based on auger sample analysis; high value based on 1974 supernatant analysis. The 1974 data have not been validated and should he used witb caution.
,Low value based on 0.542 percent CO, in supernatant sample, and high value based on 0.542 M COY
3-2
WHC-SD-WM-ER-559 Rev. 0
Table 3-2. Best-Basis Inventorv Estimates for 241-T-109. (2 Sheets)
n/a n/a nla
nla nla nla
nla nla nla
n/a n/a nla
nla nla nla
0 168,000 Y
0 26,800 Y
58
74
110
120
14
4,500
1,900
100
38
350
62,0002
170 - 5,100 7,100
92,000 - 83,0004
300
6
3-3
WHC-SD-W-ER-559 Rev. 0
Zr UCPIAcid) Total (Y bCi1g) H,O (wt%) Density (glmL)6
12.2 nla nla nla 4
0.0137 0 0.1 Y 4.7 Ci 47.7 38.1 57.3 Y 48 wt% 1.55 nla nla nla 1.55
Key: CI IC ICP TIC Water Acid Fusion
nla
Confidence level Ion chromatography Inductively coupled plasma spectroscopy Total organic carbon Approximately 1 g sample is contacted with 100 mL water; solution analyzed by IC. Sample is digested with acid; solution analyzed by ICP. Sample is fused with KOH at high temperatures to form a "melt," which is subsequently dissolved with water; solution analyzed by ICP. not applicable
Notes: 'Analyte detected in only one sample; insufficient data to calculate confidence intervals.
w a inventory is based on 178,000 p g Nalg waste for ion balance purposes, assuming N%,5&,5P0,.
'Range reflects mean analyte concentrations from ICP and IC analyses.
'PO, inventory of 92,000 kg is based on 269,000 pg P04/g waste; lower inventory value acc~unts for uncertainties in NO,, SO,, and TIC as CO, inventories.
'Auger samples not analyzed for CO,; concentration has been estimated from supematant data. Concentration in the supernatant sample was reported as "0.542" with no units. The lower concentrationliventory value is based on 0.542 percent C Q and the higher concentrationliventory value is based on 0.542 M CO,.
6Density analyses not performed with auger samples. Density of 1.55 kg/L was generated by LANL and is consistent with a densities of 1.6 glmL for N%PO4.12H,O and 1.5 g l d for N%HPO,.12H2O.
'Low value based on auger sample analysis; high value based on 1974 supernatant analysis. The 1974 data have not been validated and should be used with caution.
3 -4
WHC-SD-WM-ER-559 Rev. 0
Safety Screening DQO
Historical Evaluation DQO
4.0 RECOMMENDATIONS
Partial Partial
Yes Yes
All analytical results for the safety screening DQO were well within the safety notification limits. However, the full depth of the waste was not sampled. Therefore, the tank cannot yet be classified as "safe." The gateway analysis for the historical DQO failed, indicating that no further sampling and analysis of tank 241-T-109 will be performed to support this DQO. Further evaluation of the available data will be performed at a later time to determine why the gateway analysis failed. The sampling and analysis activities performed for tank 241-T-109 have met all requirements for all of the applicable DQO documents. Furthermore, a characterization best-basis inventory was developed for the tank contents.
Table 4-1 summarizes the status of TWRS Program review and acceptance of the sampling and analysis results reported in this tank characterization report. All DQO issues required to be addressed by sampling and analysis are listed in column one of Table 4-1. The second column indicates whether the requirements of the DQO were met by the sampling and analysis activities performed and is answered with a "yes" or a "no." The third column indicates concurrence and acceptance by the program in TWRS that is responsible for the DQO that the sampling and analysis activities performed adequately meet the needs of the DQO. A "yes" or "no" in column three indicates acceptance or disapproval of the sampling and analysis information presented in the TCR. If the results/information have not yet been reviewed, "N/R" is shown in the column. If the results/information have been reviewed, but acceptance or disapproval has not been decided, "N/D" is shown in the column. Because the waste at the bottom of the tank was not sampled (see Section B3.1) the safety screening DQO has been only partially completed. The upper part of the waste was sampled and analyzed in accordance with the safety screening DQO and accepted by the responsible TWRS program.
Table 4-1. Acceptance of Tank 241-T-109 Sampling and Analysis.
Note: NIR = Not reviewed
Table 4-2 summarizes the status of TWRS Program review and acceptance of the evaluations and other characterization information contained in this report. The evaluations specifically outlined in this report are the best-basis inventory evaluation, the gateway analysis, and the evaluation to determine whether the tank is safe, conditionally safe, or unsafe. Column one lists the different evaluations performed in this report. Columns two and three are in the
4- 1
WHC-SD-WM-ER-559 Rev. 0
Historical "gateway" analysis
Safety categorization (tank is safe)
Table 4-2. Acceptance of Evaluation of Characterization Data and Information for Tank 241-T-109.
Yes Yes
Partial Partial
I Best basis inventory I Yes I N/R I
Note: NIR = Notreviewed
same format as Table 4-1. The manner in which concurrence and acceptance are. summarized is also the same as that in Table 4-1. The safety categorization of the tank is listed as "partial" in Table 4-2 because the full depth of the waste was not sampled. However, none of the analyses performed on the auger samples indicate any safety problems.
Resampling of tank 241-T-109 using push-mode core sampling has been recommended in order to provide the two full depth profiles required by the safety screening DQO (Kirch 1995, Conner 199%). Further evaluation of the information available on tank 241-T-109 is recommended to determine if additional samples are needed to categorize the tank as "safe."
One final comment regarding the safety screening DQO needs to be made. The one-sided confidence intervals that were used to determine whether or not "%I is below the DO0 stated threshold limit were performed solely on each individual sample as required by-the DQO.
4-2
WHC-SD-WM-ER-559 Rev. 0
5.0 REFERENCES
Agnew, S . F., R. A. Corbin, T. B. Duran, K. A. Jurgensen, T. P. Ortiz, and B. L. Young, 1996a, Waste Status and Transaction Record Summary for the Northwest Quadrant of the Hanford 200 East Area, WHC-SD-WM-TI-669, Rev. 1, Westinghouse Hanford Company, Richland, Washington.
Agnew, S . F., J. Boyer, R. A. Corbin, T. B. D u m , J. R. Fitzpatrick, K. A. Jurgensen, T. P. Ortiz, and B. L. Young, 1996b, Hanford Tank Chemical and Radionuclide Inventories: HDW Model Rev. 3, LA-UR-96-858, Los Alamos National Laboratory, Los Alamos, New Mexico.
Babad, H., J. W. Hunt, and K. S . Redus, 1995, Tank Safety Screening Data Quality Objective, WHC-SD-WM-SP-004, Rev. 1, Westinghouse Hanford Company, Richland, Washington.
Bergmann, L. M., 1991, Single-Shell Tank Isolation Safety Analysis Report, WHC-SD-WM-SAR-006, Rev. 2, Westinghouse Hanford Company, Richland, Washington.
Brevick, C. H., L. A. Gaddis, and E. D. Johnson, 1995, Historical Tank Content Estimate for the Northwest Quadrant of the Hanford 200 East Areas, WHC-SD-WM-ER-351, Rev. 0, Westinghouse Hanford Company, Richland, Washington.
Brown, T. M., S . J. Eberlein, and T. J. Kunthara, 1995, Tank Waste characterization Basis, WHC-SD-WM-TA-164, Rev. 1, Westinghouse Hanford Company, Richland, Washington.
Conner, J. M., 1995a, Final Report for Tank 241-T-109, Auger Samples 95-AUG-040 and 95-AUG-041, WHC-SD-WM-DP-144, Rev. lA, Westinghouse Hanford Company, Richland, Washington.
Conner, J. M., 1995b, Tank 241-T-109 Tank Characterization Plan, WHC-SD-WM-TP-368, Rev. 0, Westinghouse Hanford Company, Richland, Washington.
Conner, J. M., 1995c, Need ldentifred to Resample Tank 241-T-109, (Internal Memo 75310-95-098 to T. J. Kelley, October 24), Westinghouse Hanford Company, Richland, Washington.
Dukelow, G. T., J. W. Hunt, H. Babad, and J. E. Meacham, 1995, Tank Safety Screening Data Quality Objective, WHC-SD-WM-SP-004, Rev. 2, Westinghouse Hanford Company, Richland, Washington.
5-1
WHC-SD-WM-ER-559 Rev. 0
Ecology, EPA and DOE, 1996, Hanford Federal Facility Agreemenr and Consent Order, as amended, Washington State Department of Ecology, U.S. Environmental Protection Agency, and U.S. Department of Energy, Olympia, Washington.
Hanlon, B. M., 1996, Waste Tank Summary Report for Month Ending April 30, 1996, WHC-EP-0182-97, Westinghouse Hanford Company, Richland, Washington.
Kirch, N. W., 1995, Tank Data Review Committee, (Meeting Minutes to Distribution, October 18), Westinghouse Hanford Company, Richland, Washington.
Kummerer, M., 1994, Topical Report on Heat Removal Characteristics of Waste Storage Tanks, WHC-SD-WM-SARR-010, Rev. 0, Westinghouse Hanford Company, Richland, Washington.
Kupfer, M. J., M. D. LeClair, W. W. Schulz, and L. W. Shelton, 1995, Work Plan for DeJning a Standard Inventory Estimate for Wastes Stored in Hanford Site Underground Tanks, WHC-SD-WM-WP-311, Rev. 0, Westinghouse Hanford Company, Richland, Washington.
Public Law 101-510, 1990, "Safety Measures for Waste Tanks at Hanford Nuclear Reservation," Section 3 137 of National Defense Authorization Act for Fiscal Year 1991.
Sant, W. H., 1974, Analysis of Tank Farm Samples, Sample: T-2289, Tank IOPT, (internal memorandum to R. L. Walser, March 13), Atlantic Richfield Hanford Company, Richland, Washington.
Simpson, B. C. and D. J. McCain, 1995, Historical Model Evaluation Data Requirements, WHC-SD-WM-DQO-018, Rev. 0-A, Westinghouse Hanford Company, Richland, Washington.
5-2
WHC-SD-WM-ER-559 Rev. 0
APPENDIX A
HISTORICAL TANK INFORMATION
A- 1
WHC-SD-Wh4-ER-559 Rev. 0
This page intentionally left blank.
A-2
WHC-SD-WM-ER-559 Rev. 0
APPENDIX A
HISTORICAL TANK INFORMATION
Appendix A describes tank 241-T-109 based on historical information. For this report, historical information includes any information about the fill history, waste types, surveillance, or modeling data about the tank. This information is necessary for providing a balanced assessment of the sampling and analytical results.
This appendix contains the following information:
Section A l : Current status of the tank, including the current waste levels as well as the stabilization and isolation status of the tank.
Section A2: Information about the design of the tank.
Section A3: Process knowledge of the tank; i.e., the waste transfer history and the estimated contents of the tank based on modeling data.
Section A4: Surveillance data for tank 241-T-109, including surface-level readings, temperatures, and a description of the waste surface based on photographs.
Section AS: References for Appendix A.
Historical sampling results (results from samples obtained prior to 1989) are included in Appendix B.
A1.O CURRENT TANK STATUS
As of April 30, 1996, tank 241-T-109 contained an estimated 220 kL (58 kgal) of non-complexed waste (Hanlon 1996). The waste volumes were estimated using a manual tape surface-level gauge. The volumes of the waste phases found in the tank are shown in Table Al-1.
In 1974, tank 241-T-109 was declared an assumed leaker and removed from service. It was interim stabilized in 1984; intrusion prevention (interim isolation) was completed in December 1982. The tank is passively ventilated and is not on the Watch List (Public Law 101-510).
A-3
WHC-SD-W-ER-559 Rev. 0
Table Al-1. Tank Contents Status Summary (Hanlon 1996).
Note: 'Although the Waste Status Summary Report (Hanlon 1996) reports that the tank contents are all sludge waste, it is evident from the transfer history (Agnew et al. 1996a) and the appearance of the auger samples that the majority of the waste is probably saltcake.
A2.0 TANK DESIGN AND BACKGROUND
Tank 241-T-109 was constructed during 1943 and 1944. It is one of twelve 2,010-kL (530-kgal) tanks in T Farm. These tanks were designed for nonboiling waste with a maximum fluid temperature of 104 "C (220 OF). A typical T Farm tank contains 9 to 11 risers ranging in size from 10 cm (4 in.) to 1.1 m (42 in.) in diameter that provide surface-level access to the underground tank. Generally, there is one riser through the center of the tank dome and four or five each on opposite sides of the dome.
Tank 241-T-109 entered service in 1945 and is third in a three-tank cascading series. These tanks are connected by a 7.6-cm (3-in.) cascade line. The bottom center elevation of tank 241-T-107 is 193.2 m (634 ft) above sea level. The tank cascades to tank 241-T-108 at 193.0 m (633 ft), which then cascades to tank 241-T-109, which has a bottom center elevation at 192.3 m (631 ft). The cascade overflow height is approximately 4.78 m (188 in.) from the tank bottom and 60 cm (2 ft) below the top of the steel liner.
These single-shell tanks (SSTs) are constructed of 30-cm (1-ft)-thick reinforced concrete with a 6.4 mm (1/4 in.) mild carbon steel liner (ASTM A283 Grade C) on the bottom and sides and a 38-cm (1.25-ft)-thick domed concrete top. These tanks have a dished bottom with a 1.241 (4-ft) radius knuckle and a 5.18-m (17-ft) operating depth. The tanks are set on a reinforced concrete foundation.
A-4
WHC-SD-WM-ER-559 Rev. 0
A three-ply cotton fabric waterproofing was applied over the foundation and the steel tank. Four coats of primer paint were sprayed on all exposed interior tank surfaces. Tank ceiling domes were covered with three applications of magnesium zincfluorosilicate wash. Lead flashing was used to protect the joint where the steel liner meets the concrete dome. Asbestos gaskets were used to seal the access holes in the tank dome. The tanks were waterproofed on the sides and top with tar and gunite. Each tank was covered with approximately 2.1 m (7 ft) of overburden.
The surface level is monitored through riser 1 with an ENRAF' gauge. A manual tape in riser 4 is no longer used to record waste level data, except when the other systems fail. Riser 8 contains a thermocouple tree. The interior tank photograph from 1993 shows a saltwell screen located in riser 13. Figure A2-1 is a plan view of the riser configuration. A list of tank 241-T-109 risers showing their sizes and general use is provided in Table A2- 1.
A tank cross section showing the approximate waste level, along with a schematic of the tank equipment, is shown in Figure A2-2. Tank 241-T-109 has nine risers. Risers 2, 3, 4, 5, 6 , and 7 are tentatively available for sampling (Lipnicki 1995). Risers 2, 3, 6 , and 7, are all 30 cm (12 in.) in diameter. Risers 4 and 5 are 10-cm (4 in.) in diameter. If used as sampling ports, the risers would give access to two opposite sides of the tank. Risers 2 and 4 are approximately 40 degrees counterclockwise from the inlet, and risers 5, 6 , and 7 are approximately 70 degrees clockwise from the inlet.
Tank 241-T-109 has four process inlet nozzles and one cascade overflow inlet located approximately 4.8 m (188 in.) from the tank bottom (as measured at the tank wall). Locations are shown on Figure A2-1.
'ENRAF is a trademark of the ENFUF Corporation, Houston, Texas.
A-5
WHC-SD-WM-ER-559 Rev. 0
Figure A2-1. Riser Configuration for Tank 241-T-109.
2010 kL [530 kgall
KEY PLAN
A-6
WHC-SD-WM-ER-559 Rev. 0
Table A2-1. Tank 241-T-109 Risers.'
R2 12 in.
R3 12 in.
R4 4 in.
R5 4 in.
R6 12 in.
R7 12 in.
R8 4 in.
R13 12 in.
N1 3 in.
N2 3 in.
N3 3 in.
N4 3 in.
N5 3 in.
Note: 'Alstad (1993)
Breather filter
Flange
Process inlet nozzle
Process inlet nozzle
Process inlet nozzle I
A-7
WHC-SD-WM-ER-559 Rev. 0
Figure A2-2. Tank 241-T-109 Cross Section and Schematic.
w w E c
W
a 2
u I W
+ I: c
A-8
WHC-SD-WM-ER-559 Rev. 0
A3.0 PROCESS KNOWLEDGE
The sections below: 1) provide information about the transfer history of tank 241-T-109; 2) describe the process wastes that made up the transfers; and 3) give an estimate of the current tank contents based on transfer history.
A3.1 WASTE TRANSFER HISTORY
Table A3-1 summarizes the waste transfer history of tank 241-T-109 (Agnew et al. 1996a). Waste was initially added to tank 241-T-109 in the fourth quarter of 1945 with the cascade of first cycle decontamination waste from the bismuth phosphate process (1C)) from tank 241-T-108. Because tank 241-T-109 was the third tank in the cascade, it is unlikely that it received any 1C waste solids. In March 1946, the entire cascade series (tanks 241-T-107, 241-T-108, and 241-T-109) was declared full.
Supernatant was pumped from tank 241-T-109 to tank 241-TX-118 during the second quarter of 1951. Uranium recovery waste (UR) was intermittently cascaded from tank 241-T-108 to tank 241-T-109 from the fourth quarter of 1952 to the first quarter of 1953. Again, it is likely that all of the waste cascaded to tank 241-T-109 was liquid. During the third quarter of 1953, supernatant was transferred from tank 241-T-109 to tank 241-TX-118. During the fourth quarter of 1953 and the first quarter of 1954, tank 241-T-109 received supernatant from tank 241-TX-117. Additionally, waste (TlSltCk) was pumped from the 242-T Evaporator to tank 241-T-109 during the first quarter of 1954. The addition of TlSltCk was probably a major solids contribution to the tank even though it was a relatively low-volume transfer. There were no transfers into or out of tank 241-T-109 from the second quarter of 1954 through the third quarter of 1969.
During the fourth quarter of 1969, supernatant was transferred from tank 241-T-109 to tank 241-TY-103. During the first and second quarters of 1973, supernatant was pumped to tank 241-T-109 from tank 241-T-108. Historical records suggest that the supernatant may have been B Plant low-level waste (BL), Battelle Northwest waste (BNW), andlor ion exchange (IX) waste. Supernatant was transferred to tank 241-T-109 from tank 241-T-111 during the second quarter of 1974. Also, during the same time period, supernatant was transferred from tank 241-T-109 to tank 241-S-110. Finally, the last major waste transfer for tank 241-T-109 involved the transfer of supernatant to tank 241-T-101 during the first quarter of 1975 and the second quarter of 1976. Saltwell liquid was pumped from tank 241-T-109 in support of tank stabilization in the third quarter of 1983.
A-9
WHC-SD-WM-ER-559 Rev. 0
Table A3-1. Tank 241-T-109 Major
Notes: 1c
su
SWLQW
TlSltCk UR
1st-cycle decontamination waste from the BiPO, process (contains 10 percent of the fission products and 1 percent plutonium and often included in cladding waste). Supernatant (liquid considered free of contamination to the extent it could be pumped to a crib). Saltwell liquid (dilute non-complexed liquid pumped from single-shell tanks to double-shell tanks). Saltcake waste generated from the 242-T evaporator-crystallizer from 1951 until 1955. Uranium recovery waste from uranium recovery operations (also called TBP [tri-butyl phosphate] waste).
'Agnew et al. 1996a
aBecause only major transfers are listed, the sum of these transfers will not equal the current tank waste volume.
A3.2 HISTORICAL ESTIMATION OF TANK CONTENTS
This section provides an estimate of the contents of tank 241-T-109 based on historical transfer data. The historical data used for the estimate are the waste status and transaction record summary (WSTRS) (Agnew et al. 1996a), the Hanford defined waste (HDW) (Agnew et al. 1996b) list, and the tank layer model (TLM) (Agnew et al. 1996b) from the historical tank content estimate (HTCE) (Brevick et al. 1995b). The WSTRS is a compilation of available waste transfer and volume status data. The HDW provides the assumed typical
A-10
WHC-SD-WM-ER-559 Rev. 0
compositions for 50 separate wastes types. In some cases, the available data are incomplete, reducing the usability of the transfer data and the modeling results derived from it. The TLM takes the WSTRS data, models the waste deposition processes, and, using additional data from the HDW (which may introduce more error), generates an estimate of the tank contents. Thus, these model predictions can only be considered estimates that require further evaluation using analytical data.
Based on Agnew et al. (1996b), tank 241-T-109 contains only a layer of 220 kL (58 kgal) of TlSltCk waste. Figure A3-1 shows a graphical representation of the estimated waste type and volume for the tank layer. The historical tank content estimate model predicts tank 241-T-109 to contain very large amounts of sodium, nitrate, and phosphate. Hydroxide and carbonate are also expected to be present in significant quantities. Additionally, noticeable quantities of aluminum, iron, bismuth, sulfate, nitrite, and a trace quantity of plutonium will be found. The presence of cesium and strontium will give this waste layer an activity corresponding to their concentrations. Table A3-2 shows the historical estimate of the expected waste constituents and their concentrations.
Figure A3-1. Tank Layer Model.
ul
220 kL [ 5 8 kgal ] T I Slt Ck
Waste Volume
A-11
WHC-SD-WM-ER-559 Rev. 0
Heat load
Bulk density
Void fraction
Water wt %
Table A3-2. Historical Tank Inventory Estimate.'** (2 sheets)
4.47E-02 kW (153 Btulhr)
1.55 (g/mL)
0.731
57.2
Total organic carbon I wt% carbon (wet)
Chemical constituents F Fe3+ (total Fe)
Si3+
La3 +
Hg2+
Zr (as ZrO(OH),)
PbZ+
Ni2+
SrZ+
Mn4+
Ca2+
NO;
I 1.9 1E-04
0.170 2.96E +03
0.222 7.99E + 03
5.26E-03 176
4.55E-02 6.12E+03
0 0
3.90E-05 5.04
3.34E-03 196
0 0
1.14E-02 43 1
0 0
0 0
0.113 2.93E+03
1.43E-02 361
1.45 1.59E+04
3.09 1.23E+05
0.290 8.58E+03
0.248 9.58E+03
1.69 1.03E+05
0.138 8.56E + 03
2.34E-02 424
1.01E+03
2.72E + 03
60.0 2.09E+03
0
1.72
67.0
0
147
0
0
998
123
5.42E+03
4.20E + 04
2.93E + 03
3.27E+03
3.52E+04
2.92E+03
,145
A-12
WHC-SD-WM-ER-559 Rev. 0
Table A3-2. Historical Tank Inventory Estimate.'.' (2 sheets)
I I I
c1- I8.16E-02 ]1.86E+03 I635 1
Notes: 'Agnew et al. (1996b)
The HTCE predictions have not been validated and should be used with caution.
'Differences exist among the inventories in this column and the inventories calculated from the two sets of concentrations.
A-I3
WHC-SD-WM-ER-559 Rev. 0
A4.0 SURVEILLANCE DATA
Tank 241-T-109 surveillance consists of surface-level measurements (liquid and solid), temperature monitoring inside the tank (waste and headspace), and leak detection well (drywell) monitoring for radioactivity outside the tank. Surveillance data provide the basis for determining tank integrity.
Liquid-level measurements can indicate if the tank has a major leak. Solid surface-level measurements provide an indication of physical changes in and consistencies of the solid layers of a tank. Drywells located around the tank perimeter may show increased radioactivity due to leaks.
A4.1 SURFACELEVEL READINGS
Tank 241-T-109 is categorized as an assumed leaker. An automatic Food Instrument Corporation (FIC) gauge set in intrusion mode is used to monitor the surface level through riser 1. An ENRAP gauge has replaced the FIC gauge. Manual readings are required daily if the ENRAP gauge fails or if the computer automated surveillance system readings are zero. A manual tape in riser 4 is used to record level data only if the other systems fail. The leak detection criteria for tank 241-T-109 are an increase of 5.1 cm (2.0 in ) or a decrease of 2.5 cm (1.0 in.) in intrusion mode from the baseline value. The criterion for a decrease does not apply to this tank. The FIC readings range from 37.9 cm (14.9 in.) to 44.3 cm (17.45 in.) and the E N R A P readings range from 46.6 cm (18.35 in.) to 46.9 cm (18.46 in.) The surface-level plot indicates a steady waste level from January 1991 to January 1994. A level history graph of the volume measurements is presented in Figure A4-1.
Tank 241-T-109 has no liquid observation well, and has six identified drywells.
A4.2 INTERNAL TANK TEMPERATURES
Tank 241-T-109 has a single thermocouple tree with 11 thermocouples to monitor the waste temperature through riser 8. Thermocouple 1 is 36.6 cm (1.2 ft) from the bottom of the tank. Thermocouples 2 though 9 are spaced at 61-cm (2-ft) intervals above thermocouple 1. Thermocouples 9 though 11 are at 1.22 m (4 ft) intervals. The condition of the thermocouple tree, and whether it was removed or replaced, is unclear.
Only two data points are available for each thermocouple after November 1982. There are temperature data for a twelfth thermocouple, but its location is unknown and the data are not considered in this report. Non-suspect temperature data for the first eleven thermocouples
A-14
WHC-SD-WM-ER-559 Rev, 0
recorded from February 1976 to February 1991 were available from the surveillance analysis computer system. Within this time span, two large breaks and several small breaks occurred in the temperature data sequence for all of the thermocouples.
The average tank temperature is 20 "C (68 OF), the minimum is 8 "C (47 OF), and the maximum is 33 "C (91 "F). Plots of the thermocouple readings can be found in the supporting document for the HTCE (Brevick et al. 1995a). Figure A4-2 shows a graph of the weekly high temperature.
A4.3 TANK 241-T-109 PHOTOGRAPHS
The waste in the photographs appears to have a crusted surface with varied colors ranging from tan to green, red, and dark brown. The waste in the near side of the photograph is light tan in color and appears to have a sand-like texture. The waste in the far side of the photograph is dark and appears to have a liquid surface in one small section. An old level measurement tape and other debris can be seen on the left side of the montage. An FIC probe, temperature probe, saltwell screen, manhole, and some inlet nozzles are also visible in the photographs. The photographs were taken in 1993. A photographic montage from February, 1993 may be found in Historical Tank Content Esrimate for the Northwest Quadrant of the Hanford 200 West Area (Brevick et al. 1995b). The tank has been inactive since the mid 1980s, so the photographs should accurately represent the tank interior. The 220 kL (58 kgal) of waste would fill the tank to a depth between 30 cm (1 ft) and 60 cm (2 ft).
A-15
WHC-SD-WM-ER-559 Rev. 0
Figure A4-1. Tank 241-T-109 Level History.
. . _ - _ _ _ - _ - A. 0.- . -. u. . L W . m. Y m. 0. 0. -. N. w. a. Y - . Y m . L E V E L I N FEET 1. 0. G, 2 S Z. 2.: :, g i E - - - Y m. 4 u. :. E. 6 . . . 2. ?. LEVEL I N INCHES
PERNATE TO T X - 1 1 8
TO 5-110 REMOVED rROM SERVICE OCCLARCd ASSUME0 LEAKER 17411<
Figure A4-2. Tank 241-T-109 High Temperature Plot.
Tempcnture (OF)
m OI
I * - - -
e +
_.
Jm-96 F- I
-- 1M-m
.. Jrm-81
- - Jut80
- - Jm-79
- JM-78
Jm-77
-- JM-76
-- -- - _-
1 - - /=- -- -
A-17
WHC-SD-WM-ER-559 Rev. 0
A5.0 APPENDM A REFJ3RENCES
Agnew, S. F., R. A. Corbin, T. B. Duran, K. A. Jurgensen, T. P. Ortiz, and B. L. Young, 1996a, Waste Status and Transaction Record Summary for the Northwest Quadrant of the Hanford 200 East Area, WHC-SD-WM-TI-669, Rev. 1, Westinghouse Hanford Company, Richland, Washington.
Agnew, S. F., J. Boyer, R. A. Corbin, T. B. Duran, J. R. Fitzpatrick, K. A. Jurgensen, T. P. Ortiz, and B. L. Young, 1996b, Hanford Tank Chemical and Radionuclide Inventories: HDW Model Rev. 3, LA-UR-96-858, Los Alamos National Laboratory, Los Alamos, New Mexico.
Alstad, A. T., 1993, Riser ConJiguration Document for Single-Shell Waste Tanks, WHC-SD-WM-RE-TI-053, Rev. 9, Westinghouse Hanford Company, Richland, Washington.
Brevick, C. H., L. A. Gaddis, and W. W. Pickett, 1995a, Supporting Document for the Historical Tank Content Estimate for T Tank Farm - Volume 1 and 2, WHC-SD-WM-ER-320, Rev. 0, Westinghouse Hanford Company, Richland, Washington.
Brevick, C. H., L. A. Gaddis, and E. D. Johnson, 1995b, Historical Tank Content Estimate for the Northwest Quadrant of the Hanford 200 East Areas, WHC-SD-WM-ER-35 1, Rev. 0, Westinghouse Hanford Company, Richland, Washington.
Hanlon, B. M., 1996, Waste Tank Summary Report for Month Ending April 30, 19%, WHC-EP-0182-97, Westinghouse Hanford Company, Richland, Washington.
Lipnicki, J., 1995, Waste Tank Risers Available for Sampling, WHC-SD-WM-TI-710, Rev. 1, Westinghouse Hanford Company, Richland, Washington.
Public Law 101-510, 1990, "Safety Measures for Waste Tanks at Hanford Nuclear Reservation," Section 3137 of National Defense Authorization Act for Fiscal Year 1991.
A-18
WHC-SD-WM-ER-559 Rev. 0
APPENDIX B
SAMPLING OF TANK 241-T-109
B- 1
WHC-SD-WM-ER-559 Rev. 0
This page intentionally left blank.
B-2
WHC-SD-WM-ER-559 Rev. 0
APPENDIX B
SAMPLING OF TANK 241-T-109
Appendix B provides sampling and analysis information for each known sampling event for tank 241-T-109 and provides an assessment of the auger sample results.
Section B1: Tank Sampling Overview
Section B2: Analytical Results
Section B3: Assessment of Characterization Results
Section B4: References for Appendix B.
Future sampling of tank 241-T-109 will be appended to the above list.
B1.O TANK SAMPLING OVERVIEW
This section describes the August 1995 sampling and analysis events for tank 241-T-109. Auger samples were taken to satisfy the requirements of the Tank Safety Screening Datu Quality Objective (Babad et al. 1995), and the Historical Model Evaluation Data Requirements (Simpson and McCain 1995). The sampling and analyses were performed in accordance with the Tank 241-T-IO9 Auger Sampling and Analysis Plan (Conner 1995a). The sampling and analysis plan (SAP) also instructed that if enough sample were recovered, composite material would be retained for pretreatment studies as guided in the Strategy for Sampling Hanford Site Tank Wastes for Development of Disposal Technology (Kupfer et al. 1995). Further discussions of the sampling and analysis procedures can be found in the Tank Characterization Reference Guide (DeLorenzo et al. 1994). A liquid sample was also taken from this tank in February 1974; this sample event is discussed in Section B1.4.
B1.l DESCRIPTION OF SAMPLING EVENT
Two auger samples were collected from tank 241-T-109. Auger 95-AUG-040 was obtained on August 18 and auger 95-AUG-041 was obtained on August 21, 1995. The first auger sample was collected from riser 6 on August 18, 1995 and extruded at the 222-S Laboratoq on August 24, 1995. The second auger sample was obtained from riser 2 on August 21, 1995 and extruded by the 2224 Laboratory on August 25, 1995.
B-3
WHC-SD-WM-ER-559 Rev. 0
Auger sampling was used because of the depth of the waste and the expectation that a full vertical profile of the waste would be obtained. The auger samples, however, may not have recovered a full vertical profile of the waste. The waste depth was expected to be 16 to 18 in. However, because the waste sloped down from the sides to the middle, waste level readings indicated that the waste depth was 27 in. under riser 6 and 63 in. under riser 2. A memo was written stating that additional sampling may be recommended (Conner 1995b). A vertical profile is used to satisfy the safety screening data quality objective (DQO). Safety screening analyses include: total alpha to determine criticality, differential scanning calorimetry (DSC) to ascertain the fuel energy value, and thermogravimetric analysis (TGA) to obtain the total moisture content. In addition, combustible gas meter readings in the tank headspace were performed to measure flammability. The current revision of the safety screening DQO (Dukelow et al. 1995) also requires bulk density measurements. However, because the samples were taken under the previous revision of the safety screening DQO (Babad et al. 1995), bulk density was not required.
Tank 241-T-109 also was evaluated against the historical model requirements. The specified gateway analytes to evaluate the Tank Layer Model (TLM) for this tank are sodium, nitrate, fluoride, and phosphate. Historical model analyses include: DSC, TGA, inductively coupled plasma (ICP), and ion chromatography (IC). The full range of analytes is required for both ICP and IC analyses.
Sampling and analytical requirements from the safety screening and historical DQOs are summarized in Table B1-1.
Table B1-1. Integrated Data Quality Obiective Requirements for Tank 241-T-109.'
Meter Reading
Note: 'Comer 1995a
- - -
of two risers separated radially ,Moisture Content to the maximum extent possible. ,Total Alpha
Efforts should be made to obtain ,Moisture Content thick, layered segments from +Metals widely separated areas of the c Anions tank.
one location within tank vapor space.
Historical Model A minimum of two cores. b Energetics
Safety Screening Measurement in a minimum of ,Flammable Gas Concentration
The riser 6 auger sample, identified as sample 95-AUG-040, had a total weight of 67.5 grams of dirty-white, crystalline solids. Most of the sample fell onto the extrusion tray when extruded at the 222-S Laboratory on August 24, 1995. The bulk of the sample appeared to come from flutes 1 to 6 at the top of the auger, with only a thin coating on the remaining flutes. The sample was homogenized and subsampled for further laboratory analyses and archiving. Due to the relatively low recovery, the sample was not divided into subsegments, but was analyzed on a whole-segment basis.
The riser 2 auger sample, identified as sample 95-AUG-041, had a total weight of 232.5 grams of solids recovered. Most of the sample fell onto the auger tray when extruded on August 25, 1995. The sample was divided into upper and lower half-segments, the upper half appearing to be gray-black crystals and the lower half appearing to be dirty white crystals. The material was homogenized and subsampled for laboratory analyses and archiving. Subsamples of each half-segment were then recombined and subsampled for composite analyses and for shipment to Pacific Northwest National Laboratory for use in pretreatment studies. Table B1-2 gives the subsampling scheme and sample description.
Table B1-2. Tank 241-T-109 Subsampling Scheme and Samule Description.'
Note: 'Conner 1995c
2Sample recovery calculated using an expected sample length of 15 in. and an estimated density of 1.55 glmL.
B1.3 SAMPLE ANALYSIS
The analyses performed on the auger samples were limited to those required by the safety screening DQO and the historical model evaluation DQO. The analyses required by the safety screening DQO included analyses for thermal properties by DSC, moisture content by TGA, and content of fissile material by total alpha activity analysis. The historical DQO required a full set of analytes to be analyzed by IC and ICP in order to determine the presence of selected "gateway" analytes in sufficient abundance to warrant further investigation.
B-5
WHC-SD-WM-ER-559 Rev. 0
Differential scanning calorimetry and TGA were performed on 8.665-mg to 45.550-mg samples. Quality control tests included performing the analyses in duplicate, and the use of standards. Moisture content was also measured by a gravimetric method.
Total alpha activity measurements were performed on samples that had been fused in a solution of potassium and then dissolved in acid. The resulting solution was then dried on a counting planchet and counted in an alpha proportional counter. Quality control tests included standards, spikes, blanks, and duplicate analyses.
Ion chromatography was performed on samples that had been prepared by water digestion. Quality control tests included standards, spikes, blanks, and duplicate analyses. The SAP required that the full suite of IC analytes be measured.
Inductively coupled plasma spectrometry was performed initially on samples that had been prepared by a fusion procedure, followed by dissolution in acid. Before the analyses could be completed, however, the DQO was revised to require that ICP samples be prepared by an acid digestion procedure. The reason for the change was the need to use high dilutions in the fusion procedure, resulting in higher detection limits. Quality control tests included standards, blanks, spikes, and duplicate analyses. The SAP required that the full suite of ICP elements be analyzed.
All reported analyses were performed in accordance with approved laboratory procedures. A list of the sample numbers and applicable analyses is presented in Table B1-3. The procedure numbers are presented in the discussion in Section B2.0
B1.4 DESCRIPTION OF HISTORICAL SAMPLING EVENT
Sampling data for tank 241-T-109 have been obtained for one sample obtained on February 9, 1974 and reported on March 13, 1974 (Sant 1974). The data are presented in Section B2.6. Pre-1989 analytical data have not been validated and should be used with caution.
No information was available regarding sample handling for this tank. The reason for the sampling was given as "242-Feed." The sample was reported as being a clear, amber color with no solids.
B-6
WHC-SD-WM-ER-559 Rev. 0
Table B1-3. Tank 241-T-109 Sample Analysis Summary.'
rl Too2177 1;; 1 S95T001629 Gravimetric, DSC, TGA
S95T001630
S95T001631
Upper sample S95Too16262 Gravimetric, TGA
Lower sample S95T001616* Gravimetric, TGA
S95T001618 Gravimetric, DSC, TGA
S95T001620
Note: 'Conner 1995c
?Sample portion not homogenized prior to subsampling.
B2.0 ANALYTICAL RESULTS
B2.1 OVERVIEW
This section summarizes the sampling and analytical results associated with the August 1995 sampling and analysis of tank 241-T-109. The total alpha activity, percent water, energetics, IC, and ICP analytical results associated with this tank are presented in Table B2-1. These results are documented in Conner (199%).
B-7
WHC-SD-WM-ER-559 Rev. 0
Percent water
Differential scanning calorimetry
Summary data for metals by ICP
Anions by IC
Table B2-1. Analytical Presentation Tables.
B2-3
B2-4
B2-5 through B2-41
B2-42 through B2-49
The four QC parameters assessed in conjunction with the tank 241-T-109 samples were standard recoveries, spike recoveries, duplicate analyses (RPDs), and blanks. The QC criteria specified in the SAP (Conner 1995a) were 90 to 110 percent recovery for standards and spikes and S 10 percent for RPDs. These criteria applied to all of the analytes. The only QC parameter for which limits are not specified in the SAP is blank contamination. The limits for blanks are set forth in guidelines followed by the laboratory, and all data results presented in this report have met those guidelines. Sample and duplicate pairs in which any of the QC parameters were outside of these limits are footnoted in the sample mean column of the following data summary tables with an a, b, c, d, or e as follows:
I & * ’ a indicates that the standard recovery was below the QC limit.
“b” indicates that the standard recovery was above the QC limit.
0 “c” indicates that the spike recovery was below the QC limit.
“d” indicates that the spike recovery was above the QC limit.
“e” indicates that the RPD was above the QC limit.
B2.2 TOTAL ALPHA ACTIVITY
Analyses for total alpha activity were performed on the samples recovered from tank 241-T-109. The samples were prepared by fusion digestion per procedure LA-549-141, Rev. D-0 and analyzed according to procedure LA-508-101, Rev. D-2. Two fusions were prepared per sample (for duplicate results). Each fused dilution was analyzed twice, the results were averaged and reported as one value. The highest result returned was 0.00653 pCilg. The sample results for total alpha are given in Table B2-2.
B- 8
WHC-SD-WM-ER-559 Rev. 0
Table B2-2. Tank 241-T-109 Total Aloha Activitv.' r - ,
Note: 'Comer 1995c
B2.3 THERMODYNAMIC ANALYSES
As required by the safety screening and historical DQOs, TGA and DSC were performed on the solids. No other physical tests were required or performed.
B2.3.1 Thermogravimetric Analysis
Thermogravimetric analysis measures the mass of a sample while its temperature is increased at a constant rate. Nitrogen is passed over the sample during heating to remove any released gases. Any decrease in the weight of a sample during TGA represents a loss of gaseous matter from the sample, either through evaporation or through a reaction that forms gas phase products. The moisture content is estimated by assuming that all TGA sample weight loss up to a certain temperature (typically 150 to 200 degrees Celsius ["C]) is due to water evaporation. The temperature limit for moisture loss is chosen by the operator at an inflection point on the TGA plot. Other volatile matter fractions can often be differentiated by inflection points as well.
Tank 241-T-109 samples were analyzed by TGA using either procedure LA-514-114, Rev. C-0 on a Perkin-Elmer TGA 7 instrument, or procedure LA-560-112, Rev. B-0 on a Mettler TG 50 instrument. Auger sample AUG-95-040 (sample S95T001600) measured considerably less water than the remaining samples. However, inspection of the thermogram revealed that the weight loss curves for the sample were interpreted conservatively (first integration is only up to a slight inflection of the curves at about 105 "C). The second weight loss step is also integrated; if the two steps are added, the weight loss is similar to what is recorded for the other samples from this tank. Gravimetric analyses were performed for all the 241-T-109 subsamples from this tank to access the accuracy of the TGA results. Because some of the TGA results were conservatively interpreted, the gravimetric results provide a better estimate of the moisture content of the samples. Comparison of the TGA and gravimetric results is presented in Table B2-3.
B-9
WHC-SD-WM-ER-559 Rev. 0
Table B2-3. Percent Water by TGA and Gravimetric Analysis.'
segment
S95T0015973
S95T001629 Upper half
S95T00 1 6263
S95T001618 Lower half
S95T00161 63
- nla 47.60 49.30
50.70 50.40
nla 48.10 47.30
48.90 49.20
nla 46.60 45.70
45.60 45.50
Notes: 'Comer 199% Temperature ranges in parentheses are for the duplicate. 'Unbomogenized sample
B2.3.2 Differential Scanning Calorimetry
In a DSC analysis, heat absorbed or emitted by a substance is measured while the temperature of the sample is heated at a constant rate. Nitrogen is passed over the sample material to remove any gases being released. The onset temperature for an endothermic or exothermic event is determined graphically.
B-10
WHC-SD-WM-ER-559 Rev. 0
The DSC analyses for tank 241-T-109 were performed using either procedure LA-514-113, Rev. C-0 on a Mettler DSC 20 instrument or procedure LA-514-114, Rev. C-0 on a Perkin-Elmer DSC 7 instrument. No exothermic reactions were noted. Therefore, an upper limit of a 95 percent confidence interval on the mean for each sample was not calculated. Transitions 1 and 2 represent endothermic events, both of which are caused by water evaporation. DSC results are presented in Table B2-4.
The last two analyses performed on the auger samples were ICP and IC for the anions and cations respectively. In the sections below, a table is provided for each analyte.
In each table, the “Mean” column is the average of the result and duplicate values. All values, including those below the detection level (denoted by the less-than symbol, * < ”), were averaged. If both sample and duplicate values were non-detected, the mean is expressed as a non-detected value. If one value were detected while the other were not, the mean is expressed as a detected value. If both values were detected, the mean is expressed as a detected value.
B-11
WHC-SD-WM-ER-559 Rev. 0
S95T002177
S95T001630
S95TOO1619
B2.4.1 Inductively Coupled Plasma
Samples were prepared by either fusion or acid digests. The ICP analyses were performed per procedures LA-505-161, Rev. B-0, or LA-505-151, Rev. D-3, depending on the ICP instrument used. Although a full suite of analytes were reported, only sodium and phosphorus were specifically requested by the historical DQO. Phosphorus was analyzed as a cross-check for the phosphate results reported from IC analyses. Reports for silver, aluminum, boron, bismuth, calcium, chromium, iron manganese, lead sulfur, silicon, and zinc are above detection limits in some of the samples. The potassium and nickel results for the ICP fusion analyses (samples S95TOO1612, S95TOO1619, and S95M01630) should be disregarded, because the samples were prepared in a nickel crucible by fusion using potassium hydroxide.
The concentrations of metals in the samples are shown in Tables B2-5 through B2-41. The results from two preparation methods, fusion and acid, are presented for the metals. Composite samples shown in Tables B2-5 through B2-41 were prepared by acid digestion prior to analysis. Other samples were prepared by fusion with potassium hydroxide in a nickel crucible.
95-AUG-041 Composite 1,410 1,420 1,420
Upper half 1,430 833 1,130"
Lower half 1,090 1,010 1,050
Table B2-5. Tank 241-T-109 Analytical Results: Aluminum.
S95T001612
S95T002177
S95TOO1630
S95T001619
95-AUG-040 Whole < 2,450 < 2,430 < 2,440
95-AUG-041 Composite < 60.0 < 60.0 < 60.0"
Upper half < 2,510 < 2,490 < 2,500'
Lower half
Table B2-6. Tank 241-T-109 Analytical Results: Antimony.'
B-12
WHC-SD-WM-ER-559 Rev. 0
95-AUG-041
Table B2-7. Tank 241-T-109 Analytical Results: Arsenic.
Composite < 50.0 < 50.0 < 50.0
Upperhalf < 629 < 623 < 626
Lower half < 565 < 573 < 569
95-AUG-041 Composite < 100 < 100 < 100
Upperhalf < 629 < 623 < 626
Lower half < 565 < 573 < 569
Table B2-8. Tank 241-T-109 Analytical Results: Barium.
IS95TOO1612 195-AUG-040 IWhole I < 613 I < 608 I < 610 I
Table B2-9. Tank 241-T-109 Analytical Results: Beryllium.
95-AUG-041 Composite < 5.00 < 5.00 < 5.00
Upper half < 62.9 < 62.3 < 62.6
Lower half < 56.5 < 57.3 < 56.9
B-13
WHC-SD-WM-ER-559 Rev. 0
S95T002177
S95TOO1630
S95TOO 16 19
Table B2-10. Tank 241-T-109 Analytical Results: Bismuth.
95-AUG-041 Composite 181 158 170"
Upperhalf < 1,260 < 1,250 < 1,250
Lower half < 1,130 < 1,150 < 1,140
S95T001612
S95T002177
S95T001630
S95TOO16 19
Table B2-11. Tank 241-T-109 Analytical Results: Boron.
95-AUG-040 Whole < 613 < 608 < 610
95-AUG-041 Composite 217 217 217
Upperhalf < 629 < 623 < 626
Lower half < 565 < 573 < 569
Table B2-12. Tank 241-T-109 Analytical Results: Cadmium.
Table B2-23. Tank 241-T-109 Analytical Results: Manganese.
Table B2-24. Tank 241-T-109 Analytical Results: Molybdenum.
B-18
WHC-SD-WM-ER-559 Rev. 0
S95T002177
S95TOO1630
S95TOO1619
Table B2-25. Tank 241-T-109 Analytical Results: Neodymium.
95-AUG-041 Composite < 100 < 100 < 100
Upper half < 1,260 < 1,250 < 1250
Lower half < 1,130 < 1,150 < 1,140d
S95T002177 95-AUG-041
S95T001630
S95T001619
Table B2-26. Tank 241-T-109 Analytical Results: Nickel.
Composite < 20.0 < 20.0 < 20.0
Upper half 4,730 8,450 6,590"
Lower half 5,240 5,770 5,510
Table B2-27. Tank 241-T-109 Analytical Results: Phosphorus.
95-AUG-041 Composite 81,000 81,000 81,000'
Upper half 80,200 82,000 81,10Od
Lower half 81,400 79,400 80,400'
B-19
WHC-SD-WM-ER-559 Rev. 0
S95TOO1612
S95T002177
S95Too1630
S95T001619
Table B2-28. Tank 241-T-109 Analytical Results: Potassium.
95-AUG-040 Whole < 1,230 < 1,220 < 1,220
95-AUG-041 Composite < 100 < 100 < 100
Upper half < 1,260 < 1,250 < 1,250
Lower half < 1,130 < 1,150 < 1,140
95-AUG-041 Composite < 500 < 500 < 500'
Upper half 7.22E+06 n/a 7.22E+06
Lower half 7.20E+06 n/a 7.20E+06
95-AUG-041
Note: nla = Not analyzed
Composite < 100 < 100 < 100
Upper half < 1,260 < 1,250 < 1,250
Lower half < 1,130 < 1,150 < 1,140
Table B2-29. Tank 241-T-109 Analytical Results: Samarium.
Table B2-30. Tank 241-T-109 Analytical Results: Selenium.
k5T001612 -195-AUG-040 ]Whole I < 1,230 I < 1,220 I < 1,220 I
B-20
WHC-SD-WM-ER-559 Rev. 0
S95T002177
S95T001630
S95Mo1619
Table B2-31. Tank 241-T-109 Analytical Results: Silicon.
95-AUG-041 Composite 2,580 2,580 2,580b
Upper half 774 < 623 774
Lower half < 565 < 573 < 569
S95T001612
S95T002177
S95TOO1630
S95T001619
Table B2-32. Tank 241-T-109 Analytical Results: Silver.
95-AUG-040 Whole < 123 < 122 < 122'
95-AUG-041 Composite 18.7 18.4 18.6"*d
Upper half < 126 < 125 < 125'
Lower half < 113 < 115 < 114'
S95T002177 95-AUG-041 Composite 1.82E+05 1.84E+05
S95Too 1630 Upper half 1.84E+05 1.94E+05
S95T001619 Lower half 2.03E+05 2.04E+05
1 .83E+05d
1.89E+05d
2.03E+05
B-21
zz-8
WHC-SD-WM-ER-559 Rev. 0
S95T002177
S95T001630
S95T001619
Table B2-37. Tank 241-T-109 Analytical Results: Titanium.
95-AUG-041 Composite < 10.0 < 10.0 < 10.0
Upper half < 126 < 125 < 125
Lower half < 113 < 115 < 114
IS95TOO1612 195-AUG-040 IWhole 1 < 123 I < 122 I < 122 I
S95TOO1612
S95TOO2177
S95T001630
S95T001619
95-AUG-040 Whole < 4,900 < 4,860 < 4,880
95-AUG-041 Composite < 500 < 500 < 500
Upper half < 5,030 < 4,980 < 5,OlW
Lower half < 4,520 < 4,580 < 4,550
Table B2-39. Tank 241-T-109 Analytical Results: Vanadium.
B-23
WHC-SD-WM-ER-559 Rev. 0
S95T002177
S95T001630
S95T001619
Table B2-40. Tank 241-T-109 Analytical Results: Zinc.
95-AUG-041 Composite 48.1 55.9 52.0"
Upper half 271 266 269
Lower half 241 248 247
S95T002177
S95T001630
S95T0016 19
Table B2-41. Tank 241-T-109 Analytical Results: Zirconium.
95-AUG-041 Composite 12.6 11.8 12.2
Upperhalf < 126 < 125 < 125
Lower half < 113 < 115 < 114
S95T002176
S95T00 163 1
S95T00 1620
B2.4.2 Ion Chromatography
95-AUG-041 Composite < 563 < 563 < 563
Upper half < 1,010 < 1,010 < 1,010
Lower half < 1,100 < 1,100 < 1,100
Samples for ion chromatography (IC) were prepared by water digestion and performed in duplicate per procedure LA-533-105, Rev. D-1. All analytes reported by the IC instrument were requested (except for oxalate). However, only the fluoride, nitrate, and phosphate results are discussed here, as these are the only anions requested by the historical DQO for this tank. If data for other anions are to be used, the quality control criteria and raw data should be evaluated. Of the remaining IC analytes reported, only the chloride results for auger 95-AUG-040 are above the detection limit. The concentrations of anions by IC are shown in Tables B2-42 through B2-49.
Table B2-42. Tank 241-T-109 Analytical Results: Bromide.
B-24
WHC-SD-W-ER-559 Rev. 0
S95T002176
S95T001631
S95T001620
Table B2-43. Tank 241-T-109 Analytical Results: Chloride.
95-AUG-041 Composite 80.9 < 74.8 80.9
Upper half < 132 < 132 < 132
Lower half < 144 < 144 < 144
I S95TOO1613 I 95-AUG-040 I Whole I 578 I569 I574 i
S95T002176
S95T001631
S95T001620
95-AUG-041 Composite 23,500 24,500 24,000
Upper half 23,100 22,900 23,000
Lower half 27,200 27,900 27,600
Table B2-44. Tank 241-T-109 Analytical Results: Fluoride.
Table B2-45. Tank 241-T-109 Analytical Results: Nitrate.
B-25
WHC-SD-WM-ER-559 Rev. 0
S95T002176
S95T001631
S95T001620
Table B2-46. Tank 241-T-109 Analytical Results: Nitrite.
95-AUG-041 Composite < 493 < 493 < 493
Upper half < 872 < 872 < 872
Lower half < 952 < 952 < 952
S95T001613
S95T002176
S95T001631
S95T001620
Table B2-47. Tank 241-T-109 Analytical Results: Oxalate.
95-AUG-040 Whole 2.85E+05 2.50E+05 2.68E+05’
95-AUG-041 Composite 2.37E+05 2.38E+05 2.38E+05
S95T001620
Upper half
Lower half
Upperhalf < 791 < 791 < 791
Lower half < 863 < 863 < 863
2.66E+05 2.71E+05 2.68E+05b
2.71E+05 2.78E+05 2.74E+05
Table B2-48. Tank 241-T-109 Analytical Results: Phosphate.
B-26
WHC-SD-WM-ER-559 Rev. 0
Table B2-49. Tank 241-T-109 Analytical Results: Sulfate.
S95T002176
S95TOO1631
S95Mo1620
95-AUG-041 Composite < 604 < 604 <604
Upper half < 1,080 < 1,080 < 1,080
Lower half < 1,180 < 1,180 < 1,180
B2.5 VAPOR PHASE MEASUREMENT
Prior to the August 18-21 auger sampling of tank 241-T-109, a vapor phase measurement was taken. Additional measurements were made on May 9, 1996. These measurements supported the safety screening DQO (Dukelow et al. 1995). The vapor phase screening was taken for flammability issues. The vapor phase measurements were taken 20 ft below riser 6 in the dome space of the tank and results were obtained in the field (ie. no gas sample was sent to the laboratory for analysis). The results of the vapor phase measurements are provided in Table B2-50.
Table B2-50. Results of Vapor Phase Measurements of Tank 241-T-109.
Total organic carbon (TOC) Lower exDlosive limit (LEL) 10.0% of LEL 10.0% of LEL
I 1.2 ppm
121.0% 120.8% I
B-27
WHC-SD-WM-ER-559 Rev. 0
PH Specific gravity Water
B2.6 HISTORICAL SAMPLE RESULTS
12.0 1.1982 77.57 %
The results of the February 9, 1974 sample are shown in Table B2-51. It appears that the contents of this tank were scheduled to be used as feed to the 2424 Evaporator. Because the sample was liquid and the tank has since been pumped of liquids, the sample probably does not represent present tank contents. The sample was analyzed for specific constituents and the results showed high concentrations of sodium, nitrate, and nitrite. The radionuclides tested for were cesium, cobalt, and rutheniumlrhodium. These data have not been validated and should be used with caution.
The purpose of this chapter is to discuss the overall quality and consistency of the current sampling results for tank 241-T-109, and to present the results of the calculation of an analytical-based inventory.
This section also evaluates sampling and analysis factors that may impact interpretation of the data. These factors are used to assess the overall quality and consistency of the data and to identify any limitations in the use of the data.
B3.1 FIELD OBSERVATIONS
Sample recovery from 95-AUG-040 was quite poor as most of the waste appeared to come from the top six flutes, with just a thin coating on the remaining flutes. Recovery was much better from 95-AUG-041, but the bottom 13 cm (5 in.) of waste may not have been recovered. This raises questions about the representativeness of the samples. Due to the crystalline nature of much of the solids recovered, it was speculated that some of the analytical variability may be caused by homogenization difficulties.
The expected depth of the waste was 16 to 18 in. However, readings taken at the risers at the time of sampling indicated 27 in. of waste under riser 6 and 63 in. under riser 2 (Conner 1995b). In-tank photographs showed that the waste sloped down significantly from the side wall of the tank. Therefore, it appears that the full depth of the waste was not sampled and the SAP (Conner 1995a) requirement that vertical profiles of the waste be obtained from two risers was not met.
B3.2 QUALITY CONTROL ASSESSMENT
The usual quality control assessment includes an evaluation of the appropriate standard recoveries, spike recoveries, duplicate analyses, and blanks that are performed in conjunction with the chemical analyses. All the pertinent quality control tests were conducted on the 1995 auger samples, allowing a full assessment regarding the accuracy and precision of the data. The SAP (Conner 1995a) established the specific criteria for all analytes. Sample and duplicate pairs that had one or more QC results outside the specified criteria were identified by footnotes in the data summary tables.
The standard and spike recovery results provide an estimate of the accuracy of the analysis. If a standard or spike recovery is above or below the given criterion, the analytical results may be biased high or low, respectively. The precision is estimated by the relative percent difference (RPD), which is defined as the absolute value of the difference between the primary and duplicate samples, divided by their mean, times one hundred. A number of spike recoveries and W D s were outside the target level for total alpha activity. This may
B-29
WHC-SD-WM-ER-559 Rev. 0
have been caused by a high dissolved solids content on the sample mount and subsequent self-shielding. Reruns were deemed unnecessary as the sample results were far below the action limit. Some of the high RPDs for the IC analytes may be attributable to sample homogeneity problems. The two high RPDs for nitrate can be explained by the fact that the phosphate peak interferes with the resolution of the much smaller nitrate peak. The high RPD and low spike recovery for fluoride can be attributed to the fact that the fluoride peak is very near the baseline and suffers interference from the slightly larger chloride peak (Conner 199%). Many of the ICP analytes also had one or more QC parameters outside the specified limits. The poor spike recoveries for sodium may be due to the high concentration of sodium in the samples (samples cannot be spiked to levels much greater than already present). The high concentrations of sodium required high dilutions for all ICP samples. These high dilutions in turn can cause poor or meaningless spike recoveries and RPDs for those ICP elements that had either very high concentrations or were close to the detection limit. Finally, none of the samples exceeded the criterion for preparation blanks; thus, contamination was not a problem.
In summary, the vast majority of the QC results were within the boundaries specified in the SAPS. The discrepancies mentioned here and footnoted in the data summary tables should not impact either the validity or the use of the data.
B3.3 DATA CONSISTENCY CHECKS
Comparisons of different analytical methods can help to assess the consistency and quality of the data. Several correlations were possible with the data set provided by the two core samples. Including a comparison of phosphorous as analyzed by ICP with phosphate as analyzed by IC, and a comparison of weight percent water by TGA with the weight percent water by gravimetry. In addition, mass and charge balances were calculated to help assess the overall data consistency.
B3.3.1 Comparison of Results from Different Analytical Methods
The following data consistency checks compare the results from two different analytical methods. A close correlation between the two methods strengthens the credibility of both results, whereas a poor correlation brings the reliability of the data into question. All analytical mean results were taken from tables in Section B2.0.
The analytical phosphorous mean result as determined by ICP was 80,300 pglg, which converts to 246,000 pg/g of phosphate. This compared well with the IC phosphate mean result of 269,000 pg/g. The RPD between these two phosphate results was 8.9 percent.
The mean weight percent water result, as determined by TGA, for auger 95-AUG-041 was 45.82 percent. This compared well with the gravimetric result of 46.92 percent. The RPD between these two weight percent water results was 2.4 percent. The mean TGA result for
B-30
WHC-SD-WM-ER-559 Rev. 0
auger 95-AUG-040 was 12.46 percent. This compared poorly with the gravimetric result of 48.45 percent. The RPD between these two weight percent water results was 118 percent. The large difference is attributable to the conservative manner in which the laboratory integrated the TGA raw data (Conner 199%).
B3.3.2 Mass and Charge Balance
The principle objective in performing mass and charge balances is to determine if the measurements are self-consistent. In calculating the balances, only analytes listed in Section B2.0 detected at a concentration of 1,000 pglg or greater were considered.
Except sodium, all cations listed in Table B3-1 were assumed to be in their most common hydroxide or oxide form, and the concentrations of the assumed species were calculated stoichiometrically. Because precipitates are neutral species, all positive charge was attributed to the sodium cation. The anions listed in Table B3-2 were assumed to be present as sodium salts and were expected to balance the positive charge exhibited by the cations. Phosphate, as determined by IC, is assumed to be completely water soluble and appears only in the anion mass and charge calculations. The concentrations of cationic species in Table B3-1, the anionic species in Table B3-2, and the percent water were ultimately used to calculate the mass balance.
The mass balance was calculated from the formula below. The factor 0.0001 is the conversion factor from pg/g to weight percent.
Mass balance = % Water + 0.0001 x {Total Analyte Concentration)
= % Water + 0.0001 x {Al(OH), + FeO(0H) + MnO(0H) + Na+ + F- + NO; + PO,J}
The total analyte concentrations calculated from the above equation is 498,000 pglg. The mean weight percent water (obtained from the gravimetric analyses reported in Table B2-3) is 47.7 percent, or 477,000 pg/g. The mass balance resulting from adding the percent water to the total analyte concentration is 97.5 percent (Table B3-3).
The following equations demonstrate the derivation of total cations and total anions; the charge balance is the ratio of these two values.
Total cations (peq/g) = [Na+]/23.0 = 7,870 p q l g
The charge balance obtained by dividing the sum of the positive charge by the sum of the negative charge was 0.83.
B-3 1
WHC-SD-WM-ER-559 Rev. 0
Iron
Manganese
Sodium
In summary, the above calculations yield reasonable mass and charge balance values (close to 1.00 for charge balance and 100 percent for mass balance), indicating that the analytical results are generally self-consistent.
Total from Table B3-2 303,000 Water % 477,000 Grand Total 975,000
303,000 9,510
B-32
WHC-SD-Wh4-ER-559 Rev. 0
B3.4 CALCULATION OF ANALYTICAL BASED MEANS AND INVENTORY
The following evaluation was performed on the analytical data from the August 1995 auger samples for tank 241-T-109. These statistics and inventory development are used to support the characterization best-basis inventory that will be developed in Appendix D.
There were three major differences in the statistical analysis for the inventory development compared to safety screening: 1) instead of computing confidence intervals for each sub-segment mean inventory, only one confidence interval was obtained for the tank mean inventory; 2) only an inventory estimate was needed without comparing it to a threshold value; therefore, two-sided 95 percent confidence intervals on the mean inventory were computed; and 3) more analytes were analyzed for the inventory development.
The 95 percent confidence interval upper limit (UL) and lower limit (LL) on the mean for all the analytes detected are
Where A is a weighted sample mean, a is the number of core samples, 2; is the variance of the sample mean and t(.-1,[(1+o.9nnp is a quantile from Student's t distribution with a-1 degrees of freedom and 0.95 confidence.
The weighted sample mean pw was computed weighting the cores equally (Le. the arithmetic means for cores 40 and 41 were computed and then those means were averaged for the weighted sample mean). For the tank 241-T-109 data, a is two and $l,E(1+0.9nnD is 12.706. The variance, 26, was estimated using restricted maximum likelihood estimation (REML) methods.
Table B3-4 gives the upper and lower limits to the 95 percent confidence intervals for analytes detected in tank 241-T-109. Some analytes had a computed lower limit less than 0. Because an inventory estimate less than 0 is not possible, the lower limit is recorded as 0 in Table B3-4 whenever that occurred.
Table B3-4. 95% Two-sided Confidence Interval Limits on the Mean Concentration. (2 sheets)
B-33
WHC-SD-WM-ER-559 Rev. 0
Table B3-4. 95% Two-sided Confidence Interval Limits on the Mean Concentration. (2 sheets)
Note: 'Nickel crucible used 2unhomogenized sample results not used in calculations.
Confidence intervals could not be performed on the differential scanning calorimetry @SC) data, because all of the results were zero.
After the weighted sample means are calculated for the tank for each analyte, the sampling based inventory may be calculated. Because the analyte concentrations above are presented in terms of a mass basis concentration, the total estimate inventories. The total mass of waste is derived from the tank volume (from surveillance) and the estimated tank bulk density (from the HTCE model). The total tank volume is 58 kgal (or 220 m3) (Hanlon 1996). The density used for this estimate is 1.55 glmL (Agnew et al. 1996b). The total mass of waste is calculated to be 343 metric tons. Assuming that there are 343 metric tons of waste in the tank, the inventory of each of the analytes is presented in Table B3-5.
of waste in the tank is needed to
Table B3-5. Analytical-Based Inventory of Tank 241-T-109.' (2 sheets)
B-34
WHC-SD-WM-ER-559 Rev. 0
Silicon7
silve?
Sodium
Sulfate3s5
Zinc
Zirconium3
Total Alpha
300 nla nla
6 nla nla
62,000 0 130,000
180 nla nla
94 16 170
4 nla nla
4.67 Ci 0 34.1
Notes: nla = Not applicable
'The bulk density used to calculate inventory was not measured; it is an estimate from Agnew et al. (1996b).
'95 percent two-sided confidence interval upper and lower limits.
mese analytes were measured using acid digestion on the composite of 95-AUG-041. Bemuse only one sample was available, the mean and upper and lower limits were not calculated.
'Assume that all phosphotus is in the form of phosphate.
'Sulfate was not detected using IC, but sulfur was measured using ICP (acid digestion only). All sulphur is assumed to be sulfate.
6All nitrate results were below detection limits. Lowest detection limit value was used to estimate inventory.
'The concentration used to estimate the inventory was a weighted mean. The weighted mean was calculated using both measured concentrations and detection limits. Silicon calculations used fusion digest results only.
B-35
WHC-SD-WM-ER-559 Rev. 0
B4.0 APPENDIX B REFERENCES
Babad, H., J. W. Hunt, and K. S . Redus, 1995, Tank Safety Screening Data Quality Objective, WHC-SD-WM-SP-004, Rev. 1, Westinghouse Hanford Company, Richland, Washington.
Brevick, C. H., L. A. Gaddis, and E. D. Johnson, 1995, Historical Tank Content Estimate for the Northwest Quadrant of the Hanford 200 East Areas, WHC-SD-WM-ER-351, Rev. 0, Westinghouse Hanford Company, Richland, Washington.
Conner, J. M., 1995a, Tank 241-T-109 Auger Sampling and Analysis Plan, WHC-SD-WM-TSAP-014, Rev. 0-A, Westinghouse Hanford Company, Richland, Washington.
Conner, J. M., 1995b, "Need Identified to Resample Tank 241-T-109," (Internal Memo 75310-95-9-098, to T. J. Kelley, October 24) Westinghouse Hanford Company, Richland, Washington.
Conner, J . M., 1995c, Final Report for Tank 241-T-109, Auger Samples 95-AUGO40 and 95-AUGO41, WHC-SD-WM-DP-144, Rev. lA, Westinghouse Hanford Company, Richland, Washington.
Dehrenzo, D. S. , J. H. Rutherford, D. J. Smith, D. B. Hiller, K. W. Johnson, and B. C. Simpson, 1994, Tank Characterization Reference Guide, WHC-SD-WM-TI-648, Rev. 0, Westinghouse Hanford Company, Richland, Washington.
Dukelow, G. T., J. W. Hunt, H. Babad, and J. E Meacham, 1995, Tank Safety Screening Data Quality Objective, WHC-SD-WM-SP-004, Rev. 2, Westinghouse Hanford Company, Richland, Washington.
Hanlon, B. M., 1996, Waste Tank Summary Repon for the Month Ending April 30, 1995, WHC-EP-0182-97, Westinghouse Hanford Company, Richland, Washington.
Kupfer, M. J . , W. W. Schulz, and J. T. Slankas, 1995, Strategy for Sampling Hanford Site Tank Wastes for Development of Disposal Technology, WHC-SD-WM-TA-154, Rev. 1, Westinghouse Hanford Company, Richland, Washington.
Sant, W. H., 1974, Analysis of Tank Farm Samples, Sample: T-2289, Tank IOPT, (internal memorandum to R. L. Walser, March 13), Atlantic Richfield Hanford Company, Richland, Washington.
Simpson, B. C., and D. J. McCain, 1995, Historical Model Evaluation Data Requirements, WHC-SD-WM-DQO-118, Rev. 0-A, Westinghouse Hanford Company, Richland, Washington.
B-36
WHC-SD-WM-ER-559 Rev. 0
APPENDIX C
STATISTICAL ANALYSIS FOR ISSUE RESOLUTION
c- 1
WHC-SD-WM-ER-559 Rev. 0
This page intentionally left blank.
c-2
WHC-SD-WM-ER-559 Rev. 0
APPENDIX C
STATISTICAL ANALYSIS FOR ISSUE RESOLUTION
In appendix C, the analyses required for the applicable data quality objective (DQO) reports for tank 241-T-109 are performed. Specifically, statistical and other numerical manipulations required in the DQO reports are performed and documented in this appendix. The two analyses required for tank 241-T-109 are documented in the following sections:
Section C1: Statistical analysis supporting the Safety Screening DQO (Dukelow et al. 1995). Specifically, confidence intervals were needed to support the plutonium (criticality) threshold limit.
Section C2: Gateway analysis supporting the Historical Model Evaluation Data Requirements DQO (Simpson and McCain 1995).
Section C3: References for Appendix C.
C1.0 STATISTICS FOR SAFETY SCREENING DQO
The safety screening DQO (Dukelow et al. 1995) defines acceptable decision confidence limits in terms of one-sided 95 percent confidence intervals on the mean for each subsample. In this appendix, one sided confidence limits supporting the safety screening DQO are calculated for tank 241-T-109. All data considered in this section are taken from the final laboratory data package for the 1995 auger sampling event for tank 241-T-109 (Conner 1995).
Confidence intervals were computed for each sample number from tank 241-T-109 analytical data. The sample numbers and confidence intervals are provided in Table C1-1.
The upper limit (UL) of a one-sided 95 percent confidence interval for the mean is
where estimate of the variance of the data, and $o.1,0,95) is a quantile from Student’s t distribution with n-I degrees of freedom and 0.95 confidence.
is the arithmetic mean of the data, n is the number of observations, 2 is the
c -3
WHC-SD-WM-ER-559 Rev. 0
95Mo1619
95TOO1630
For the tank 241-T-109 data (per sample number), n is two and to,,,,* is 6.314.
95-AUG-04 1 Lower half 7.32E-03 4.64E-06 2.09E-02
95-AUG-041 Upper half 6.38E-03 2.25E-08 7.33E-03
The upper limit of the 95 percent confidence interval for each sample number based on the total alpha data is listed in Table C1-1. Each confidence interval can be used to make the following statement. If the upper limit is less than 40 pCi/g, then one would reject the null hypothesis that the total alpha is greater than or equal to 40 pCi/g at the 0.05 level of significance. The upper limit of 40 pCi/g was calculated from the 1 glL plutonium limit assuming a density of 1.55 g/mL (Agnew et al. 1996) and assuming that all the plutonium is z3gPu.
Table C1-1. 95 Percent Confidence Interval Upper Limits for Total Alpha for Tank 241-T-109.
Notes: AUG = Auger UL = Upper limit
Confidence intervals were not performed on the differential scanning calorimetry @SC) data, because all of the results were zero.
C2.0 GATEWAY ANALYSIS FOR HISTORICAL MODEL DQO
The Historical Model Evaluation Data Requirements (Simpson and McCain 1995) requires that a gateway analysis be performed on the analytical data obtained from tank 241-T-109. The purpose of the gateway analysis is to provide a quick screening check of the analytical data before a more thorough set of analyses are performed on the tank. If the gateway analysis fails, then the remainder of the analyses in the historical DQO will not be performed. The historical gateway analysis consists of two parts, both of which are described below. All data considered in this section are taken from the final laboratory data package for the 1995 auger sampling event for tank 241-T-109 (Conner 1995).
The first part of the gateway analysis is to check if the sum of the mass of a set group of analytes (indicator analytes) contributes over 85 percent of the total tank waste mass. The indicator analytes for tank 241-T-109 are water, sodium, nitrate, phosphate, and fluoride.
c-4
WHC-SD-WM-ER-559 Rev. 0
Sodium % Nitrate % Phosphate % Fluoride % Sum (%)
Padfail
The gateway analysis will be performed for three samples: 95-AUG-040, 95-AUG-041 upper half, and 95-AUG-041 lower half. The results of this analysis are shown in Table C2-1. The first part of the gateway analysis passed for all samples.
The second part of the gateway analysis requires that each of the indicator analytes (used above) be compared to the value predicted by the historical model. For the second part of the gateway analysis to pass, each of the indicator analytes measured from sampling has to be greater than 10 percent of the value predicted by the model. Table C2-2 summarizes the results of this analysis. The second part of the gateway analysis failed for every sample. However, it should be noted that averaging the results of the two auger samples gives results which would have passed this part of the gateway analysis.
Table C2-2. Part 2 of Gateway Analysis.
Note: 'Simpson and McCain (1995)
c-5
WHC-SD-WM-ER-559 Rev. 0
Because the gateway analysis passed part 1 but failed part 2, the analysis is considered to have failed for tank 241-T-109. This means that the remainder of the historical DQO analysis will not be applied to the tank.
C3.0 APPENDIX C REFERENCES
Agnew, S . F., J. Boyer, R. A. Corbin, T. B. Duran, J. R. Fitzpatrick, K. A. Jurgensen, T. P. Ortiz, and B. L. Young, 1996, Hanford Tank Chemical and Radionuclide Inventories: HDW Model Rev. 3, LA-UR-96-858, Los Alamos National Laboratory, New Mexico.
Conner, J. M., 1995, Final Repon for Tank 241-T-109, Auger Samples 95-AUG-040 and 95-AUG041, WHC-SD-WM-DP-144, Rev. 1-A, Westinghouse Hanford Company, Richland, Washington.
Dukelow, G . T., J. W. Hunt, H. Babad, and J. E Meacham, 1995, Tank Safety Screening Data Quality Objective, WHC-SD-WM-SP-004, Rev. 2, Westinghouse Hanford Company, Richland, Washington.
Simpson, B. C., and D. J. McCain, 1995, Historical Model Evaluation Data Requirements, WHC-SD-WM-DQO-118, Rev. 0-A, Westinghouse Hanford Company, Richland, Washington.
C-6
WHC-SD-WM-ER-559 Rev. 0
APPENDIX D
EVALUATION TO ESTABLISH BEST-BASIS INVENTORY FOR TANK 241-T-109
D-1
WHC-SD-WM-ER-559 Rev. 0
This page intentionally left blank.
D-2
WHC-SD-WM-ER-559 Rev. 0
APPENDIX D
EVALUATION TO ESTABLISH BEST-BASIS INVENTORY FOR TANK 241-T-109
An effort is underway to provide waste inventory estimates that will serve as standard characterization source terms for the various waste management activities (Kupfer et al. 1995). As part of this effort, an evaluation of available chemical information for tank 241-T-109 was performed, and a best-basis inventory was established. This work, detailed in the following sections, follows the methodology that was established by the standard inventory task.
D1.O CHEMICAL INFORMATION SOURCES
Available chemical information for tank 241-T-109 included:
Data from recent analyses of two auger samples that were collected in August, 1995 (Comer 1995). See Appendix B, Section B2.0 for data.
Data from the analysis of supernatant sample T-2289 collected in 1974 (Sant 1974). See Appendix B, Section B2.0 for data. (These data were used for comparison purposes; these data have not been validated and should be used with caution.)
The solids composite inventory estimate for this tank (Agnew et al. 1996) generated from the Los Alamos National Laboratory (LANL) model, also referred to as the Historical Tank Content Estimate (HTCE). See Appendix A, Section A3.2 for model estimate.
A list of references used in this evaluation is provided at the end of this Appendix (Section D4.0).
D2.0 COMPARISON OF COMPONENT INVENTORY VALUES
Sampling-based inventories (see Appendix B, Section B3.2), derived from the analytical concentration data from the two auger samples, and HTCE inventories, generated by the LANL model (See Appendix A, Section A3.2), are compared in Tables D2-1 and D2-2.
D-3
WHC-SD-WM-ER-559 Rev. 0
Table D2-1 compares nonradioactive components on a metric ton (MT) basis, and Table D2-2 compares the radioactive components on a curie basis.
Table D2-1. Sampling- and HTCE-based Inventory Estimates for Nonradioactive Components in Tank 241-T-109 Waste. (2 sheets)
Ag 10.006
As I nla
0.058 Ca 0.11 1.0
Ce nla NR
Cd I nla Im c1 0.099 0.64
c o nla NR Cr 0.014 0.06
Cr+3 NR NR
Cr+6 NR NR c s NR NR
cu nla NR # F 4.5 0.61
Fe 1.9 2.7
FeCNICN NR 0
formate NR NR
Hg NR 0.0017
I I
10.17 12.9
17.1 142 I
oxalate nla 0
Pb 0.10 0
Pd nla NR P as PO, 84-923 35
Pt NR NR Rh NR NR
Ru INR INR I Sb I nla INR I Se I nla INR I +-jE+fj
nla
Te INR INR I TIC as C03 NR 3.3
Th nla NR Tl NR NR
TOC NR NR
U,, nla NR V nla NR
D-4
WHC-SD-WM-ER-559 Rev. 0
Table D2-1. Sampling- and HTCE-based Inventory Estimates for Nonradioactive Components in Tank 241-T-109 Waste. (2 sheets)
Notes: MT = metric ton nla = NR = Notreported.
Not applicable; Le., concentration reported as less than value.
lanner (1995) - See Appendix B. 2Agnew et al. (1996) - See Appendix A. )Range reflects two methods of analysis.
Table D2-2. Sampling and Predicted Inventory Estimates for Radioactive Components in Tank 241-T-109 Waste.
NR NR '"Np NR NR
3 r NR 3,760 '39/24% NR 2.35
99TC NR NR 24'Am NR NR
'1 NR NR Total o! 4.69 NR
'"CS NR 4,150 Totals NR NR
'%Eu NR NR
Notes: nla = NR = Notreported.
'Conner (1995) - See Appendix B. lAgnew et d. (1996) - See Appendix A.
Not applicable; i.e., concentration reported as less than value.
D-5
9-a
LP
E‘€ 6‘2
6’2
ZP
19’0
E/U 29 EN
B’E-26’0 w f03
L.1 81’0 ’os 1‘5 Ll ‘0 ‘ON 9’9 I ‘L ‘ON
E/U S’P d
WHC-SD-WM-ER-559 Rev. 0
Sampling-based component inventories were calculated by multiplying the mean analyte concentration value by the current tank waste volume and by the density of the waste. A tank volume of 220 kL (58 kgal) (Hanlon 1996) and a density of 1.55 g/mL were used in these calculations. The density of 1.55 g/mL reflects the LANL model density (Agnew et al. 1996) because no density measurements were performed on the recent auger samples. This density is consistent with densities of 1.6 g/mL for Na,PO.,.l2H2O and 1.5 for Na,HPO,.12H2O; phosphate appears to be a bulk constituent in this waste (refer to Table D2-1).
The following evaluation of tank contents was performed in order to identify potential errors and/or missing information that could influence the sampling- and/or the HTCE-based component inventories.
D3.0 COMPONENT INVENTORY EVALUATION
Tank 241-T-109, the third tank in a cascade group comprised of tanks 241-T-107, 241-T-108, and 241-T-109, receivedltransferred (Agnew et al. 1996):
through 1953
195 1-1953
1953-1954
1954
1969
1973
1974
Notes:
Received overflow lC, UR wastes from tank 241-T-108
Supernatant sent to tank 241-TX-118
Received supernatant from tank 241-TX-117
Evaporator waste received
Supernatant sent to tank 241-TY-103 (515 kL [136 kgal] waste remains)
Received 1,514 kL (400 kgal) supernatant from tank 241-T-108 (potentially B Plant wash/LL/IX waste)
Supernatant sampled, 1,499 kL (396 kgal) transferred to tank 241-S-110; tank removed from service.
(Please refer to Appendix A, Section A3.1 for a more detailed summary of the waste transfer history.)
D-7
WHC-SD-WM-ER-559 Rev. 0
Fe
Si
NO3
NO*
so4 Bi
LANL sets the waste type in this tank as T1-saltcake (TlSltCk) beginning 1955 and does not take into account any solids contributions andlor waste dilution effects from the 1,514 kL (400 kgal) of supernatant waste transferred from tank 241-T-108 in 1973. This 1,514 kL would most likely alter the composition of the 515 kL (136 kgal) of salt waste in the tank at that time. The TlSltCk composition is compared with the auger sampling-based composition on a dry weight percent basis in Table D3-1.
1.2 1.9
0.19 0.10
4.4 30
0.10 2.1
0.11 2.1
0.036 1.5
Table D3-1. Comparison of Auger Sampling and HTCE Waste Compositions for Tank 241-T-109 on a Dry Weight Percent Basis.
AI
co3 Na
U.Lb 0. IL
NR 2.3
38 33
The bulk of L A W S TlSltCk is comprised of Na, NQ, and PO,, while the bulk of the auger sample is comprised of Na and PO,. Phosphate concentration values appeared consistent for all analyzed auger-sample segments, and the high concentration values suggested that alllnearly all of the PO4 precipitated from the aqueous salt stream sent to the tank. LANL assumed that only 58 percent of the PO, precipitated.
The following observations are made for several of the individual components listed in Tables D2-3 and D3-1:
Phosphate: Phosphate concentration values appeared consistent for all analyzed auger-sample segments. The high inventory value derived from these concentrations also suggests that alllnearly all of the PO, precipitated from the aqueous salt waste. The LANL. assumption that only 58 percent of the PO, precipitated is reflected in the significantly lower HTCE inventory value.
D-8
WHC-SD-WM-ER-559 Rev. 0
Fluoride: The mean concentration value that was used to generate the auger sampling-based inventory was based on two very different concentration values-800 pg Flg waste in one sample and 25,000 pg Flg waste in the other. These difference in concentration could be due to two distinct waste types in the tank and/or to inhomogeneous dilution effects. These sampling-based values suggest that some of the fluoride precipitated from solution, while the HTCE concentration and resulting inventory values are based on the assumption that fluoride remains dissolved in interstitial liquid.
Nitrate: The mean concentration value that was used to generate the auger sampling-based inventory was derived from two very different concentration values--38,000 pg N0,lg waste in one sample (corresponding to the 800 pg Flg waste sample) and 3500 pg NQlg waste in the other (corresponding to 23,000 pg F/g waste sample). These different values could be due to two distinct waste types in the tank andlor to inhomogeneous dilution effects. The inventory value in Table D2-3, derived from the supernatant sample, compares favorably with the inventory based on the auger sample. This observation tends to support the assumption that analyte concentrations in the supernatant might be representative of present analyte concentrations in the interstitial liquid. The concentration in TlSltCk is considerably higher than the sampling-based concentration values; the HTCE concentration value does not account for any potential dilution effects from the addition of 1,462 kL (386 kgal) of aqueous waste in 1973.
Nitrite: The auger and supernatant-based inventories in Table D2-3 for NO2 are very different (0.17 MT, auger versus 5.1 MT, supernatant). In contrast to NO,, this observation does not support the assumption that the analyte concentration in the supernatant might be representative of present analyte concentrations in the interstitial liquid. While the HTCE inventory falls within the sampling-based inventory range, the HTCE value could be smaller due to potential dilution effects.
Sulfate: The auger and supernatant-based inventories in Table D2-3 for SO, vary by an order of magnitude. In contrast to NQ, this observation does not support the assumption that the analyte concentration in the supernatant might be representative of present analyte concentrations in the interstitial liquid. The HTCE inventory falls outside the sampling-based inventory range; however, the HTCE value may be smaller due to potential dilution effects.
Bismuth: The HTCE inventory is larger than the auger sampling-based inventory. Tank 241-T-109 was the third tank in the cascade series, and as a result Bi, a heavy element, may have precipitated in the first two tanks.
Carbonate: Auger samples were not analyzed for CO,. The range in Table D3-1 results from the concentration in the supernatant sample being reported as "0.542," with no units provided. Because carbonate analyses were reported in the past both in terms of percent mass or molarity, two inventory values were generated: the lower inventory value is based on 0.542 percent CO,, and the upper inventory value is based on 0.542 M C 0 3 . The HTCE inventory falls within this range.
D-9
WHC-SD-WM-ER-559 Rev. 0
Fe
Si
NO3
NO*
so4
Bi
A1
CO, Na
With two modifying assumptions, the HTCE component inventories begin to compare favorably with the sampling-based inventories. First, assume all the PO4 in the LANL. defined waste stream precipitates, and second, assume the components dissolved in the interstitial liquid are diluted by a factor of 7. The resulting HTCE composition is compared to the auger sample composition on a dry weight percent basis in Table D3-2.
1.2 2.2
0.19 0.12
4.4 4.8
0.10 0.34
0.11 0.34
0.036 1.6
0.26 0.12
NR 2.6
38 38
Table D3-2. Comparison of Auger Sampling and Modified HTCE Component Inventories for Tank 241-T-109 Waste on a Dry Weight Percent Basis.
I
F 12.7 10.51 1
D-10
WHC-SD-WM-ER-559 Rev. 0
D4.0 DEFINE THE BEST-BASIS AND ESTABLISH COMPONENT INVENTORIES
The results from this evaluation support using the sampling data as the basis for the best estimate inventory for tank 241-T-109 for the following reasons:
1. The inventory estimate generated by the LANL model is based on a single defined salt waste stream (TlSltCk) and does not take into account any solids contributions and/or waste dilution effects from the 1,431 kL (378 kgal) of waste transferred from tank 241-T-108 to tank 241-T-109 in 1973. This 1,431 kL is not considered to be TlSltCk and most likely altered the composition of the 515 kL (136 kgal) of salt waste in the tank at that time.
Phosphate concentration values, which appear consistent for all analyzed segments, suggest that phosphates formed the bulk of the precipitated solids. The predicted concentration value for this major component is less than half the lower 95 percent confidence value. The LANL assumption that only 40 percent of the phosphate in the TI waste stream precipitates appears to be conservative.
2.
Best-basis inventory estimates for tank 241-T-109 are presented in Tables D4-1 and D4-2. While samples were analyzed for numerous analytes (refer to Table D2-1), only those detected in the waste are included in these tables. Table D4-1 provides an inventory estimate in terms of percent nonradioactive (expected) chemical species. Note that this waste is predominantly sodium phosphate and should not be mixed with waste types that could result in phosphate gels.
Best-basis component inventory estimates and the mean analytical concentrations that were used to calculate these component inventories are provided in Table D4-2. This table also includes 95 percent confidence intervals around the mean concentration value (refer to Appendix B for information regarding the statistical analysis of analytical data for tank 241-T-109). Note that inventory ranges are presented in Table D4-2 for N G , TIC as CO,, and SO,. These ranges result from the uncertainties associated with these components.
D-l l
WHC-SD-Wh4-ER-559 Rev. 0
Water
Sodium phosphate'
Sodium fluoride
Table D4-1. Best-Basis Inventory Estimate for Tank 241-T-109 (Percent Nonradioactive Chemical Species).
48
40 - 44
2.9
Sodium nitrate
Sodium nitrite*
2.9
0.074 - 2.3 I Sodium sulfate* 10.076 - 0.75 I Sodium carbonate3 0.48 - 1.8
Notes: 'Range Bccount8 for range in sodium sulfate, sodium nitrite, and sodium carbonate inventories; refer to (2) and (3) below.
2Low value based on auger sample analysis; high value based on 1974 supernatant analysis.
'Low value based on 0.542 percent CO, in supernatant sample, and high value based on 0.542 M COY
D-12
€1-a
0 6Ss-xs-m-aS-3HM
WHC-SD-WM-ER-559 Rev. 0
D5.0 APPENDIX D REFERENCES
Agnew, S. F., J. Boyer, R. A. Corbin, T. B. D u m , J. R. Fitzpatrick, K. A. Jurgensen, T. P. Ortiz, and B. L. Young, 1996, Hanford Chemical and Radionuclide Inventories: HDW Model Rev. 3, LA-UR-96-858, Los Alamos National Laboratory, Los Alamos, New Mexico.
Brevick, C. H., L. A. Gaddis, and E. D. Johnson, 1995, Historical Tank Content Estimate for the Northwest Quadrant of the Hanford 200 East Areas, WHC-SD-WM-ER-351, Rev. 0, Westinghouse Hanford Company, Richland, Washington.
Conner, J. M., 1995, Final Report for Tank 241-T-109, Auger Samples 95-AUG-040 and 95-AUG-041, WHC-SD-WM-DP-144, Rev. 1-A, Westinghouse Hanford Company, Richland, Washington.
Hanlon, B. M., 1996, Waste Tank Summary Repon for Month Ending April 30,1996, WHC-EP-0182-97, Westinghouse Hanford Company, Richland, Washington.
Kupfer, M. J., M. D. LeClair, W. W. Schulz, and L. W. Shelton, 1995, Work Plan for Deflning a Standard Inventory Estimate for Wastes Stored in Hanford Site Underground Tanks, WHC-SD-WM-WP-311, Rev. 0, Westinghouse Hanford Company, Richland, Washington.
Sant, W. H., 1974, Analysis of Tank Farm Samples, Sample: T-2289, Tank IOPT, (internal memorandum to R. L. Walser, March 13), Atlantic Richfield Hanford Company, Richland, Washington.
D-15
WHC-SD-WM-ER-559 Rev. 0
This page intentionally left blank.
D-16
WHC-SD-WM-ER-559 Rev. 0
APPENDIX E
BIBLIOGRAPHY FOR TANK 241-T-109
E- 1
WHC-SD-Wh4-ER-559 Rev. 0
This page intentionally left blank.
E-2
WHC-SD-WM-ER-559 Rev. 0
APPENDIX E
BIBLIOGRAPHY FOR TANK 241-T-109
Appendix E provides a bibliography of information that supports the characterization of tank 241-T-109. This bibliography represents an in-depth literature search of all known information sources that provide sampling, analysis, surveillance, and modeling information, as well as processing occurrences associated with tank 241-T-109 and its respective waste types.
The references in this bibliography are separated into three broad categories containing references broken down into subgroups. These categories and their subgroups are listed below.
I.
II.
m.
NON-ANALYTICAL DATA
Ia. ModelslWaste Type InventorieslCampaign Information Ib. Fill History/Waste Transfer Records IC. SurveillancelTank Configuration Id. Sample PlanninglTank Prioritization Ie. Data Quality ObjectiveslCustomers of Characterization Data
ANALYTICAL DATA - SAMPLING OF TANK WASTE AND WASTE TYPES
IIa. Sampling of tank 241-T-109 IIb. IIc. Sampling of TBP-Salt Mixtures
Sampling of 242-T Evaporator Streams
COMBINED ANALYTICAL/NON-ANALYTICAL DATA
IIIa. Inventories using both Campaign and Analytical Information IIIb. Compendium of Existing Physical and Chemical Documented Data Sources
This bibliography is broken down into the appropriate sections of material to use, with an annotation at the end of each reference describing the information source. Where possible, a reference is provided for information sources. A majority of the information listed below may be found in the Westinghouse Hanford Company Tank Characterization Resource Center.
E-3
WHC-SD-WM-ER-559 Rev. 0
I. NON-ANALYTICAL DATA
Ia. ModelslWaste Type InventorieslCampaign Information
Anderson, J. D., 1990, A History of the 200 Area Tank F a m , WHC-MR-0132, Westinghouse Hanford Company, Richland, Washington.
Document contains single-shell tank fill history and primary campaignlwaste type information up to 1981.
Jungfleisch, F. M. and B. C. Simpson, 1993, Preliminary Estimdon of the Waste Inventon'es in Hanford Tankr Through 1980, WHC-SD-WM-TI-057 Rev. 0-A, Westinghouse Hanford Company, Richland, Washington.
A model based on process knowledge and radioactive decay estimations using ORIGEN for different compositions of process waste streams assembled for total, solution, and solids compositions per tank. Assumptions about wastelwaste types and solubility parameterslconstraints are also given.
Schneider, K. J., 1951, Flow Sheet and Flow Diagrams of Precipitation Separations Process, HW-23043, General Electric Company, Richland, Washington.
Document contains compositions of first concentration cycle waste before transfer to 200E waste tanks.
Ib. Fill HistorylWaste Transfer Records
Agnew, S . F., 1995, Tank Layer Model (lZM), Rev I for Northeast, Southwest, and Northwest Quadrants, LA-UR-94-4269, Rev. 1, Los Alamos National Laboratory, Los Alamos, New Mexico.
Document predicts volumes of waste type layers in single-shell tanks.
Agnew, S. F., R. A. Corbin, T. B. Duran, K. A. Jurgensen, T. P. Ortiz, and B. L. Young, 1994, Waste Status and Transaction Record Summary for the Northwest Quadrant of the Hanford 200 East Area, WHC-SD-WM-TI-669, Rev. 1, Los Alamos National Laboratory, Los Alamos, New Mexico.
Document contains spreadsheets depicting all available data on tank additionsltransfers.
E-4
WHC-SD-WM-ER-559 Rev. 0
Anderson, J. D., 1990, A History of the 200 Area Tank Farms, WHC-MR-0132, Westinghouse Hanford Company, Richland, Washington.
0 Document contains single-shell tank fill history and primary campaignlwaste type information up to 1981.
IC. Surveillance/Tank Configuration
Alstad, A. T., 1993, Riser ConJguraion Document for Single-Shell Waste Tanks, WHC-SD-RE-TI-053, Rev. 9, Westinghouse Hanford Company, Richland, Washington.
0 Document shows tank riser locations in relation to tank aerial view as well as a description of riser and its contents.
Lipnicki, J., 1995, Waste Tank Risers Available for Sampling, WHC-SD-WM-TI-710, Rev. 1, Westinghouse Hanford Company, Richland, Washington.
Document gives an assessment of riser locations for each tank, however not all tanks are included/completed. Also included is an estimate of what risers are available for sampling.
Id. Sample Planning/Tank Prioritization
Brown, T. M., S. J. Eberlein, and T. J. Kunthara, 1995, Tank Waste Characterization Basis, WHC-SD-WM-TA-164, Rev. 1, Westinghouse Hanford Company, Richland, Washington.
Document that summarizes the technical basis for characterizing the waste in the tanks and assigns a priority number to each tank.
Conner, J. M., 1995, Tank 241-T-109 Tank Charactenmion Plan, WHC-SD-WM-TP-368, Rev. 0, Westinghouse Hanford Company, Richland, Washington.
Document discusses any and all relevant DQOs and how they will be met for tank 241-T-109.
Conner, J. M., 1995, Tank 241-T-109 Auger Sampling and Analysis Plan, WHC-SD-WM-TSAP-014, Rev. 0-A, Westinghouse Hanford Company, Richland, Washington.
Document contains detailed sampling and analysis procedure information for tank 241-T-109 based on applicable DQOs.
E-5
WHC-SD-WM-ER-559 Rev. 0
Comer, J. M., 1995, Need identified to Resample Tank 241-T-109, (internal memo #75310-95-098 to T. J. Kelley, October 24), Westinghouse Hanford Company, Richland, Washington.
Memo summarizes 1995 decision to take additional samples from tank 241-T-109 to meet Safety Screening DQO needs.
Grimes, G . W., 1977, Hanford Long-Term Defense High-Level Waste Management Program Waste Sampling and Characterization Plan, RHO-CD-137, Rockwell Hanford Operations, Richland, Washington.
Early characterization planning document.
Homi, C. S., 1995, FY 19% Tank Waste Analysis Plan, WHC-SD-Wh4-PLN-101, Rev. 0, Westinghouse Hanford Company, Richland, Washington.
Document contains Tri-Party Agreement (see Ecology et al. 1994 listing in Section 5.0) requirement-driven TWRS Characterization Program information and a list of tanks addressed in fiscal year 1996.
Winters, W. I., L. Jensen, L. M. Sasaki, R. L. Weiss, J. F. Keller, A. J. Schmidt, and M. G. Woodruff, 1989, Waste Characterization Plan for the Hanford Site Single-Shell Tanks, WHC-EP-0210, Westinghouse Hanford Company, Richland, Washington.
Early version of characterization planning document.
Ie. Data Quality Objectives (DQO) and Customers of Characterization Data
Dukelow, G. T., J. W. Hunt, H. Babad, and J. E. Meacham, 1995, Tank Safety Screening Data Quality Objective, WHC-SD-WM-SP-004, Rev. 2, Westinghouse Hanford Company, Richland, Washington.
DQO used to determine if tanks are under safe operating conditions.
Kupfer, M. J., W. W. Schultz, G. L. Borsheim, S. J. Eberlein, B. C. Simpson, and J. T. Slankas, 1994, Strategy for Sampling Hanford Site Tank Wastes for Development of Disposal Technology, WHC-SD-WM-TA-154, Westinghouse Hanford Company, Richland, Washington.
Document provides basis for selection of tanks for disposal needs.
E-6
WHC-SD-WM-ER-559 Rev. 0
Simpson, B. C., and D. J. McCain, 1995, Historical Model Evaluation Data Requiremems, WHC-SD-WM-DQO-018, Rev. 0-A, Westinghouse, Hanford Company, Richland, Washington.
Document provides data needs for evaluating the LANL model for estimating tank waste compositions.
Slankas, T. J., M. J. Kupfer, and W. W. Schulz, 1995, Datu Needs and Attendant Data Quality Objectives for Tank W a t e Pretreatment and Disposal, WHC-SD-WM-DQO-022, Rev. 0, Westinghouse Hanford Company, Richland, Washington.
Documents the needs of the pretreatment function within TWRS.
II. ANALYTICAL DATA - SAMPLING OF TANK WASTE AND WASTE TYPES
IIa. Sampling of tank 241-T-109
Conner, J. M., 1995, Rnal Report for Tank 241-T-109, Auger Samples 95-AUGMO and 95-AUG041, WHC-SD-WM-DP-144, Rev. 1-A, Westinghouse Hanford Company, Richland, Washington.
Document contains sample analyses from 1995 tank 241-T-109 auger sampling event.
Conner, J. M., 1995, Immediate Notijkation: Violarion of Limits for Moisture Content for Samples from Tank 241-T-109, (internal memo #75310-95-078 to R. J. Cash, September 21), Westinghouse Hanford Company, Richland, Washington.
Memo provides sample analysis results that fall outside of acceptable range (Notification limit: < 17 percent moisture) for tank 241-T-109.
Cromar, R. D., 1995, 95% ConJdence Intervals for Tank T-109, (internal memo #75764-PCS95-083 to J. M. Conner, September 27), Westinghouse Hanford Company, Richland, Washington.
Memo provides one-sided confidence intervals on 1995 auger data to support the safety screening DQO.
E-7
WHC-SD-WM-ER-559 Rev. 0
Sant, W. H., 1974 Analysis of Tank Farm Samples, Sample: T-2289, Tank ]OPT, (letter to R. L. Walser, March 13), Atlantic Richfield Hanford Company, Richland, Washington.
Internal letter provides analyses of supernatant sample from February 9, 1974 sampling.
1
IIb. Sampling of 242-Evaporator Waste Streams
All the information in this section is documented in Process Aids 1970 - 1993. Process Aids is a consecutive compilation of laboratory memos, letters, etc. indexed by year then by subject and/or tank. The following analyses may provide insight as to the composition of TlSltCk waste type expected to be in tank 241-T-109.
Buckingham, J. S., 1972, Interim Repon III: Nitric Acid Neutralization and Concentration of Caustic Waste SolUrions - 242-T Evaporator Feed, ARH-2529, Atlantic Richfield Hanford Company, Richland, Washington.
Buckingham, J. S., 1972, Nitric Acid Neutralization and Concentration of 242-T Evaporator Recycle Feed, (internal letter, Process Aids #00256, to W. P. Metz, May 12), Atlantic Richfield Hanford Company, Richland Washington.
Buckingham, J. S. and D. A. Dodd, 1972, Nitric Acid Neutralization and Concentration of Synthetic Recycle Waste Solution, (internal letter, Process Aids #00263, to D. J. Larkin, July 17), Atlantic Richfield Hanford Company, Richland, Washington.
Puryear, D. A., 1970, Solubility of 242-T Evaporator Process Feed and Concentrate, (internal letter, Process Aids #00088, to M. C. Fraser, December 9), Atlantic Richfield Hanford Company, Richland, Washington.
Puryear, D. A. and J. S. Buckingham, 1971, Status Repon on Waste Solid@cation Studies and Separations Chemistry Laboratory, (internal letter, Process Aids #00362, to M. H. Campbell, July 23), Atlantic Richfield Hanford Company, Richland, Washington.
IIc. Sampling of TBP-Salt Mixtures
Barney, G. S , 1970, l7zermoanalysis of TBP-Salt Mixtures, (internal letter, Process Aids #00209, to D. S. Thurman, December lo), Atlantic Richfield Hanford Company, Richland, Washington.
This letter is documented in Process Aids 1970 - 1993.
E- 8
WHC-SD-WM-ER-559 Rev. 0
III. COMBINED ANALYTICALINON-ANALYTICAL DATA
IIIa. Inventories from Campaign and Analytical Information
Agnew, S . F., J. Boyer, R. A. Corbin, T. B. Duran, J. R. Fitzpatrick, K. A. Jurgensen, T. P. Ortiz, and B. L. Young, 1995, Hanford Tank Chemical and Radionuclide Inventories: HDW Rev. 3, LA-UR-96-858, Rev. 0, Los Alamos National Laboratory, Los Alamos, New Mexico.
Document contains waste type summaries as well as primary chemical compound/analyte and radionuclide estimates for sludge, supernatant, and solids.
Allen, G. K . , 1976, Estimated Inventory of Chemicals Added to Underground Waste Tanks, 1944 - 1975, ARH-CD-601B, Atlantic Richfield Hanford Company, Richland, Washington.
Document contains major components for waste types, and some assumptions. Purchase record are used to estimate chemical inventories.
Allen, G. K., 1975, Hanford Liquid Waste Inventory As Of September 30, 1974, ARH-CD-229, Atlantic Richfield Hanford Company, Richland, Washington.
Document contains major components for waste types, and some assumptions
Brevick, C. H., L. A. Gaddis, and E. D. Johnson, 1995, Historical Tank Content Estimate for the Northwest Quadraru of the Hanford 200 Areas, WHC-SD-MW-ER-351, Rev. 0, Westinghouse Hanford Company, Richland, Washington.
Document contains summary information from the supporting document as well as in-tank photo collages and the solid composite inventory estimates Rev. 0 and Rev. OA.
Brevick, C. H., L. A. Gaddis, and W. W. Pickett, 1995, Supporting Document for the Historical Tank Content Estimate for T Tank Farm, WHC-SD-WM-ER-320, Rev. 0, Westinghouse Hanford Company, Richland, Washington.
Document contains summary tank farm and tank write-ups on historical data and solid inventory estimates as well as appendices for the data. The appendices contain the following information: Appendix C - Level History AutoCAD sketch; Appendix D - Temperature Graphs; Appendix E -
E-9
WHC-SD-WM-ER-559 Rev. 0
Surface Level Graph; Appendix F, pg F-1 - Cascade/ Drywell Chart; Appendix G - Riser Configuration Drawing and Table; Appendix I - In-Tank Photos; and Appendix K - Tank Layer Model Bar Chart and Spreadsheet.
IIIb. Compendium of data from other sources physical and chemical
Agnew, S. F., and J. G. Watkin, 1994, Estimation of Limiting Solubilities for Ionic Species in Hanford Waste Tank Supernates, LAUR-94-3590, Los Alamos National Laboratory, Los Alamos, New Mexico.
Document gives solubility ranges used for key chemical and radionuclide components based on supernatant sample analyses.
Brevick, C. H., L. A. Gaddis, and E. D. Johnson, 1995, Tank Waste Source Term Inventory Validation, Vol I & II., WHC-SD-WM-ER-400, Rev. 0, Westinghouse Hanford Company, Richland, Washington.
Document contains a quick reference to sampling information in spreadsheet or graphical form for 23 chemicals and 11 radionuclides for all the tanks.
Hanlon, B. M., 1996, Waste Tank Summary Repon for Month Ending April 30, 1996, WHC-EP-0182-97, Westinghouse Hanford Company, Richland, Washington.
These documents contain a monthly summary of: fill volumes, Watch List tanks, occurrences, integrity information, equipment readings, equipment status, tank location, and other miscellaneous tank information.
Husa, E. I., 1993, Hanford Site Waste Storage Tank Information Notebook, WHC-EP-0625, Westinghouse Hanford Company, Richland, Washington.
Document contains in-tank photos as well as summaries on the tank description, leak detection system, and tank status.
Husa, E. I., 1995, Hanford Waste Tank Preliminary Dryness Evaluation, WHC-SD-WM-TI-703, Rev. 0, Westinghouse Hanford Company, Richland, Washington.
Document gives assessment of relative dryness between tanks.
E-10
To
D i s t r i b u t i o n From Page 1 of 4
Data Assessment and Date 09/05/96 I n t e r p r e t a t i o n
OFFSITE
Project Titleiwork Order
Tank Charac te r i za t i on Report f o r S ing le -She l l Tank 241-T-109, WHC-SD-WM-ER-559. Rev. 0
Sandia Nat ional Laboratory P . O . Box 5800 MS-0744. Dept. 6404 Albuquerque, NM 87815
EDT NO. EDT-617544 ECN N ~ . N/A
D. Powers
Name
Nuclear Consul t inq Serv ices I n c . P . 0. Box 29151 Columbus, OH 43229-01051
Text Text Only Attach./ EDT/ECN
MSlN With All Appendix Only Attach. Only
J. L. Kovach
Chemical Reaction Sub-TAP P . O . Box 271 Lindsborg, KS 67456
B. C . Hudson
Tank Charac te r i za t i on Panel Senior Technical Consul tant
X
X
X
Contech 7309 Ind ian School Road Albuquerque, NM 87110
J. A r v i s u X
U. S. Department o f Enerqv - Headauarters O f f i c e o f Environmental Res to ra t i on and Waste Management EM-563 12800 Middlebrook Road Germantown, MD 20874
J. A. P o p p i t t i X
Jacobs Enqineer inq Group 85 - 36 X
A-6000-135 (01193) WEF067
I Data Assessment and I n t e r o r e t a t i on
Date 09/05/96
- SAIC 20300 Century Boulevard, S u i t e 200-6 Germantown, MD 20874
H. S u t t e r
555 Quince Orchard Rd. , S u i t e 500 Gai thersburg. MO 20878
P . Szerszen
Project TitMWork Order
Tank Charac te r i za t i on Report f o r S ing le -She l l Tank 241-T-109. WHC-SO-WM-ER-559. Rev. 0
Los Alamos Laboratorv
P . 0. Box 1663 Los A1 amos , NM 87545
CST-14 MS-J586
EDT NO. EDT-617544 ECN NO. N / A
S . F . Agnew (4 )
Los Alamos Technical Associates
T. T. Tran
Oqden Envi ronmental 101 East Wel ls ian Way Rich land. WA 99352
R. J. Anema
Name
CH2M H i l l P . 0. Box 91500 Bel 1 evue, WA 98009-2050
Text Text Only Attach./ EDT/ECN MSlN With All Appendix Only
Attach. Only
M . McAfee
Tank Advisorv Panel 102 Windham Road Oak Ridge, TN 37830
0 . 0. Campbell
X
61-44 X
X
A-6000.135 (01/93) UEF067
DISTRIBUTION SHEET To
D i s t r i b u t i o n From Page 3 of 4
Data Assessment and Date 09/05/96 I n t e r p r e t a t i o n
ONSITE
Department o f E n e r w - Rich land Operations
Project TitleMlork Order
Tank Charac te r i za t i on Report f o r S ing le-Shel l Tank 241-T-109, WHC-SD-WM-ER-559. Rev. 0
J . F. Thompson W . S . L i o u N . W . W i l l i s
EDT NO. EDT-617544 ECN N ~ . N/A
ICF-Kaiser Hanford Company
R. L . Newel1
P a c i f i c Northwest Laboratory
N . G. Col ton
Name
J. R. Gormsen S . A. H a r t l e y J. G . H i l l G . J . Lumetta
Text Text Only Attach./ EDT/ECN MSlN With All Appendix Only
Attach. Onlv
A. F. Noonan
Westinshouse Hanford ComDany
H. Babad D. A. Barnes G. R. Bloom T. M. Brown W . L . Cowley L. A. Diaz G. L . Dunford E . J . Eber le in D. B . Engelman J. S . G a r f i e l d J. D. Guberski D. L . H e r t i n g D. C . Hetzer G. Jansen G. D. Johnson T. J. K e l l e y N. W . K i r c h M. J. Kupfer J. E . Meacham
Data Assessment and Date 09/05/96 I n t e r p r e t a t i o n
Name
Proiect Title/Work Order
Text Text Only Attach./ EDT/ECN With All Appendix Only I MSIN I Attach. I I Onlv I
EDT NO. EDT-617544
~
Westinqhouse Hanford Comuanv cont inued
W . C . M i l l e r C . T. Narquis D. E . Place D. A. Reynolds L . M . Sasaki (3) L . W . Shel ton. Jr . 6. C . Simpson G . L . Troyer L . R. Webb K. A. White
Tank Charac te r i za t i on Report f o r S ing le -She l l Tank 241-T-109. WHC-SD-WM-ER-559, Rev. 0
Centra l F i l e s EDMC ERC (Environmental Resource Center) TCRC (10)


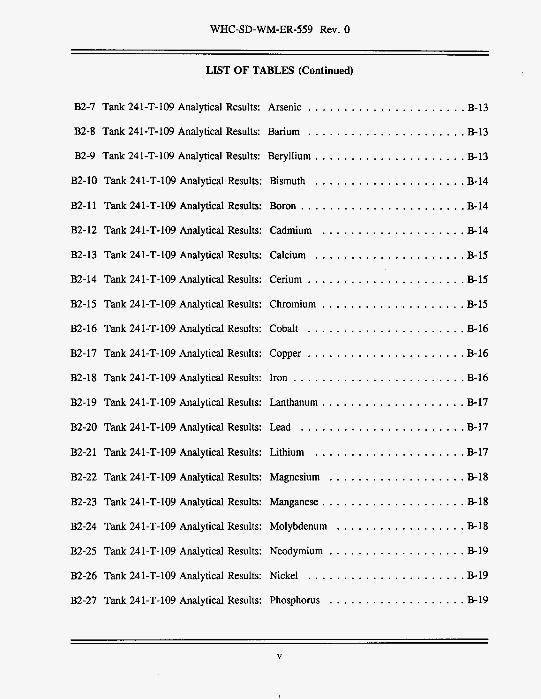
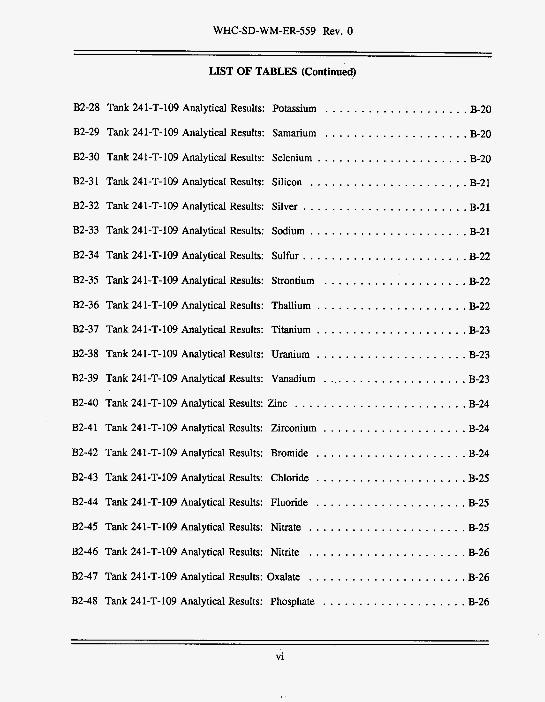


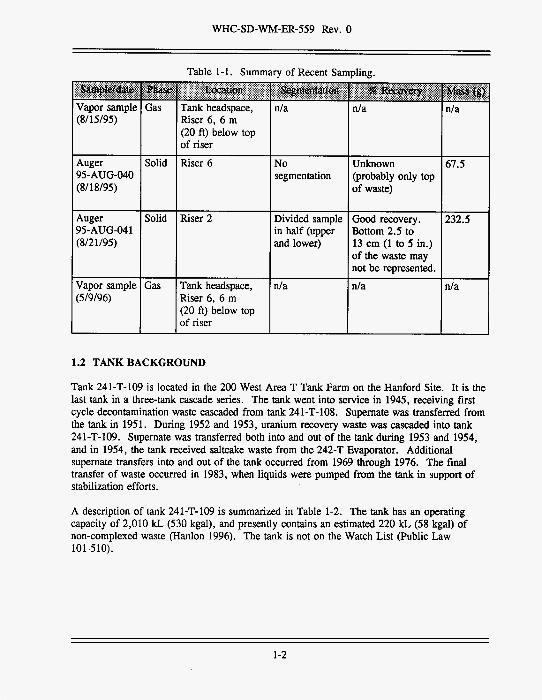


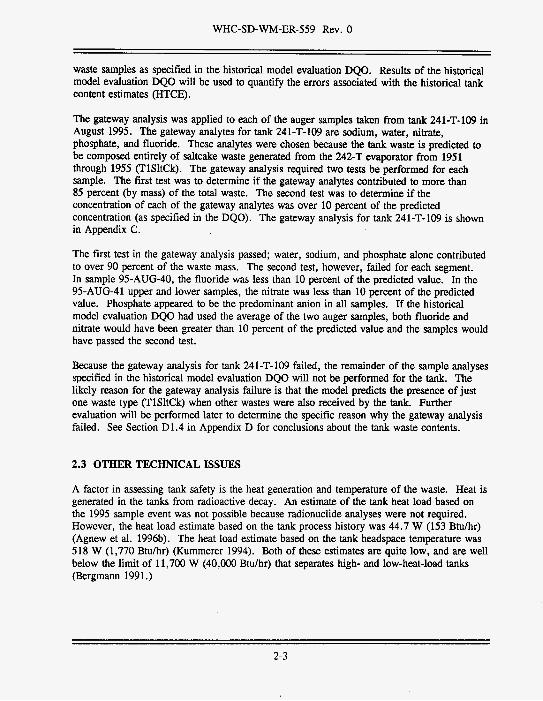


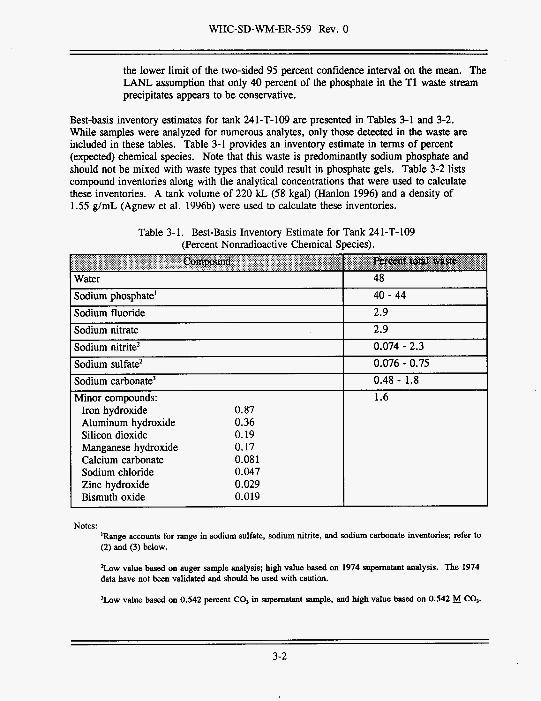


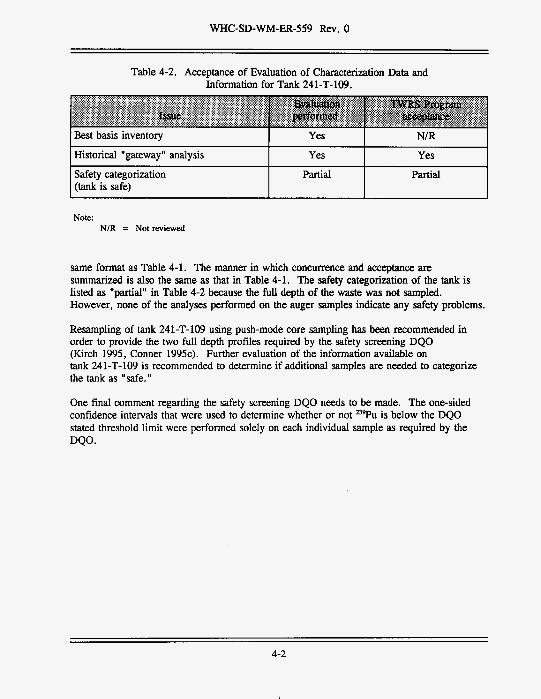

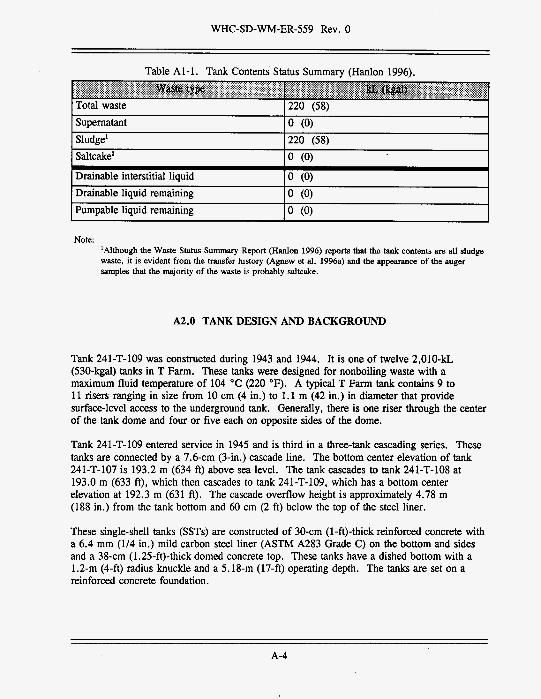


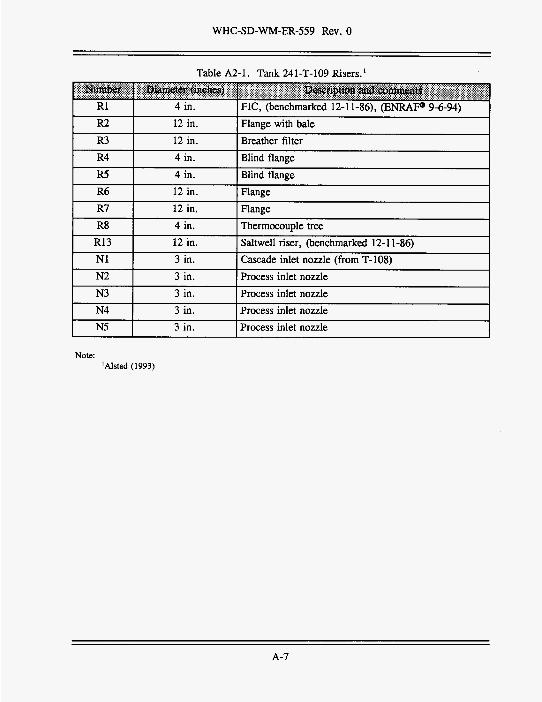
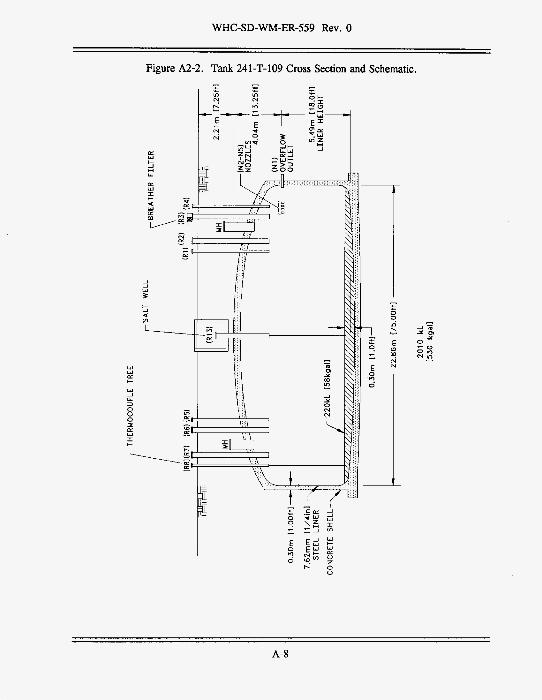

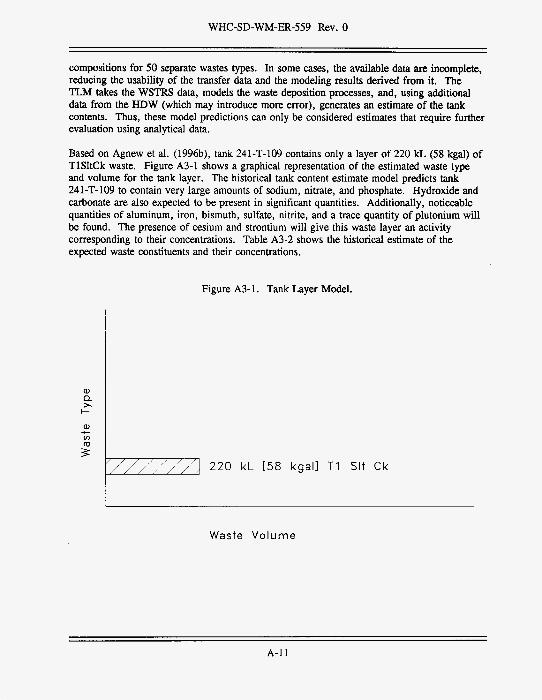
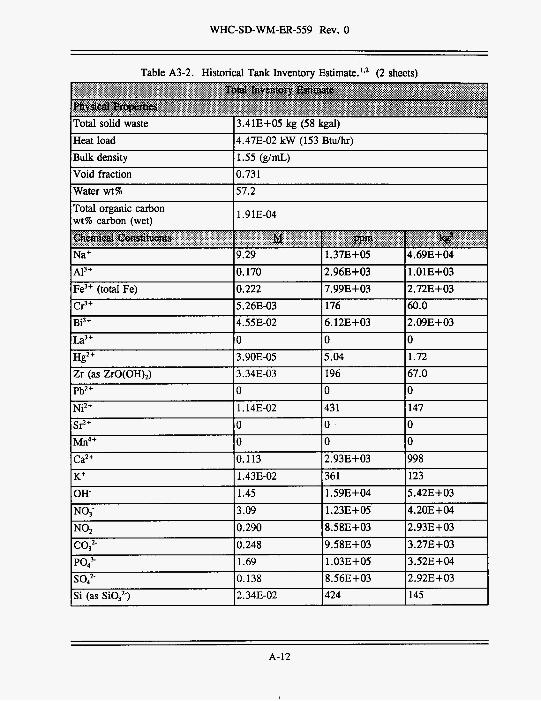
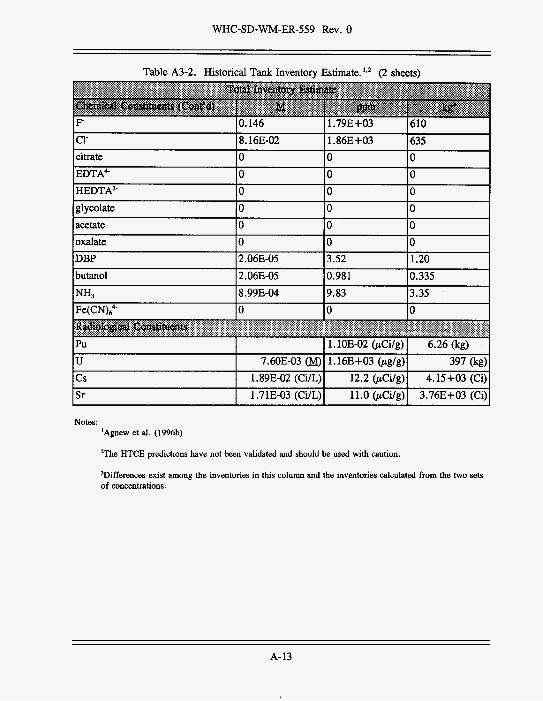

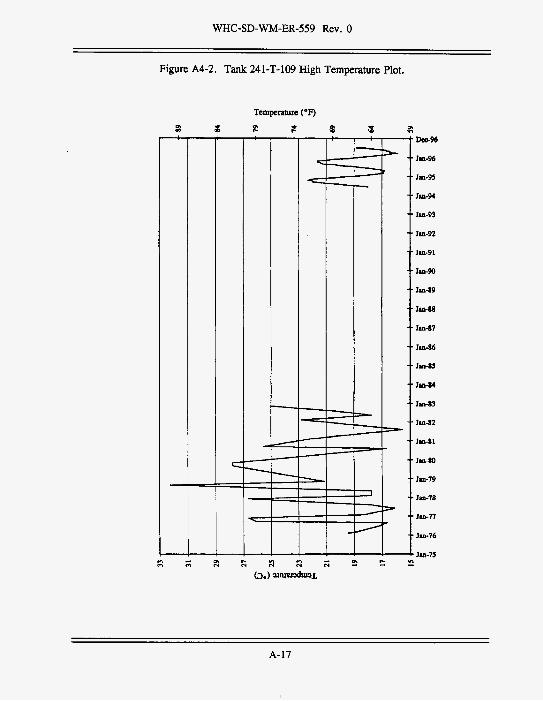


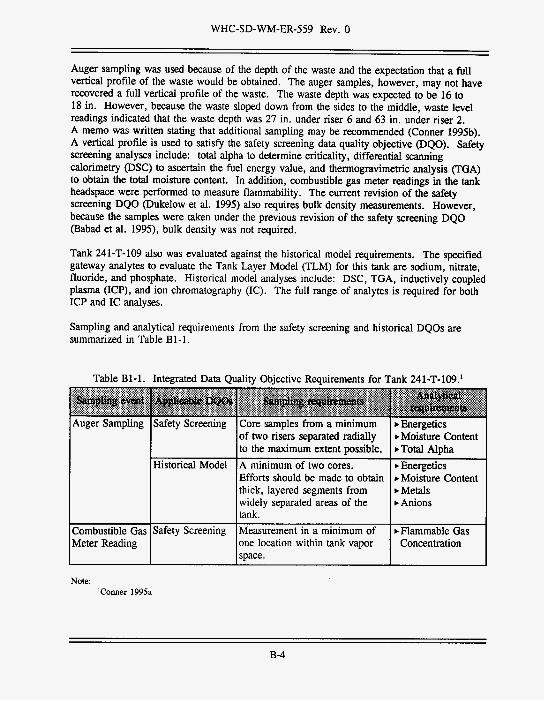


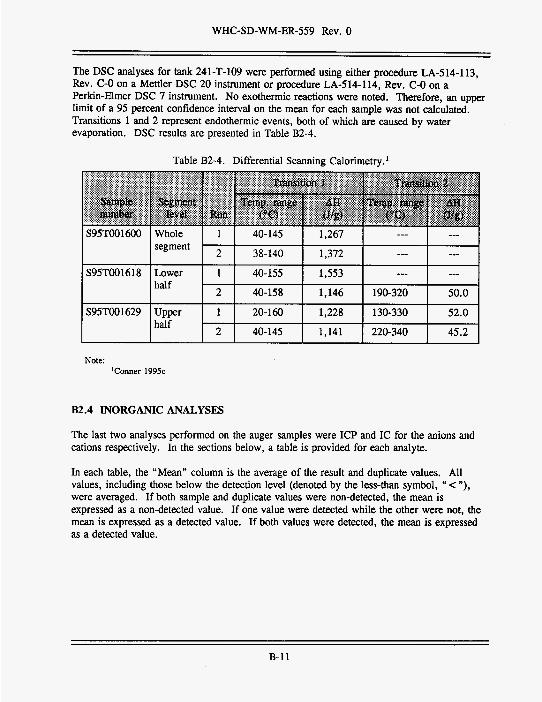
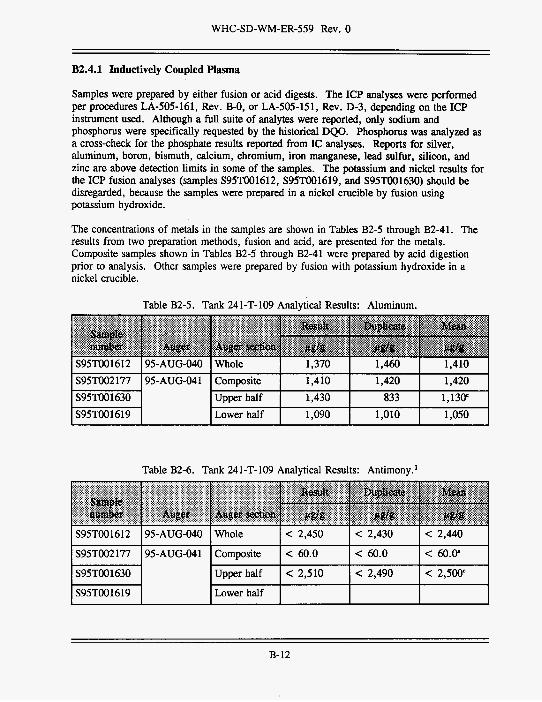


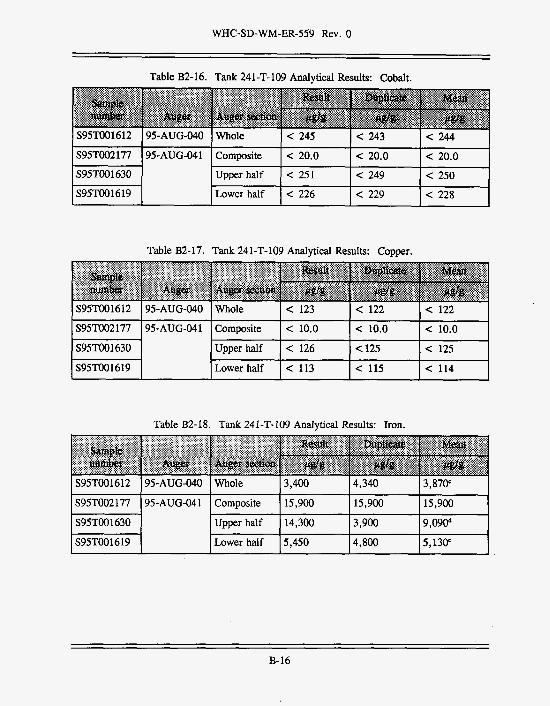

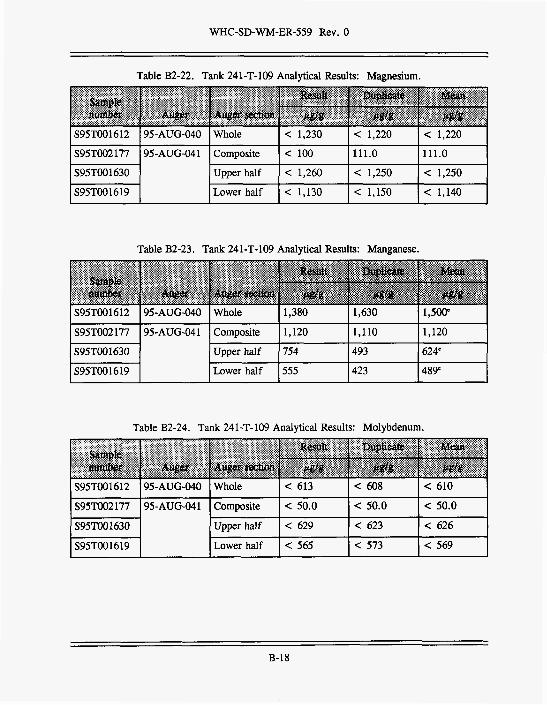


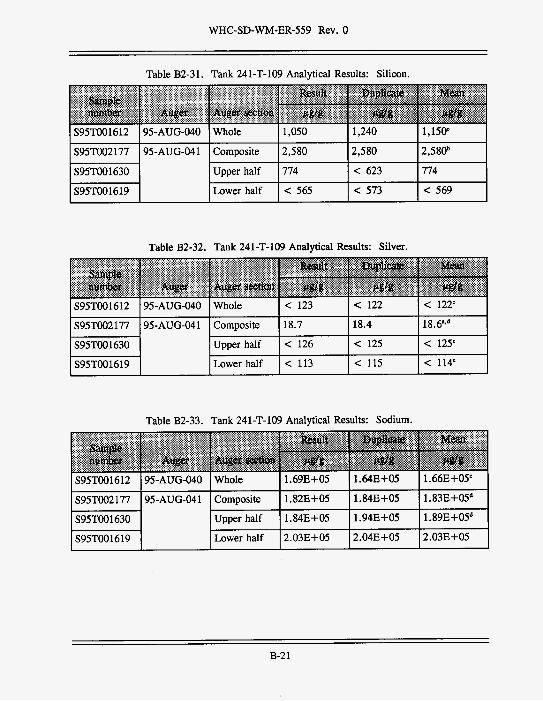


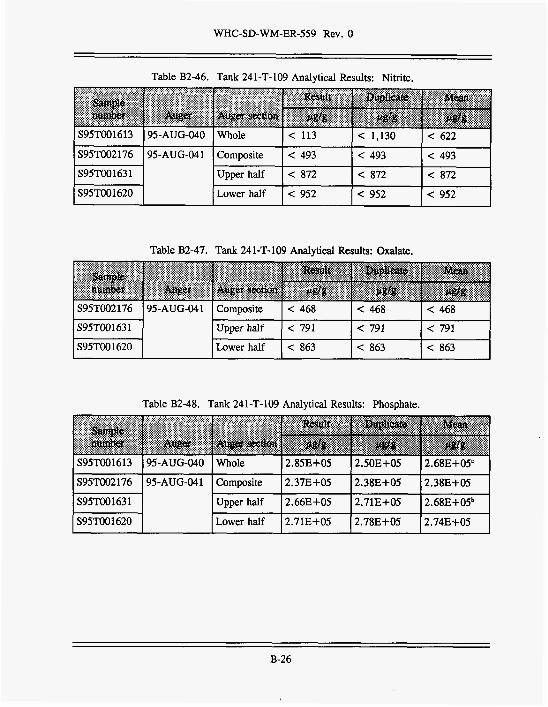
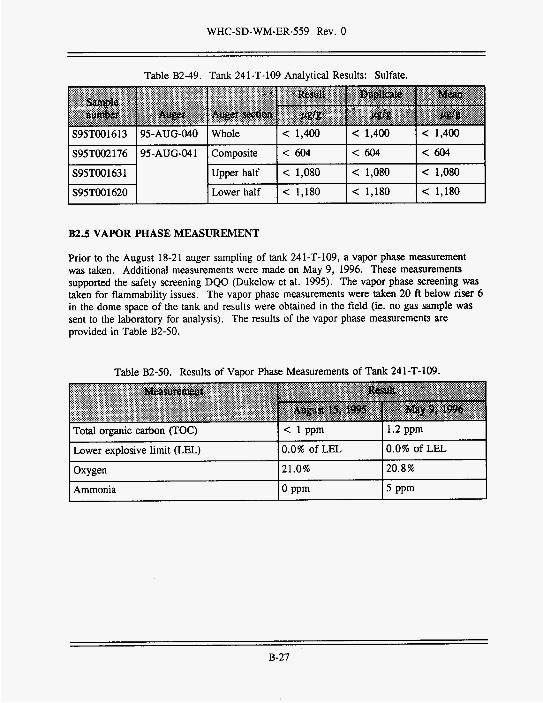
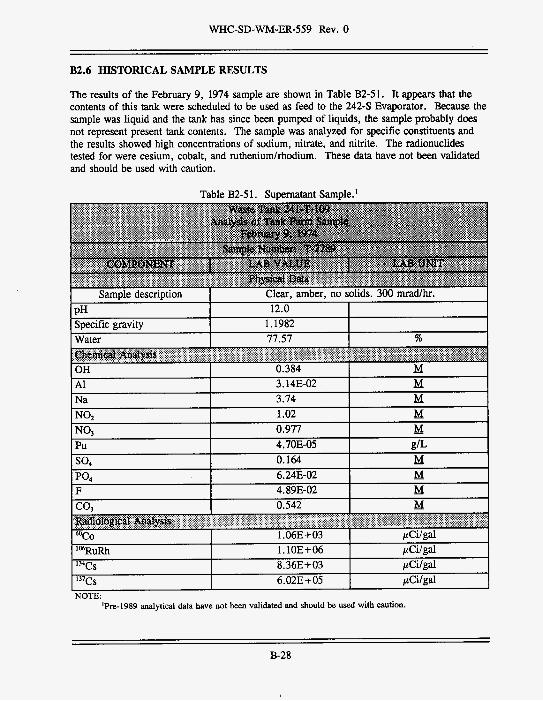


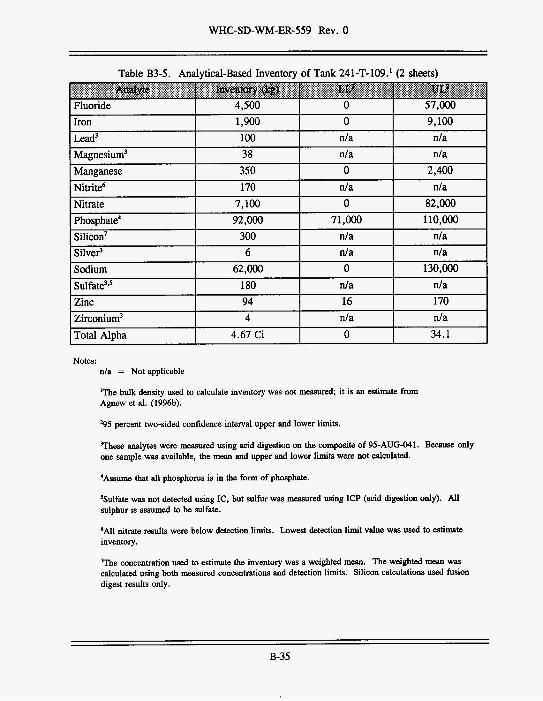


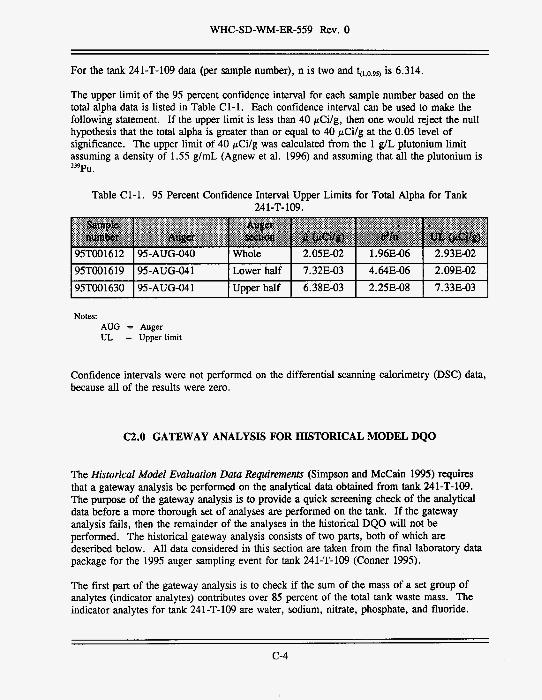


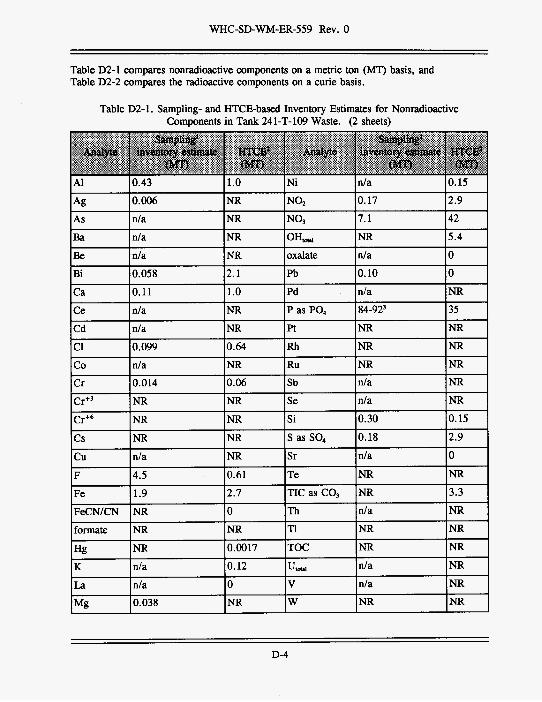


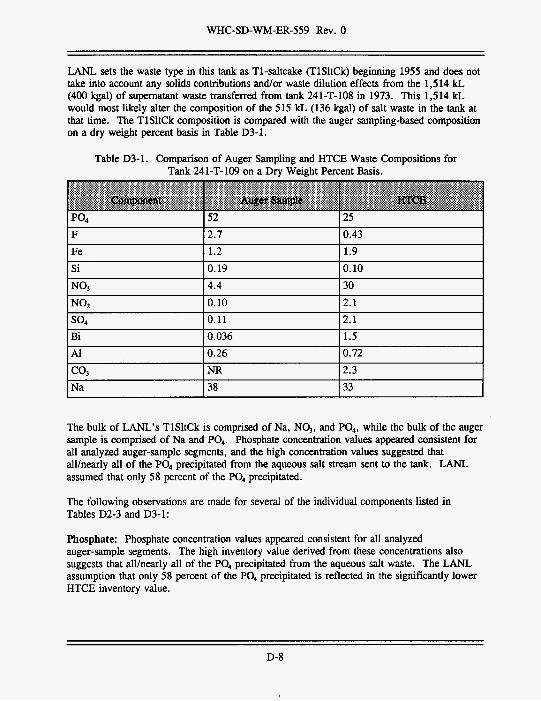


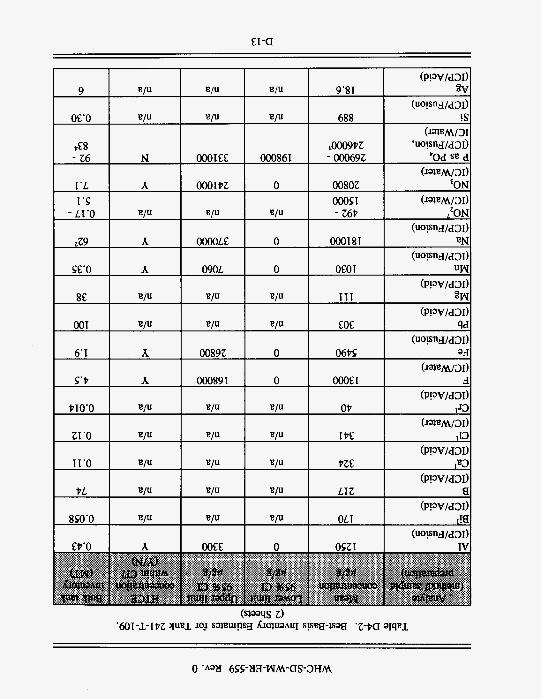


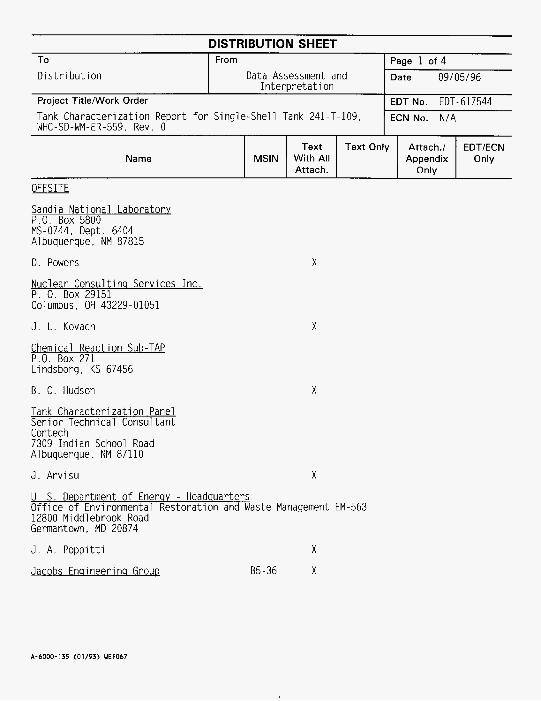


![arXiv:math/9608202v1 [math.CV] 5 Sep 1996 · arXiv:math/9608202v1 [math.CV] 5 Sep 1996 EFFECTIVE FORMULAS FOR INVARIANT FUNCTIONS – CASE OF ELEMENTARY REINHARDT DOMAINS Peter Pflug](https://static.documents.pub/doc/80x56/5f59727e12e494471619d2bc/arxivmath9608202v1-mathcv-5-sep-1996-arxivmath9608202v1-mathcv-5-sep-1996.jpg)


