52
Sequences Alignment Statistics Ka-Lok Ng Asia University
| Date post: | 19-Dec-2015 |
| Category: |
Documents |
| View: | 217 times |
| Download: | 2 times |

Sequences Alignment Statistics
Ka-Lok Ng
Asia University
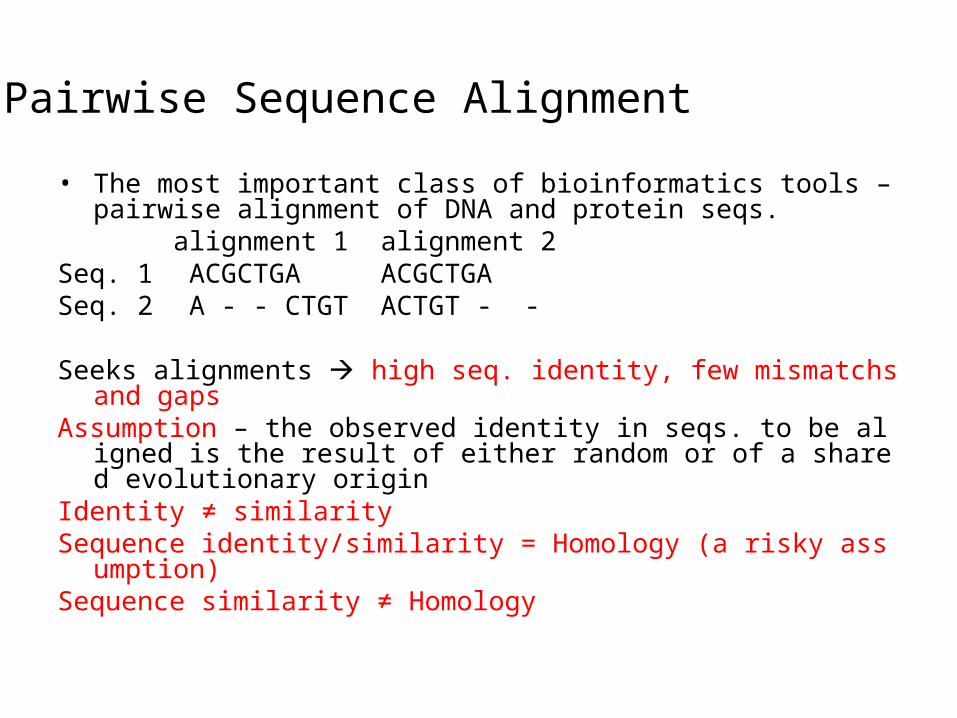
• The most important class of bioinformatics tools – pairwise alignment of DNA and protein seqs. alignment 1 alignment 2
Seq. 1 ACGCTGA ACGCTGASeq. 2 A - - CTGT ACTGT - -
Seeks alignments high seq. identity, few mismatchs and gapsAssumption – the observed identity in seqs. to be aligned is the result o
f either random or of a shared evolutionary originIdentity ≠ similaritySequence identity/similarity = Homology (a risky assumption)Sequence similarity ≠ Homology
Pairwise Sequence Alignment
Pairwise Sequence Alignment
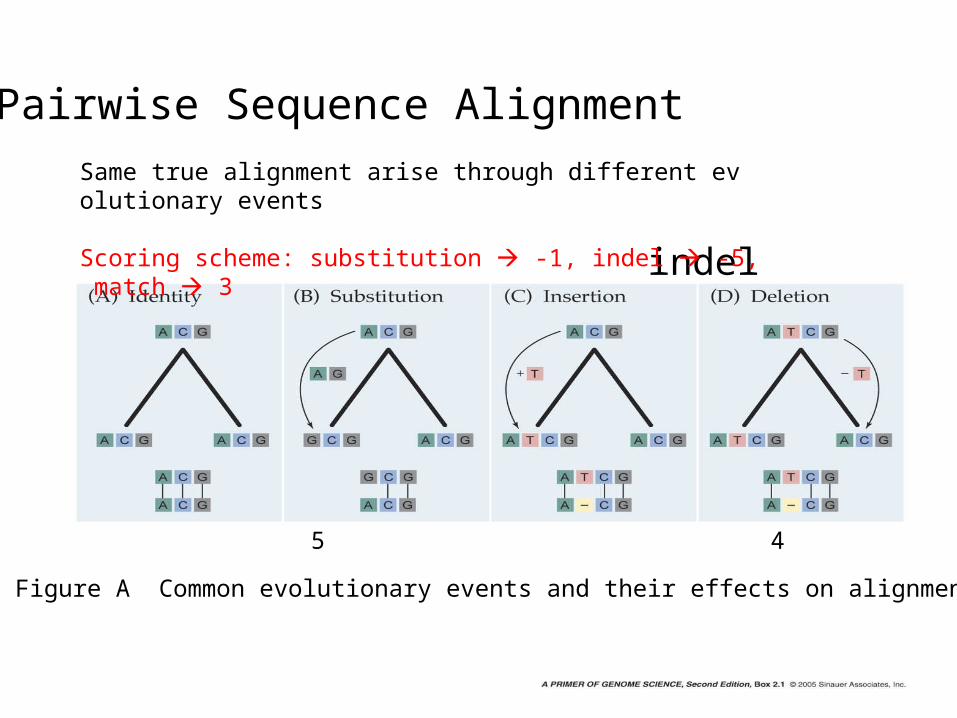
Figure A Common evolutionary events and their effects on alignment
indel
Same true alignment arise through different evolutionary events
Scoring scheme: substitution -1, indel -5, match 3
Score 9 5 4 4
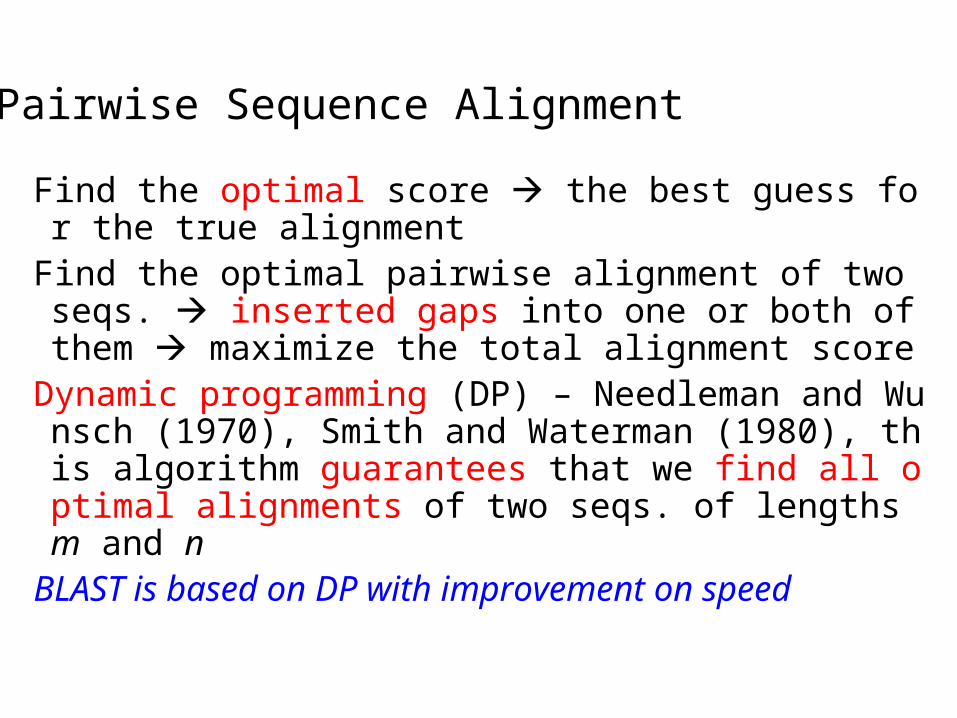
Find the optimal score the best guess for the true alignment
Find the optimal pairwise alignment of two seqs. inserted gaps into one or both of them maximize the total alignment score
Dynamic programming (DP) – Needleman and Wunsch (1970), Smith and Waterman (1980), this algorithm guarantees that we find all optimal alignments of two seqs. of lengths m and n
BLAST is based on DP with improvement on speed
Pairwise Sequence Alignment
Pairwise Sequence Alignment
),()1,(
),(),1(
),()1,1(
max),(
jcjiS
icjiS
jicjiS
jiS
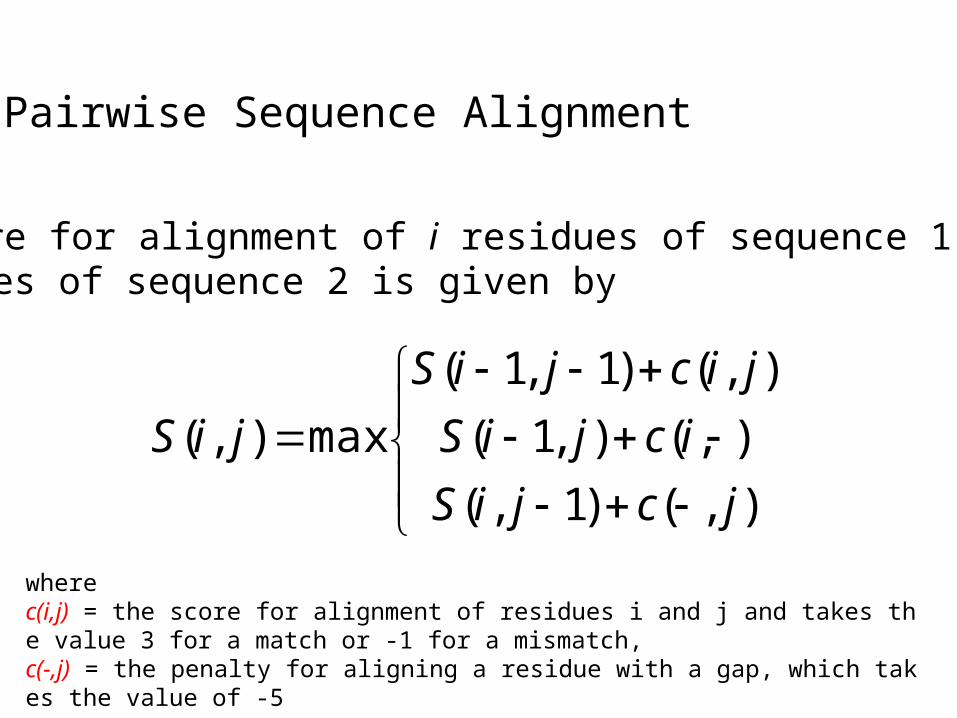
The score for alignment of i residues of sequence 1 against j residues of sequence 2 is given by
where c(i,j) = the score for alignment of residues i and j and takes the value 3 for a match or -1 for a mismatch,c(-,j) = the penalty for aligning a residue with a gap, which takes the value of -5
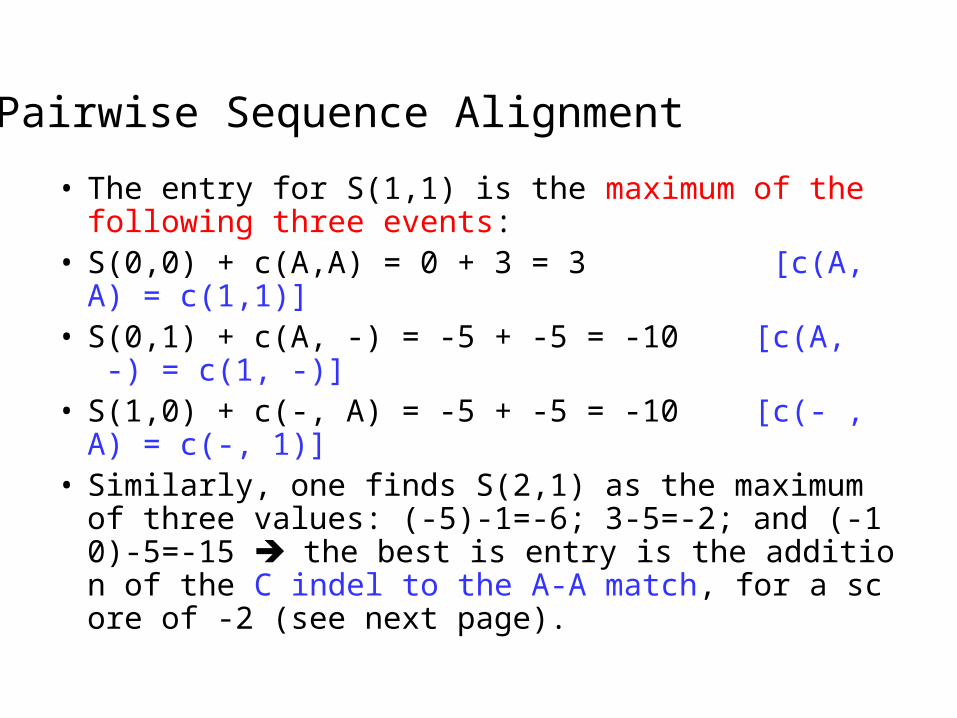
• The entry for S(1,1) is the maximum of the following three events:
• S(0,0) + c(A,A) = 0 + 3 = 3 [c(A,A) = c(1,1)]• S(0,1) + c(A, -) = -5 + -5 = -10 [c(A, -) = c(1, -)]• S(1,0) + c(-, A) = -5 + -5 = -10 [c(- ,A) = c(-, 1)]• Similarly, one finds S(2,1) as the maximum of thr
ee values: (-5)-1=-6; 3-5=-2; and (-10)-5=-15 the best is entry is the addition of the C indel to the A-A match, for a score of -2 (see next page).
Pairwise Sequence Alignment
Pairwise Sequence Alignment
TGTCA
A
C
G
C
T
G
A
2520151050
17127235
9416210
1451715
34041220
71191725
224142230
139192735
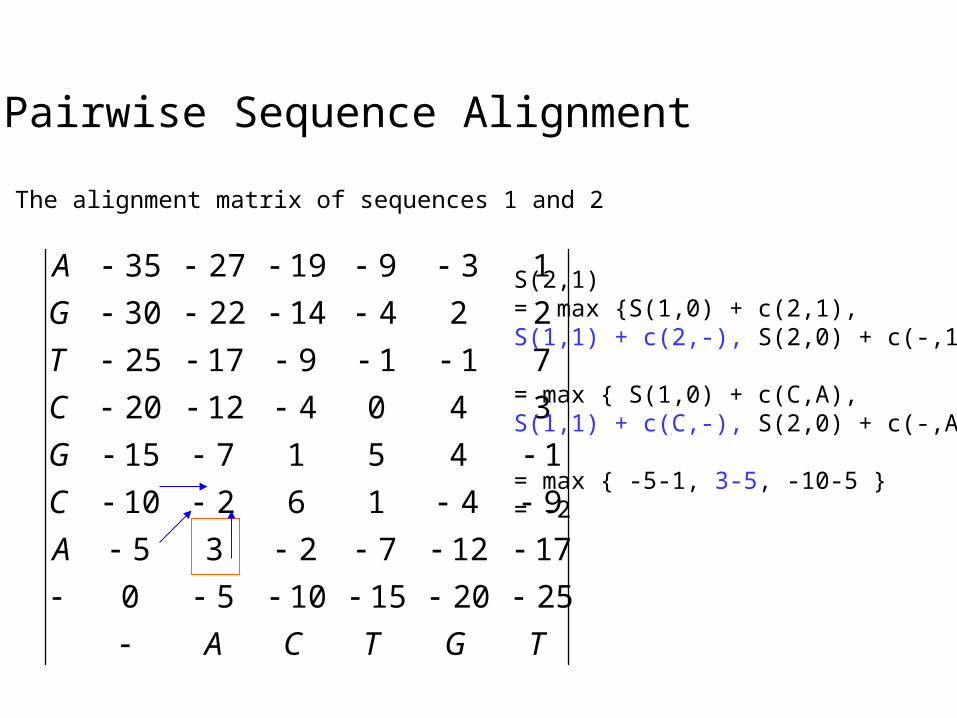
The alignment matrix of sequences 1 and 2
S(2,1) = max {S(1,0) + c(2,1),S(1,1) + c(2,-), S(2,0) + c(-,1)}
= max { S(1,0) + c(C,A),S(1,1) + c(C,-), S(2,0) + c(-,A) } = max { -5-1, 3-5, -10-5 }= -2
Pairwise Sequence Alignment
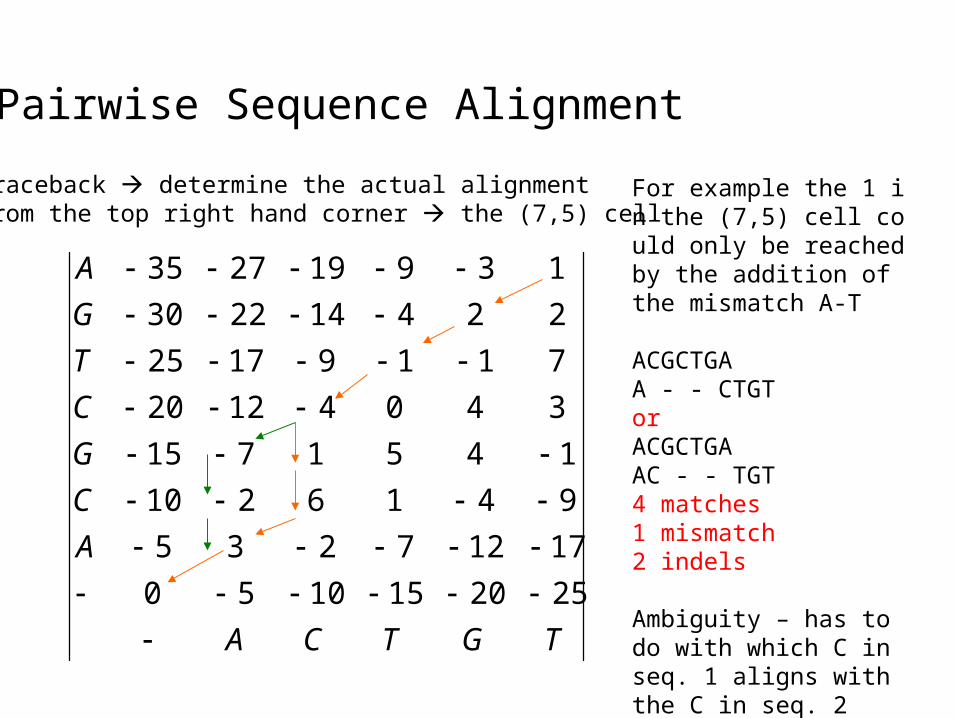
Traceback determine the actual alignmentFrom the top right hand corner the (7,5) cell
TGTCA
A
C
G
C
T
G
A
2520151050
17127235
9416210
1451715
34041220
71191725
224142230
139192735
For example the 1 in the (7,5) cell could only be reached by the addition of the mismatch A-T
ACGCTGAA - - CTGTorACGCTGAAC - - TGT4 matches1 mismatch2 indels
Ambiguity – has to do with which C in seq. 1 aligns with the C in seq. 2
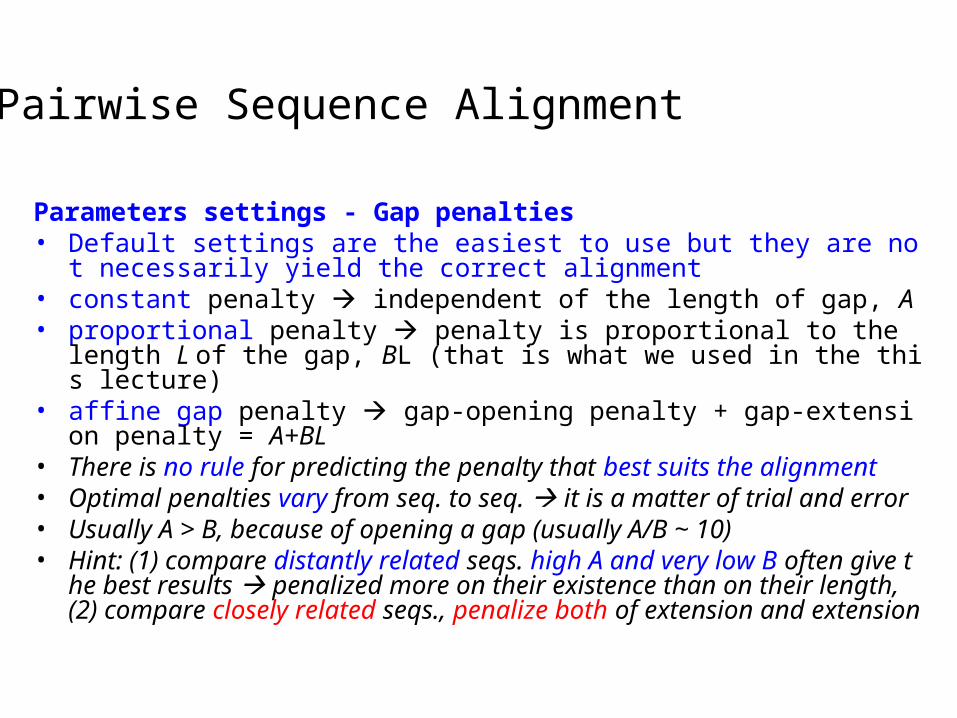
Parameters settings - Gap penalties• Default settings are the easiest to use but they are not necessarily yie
ld the correct alignment• constant penalty independent of the length of gap, A• proportional penalty penalty is proportional to the length L of the
gap, BL (that is what we used in the this lecture)• affine gap penalty gap-opening penalty + gap-extension penalty =
A+BL• There is no rule for predicting the penalty that best suits the alignme
nt• Optimal penalties vary from seq. to seq. it is a matter of trial and e
rror• Usually A > B, because of opening a gap (usually A/B ~ 10)• Hint: (1) compare distantly related seqs. high A and very low B often
give the best results penalized more on their existence than on their length, (2) compare closely related seqs., penalize both of extension and extension
Pairwise Sequence Alignment
BLAST
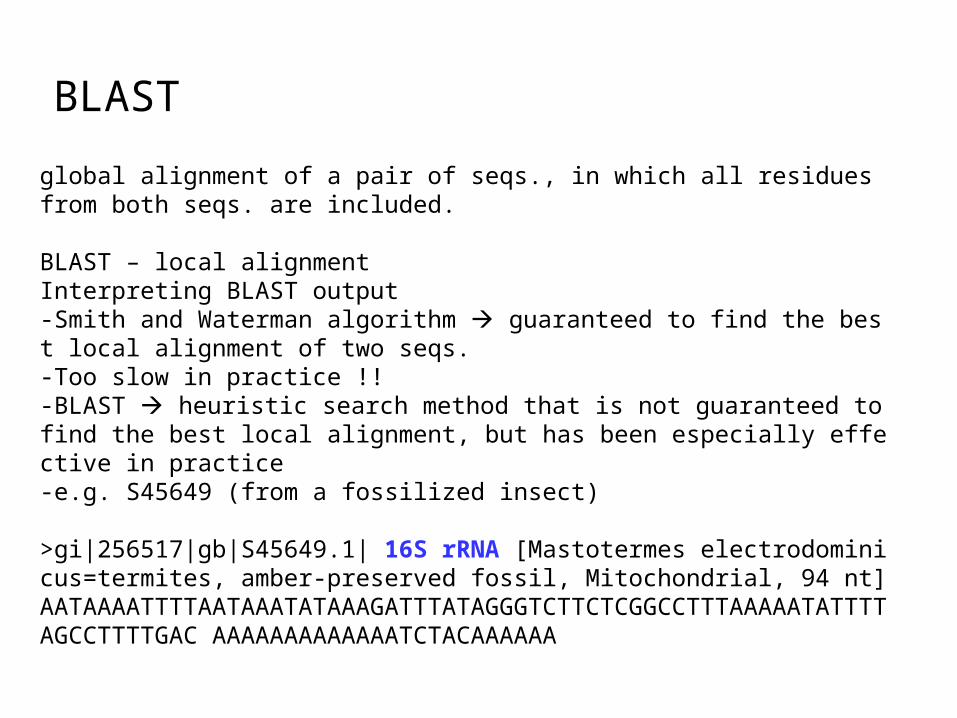
global alignment of a pair of seqs., in which all residues from both seqs. are included.
BLAST – local alignmentInterpreting BLAST output-Smith and Waterman algorithm guaranteed to find the best local alignment of two seqs.-Too slow in practice !!-BLAST heuristic search method that is not guaranteed to find the best local alignment, but has been especially effective in practice-e.g. S45649 (from a fossilized insect)
>gi|256517|gb|S45649.1| 16S rRNA [Mastotermes electrodominicus=termites, amber-preserved fossil, Mitochondrial, 94 nt] AATAAAATTTTAATAAATATAAAGATTTATAGGGTCTTCTCGGCCTTTAAAAATATTTTAGCCTTTTGAC AAAAAAAAAAAAATCTACAAAAAA
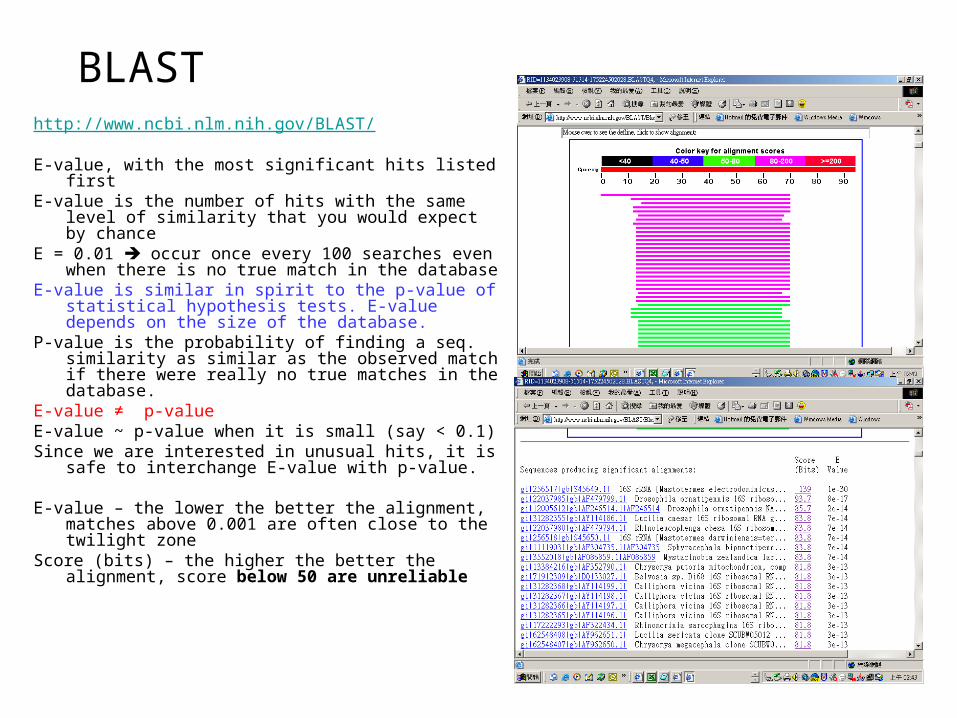
http://www.ncbi.nlm.nih.gov/BLAST/
E-value, with the most significant hits listed firstE-value is the number of hits with the same level of
similarity that you would expect by chance E = 0.01 occur once every 100 searches even when
there is no true match in the databaseE-value is similar in spirit to the p-value of statistical
hypothesis tests. E-value depends on the size of the database.
P-value is the probability of finding a seq. similarity as similar as the observed match if there were really no true matches in the database.
E-value ≠ p-valueE-value ~ p-value when it is small (say < 0.1)Since we are interested in unusual hits, it is safe to
interchange E-value with p-value.
E-value – the lower the better the alignment, matches above 0.001 are often close to the twilight zone
Score (bits) – the higher the better the alignment, score below 50 are unreliable
BLAST
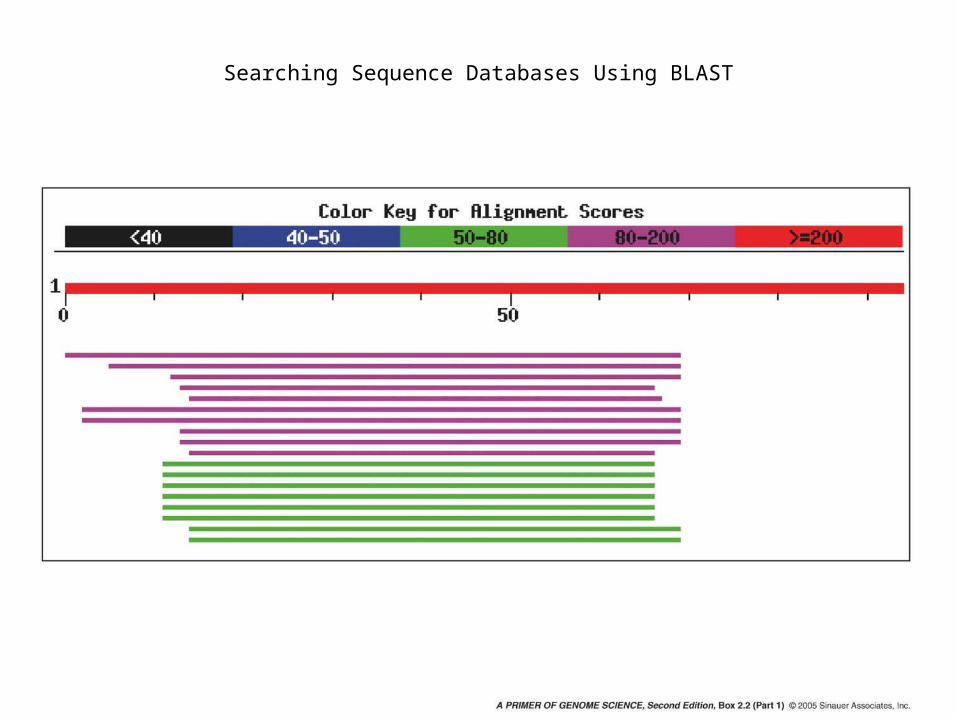
Searching Sequence Databases Using BLAST
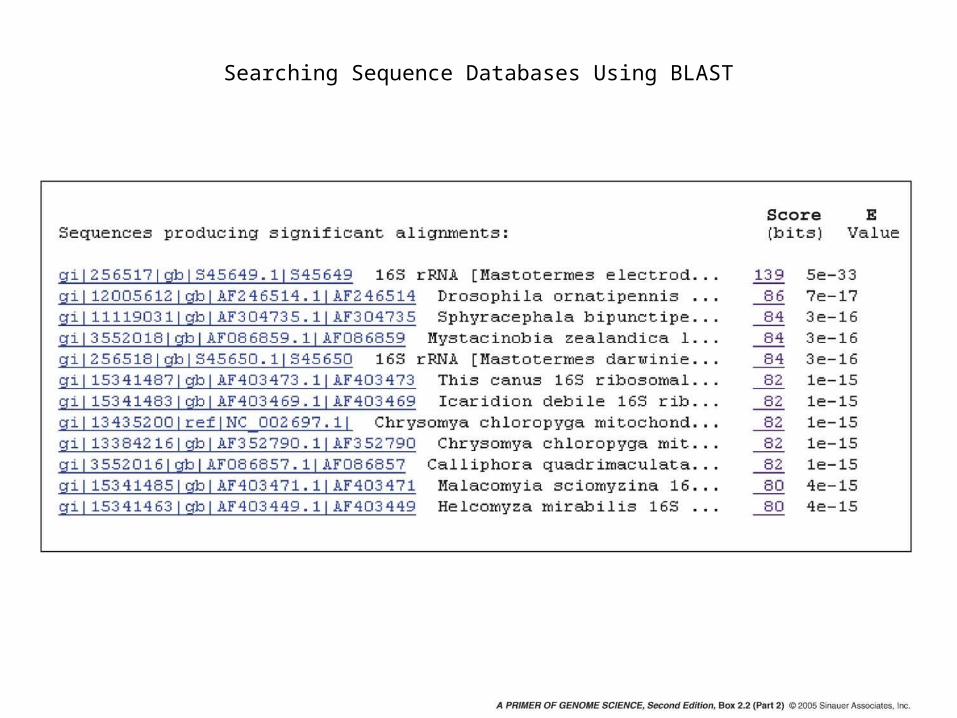
Searching Sequence Databases Using BLAST
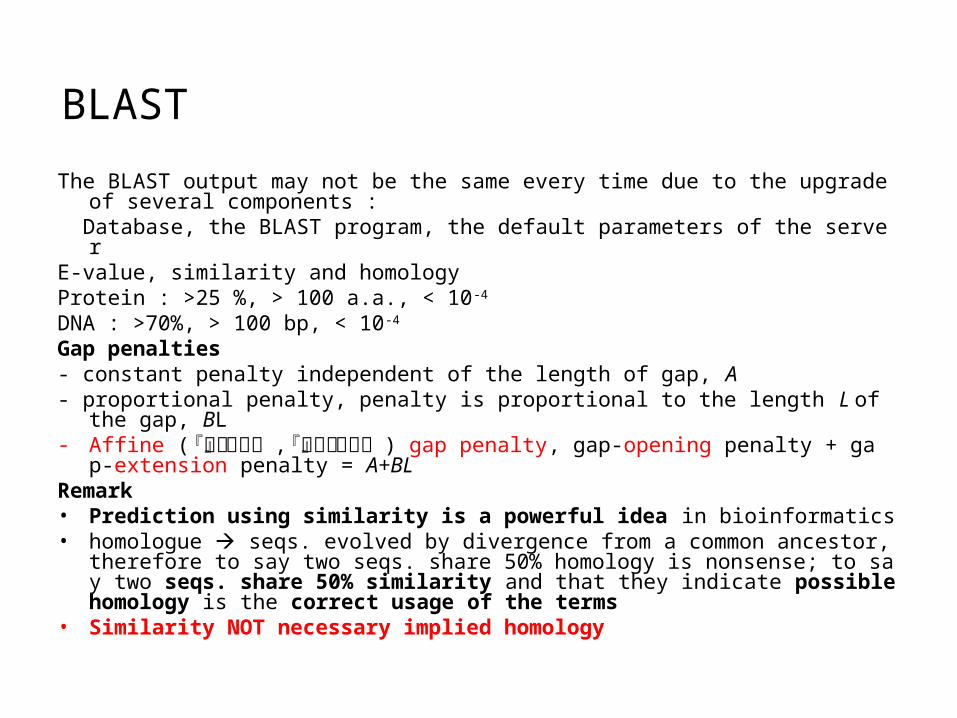
The BLAST output may not be the same every time due to the upgrade of several components :
Database, the BLAST program, the default parameters of the serverE-value, similarity and homologyProtein : >25 %, > 100 a.a., < 10-4
DNA : >70%, > 100 bp, < 10-4
Gap penalties- constant penalty independent of the length of gap, A- proportional penalty, penalty is proportional to the length L of the gap, BL- Affine ( 『數』遠交的 , 『化學』親和的 ) gap penalty, gap-opening penalt
y + gap-extension penalty = A+BLRemark• Prediction using similarity is a powerful idea in bioinformatics• homologue seqs. evolved by divergence from a common ancestor, theref
ore to say two seqs. share 50% homology is nonsense; to say two seqs. share 50% similarity and that they indicate possible homology is the correct usage of the terms
• Similarity NOT necessary implied homology
BLAST
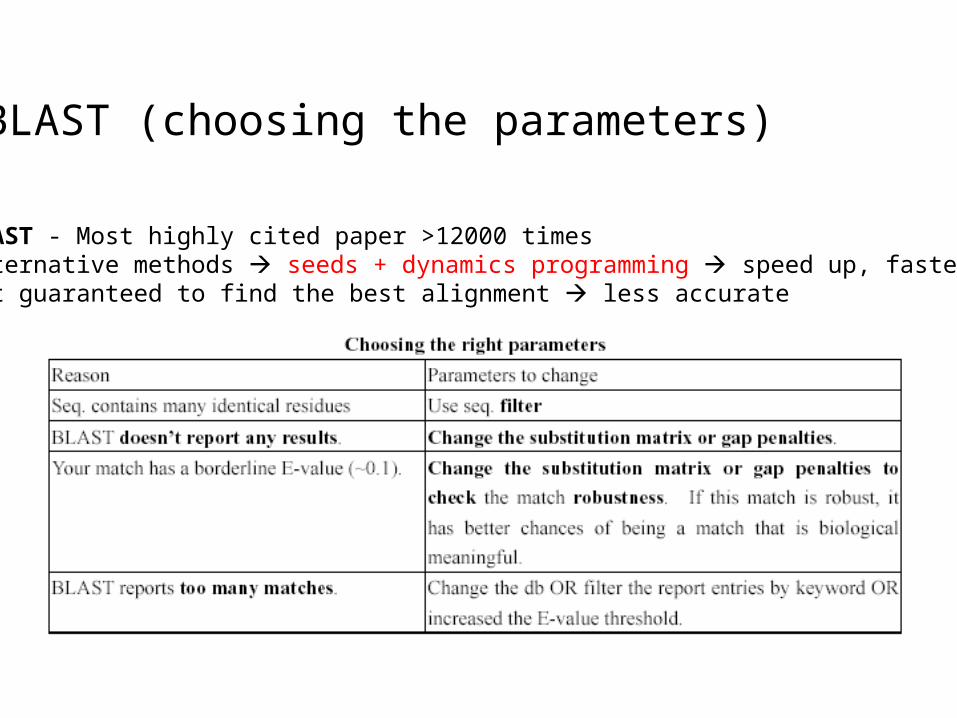
BLAST (choosing the parameters)
BLAST - Most highly cited paper >12000 timesalternative methods seeds + dynamics programming speed up, faster not guaranteed to find the best alignment less accurate
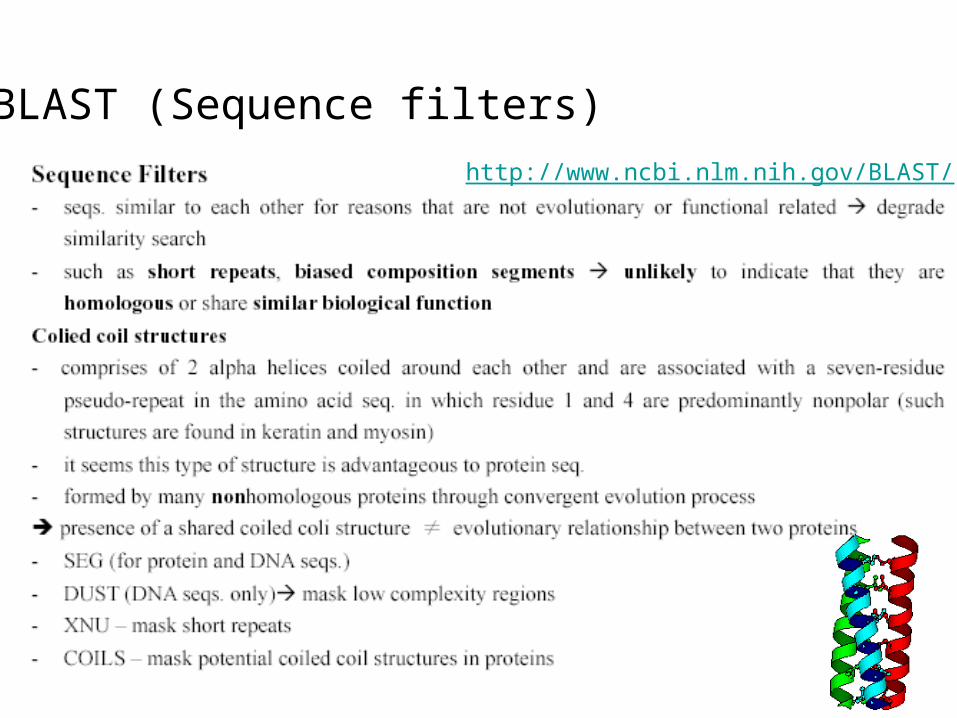
BLAST (Sequence filters)
http://www.ncbi.nlm.nih.gov/BLAST/
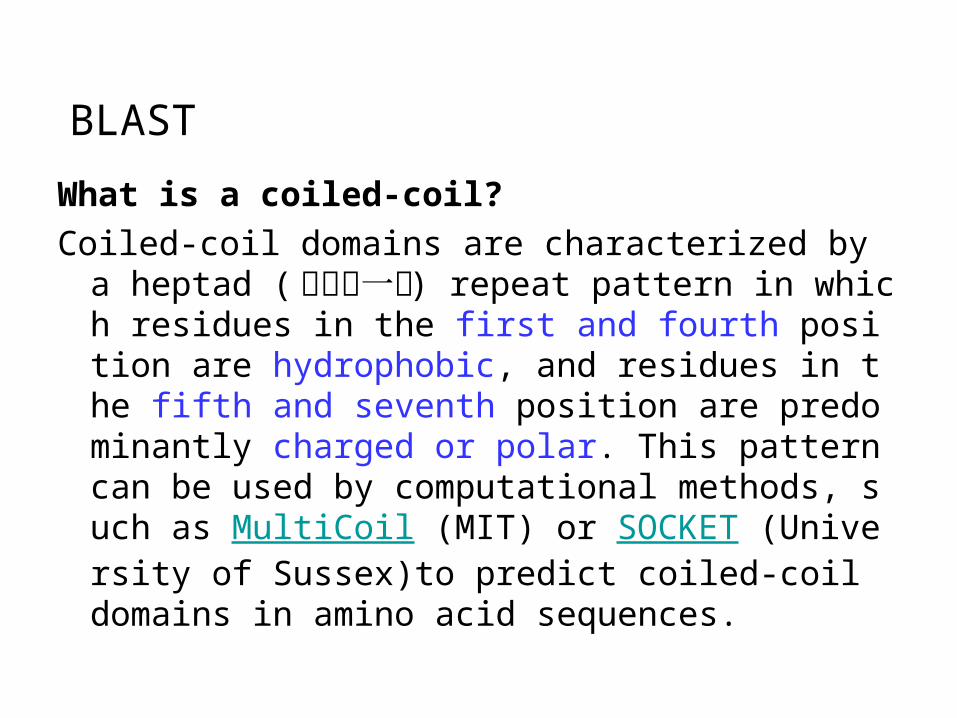
What is a coiled-coil?
Coiled-coil domains are characterized by a heptad ( 成七的一組 ) repeat pattern in which residues in the first and fourth position are hydrophobic, and residues in the fifth and seventh position are predominantly charged or polar. This pattern can be used by computational methods, such as MultiCoil (MIT) or SOCKET (University of Sussex)to predict coiled-coil domains in amino acid sequences.
BLAST
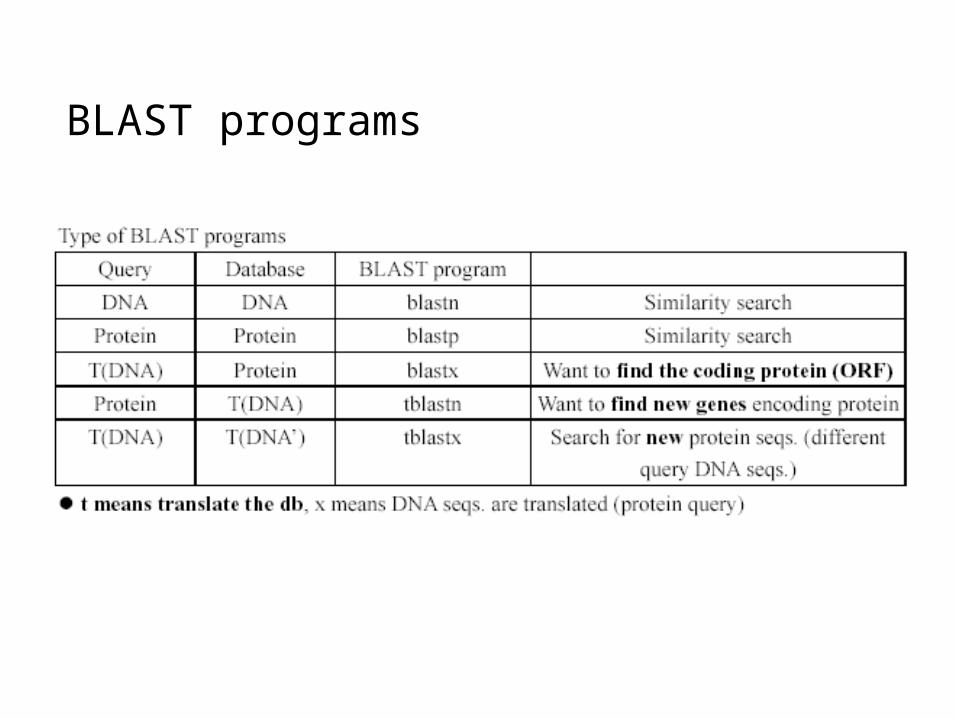
BLAST programs
• How to determine the score scheme ?• Dynamic Programming do not provide the user with a measure of st
atistical similarity when regions of local similarity are found• Take into account not just the position-position overlap between two
seqs. but the characteristics of the a.a being aligned define scoring matrices
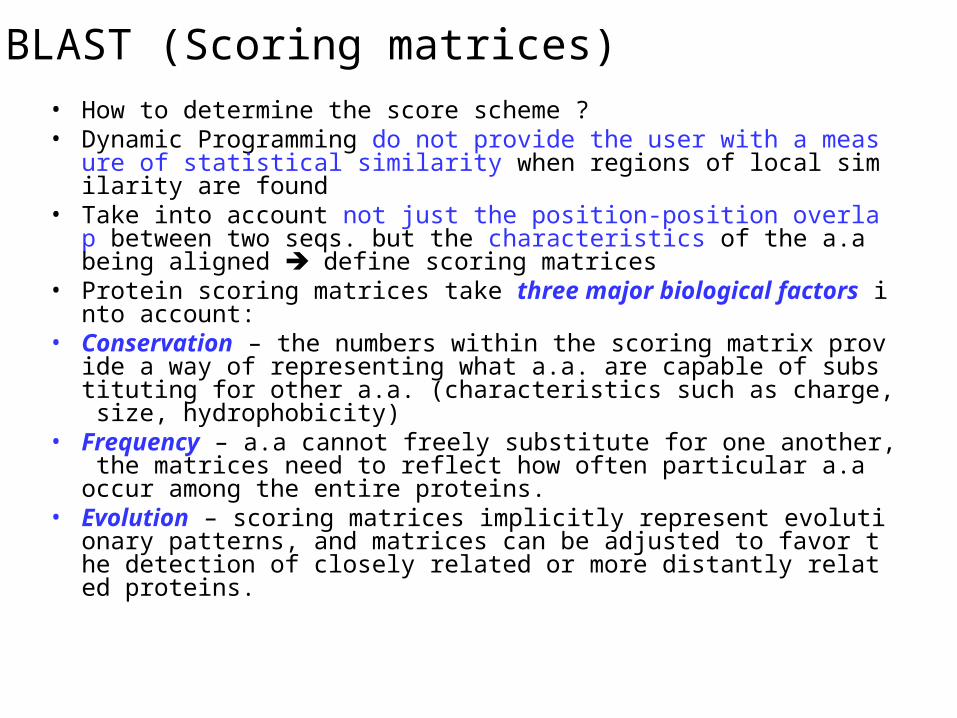
• Protein scoring matrices take three major biological factors into account:
• Conservation – the numbers within the scoring matrix provide a way of representing what a.a. are capable of substituting for other a.a. (characteristics such as charge, size, hydrophobicity)
• Frequency – a.a cannot freely substitute for one another, the matrices need to reflect how often particular a.a occur among the entire proteins.
• Evolution – scoring matrices implicitly represent evolutionary patterns, and matrices can be adjusted to favor the detection of closely related or more distantly related proteins.
BLAST (Scoring matrices)
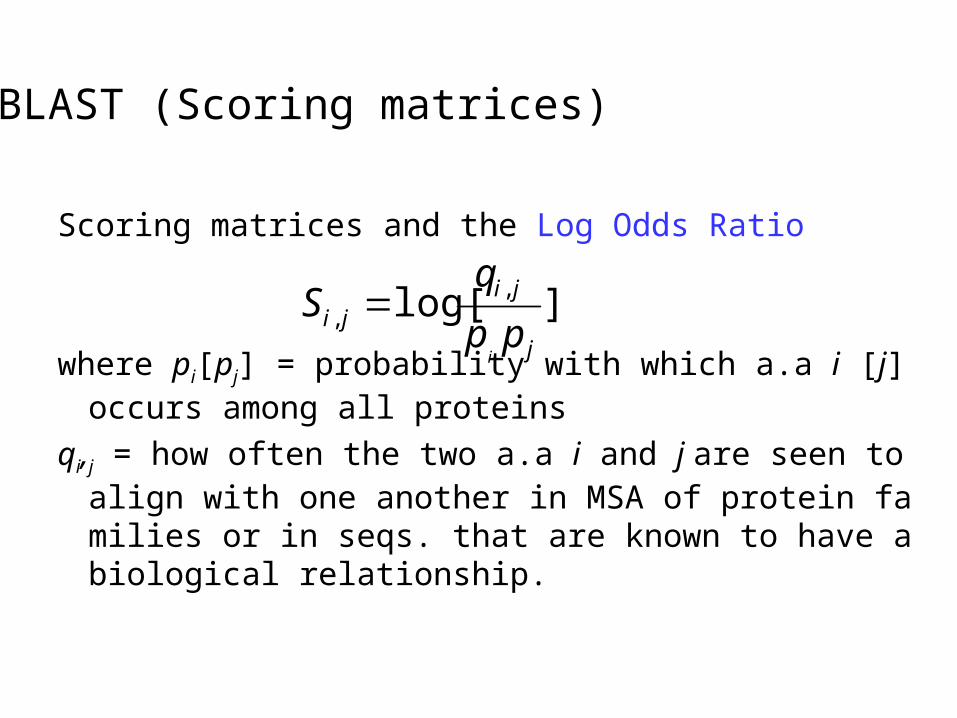
Scoring matrices and the Log Odds Ratio
where pi[pj] = probability with which a.a i [j] occurs among all proteins
qi,j = how often the two a.a i and j are seen to align with one another in MSA of protein families or in seqs. that are known to have a biological relationship.
BLAST (Scoring matrices)
]log[ ,,
j
jiji pp
qS
i
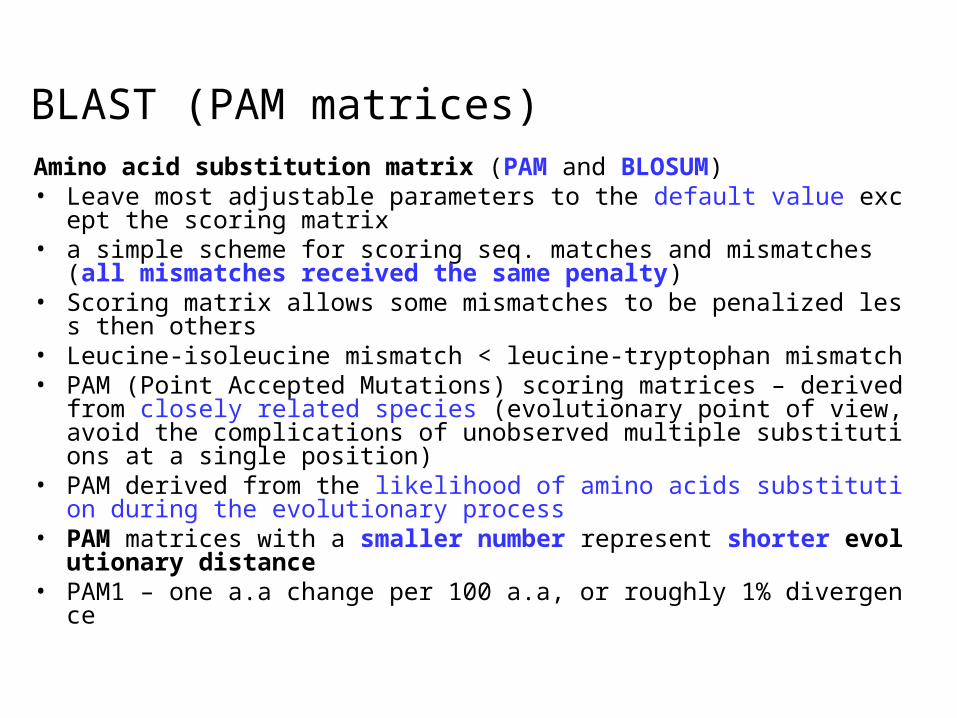
Amino acid substitution matrix (PAM and BLOSUM)• Leave most adjustable parameters to the default value except the scori
ng matrix• a simple scheme for scoring seq. matches and mismatches (all mismat
ches received the same penalty)• Scoring matrix allows some mismatches to be penalized less then other
s• Leucine-isoleucine mismatch < leucine-tryptophan mismatch • PAM (Point Accepted Mutations) scoring matrices – derived from clos
ely related species (evolutionary point of view, avoid the complications of unobserved multiple substitutions at a single position)
• PAM derived from the likelihood of amino acids substitution during the evolutionary process
• PAM matrices with a smaller number represent shorter evolutionary distance
• PAM1 – one a.a change per 100 a.a, or roughly 1% divergence
BLAST (PAM matrices)
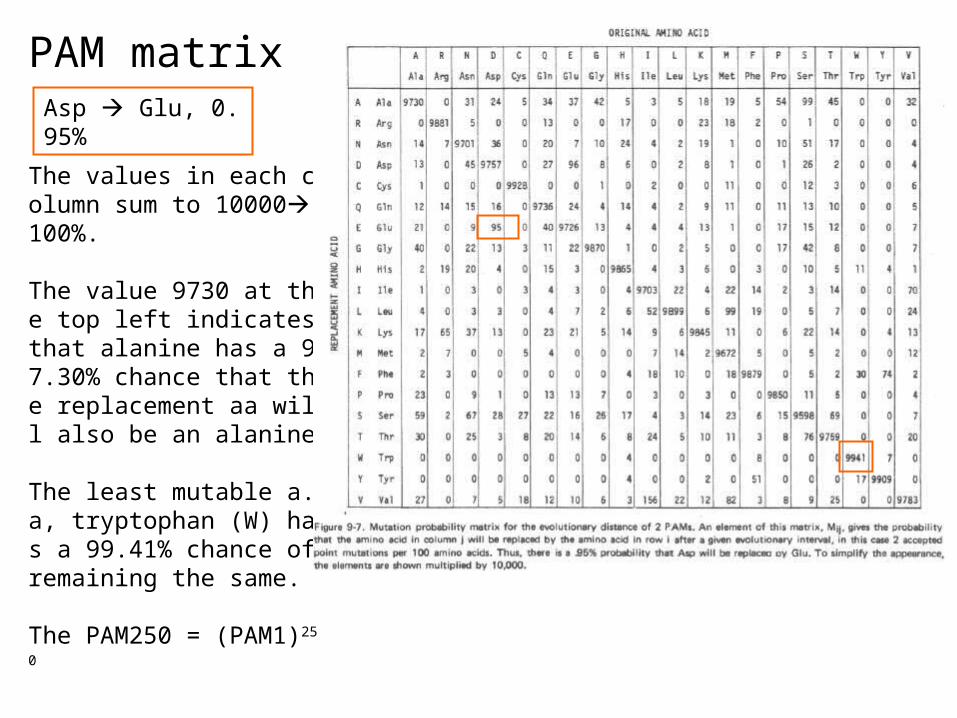
PAM matrixAsp Glu, 0.95%
The values in each column sum to 10000100%.
The value 9730 at the top left indicates that alanine has a 97.30% chance that the replacement aa will also be an alanine.
The least mutable a.a, tryptophan (W) has a 99.41% chance of remaining the same.
The PAM250 = (PAM1)250
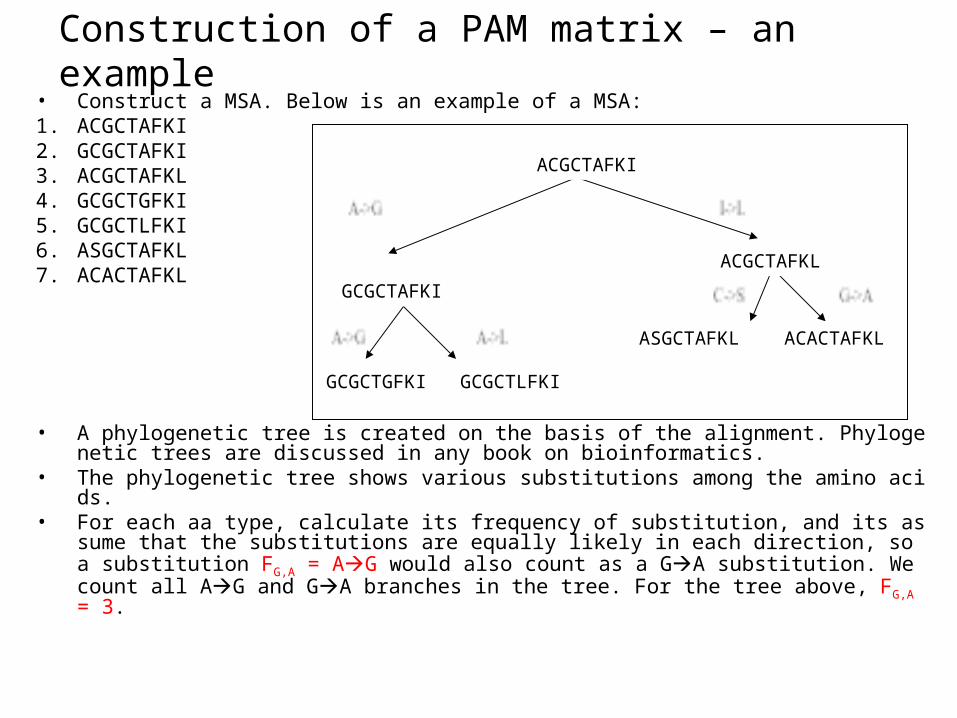
Construction of a PAM matrix – an example• Construct a MSA. Below is an example of a MSA: 1. ACGCTAFKI2. GCGCTAFKI3. ACGCTAFKL4. GCGCTGFKI5. GCGCTLFKI6. ASGCTAFKL7. ACACTAFKL
• A phylogenetic tree is created on the basis of the alignment. Phylogenetic trees are discussed in any book on bioinformatics.
• The phylogenetic tree shows various substitutions among the amino acids.• For each aa type, calculate its frequency of substitution, and its assume that the
substitutions are equally likely in each direction, so a substitution FG,A = AG would also count as a GA substitution. We count all AG and GA branches in the tree. For the tree above, FG,A = 3.
GCGCTGFKI GCGCTLFKI
GCGCTAFKI
ACGCTAFKI
ACGCTAFKL
ASGCTAFKL ACACTAFKL
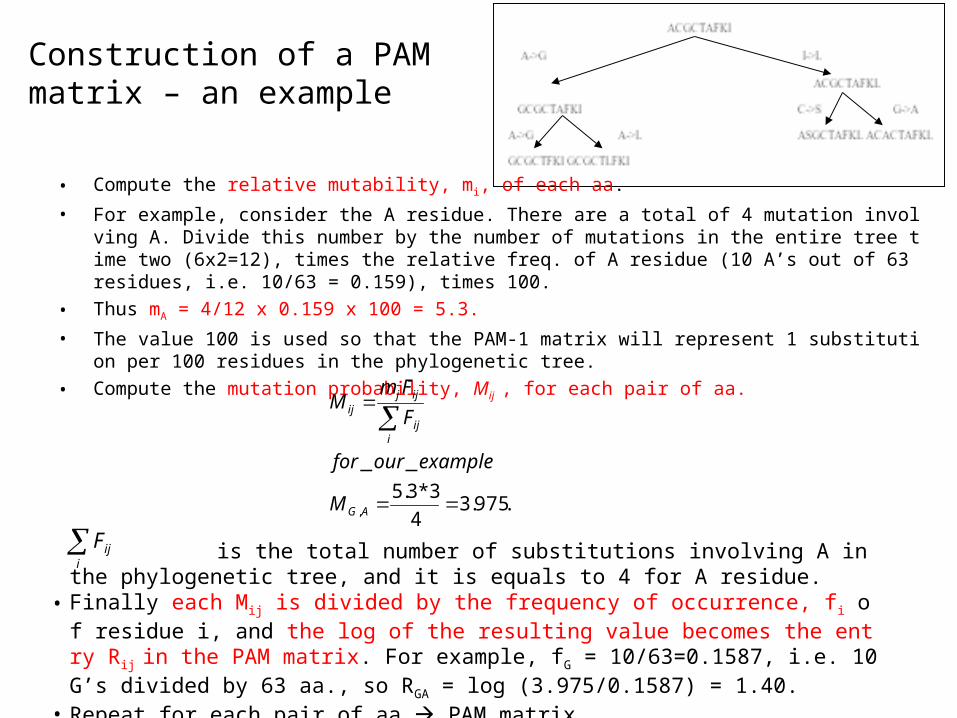
Construction of a PAM matrix – an example
• Compute the relative mutability, mi, of each aa.
• For example, consider the A residue. There are a total of 4 mutation involving A. Divide this number by the number of mutations in the entire tree time two (6x2=12), times the relative freq. of A residue (10 A’s out of 63 residues, i.e. 10/63 = 0.159), times 100.
• Thus mA = 4/12 x 0.159 x 100 = 5.3.
• The value 100 is used so that the PAM-1 matrix will represent 1 substitution per 100 residues in the phylogenetic tree.
• Compute the mutation probability, Mij , for each pair of aa.
.975.34
3*3.5
__
,
AG
iij
ijjij
M
exampleourfor
F
FmM
is the total number of substitutions involving A in the phylogenetic tree, and it is equals to 4 for A residue.
• Finally each Mij is divided by the frequency of occurrence, fi of residue i, and the log of the resulting value becomes the entry Rij in the PAM matrix. For example, fG = 10/63=0.1587, i.e. 10 G’s divided by 63 aa., so RGA = log (3.975/0.1587) = 1.40.
• Repeat for each pair of aa PAM matrix
i
ijF
BLOSUM (BLOck SUM) – there are evidence it outperform PAM• Block proteins in the same family can be aligned without introduci
ng a gap (not the individual seqs.)• So any given protein can contain one or more blocks, corresponding
to each of its functional or structural motif • With these protein blocks, it is possible to look for substitution patter
ns only in the most conserved regions of a protein block substitution matrices are generated
• BLOSUM scoring matrix – based on data from distantly related seqs. (default BLOSUM62 for general use)
• The most commonly used matrices are PAM120, PAM250, BLOSUM50 and BLOSUM 62
• BLOSUM matrices with a smaller number represent a longer evolutionary distance
BLAST (BLOSUM matrices)
BLAST (BLOSUM matrices)
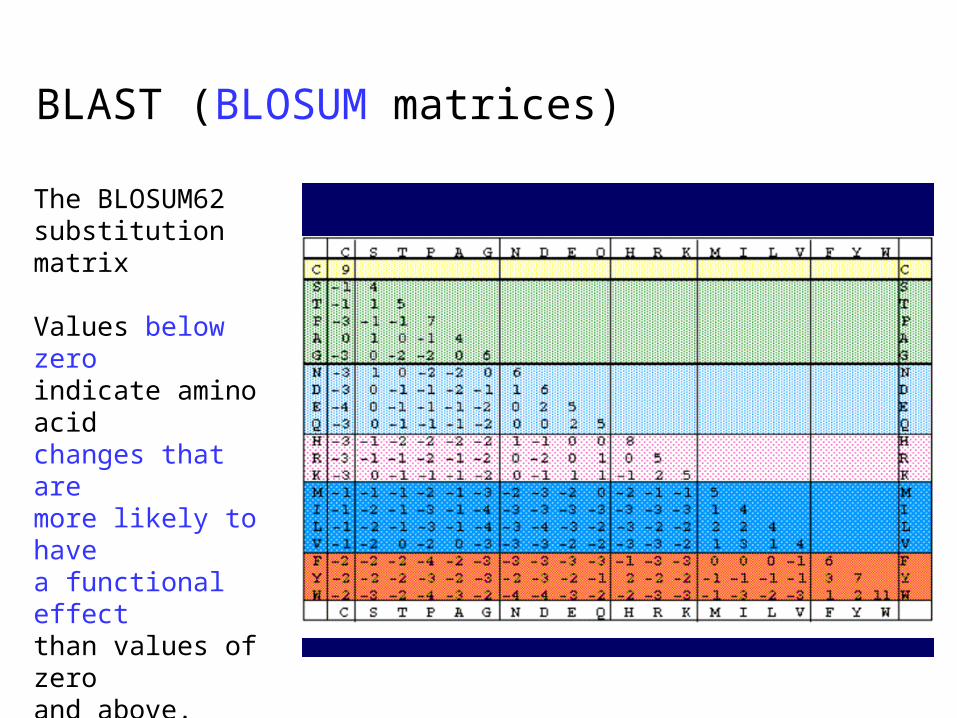
The BLOSUM62 substitution matrix
Values below zero indicate amino acid changes that are more likely to have a functional effect than values of zero and above.
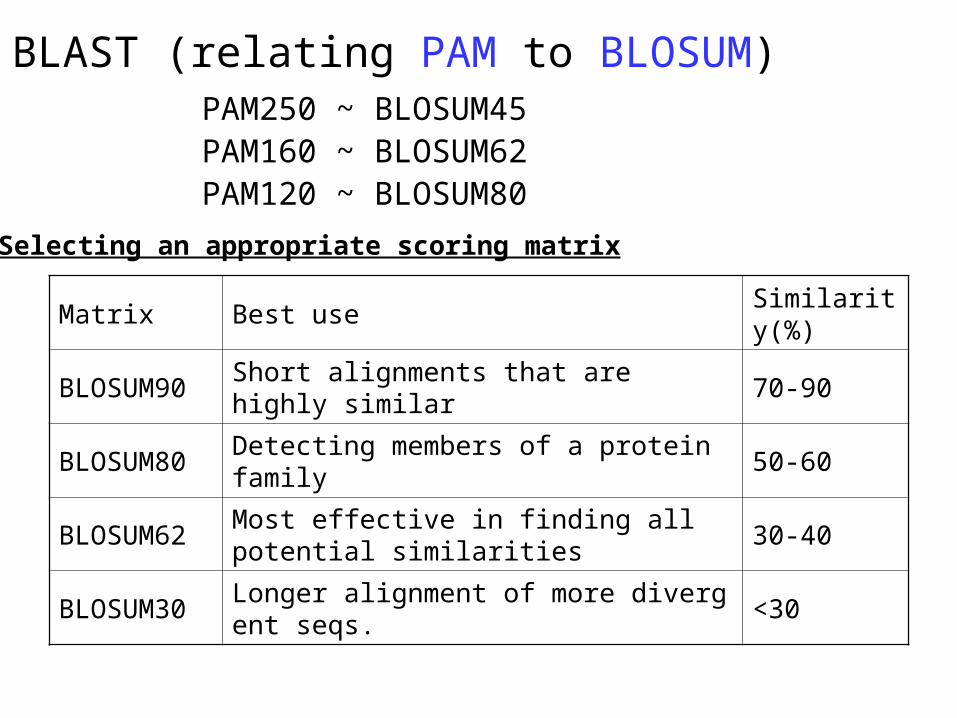
PAM250 ~ BLOSUM45PAM160 ~ BLOSUM62PAM120 ~ BLOSUM80
BLAST (relating PAM to BLOSUM)
Matrix Best useSimilarity(%)
BLOSUM90 Short alignments that are highly similar 70-90
BLOSUM80 Detecting members of a protein family 50-60
BLOSUM62Most effective in finding all potential similarities
30-40
BLOSUM30 Longer alignment of more divergent seqs. <30
Selecting an appropriate scoring matrix
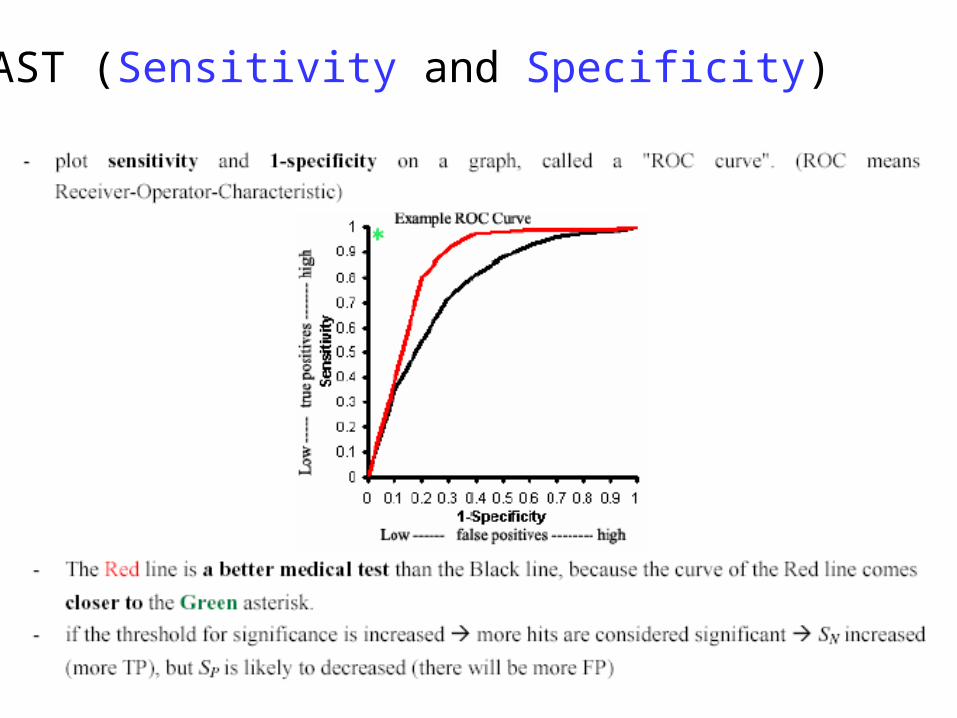
BLAST (Sensitivity and Specificity)
BLAST (Sensitivity and Specificity)
BLAST (Sensitivity and Specificity)
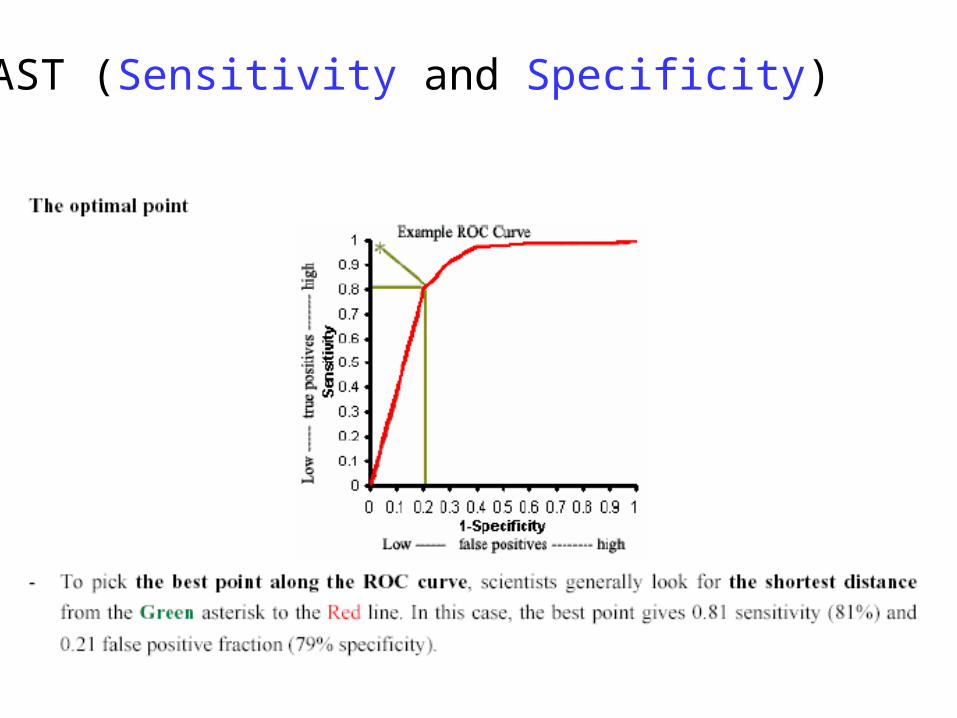
BLAST (Sensitivity and Specificity)
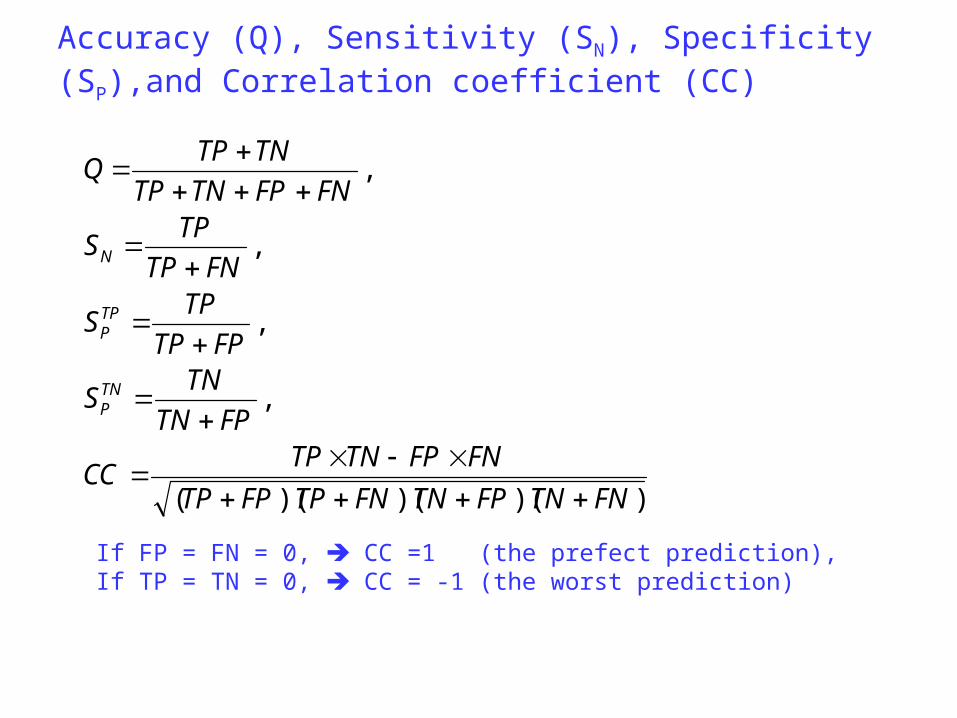
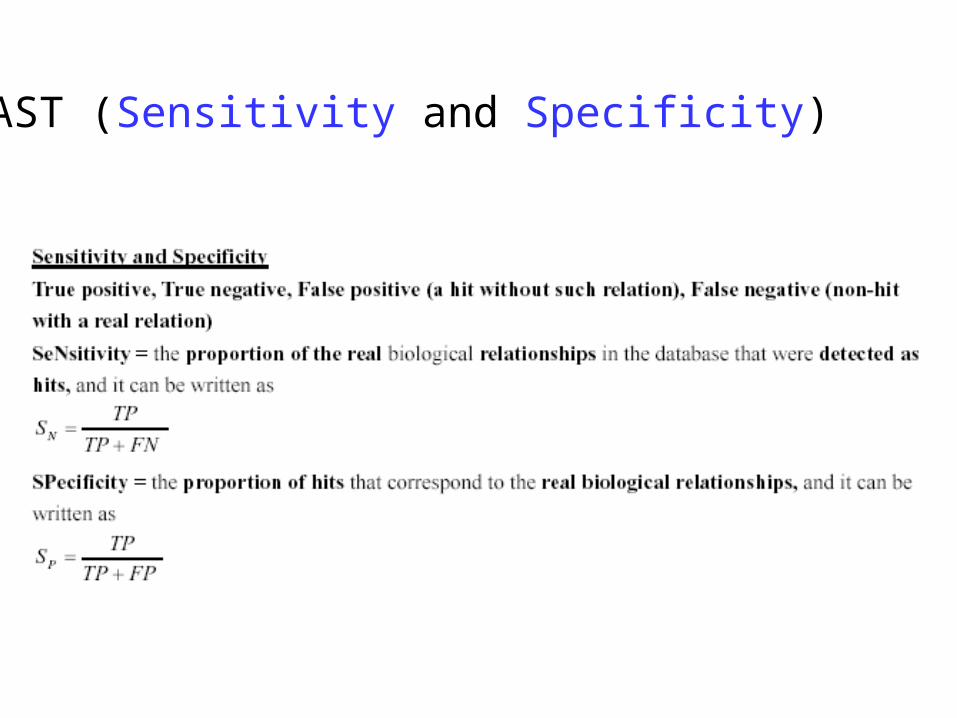
Accuracy (Q), Sensitivity (SN), Specificity (SP),and Correlation coefficient (CC)
))()()((
,
,
,
,
FNTNFPTNFNTPFPTP
FNFPTNTPCC
FPTN
TNS
FPTP
TPS
FNTP
TPS
FNFPTNTP
TNTPQ
TNP
TPP
N
If FP = FN = 0, CC =1 (the prefect prediction), If TP = TN = 0, CC = -1 (the worst prediction)
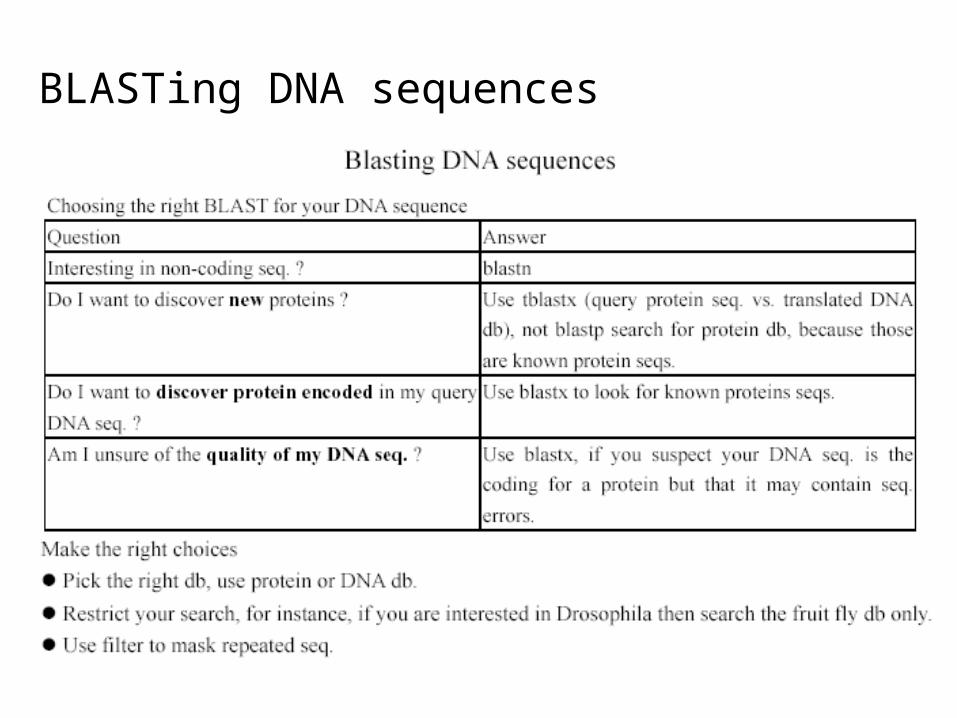
BLASTing DNA sequences
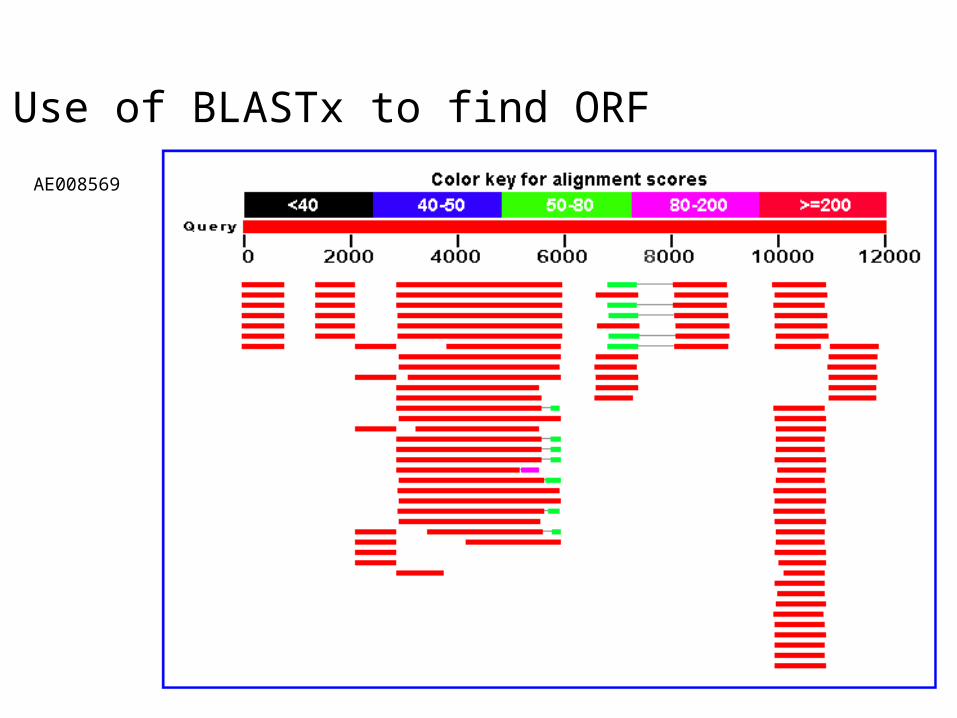
AE008569
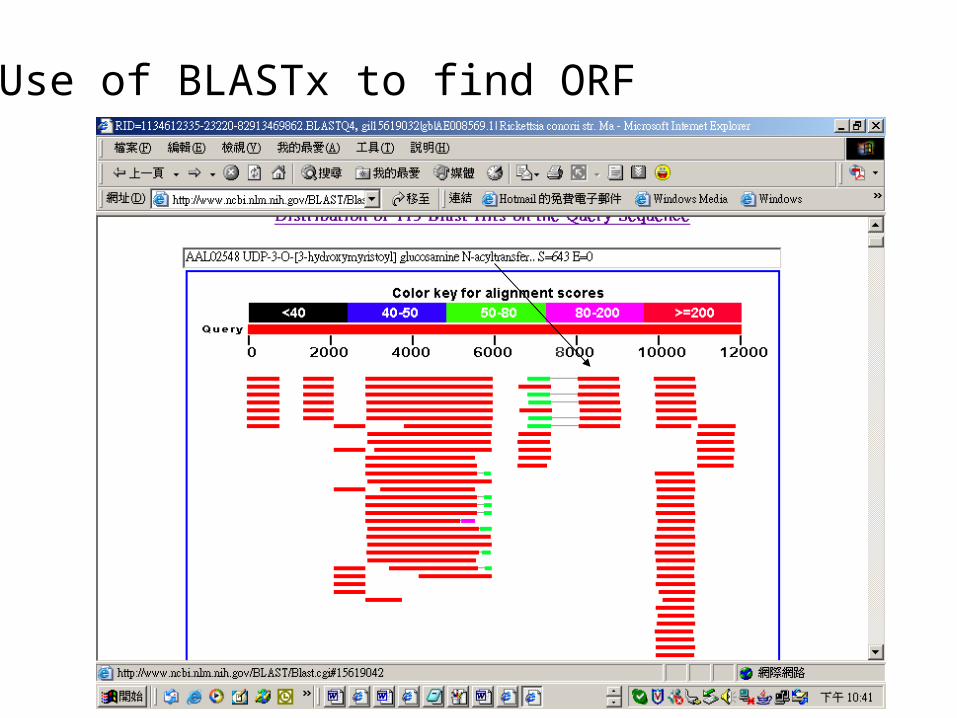
Use of BLASTx to find ORF
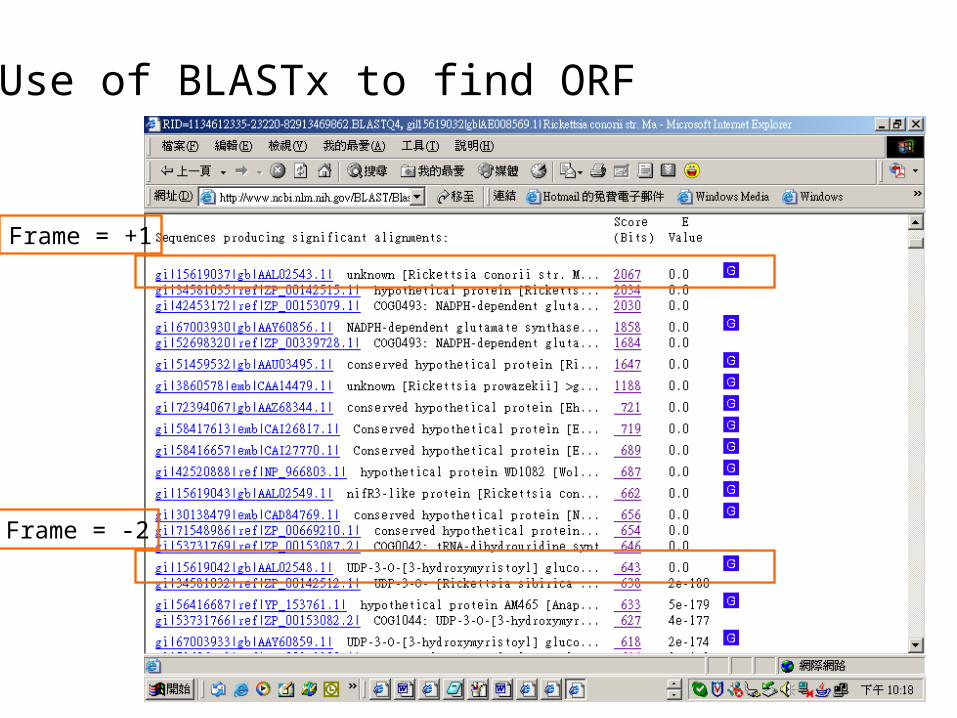
Use of BLASTx to find ORF
Frame = -2
Frame = +1
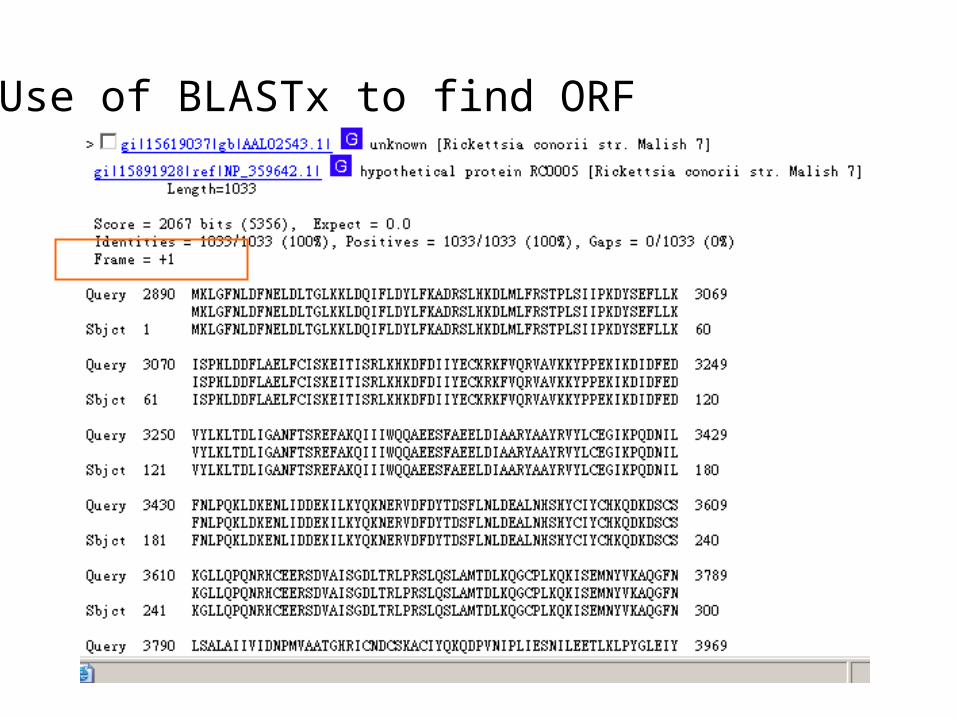
Use of BLASTx to find ORF
Use of BLASTx to find ORF
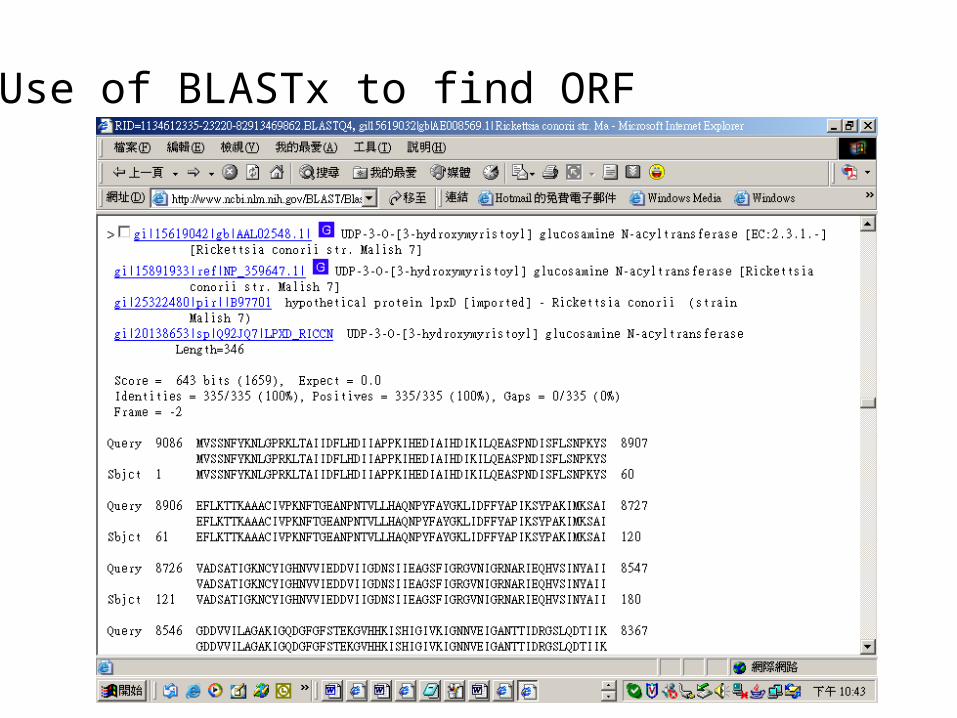
Use of BLASTx to find ORF
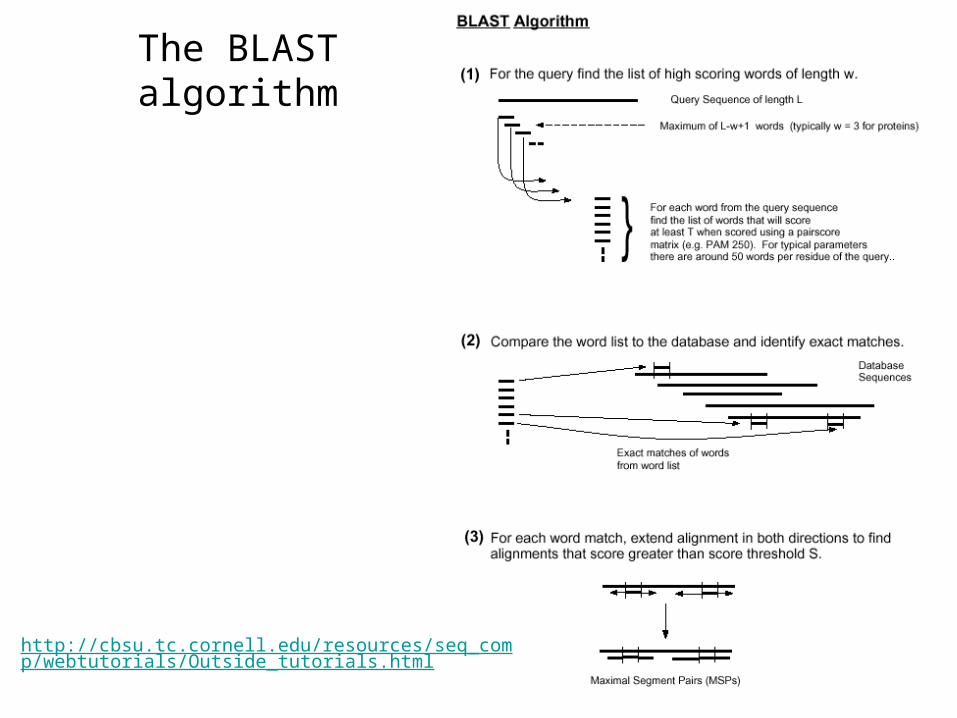
The BLAST algorithm
http://cbsu.tc.cornell.edu/resources/seq_comp/webtutorials/Outside_tutorials.html
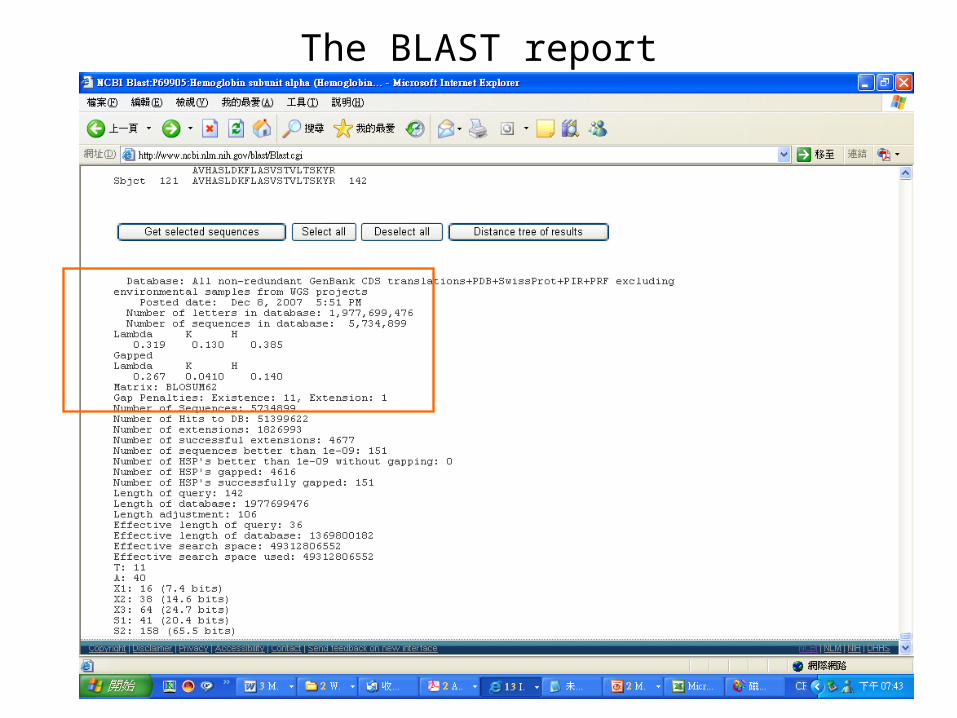
The BLAST report
The Gumbel Extreme Value Distribution
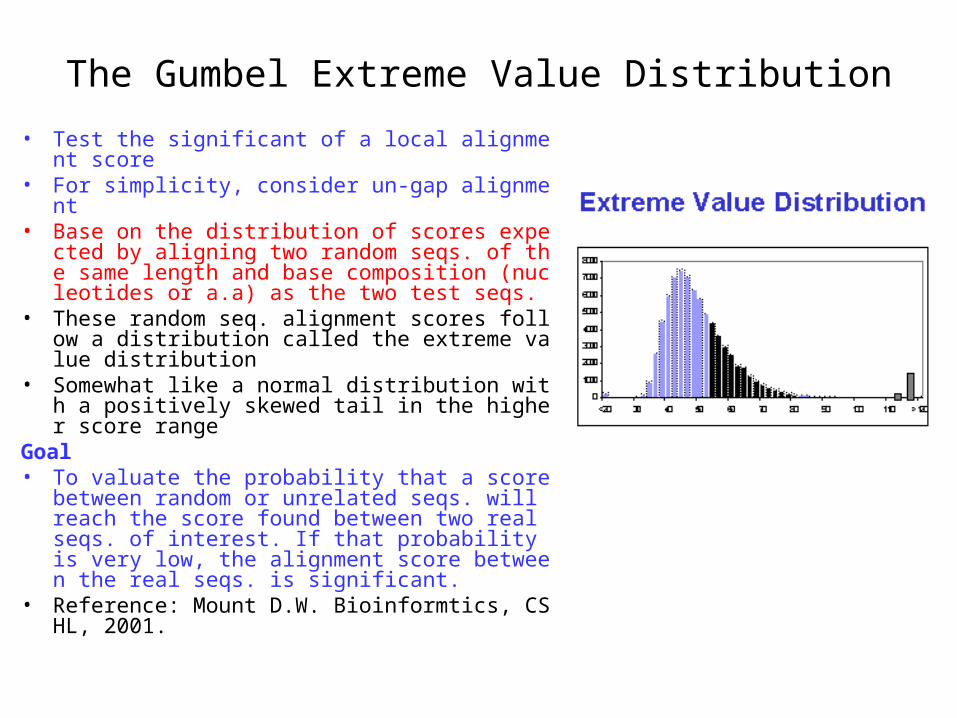
• Test the significant of a local alignment score• For simplicity, consider un-gap alignment• Base on the distribution of scores expected by
aligning two random seqs. of the same length and base composition (nucleotides or a.a) as the two test seqs.
• These random seq. alignment scores follow a distribution called the extreme value distribution
• Somewhat like a normal distribution with a positively skewed tail in the higher score range
Goal• To valuate the probability that a score between
random or unrelated seqs. will reach the score found between two real seqs. of interest. If that probability is very low, the alignment score between the real seqs. is significant.
• Reference: Mount D.W. Bioinformtics, CSHL, 2001.
The Gumbel Extreme Value Distribution
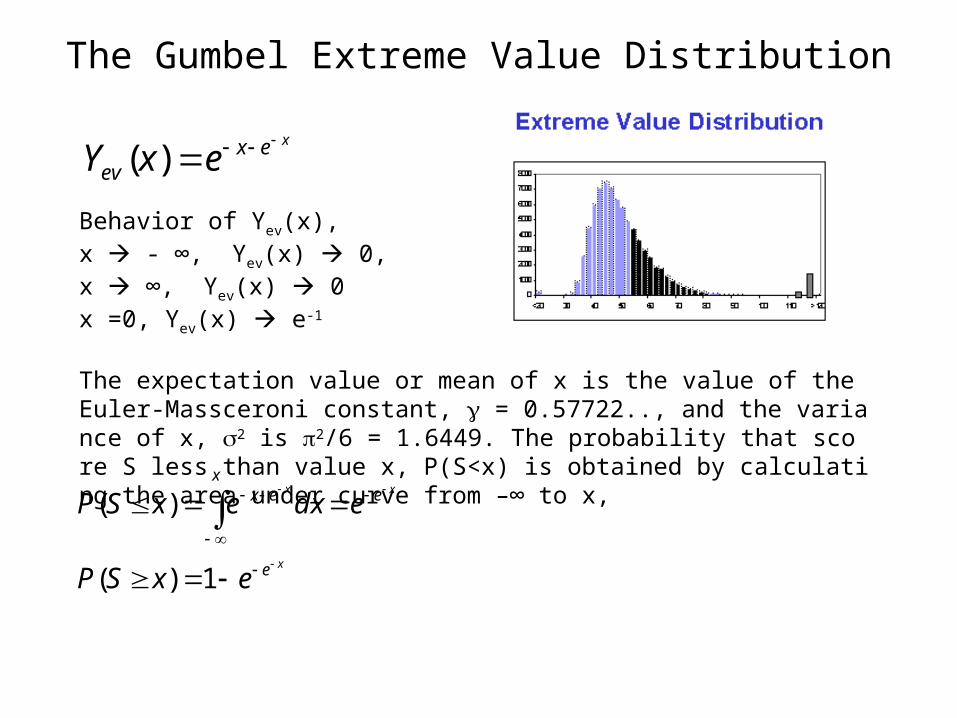
xexev exY
)(
Behavior of Yev(x), x - ∞, Yev(x) 0,x ∞, Yev(x) 0x =0, Yev(x) e-1
The expectation value or mean of x is the value of the Euler-Massceroni constant, = 0.57722.., and the variance of x, 2 is 2/6 = 1.6449. The probability that score S less than value x, P(S<x) is obtained by calculating the area under curve from –∞ to x,
x
xx
e
ex
ex
exSP
edxexSP
1)(
)(
The Gumbel Extreme Value Distribution
databaseandseqoflengthnm
xxumn
eK
where
KmnSS
where
exSP
u
x
____,
45.0/
/2825.1)6/(
)ln('
)'(
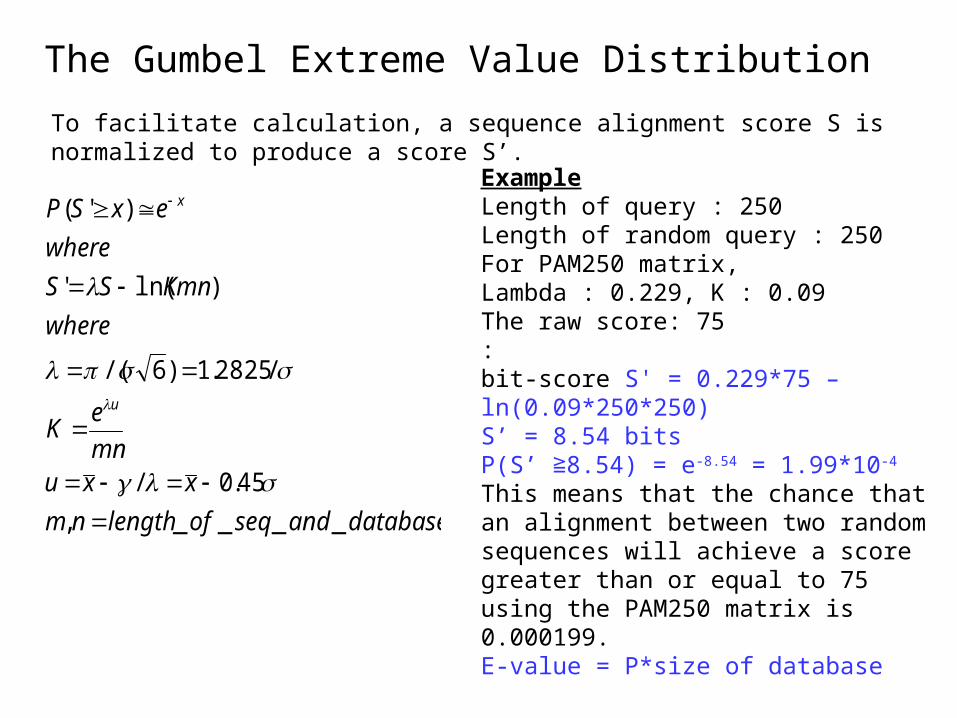
To facilitate calculation, a sequence alignment score S is normalized to produce a score S’.
ExampleLength of query : 250Length of random query : 250For PAM250 matrix,Lambda : 0.229, K : 0.09 The raw score: 75: bit-score S' = 0.229*75 – ln(0.09*250*250)S’ = 8.54 bitsP(S’ 8.54) = e≧ -8.54 = 1.99*10-4 This means that the chance that an alignment between two random sequences will achieve a score greater than or equal to 75 using the PAM250 matrix is 0.000199. E-value = P*size of database
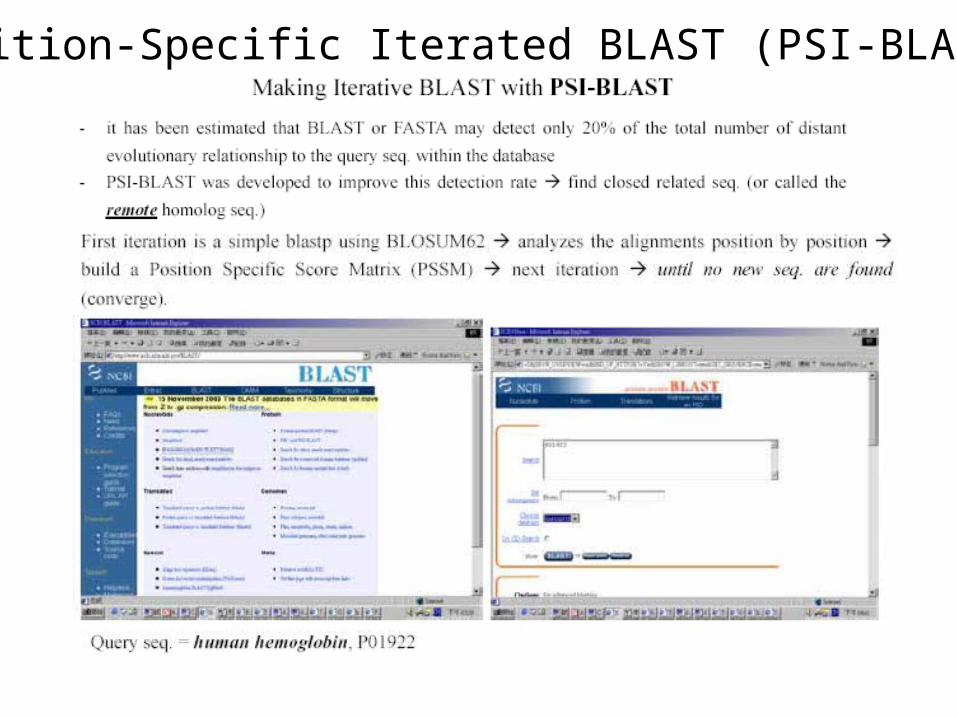
Position-Specific Iterated BLAST (PSI-BLAST)
• BLAST is a fast program quite capable of identifying the close matches, but it is less sensitive for remote homologous seq. search
• For example, find the homologous of a mouse protein in the human genome using BLAST is easy
• But if you want to search for a homologous of a yeast protein in the human genome (remote homologous seq. ), the job is more difficult for BLAST
Position-Specific Iterated BLAST (PSI-BLAST)
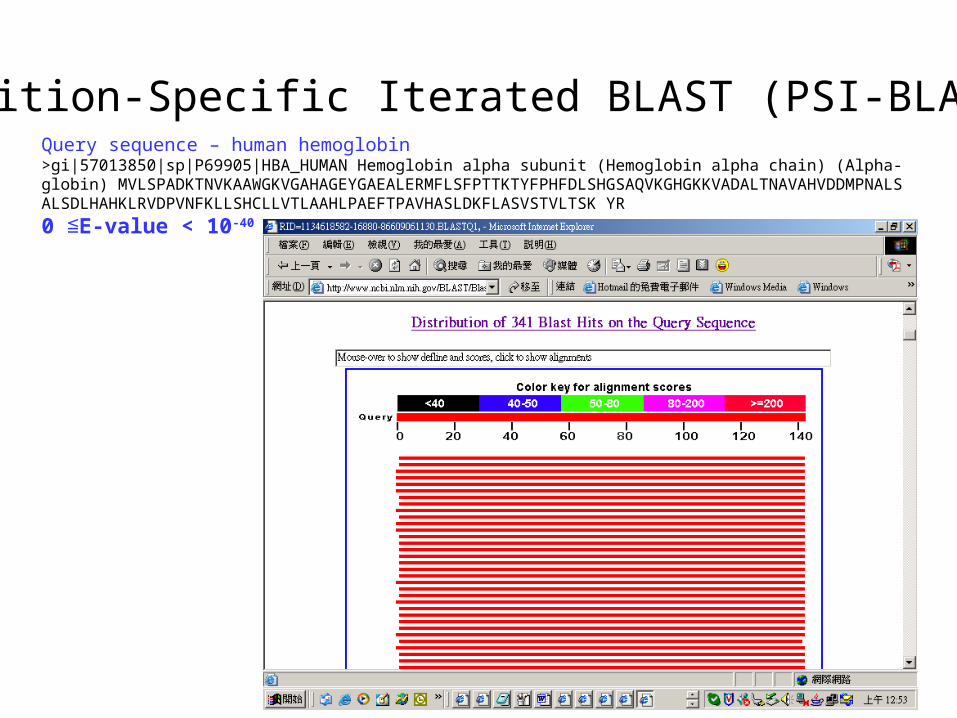
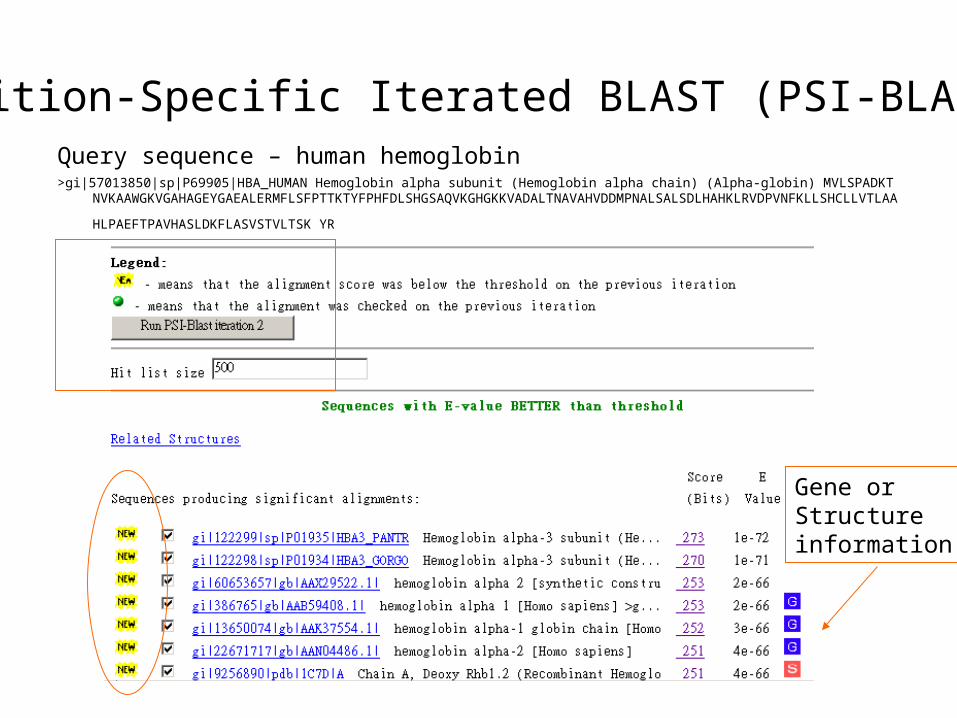
Position-Specific Iterated BLAST (PSI-BLAST)Query sequence – human hemoglobin>gi|57013850|sp|P69905|HBA_HUMAN Hemoglobin alpha subunit (Hemoglobin alpha chain) (Alpha-globin) MVLSPADKTNVKAAWGKVGAHAGEYGAEALERMFLSFPTTKTYFPHFDLSHGSAQVKGHGKKVADALTNAVAHVDDMPNALSALSDLHAHKLRVDPVNFKLLSHCLLVTLAAHLPAEFTPAVHASLDKFLASVSTVLTSK YR
0 E-value < 10≦ -40
Query sequence – human hemoglobin>gi|57013850|sp|P69905|HBA_HUMAN Hemoglobin alpha subunit (Hemoglobin alpha chain) (Alpha-globin) MVLSPADKTNVKAAWGKVGAHA
GEYGAEALERMFLSFPTTKTYFPHFDLSHGSAQVKGHGKKVADALTNAVAHVDDMPNALSALSDLHAHKLRVDPVNFKLLSHCLLVTLAAH
LPAEFTPAVHASLDKFLASVSTVLTSK YR
Position-Specific Iterated BLAST (PSI-BLAST)
Gene or Structureinformation
Position-Specific Iterated BLAST (PSI-BLAST)
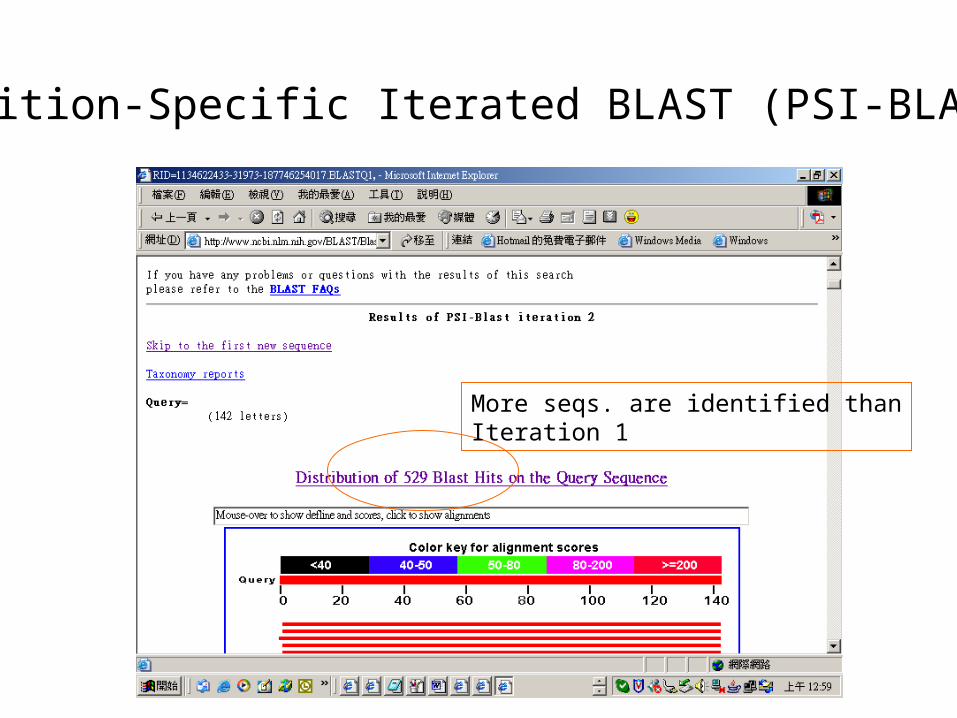
More seqs. are identified thanIteration 1
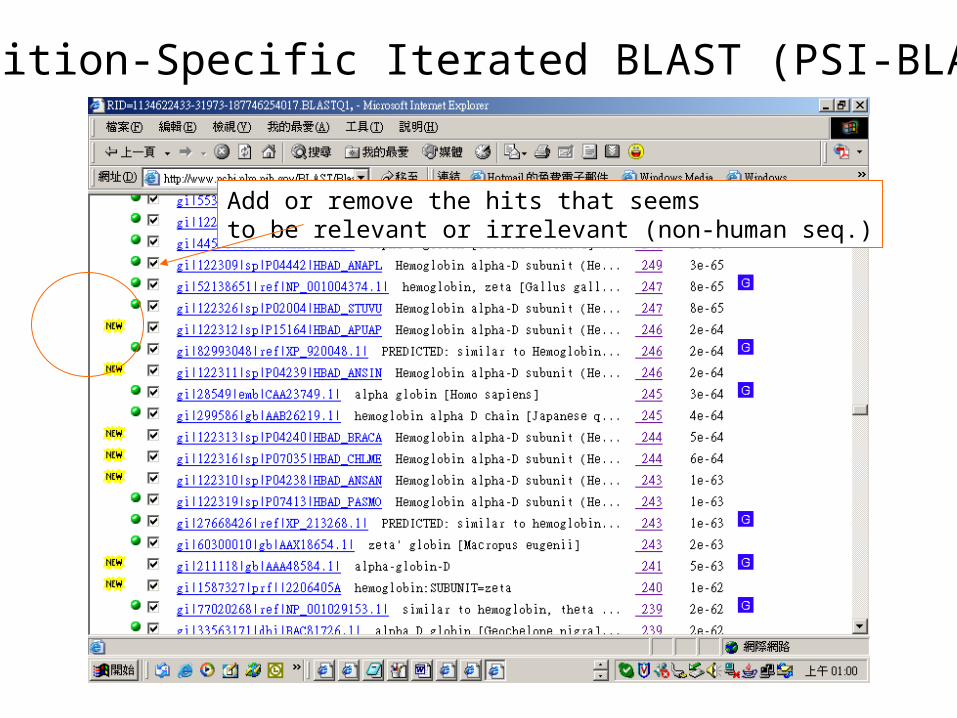
Position-Specific Iterated BLAST (PSI-BLAST)
Add or remove the hits that seemsto be relevant or irrelevant (non-human seq.)
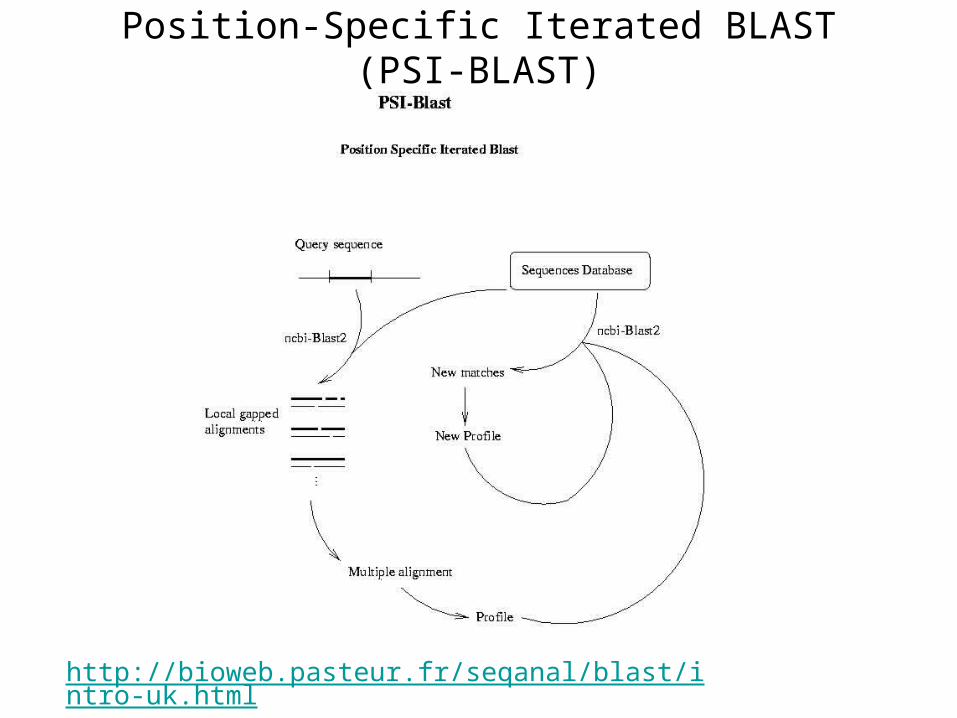
Position-Specific Iterated BLAST (PSI-BLAST)
http://bioweb.pasteur.fr/seqanal/blast/intro-uk.html
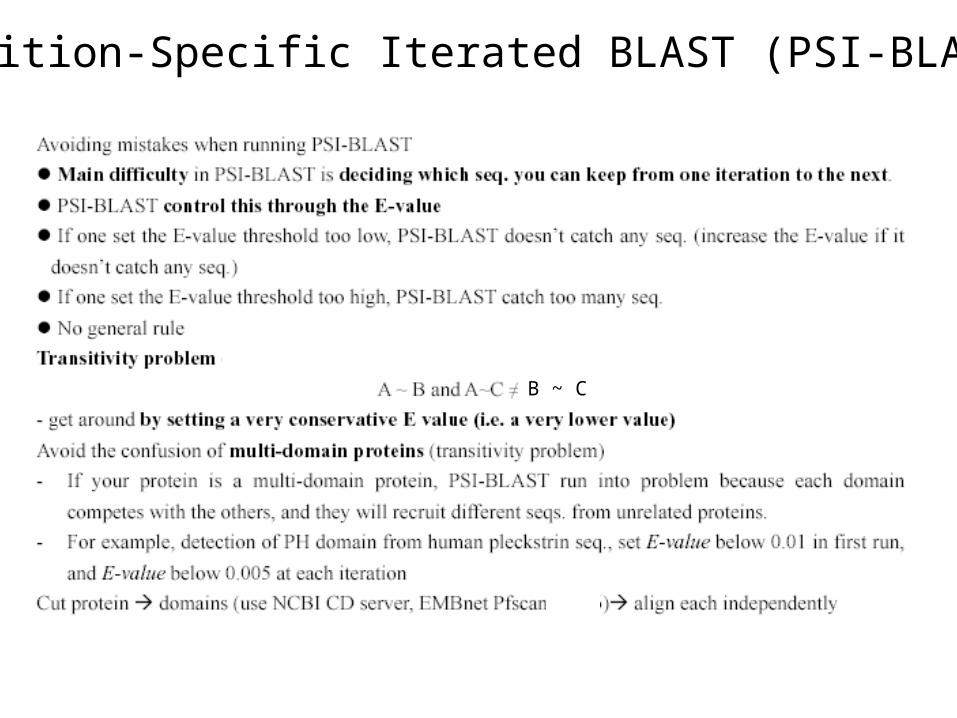
Position-Specific Iterated BLAST (PSI-BLAST)
B ~ C


