+ All Categories
Home > Documents > Services Sector Development: A Key to Poverty … · Services Sector Development: A Key to Poverty...

Services Sector Development: A Key to Poverty … · Services Sector Development: A Key to Poverty...

Date post: 08-Sep-2018
Category:
Upload: ledung
View: 213 times
Download: 0 times
Share this document with a friend
40
Services Sector Development and Impact on Poverty Thematic Working Group Services Sector Development: A Key to Poverty Alleviation in Mauritius Tandrayen-Ragoonbur Verena, Ragoobur Vishal and Poonoosamy Ken December 2009 indigenous growth
Transcript

Services Sector Development and Impact on Poverty Thematic Working Group

Services Sector Development: A Key to Poverty Alleviation in Mauritius

Tandrayen-Ragoonbur Verena, Ragoobur

Vishal and Poonoosamy Ken

December 2009

indigenous growth

0

Services Sector Development: A Key to Poverty Alleviation in Mauritius

Final Report Submitted by

Tandrayen-Ragoobur Verena

Ragoobur Vishal1

Poonoosamy Ken

Date: 15/11/09

1 Tandrayen-Ragoobur V. is lecturer at the University of Mauritius; Ragoobur V. is economist at

the Mauritius Employers’ Federation and Ken Poonoosamy, Board of Investment.

1

1. Introduction

The services sector is increasingly seen as a means to promote economic development

and reduce poverty. It is becoming the largest sector, in terms of share of GDP and

employment, in most developing countries. The services sector is highly diverse,

ranging, from infrastructure services such as telecommunications, construction,

transportation, financial services to tourism to business services that directly affect

firm competitiveness, to social services such as health or education. Infrastructure

services support all types of enterprises. Education, health, and recreational services

influence the quality of labour available to enterprises. Business and professional

services provide specialized expertise to increase enterprise competitiveness.

As an economy develops, certain service industries or sub-sectors become more

critical and drive development. Typically, utilities and construction are of initial

importance in creating an economic base. Then transportation and communication

services provide the economic infrastructure. Subsequently, financial and business

services become more sophisticated and support ongoing growth and specialization.

In parallel, there is usually a shift from low skill industries and consumer services (for

instance retail services) to high skill industries supported by intermediate services (for

example business services). The availability of high quality service inputs contributes

both to increasing the value-added of industrial goods and to generating higher skills

jobs.

In Mauritius, the services sector, contributes on average 68.5% of GDP, compared to

27.4% for the secondary sector and 4.1% by the primary sector which consists mainly

of agricultural activities. The tertiary sector grew by 5.7% in 2008. All the services

industries recorded increases in activities during the year. For instance, financial

intermediation grew by 10.1%, transport, storage and communications rose by 6.2%,

whilst real estates, renting and business grew by 7.1%. Education, which includes

services provided by both public and private operators, rose by 3.4% in 2008, and

other community, social and personal service activities increased by 8.3% in 2008,

slightly higher than the 8.0% growth registered in 2007.

2

The service industry continues to be a major engine of growth in Mauritius which is

driven in part by the rapid changes in information technology and telecommunications

that support service delivery. In keeping with the growth in services output, service

firms have also been the primary creators of new jobs, accounting for more than 80%

of employment level. Service industries provide opportunities for persons with

minimal resources, particularly women, to become self-employed and economically

productive. The vast majority of service enterprises include very small or micro

enterprises. Further, in many countries, the fastest growing component of

international trade continues to be services. In Mauritius, exports of services

registered a low growth of 2.6% in 2008 compared to 23.1% in 2007, mainly due to a

low growth in tourist earnings in 2008.

Besides its contribution to GDP growth, employment creation and rising share of

trade and foreign direct investment, the services sector needs also be of a very good

quality. The main challenge that the Mauritian economy now faces is how to

strengthen domestic supply capacity in services and reconcile trade, development,

social, and equity considerations. Due to the difficulties in measuring services output

and trade, and the resulting knowledge gaps, policy decisions are often made on the

basis of very inadequate information and unsubstantiated assumptions.

Thus the aim of the study is to analyse the contribution of the services sector on

economic growth and on poverty reduction in the Mauritian economy. The services

sector is a booming sector but the extent to which it reduces poverty and income

inequality is an empirical issue. Our first objective is to analyse the link between

services sector development and economic growth. Using time series data for the

Mauritian economy from 1970 to 2008, we model the rather complex relationship

between the services sector and economic development. As income increases, the

structure of the economy changes and there is a gradual movement from the

traditional sectors namely agriculture and manufacturing to more upstream sectors

like services. In this case, income drives the development of the services sector. On

the other hand, the expansion of the services sector contributes to higher economic

growth. In this case, it is economic growth that drives the services sector

development. Causality almost surely runs in both directions. The existence of

3

bidirectional causality between the two variables will be tested for the Mauritian

economy. Second, we examine the relative significance and contribution of the

services sector on economic growth and poverty. Lastly, this study outlines several

policy implications that draw upon the analysis. It provides a comprehensive

assessment and analytical inputs to policy-makers on the policy options available to

enhance the supply capacities and to maximize the contribution of trade, investment

and growth in services to economic development, and poverty alleviation in

Mauritius.

The structure of the study is as follows. Section 2 reviews the literature on the

contribution of the services sector to GDP growth and poverty reduction. Section 3

analyses the data and section 4 sets out the methodology used. Section 5 presents the

findings and we finally conclude in section 6.

2. Literature Survey

The main difference between services and other goods depend on the nature of market

transactions as well as intrinsic characteristics of services in relation to other goods

(Singh, 2006). Singh (2006) further posits that nature of the market and the intrinsic

characteristics of services are both subject to change as economies and technologies

evolve. Hill (1977) raises the feature of non-storability of services, which requires that

services must be consumed as they are produced and in a similar way. Griliches

(1992) in turn defines services as anything that is the result of labour that does not

produce a tangible commodity. It is precisely this absence of tangibility that leads to

non-storability, and to non-transferability.

Development economists’ doubts on services as a viable engine of growth and

employment generation has been expressed both through theoretical and empirical

analysis. This scepticism emanates from evidence of the relatively jobless nature of

service sector growth, in particular in the developing countries. Economic history

postulates that growth and employment in developing countries has normally been led

by an open manufacturing sector, both in the traded and non-traded sectors of the

economy. Growth theory accords no special role to service activities, with the

4

possible exception of financial and transport and telecommunication services. A

second stylized fact in development economics is that the share of services in

employment increases only with the rise in per capita incomes. However, given that

services have become the main source of growth in both developed as well as

developing countries, new empirical evaluation of this hypothesis has become crucial.

Many service industries are not stagnant and have experienced significant labour and

total factor productivity growth.

The economic literature has demonstrated the importance of the services sector in the

process of economic growth and social development. The process of economic

development is connected with systematic structural change in most countries: As per

capita income rises, the primary sector loses in importance, while the manufacturing

industry initially gains momentum but is eventually surpassed by the constantly

growing service sector. The dual economy model attempts to explain economic

growth by examining the role and relationship between the traditional agricultural

sector and modern manufacturing sector. As Glasmeier and Howland (1993) point

out, there exist two opposing schools of thought on the relationship between the

service producing sector and economic growth. On the one hand is the view that the

service producing sector can aid economic growth while on the other hand is the view

that the service producing sector should not be seen as independent of, nor is it a

replacement for, the traditional goods producing sector such as agriculture, mining,

and manufacturing.

Empirical studies on sector growth and performance have largely been an extension of

the dual economy model of Lewis (1954) and Hirschmann (1958). Fisher (1939) and

Clark (1940), emphasized the shift from agriculture to industry in the course of

economic growth; they in fact said little about the share of services. Kuznets (1953)

concluded that the share of services in national product did not vary significantly with

per capita income. Chenery (1960), when regressing the share of services on per

capita income, found an insignificant coefficient on the latter, concluding that the

relationship between services and per capita income is not uniform across countries.

Chenery and Syrquin (1975) regressed the service-sector share of output on per capita

income and per capita income squared, concluding that the relationship was concave

5

to the origin – that it rose with per capita incomes but at a decelerating rate.

Kongsamut, Rebelo and Xie (1999) found, in contrast, the share of services in output

to be linear in per capita income. Dutt and Lee (1993) use cross-section country-level

data from three decades (1960s, 1970s and 1980s) to examine the relationship

between the service producing sector and economic growth. They found that the

effect is negative or positive depending on how the role of the service sector is

measured, but argues that there is a strong case that effect is, in fact, usually negative.

Miles and Boden (2000) describe services as the ‘Cinderella sector’ which is largely

ignored. They argue, however, that as the share of services in national economies

continues to grow, and the linkages between services and other sectors of the

economy are extended, the tendency to overlook services becomes less tenable. In a

study of productivity accounts for 54 U.S. industries divided up into 25 goods

producing industries and 29 services producing industries within the U.S. private

nonfarm business sector for the years 1987-2001, Triplett and Bosworth (2004) argue

that the bulk of the post-1995 acceleration of productivity growth was within the

services producing industries. In the period after 1995, labour productivity in the

goods producing industries improved, but not nearly so much as it did in the services

producing industries. Multifactor productivity, moreover, accelerated strongly in

services producing industries but hardly at all in the goods producing sector.

Wu (2005) examines and compares service sector developments in two Asian giant

economies namely China and India. It investigates the determinants of demand for

services and sheds light on the outlook for service sector growth in the two countries.

The study reveals that growth in the services sector has mainly been driven by

increasing specialization of production, rising standard of living and accelerated

urbanization in both societies. There are also some non-economic factors which are

difficult to be quantified in empirical analysis but have played important roles in

service development in the two countries. These include biased development

strategies in China, India’s early linkage with the West and recent boom in Indian IT

exports. India’s service sector is seen as a dominant contributor to GDP growth but

employment absorption is not very high whilst the service sector has been the main

provider of new jobs in China where there still exists a sizable pool of rural surplus

6

labour to be shifted out of farming. In comparison with India, China’s service sector

is lagging behind. Even in international perspective, China’s service sector is below

the average.

Linden and Mahmood (2007) analyse the long run dynamic relationship between

sector shares (agriculture, manufacturing and services) and economic growth for 15

Schengen countries in period 1970-2004. Using panel co integration techniques, there

is evidence of a unidirectional causality from the growth rate of GDP per capita to

agriculture share growth, but a two-way causality runs between industry share growth

and growth rate of GDP per capita. The relationship between services share growth

and growth rate of GDP per capita is also bi-directional. Their study confirms that

feedback impacts exist between services sector and the growth rate of GDP per capita.

Busari (2007) investigates the process behind the declining contribution of the service

sector to GDP using a sample of 15 countries from the ECOWA sub region over the

period 1985 to 2006. Using a panel data regression analysis, the study analyses the

fundamentals driving the output of the service sector as a proportion of total national

output. The study observed that factors such as external debt service, domestic capital

formation, and household consumption are positively related to the transformation

process of the service producing sector while this process is negatively related to net

inflow of foreign direct investment.

Eichengreen and Gupta (2009) identify two waves of service sector growth, a first

wave in countries with relatively low levels of per capita GDP and a second wave in

countries with higher per capita incomes. The first wave is made of traditional

services whilst the second wave of modern (financial, communication, computer,

technical, legal, advertising and business) services that are receptive to the application

of information technologies and increasingly tradable across borders. They observe an

increase in the share of services in GDP at all levels of income after 1970 and, in

addition, of a further increase in the share of services in countries with relatively high

per capita incomes. The change in the second wave is not equally evident in all

countries: it is most apparent in countries that are open to trade, that are democratic,

and that are relatively close to the major global financial centres.

7

Evidently, the stylized fact is less than clear. Despite the huge number of studies on

service sector productivity and economic growth in the developed economies, there

exist little studies for Sub Saharan Africa. The underdeveloped nature of the sector

and the dominance of the informal sector which is largely a service producing sector

accounts for the dearth of studies on the sector in Sub Saharan Africa. To the best of

our knowledge there is no study assessing the impact of services sector development

on economic growth and poverty alleviation in Mauritius.

3. Situational Analysis of the Mauritian Economy

Trend in GDP Growth and GDP Per Capita

The Mauritian economy has come a long way since independence. Despite the

inherent constraints of a small island state, the country has achieved remarkable

economic success over the years. Back in 1968, the economy was entirely dependent

on sugar exports and showed little scope for sustained economic progress and

improvement in living standards. Mauritius has since evolved into an upper middle

income economy. Much of this impressive economic record can be traced back to the

economic diversification and development strategies adopted at distinct phases of the

country’s economic history.

Substantive reforms were, therefore, undertaken between 1980 and 1986 with the help

of the IMF and World Bank as part of the stabilisation and structural adjustment

programmes. The reform process set out to restructure and consolidate the agricultural

sector as well as accelerate the development of the export-oriented Clothing and

Textiles industry and the promotion of Mauritius as a select tourist destination. The

average annual growth rate was 5.9 % during the 1980-90 period. The sustained

period of high growth in the mid 1980s allowed a three fold increase in per capita

income and a significant improvement in living standards.

From the late 1980s to the mid 1990s, the economy underwent further diversification.

The development of the services sector was earmarked as an avenue for higher

growth. The establishment of a stock exchange in 1989, the liberalisation of the

financial sector and abolition of exchange control, the promotion of offshore business

activities and creation of a Freeport were geared toward positioning Mauritius as

regional financial, business and trading hub. The three major sectors of the economy

namely, Sugar, EPZ and Tourism as well as the new growth areas in Financial and

Business services provided the main engines for a solid and stable growth

performance. The economy grew at an average rate of 5.7 % between 1990 and 2000.

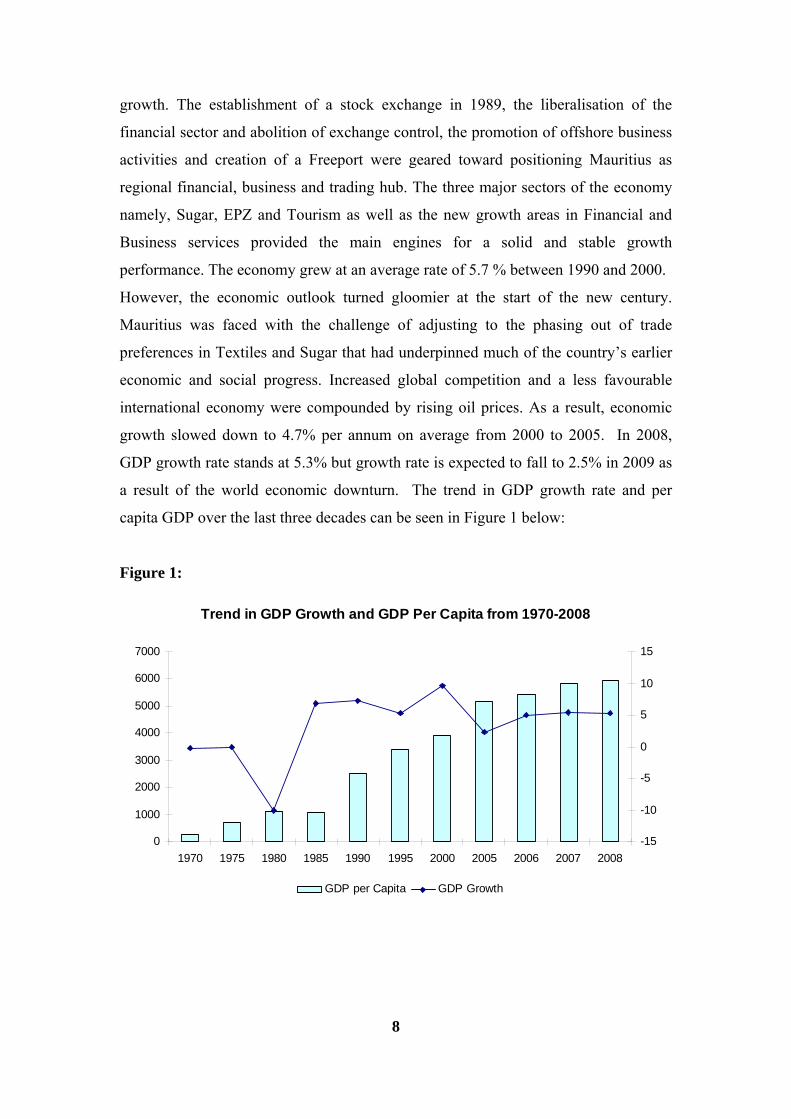
However, the economic outlook turned gloomier at the start of the new century.

Mauritius was faced with the challenge of adjusting to the phasing out of trade

preferences in Textiles and Sugar that had underpinned much of the country’s earlier

economic and social progress. Increased global competition and a less favourable

international economy were compounded by rising oil prices. As a result, economic

growth slowed down to 4.7% per annum on average from 2000 to 2005. In 2008,

GDP growth rate stands at 5.3% but growth rate is expected to fall to 2.5% in 2009 as

a result of the world economic downturn. The trend in GDP growth rate and per

capita GDP over the last three decades can be seen in Figure 1 below:

Figure 1:

Trend in GDP Growth and GDP Per Capita from 1970-2008

0

1000

2000

3000

4000

5000

6000

7000

1970 1975 1980 1985 1990 1995 2000 2005 2006 2007 2008-15

-10

-5

0

5

10

15

GDP per Capita GDP Growth

8

9

Poverty Situation

In Mauritius, less than 1% of the population fall below the $1 a day poverty line. It is

to be noted that $1 a day poverty line is usually used for less developed countries

where there is extreme poverty. Mauritius is an outlier in the Sub Saharan African

region and by the $2 a day poverty line, around 1.5% of the population lives in

extreme poverty. In fact, Mauritius has one of the strongest economies in Africa with

per capita income rising from US$216 in 1968 to US$5410 in 2006 and US$6000 in

2008 (as shown in Figure 1 above). Mauritius' rapid economic progress has helped to

reduce the proportion of the population living below the relative poverty line that is

half the household median income (Rs 2,168 per household per month) from 28.4% in

1981 to 10.6% in 1992 and around 8% in 2008.

Since the international poverty line does not give a clear indication of the level of

poverty in Mauritius, the government has adopted an income-based poverty line,

which is the relative poverty line and is set at half the median monthly household

income. From the latest household budget survey, the proportion of poor households

living below the relative poverty line has increased from 7.7% in 2001/02 to 8% in

2006/07. By the same measure, the proportion of poor persons below the relative

poverty line rose from 7.8% in 2001/02 to 8.7% in 2006/07. This can be shown by

Table 1 below:

Table 1: Selected summary indicators on poverty, 1996/97, 2001/02 and 2006/07

Relative poverty 1996/97 2001/02 2006/07

Poverty line:- Half median monthly income2 per adult equivalent (Rs)

2,004 2,804

3,818

Estimated number of poor households 23,800 23,700 26,900

Proportion of poor households (%) 8.7 7.7 8.0

Estimated number of poor persons 92,700 93,200 106,100

Proportion of poor persons (%) 8.2 7.8 8.7 Source: Household Budget Survey 2006/2007, CSO, Mauritius

2 Income refers to employment income, property income, transfer income, income from own produced

goods and imputed rent for non-renting households

10

The Mauritian government is presently implementing the ‘Eradication of Absolute

Poverty’ programme. This programme covers a range of actions to give greater

protection to the vulnerable groups and aims at empowering people and fighting

unemployment. A total sum of US$47 million has been recently targeted to these

social programmes. The ‘Eradication of Absolute Poverty’ programme provides

support to 5,000 children not attending pre-school and marginalized populations

which represent some 7,000 families living in absolute poverty. It is expected there

will be provision for medical screening for around 600 children of pre-primary

schools in selected areas. Spectacles, hearing aids, food supplements and other

facilities will be provided free to needy children.

Further, the government has strengthened the National Empowerment Foundation

(NEF), which is given a key coordinating role in fighting the remnants of poverty.

US$ 17.5 million have been allotted to the NEF for the funding of its sponsored

programmes namely, the functional literacy and numeracy programme and life-skills

training programme. For the last decade, a number of poverty schemes namely the

Trust Fund for the Social Integration of Vulnerable Groups, EU-funded Micro Project

Programme for Poverty Alleviation ‘A Nou Diboute Ensam’3 and IFAD Rural

Diversification Programme among others were established. All the existing poverty

alleviation programmes have been re-oriented on the basis of the participatory

approach where the poor are empowered with the necessary skills to move out of the

poverty trap. The main objectives of these schemes were the financing of community

development programmes, micro credit schemes, social infrastructural development,

and loans to needy students.

Though we may argue that poverty affects few households in Mauritius compared to

other African economies, it is however important to note that those affected remains

in poverty for a remarkable portion of their lifetime. It is vital to capture the

dynamics of poverty by differentiating between a poverty level where there is a high-

risk of becoming poor combined with a relatively high chance of leaving poverty, or

3 English Translation: ‘Let’s Stand Together’.

11

if the poverty level instead is due to a low risk of becoming poor combined with a low

chance of leaving poverty. In the former case poverty is a relatively brief and

temporary condition, while it is more persistent and chronic in the latter case.

Gaining insights about the flows into and out of poverty is essential from a policy

perspective; the effectiveness of different poverty reduction measures depends

crucially on the nature of poverty. If poverty is more temporary, programs that aim at

stabilization of short term income fluctuations are appropriate. If poverty is more

persistent, there seems to be a stronger need for measures improving the long-term

labour market outcomes or for social assistance.

Sectoral Contribution to GDP

The transformation of the Mauritian economic structure over time is reflected by

changes in the relative contribution of the main sectors4 to GDP. The primary sector

has been in decline since independence. Its contribution to GDP has fallen from

23.1% in 1968 to 4.4% in 2008. This is mainly explained by the contraction of the

sugar industry in GDP. Heavily dependent on climatic conditions, the sugar sector

faces even more uncertainty and difficult challenges ahead as the EU Sugar Protocol

becomes redundant. The drastic cut in sugar prices and the opening up of the EU

market to non-African Caribbean Pacific (ACP) developing countries has been a huge

set back to the Mauritian sugar industry. Its very survival will depend on the swift

implementation of important reforms to reduce costs, enhance competitiveness and

diversify into high value added activities such as the production of special sugars,

electricity generation from bagasse and production of ethanol and spirits.

The share of secondary sector output rose from 24.1% in 1968 to 31.7% in 1996 but

by 2008 it had fallen to 27.4%. The performance of the secondary sector is closely

linked to the growth of EPZ manufacturing. Despite falling slightly, the contribution

4 The primary sector includes Agriculture, Forestry and fishing and Mining and quarrying. The

secondary sector comprises Manufacturing, Electricity, Gas and water and Construction. The tertiary

sector covers Wholesale and retail trade, Hotels and restaurants, Transport, storage and

communications, Financing insurance, real estate, and business services, Community, social and

personal services including Public administration.

of the EPZ sector to GDP remained quite stable throughout the 1990s. However, with

the phasing out of the Multi-Fibre Agreement (MFA) and the removal of restraints on

the exports of low cost producers like China to the EU and US markets, the EPZ

sector is facing an ever-increasing global competitive threat.

The tertiary sector has maintained a constant expansion path since independence. Its

share in GDP has risen from 52.8% in 1968 to 68.5% in 2008. The increased

prominence of the service sector is mainly accounted for by the growth of Tourism

and Financial and Business Services. Tourism represented 8.6% of GDP in 2008

compared to a mere 1.8% in 1976. The growth rate of Financial and Business

Services has averaged 3.6%, 6.3% and 7.6% over the periods 1977-1986, 1987-1996

and 1997-2006 respectively. As a result, the sector’s share in GDP has increased from

15.9% in 1976 to 22.4% in 2008. The main drivers of the sector are banking,

especially the offshore segment, and business activities such as accounting,

management consultancy and legal services. The sectoral transformation of the

Mauritian economy can be shown by Figure 2 below:

Figure 2: Shares of Primary, Secondary and Tertiary Sectors in GDP in 1976 and

2008

1976

Primary23%

Secondary25%

Tertiary 52%

Primary Secondary Tertiary

12

2008

Primary4%

Secondary27%

Tertiary 69%

Primary Secondary Tertiary

13

From the above, we note a significant decline in the contribution of the primary sector

to GDP while the tertiary sector has shown a constant improvement over the years.

From Figure 3 below, it can be further observed that as the economy moved to higher

income levels, the share of the tertiary sector has increased while the contribution of

the primary sector has declined. The government strategy centred on further

diversifying the economic base in order to propel the economy onto higher levels of

sustainable development alongside the consolidation, modernisation and expansion of

the existing sectors has proved beneficial over the years.

Figure 3: Economic Structure and Level of Development

0

10

20

30

40

50

60

70

80

39440 44717 50180 57592 63906 70246 79365 88175 100042 108076 120291 132146 142485 157394 175597 185348 206328 235492 264854 279197

Level of Income

GD

P Sh

are

(%)

Manufacturing Primary Tertiary

Tertiary

Secondary

Primary

The current economic set up of Mauritius is characterised by structural changes as

evidenced by a lower contribution of the traditional sectors, namely sugar and textile

to GDP and a corresponding larger contribution of the tertiary sector, which includes

the services industries. Table 2 below presents the contribution to GDP of the main

sectors from 1976 to 2009.

16

Table 2: Percentage distribution of GDP by industry group (main sectors), 1976-2009

1976

1980 1985 1990 1995 2000

2005 2009

'

Agriculture, hunting,

forestry and fishing 22.5 12.4 15.3 12.9

10.4

7.0

6.0

4.2

Sugarcane 17.8 8.1 11.1 8.0 5.7 3.6 3.2 1.7

Other 4.7 4.3 4.2 4.8 4.6 3.4 2.8 2.5

Manufacturing 15.2 15.2 20.6 24.4 23.0 23.5 19.8 19.7

Sugar 5.5 2.4 3.2 3.4 1.6 0.8 1.0 0.5

Food excluding sugar - - - - - 4.1 5.1 7.1

Textiles and Clothing 2.6 4.3 9.5 - - 12.0 6.7 5.0

Other 7.1 8.5 7.9 - - 6.6 7.0 7.1

Construction 8.0 7.6 5.6 6.7 6.4 5.6

5.6

6.9

Hotels and restaurants 1.8 2.3 2.4 3.9 5.1 6.5 7.7 7.6

Transport , storage and

communications 8.5 11.3 10.9 10.4 11.4 13.0 12.6 11.0

Financial intermediation| 5.7 5.0 4.7 4.9 6.5 9.7 10.3 11.5

Insurance 4.2 3.3 2.9 1.5 2.1 2.3 2.9 2.8

Banks 1.5 1.7 1.8 0.0 4.4 6.6 6.2 7.4

Other 0.0 - 0.8 1.2 1.3

Real estate, renting and

business activities 10.2 12.7 11.1 8.9

8.5

8.9

10.2

11.9

Source: CSO, Mauritius | For the years 1976, 1980 and 1985, financial intermediation includes other business activities whilst real estate involved only ownership of dwellings. ' Forecast

The significant structural change comes from the agricultural sector with a

tremendous fall in the contribution of the sugar sector from 17.8% in 1976 to an

expected 1.7% in 2009. This large decline is attributed essentially to the EU sugar

reforms. With the EU price reduction of 5% in 2006 and a total of 36% in 2009, the

overall economic weight of the sector has fallen, albeit mitigated by the emerging

cane-related sector. The sugar sector’s contribution to GDP is now very small.

17

The textiles sector in particular witnessed negative sectoral growth rates over the

period 2003-05, including a record 14.7% drop in 2005. This is mainly attributed to

the impact of the dismantling of the Multi Fibre Arrangement. Though modest

positive growth was recorded in the subsequent years, the sector is yet to recover

gradually. The Construction sector contributed 5.6% to GDP in 2000 as compared to

an estimated figure of 6.9% for the year 2009. It should be noted that the GDP

sectoral real growth rate of the construction sector surged from 5.2% in 2006 to 15%

in 2007, mainly due to the construction of projects under the Integrated Resort

Scheme.5

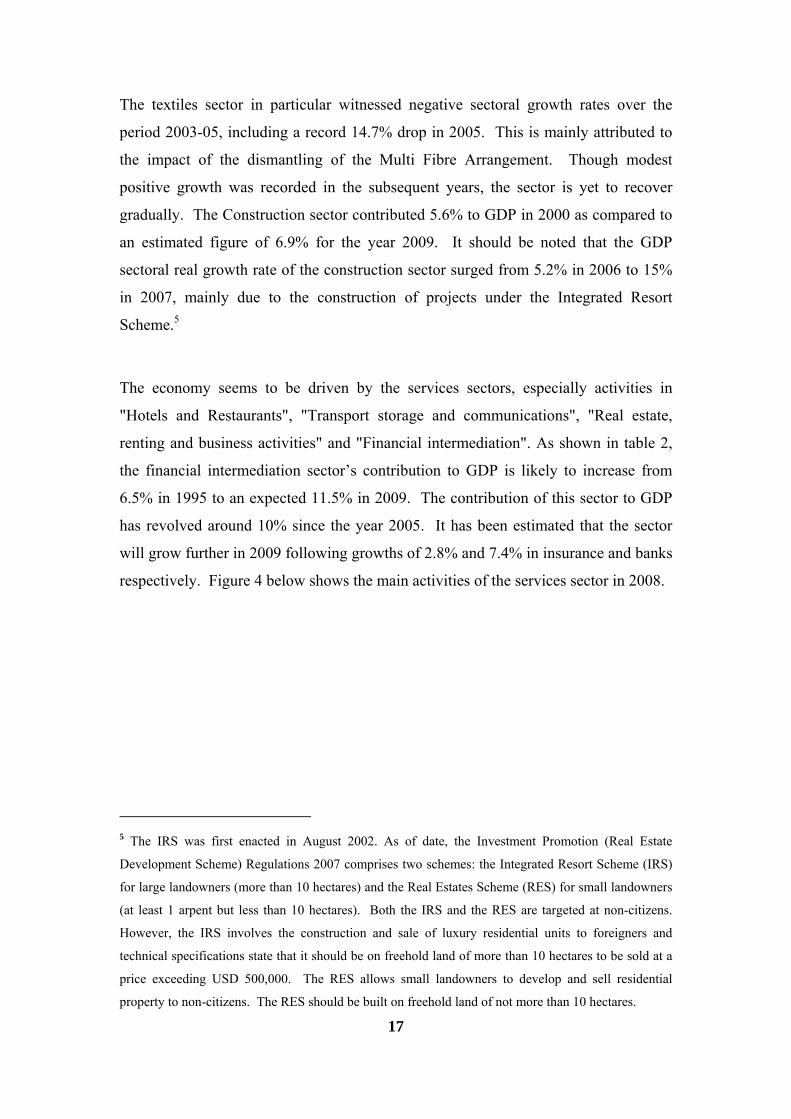
The economy seems to be driven by the services sectors, especially activities in

"Hotels and Restaurants", "Transport storage and communications", "Real estate,

renting and business activities" and "Financial intermediation". As shown in table 2,

the financial intermediation sector’s contribution to GDP is likely to increase from

6.5% in 1995 to an expected 11.5% in 2009. The contribution of this sector to GDP

has revolved around 10% since the year 2005. It has been estimated that the sector

will grow further in 2009 following growths of 2.8% and 7.4% in insurance and banks

respectively. Figure 4 below shows the main activities of the services sector in 2008.

5 The IRS was first enacted in August 2002. As of date, the Investment Promotion (Real Estate

Development Scheme) Regulations 2007 comprises two schemes: the Integrated Resort Scheme (IRS)

for large landowners (more than 10 hectares) and the Real Estates Scheme (RES) for small landowners

(at least 1 arpent but less than 10 hectares). Both the IRS and the RES are targeted at non-citizens.

However, the IRS involves the construction and sale of luxury residential units to foreigners and

technical specifications state that it should be on freehold land of more than 10 hectares to be sold at a

price exceeding USD 500,000. The RES allows small landowners to develop and sell residential

property to non-citizens. The RES should be built on freehold land of not more than 10 hectares.

Figure 4: The Main Activities of the Services Sector in 2008

0

2

4

6

8

10

12

14

Wholesale& retailtrade

Hotels &restaurants

Transport &com

Financial int Real estate& bus

activities

Public adm& defence

Education Health andsocial work

Othercommunity

& socialactivities

%

Investment in the Services Sector

From table 3 below, we observe that total domestic investment in the services sector

has been rising over the years with a greater share in the tourism sector and in real

estates and business activities. In 2008, local investment in real estates and tourism

sector amounts to 36.7% and 22.6% respectively. The Integrated Resort Scheme

(IRS) has in effect attracted huge investments both from locals and foreigners.

Together with investment in the constructions of new hotels, investment in IRS has

contributed positively to the development of the tourism sector. Further domestic

investment in the transport sector has also been on the rise with a growth rate of

50.8% between 2007 and 2008. Wholesale, retail trade and repairs has also attracted

major local investment in 2008.

18

19

Table 3: Domestic Investment in the Services Sector (1995-2008)

Domestic Investment in the Services Sector

(Rs M)

1995 2000 2005 2008

Education 345 487 1,326 1,678

Financial intermediation 551 535 1,336 1,258

Health and social work 136 343 543 1,293

Hotels and Restaurants 1,172 2,791 4,193 11,920

Real estate , renting and business activities 4,843 7,244 9,509 19,357

Public administration and defence;

compulsory social security

888 1,278 1,975 2,680

Transport , storage and communications 2,561 4,327 4,542 6,594

Wholesale & retail trade and repairs 1,211 2,193 2,736 5,499

Other community, social and personal

service activities and private households with

employed persons

440 1,065 2,349 2,508

Source: CSO, Mauritius

Moreover, Mauritius has also been able to attract considerable foreign investment in

recent years, particularly in financial services and the tourism sector (as shown by

Table 4 and Figure 5 below). The financial system in Mauritius, as in most

developing economies, is still dominated by banks. For the year 2007, banks held

73% of total financial sector assets – the insurance sector accounted for 13%, non-

bank deposit taking institutions for 8%. Leasing, credit finance, investment funds and

other financial institutions accounted for the remaining 6%. One of the major

attractions of Mauritius as a base for inward investment in several countries,

especially India, China and Pakistan is its network of double taxation treaties.

Mauritius has a growing network of double Tax Treaties with 33 countries6. The

health sector has recently attracted FDI essentially from India with the setting up of

Bramwell Apollo Hospital.

6 These countries are Barbados, Belgium, Botswana, China, Croatia, Cyprus, France, Germany, India,

Indonesia, Italy, Kuwait, Lesotho, Luxembourg, Madagascar, Malaysia, Mozambique, Namibia, Nepal,

Oman, Pakistan, Russian Federation, Rwanda, Senegal, Singapore, Sri Lanka, South Africa, Swaziland,

Sweden, Thailand, Uganda, United Kingdom and Zimbabwe.

Table 4: Foreign Direct Investment in the Services Sector (2002-2008)

Foreign Direct Investment in

the Services Sector (Rs M)

2002 2003 2004 2005 2006 2007 2008

Education - - - 2 55 30 74

Financial Intermediation 316 1,311 392 481 3,593 4,056 4,564

Health - - - - 2 29 120

Hotels and Restaurants 99 103 121 536 2,610 5,979 3,985

Real estates 100 109 228 759 473 1,030 1,888

Transport and Communication 13 1 47 191 56 18 22

Wholesale trade 386 288 123 510 198 38 103

Source: CSO, Mauritius

Figure 5: FDI across the Different Activities in the Services Sector (2002-2008)

0%

10%

20%

30%

40%

50%

60%

70%

80%

90%

100%

2002 2003 2004 2005 2006 2007 2008

Hotels and restaurants Financial Intermediation Real estatesTransport and Comm Wholesale trade EducationHealth

20

Employment in the Services Sector

Figure 6: Employment across Sectors in 2008

primary 6%

secondary 36%

tertiary 58%

primary sector secondary sector tertiary sector

In 2008, employment in the tertiary amounts to 58% of total employment in

Mauritius. This share has been increasing over the years essentially with the

development of the financial and tourism sectors. From Figure7, female employment

amounts to 34% whilst 66% are male workers.

Employment by Sex in Services Sector in 2008

Male66%

Female34%

Figure 7:

Employment in the financial sector for instance, has increased by about 25% since the

beginning of the present decade. Further from Figure 7 below, we note that a large 21

percentage of the labour force in the services sector in 2008 is concentrated in

wholesale and retail trade (14.8%), transport and communication (7%) as well as the

tourism sector (6.7%). Public administration and defence employs around 7.3% of

workers within the service sector in 2008.

Figure 8: Employment across Different Activities in the Services Sector (2006 -2008)

0 10 20 30 40 50 60 70 80 90

Wholesale & Retail Trade

Hotels and restaurants

Transport, storage and comms

Financial intermediation

Real estate, renting andbusiness activities

Public administration anddefence

Education

Health and social work

Other services

Employment by Activity in the Services Sector (2006-2008)

2006 2007 2008

Looking ahead, the emphasis in years to come must be on the adoption of a new

economic framework that fosters more skills intensive and diversified service-oriented

economic activities so as to ensure sustainable growth in the absence of the safety net

of trade preferences.

22

23

4. Data and Model Specification

The study uses data for Mauritius from 1975 to 2008 to estimate the models specified

below. The key data sources are the World Development Indicators (2008) and

different publications of the Central Statistical Office in Mauritius. Attention has

been given to the conversions and calculations for each specific variable in the

relevant form. Detailed information on the contribution of the services sector to GDP,

GDP per capita, GDP growth, investment, trade among others was collected. One

major limitation of the data is the unavailability of a poverty index for Mauritius over

this period of analysis. The headcount poverty index from the World Bank is

available only in the last few years and cannot be included in our analysis. We are

constrained to use income per capita as an indicator of poverty.

Variables Used

GDPPC is nominal gross domestic product per capita. GDPPC is used as a monetary

proxy for poverty. Though it may not be a proper proxy, we are constrained to use

this measure as data on head count poverty index or human poverty index are not

available for Mauritius over this time frame.

HotelGDP represents the contribution of the hotels and restaurants to GDP. It

measures the share of the tourism sector in the total domestic output of the Mauritian

economy.

WRTGDP denotes the wholesale and retail trade share of GDP. It measures the

contribution of whole sale and retail trade in the total domestic output of the

Mauritian economy.

FinanceGDP is financing, insurance, real estate and business services as a share of

GDP. The sector covers the financial sector and real estate.

TransGDP is the contribution of the transport sector to GDP. It covers transport,

storage and communications.

Inflation is the inflation rate for the Mauritian economy. Since the dependent and the

explanatory variables in the model are in nominal terms, inflation is included to

account for the change in prices and subsequently in the cost of living other the years.

This is likely to impact negatively GDPPC and thus standard of living.

Ser is the secondary enrolment ratio which is a measure of human capital. Higher

education is likely to contribute positively to growth and per capita GDP. Education

can help in obtaining a better job and subsequently leads to a rise in the standard of

living.

ExpsGDP represents exports as a share of GDP which is used as a measure of

openness. Higher exports to GDP leads to higher economic growth, but a more open

trade regime may initially have a negative impact on a small island economy and

essentially on local firms in terms of higher degree of competition.

Tel is number of telephone mainline per 1000 of inhabitants. This measure is used to

assess the level of development of the country. It has been rising over the years and a

good communication system will contribute positively to growth and GDP per capita.

Model Specification

The model used in this study is as follows:

ttttt

ttttt

TransGDPTelExpsGDPSerInflationFinanceGDPWTRGDPHotelGDPGDPPC

εννννννννα

+++++++++=

−19876

43210

lnlnlnlnlnlnlnln

5. Methodology

5.1 Autoregressive Distributed Lag (ARDL) Approach

24

The methodology adopted for our analysis will be in two parts. The first part of the

methodology employs the autoregressive distributed lag (ARDL) approach to

cointegration proposed by Pesaran et al. (2001)using the Microfit econometric

package. The ARDL bounds cointegration technique has been selected to determine

25

the long run and short run relationships between services sector and GDP per capita.

The choice of this methodology is based on several considerations. Firstly, as shown

by Pesaran et al. (2001), the ARDL models yield consistent estimates of the long run

coefficients that are asymptotically normal irrespective of whether the underlying

regressors are I(1) or I(0). Secondly, this technique generally provides unbiased

estimates of the long run model and valid t-statistics even when some of the

regressors are endogenous (Harris, 2003). Inder (1993) and Pesaran (1997) have

shown that the inclusion of the dynamics may help correct the endogeneity bias.

Thirdly, given the size of the sample used in this study and the number parameters to

be estimated the bound approach appears more appealing than the Johansen

cointegration technique, which would have required the estimation of a system of

equations and thus a considerable loss in degree of freedom.

Gujarati (1988) notes that a distributed lag model includes present and historical

values of the explanatory variables (the Xs) and an autoregressive model is one that

includes one or more lagged values of the predicted variable (Y) among its regressors.

In deriving the ARDL estimates Persaran and Shin (1995) include lagged values of

both the dependent and explanatory variables on the right hand side of the equation as

the regressors to illustrate the long run and short run relationship with the dependent

variable. The procedures to carry out the ARDL approach to cointegration technique

includes (i) the determination of the long run relationships among the variables used

in the models; and (ii) the estimation of the coefficients of the long and short run

relationships. A description of each of the above steps will be discussed below.

To estimate the ARDL model is to test for the presence of long run relationships

among the variables by using the Bounds F-Test. To implement the bound test

procedure, equation (1) is modeled as a conditional ARDL error correction model

(ECM) as follows:

ttt

tttt

ttt

n

iiti

n

iiti

n

iiti

n

iiti

n

iiti

n

iiti

n

iiti

n

iitit

TransGDPTelExpsGDPSerInflationFinanceGDP

WTRGDPHotelGDPGDPPC

TransGDPTelExpsGDP

SerInflationFinanceGDP

WTRGDPHotelGDPGDPPC

εηηηηηη

ηηη

ϕυω

λσβ

δαα

+++++++

+++

Δ+Δ+Δ+

Δ+Δ+Δ

+Δ+Δ+=Δ

−−

−−−−

−−−

=−−

=−

=−

=−

=−

=−

=−

=−

∑∑∑

∑∑∑

∑∑

2918

17161514

131211

11

11

111

110

lnlnlnlnln

lnlnln

ln

lnln

lnlnln

(2)

where α0 is a drift component and εt is the white noise error. The long run multipliers

are represented by the coefficients of the lagged level variables while αi, δi, βi, σi, λi,

ωi, υi and φi represent the short run impacts on GDP per capita. The equation is

estimated using OLS. The next step is to test the presence of cointegration by

restricting all estimated coefficients of lagged level variables equal to zero. That is

the null hypothesis of no cointegration

( )0: 9876543210 ========= ηηηηηηηηηH is tested against the alternative

hypothesis

( )0,0,0,0,0,0,0,0,0: 9876543210 ≠≠≠≠≠≠≠≠≠ ηηηηηηηηηH by the mean

of a F-test with an asymptotic non-standard distribution. Two asymptotic critical

value bounds provide a test for cointegration when the independent variables are I (d)

with 0 ≤ d ≤1. The lower bound assumes that all the regressors are I(0) , and the

upper bound assumes that they are I (1) . If the computed F-statistics lies above the

upper level of the band, the null is rejected, indicating cointegration (Pesaran and

Pesaran, 1997). If the computed F-statistics lies below the lower level band, the null

cannot be rejected, supporting the absence of cointegration. If the statistics fall within

the band, inference would be inconclusive.

Once the long run relationship has been established the final step of the ARDL

analysis involves estimating the coefficients of the long run relations and making

inferences about their values (Pesaran and Pesaran, 1997). This stage involves two

further steps. The first stage involves selecting the orders of the lags based on

Schwarz Bayesian Information Criteria (SBIC) or the Akaike Information Criteria

26

(AIC). In the second step, the selected optimal ARDL model restricted to the lag

structure defined in the first stage of the final ARDL process is then estimated

including the short run and error correction model. We construct a lagged error

correction term to substitute the whole set of lagged level variables. It is therefore

possible to estimate the short run coefficients as an error correcting model while

allowing for the long run estimates as follows:

ttt

n

iiti

n

iiti

n

iiti

n

iiti

n

iiti

n

iiti

n

iiti

n

iitit

ECM

TransGDPTelExpsGDP

SerInflationFinanceGDP

WTRGDPHotelGDPGDPPC

γψ

ϕυω

λσβ

δαα

++

Δ+Δ+Δ+

Δ+Δ+Δ

+Δ+Δ+=Δ

=−−

=−

=−

=−

=−

=−

=−

=−

∑∑∑

∑∑∑

∑∑

1

11

11

111

110

ln

lnln

lnlnln

(3)

ECMt-1 is the error correction term and its coefficient ψt is the speed of adjustment.

The other coefficients in the model are the short run dynamics that cause the model to

converge to equilibrium. These methodologies will be applied to avoid spurious

results.

The second stage includes conducting standard Granger causality tests augmented

with a lagged error-correction term. The Granger representation theorem suggests that

there will be Granger causality in at least one direction if there exists co-integration

relationship among the variables provided the variables are integrated order of one.

Engle-Granger (1987) cautioned that if the Granger causality test is conducted at first

difference through vector auto regression (VAR) method than it will be misleading in

the presence of co-integration. Therefore, an inclusion of an additional variable to the

VAR method such as the error-correction term would help us to capture the long-run

relationship. To this end, an augmented form of Granger causality test is involved to

the error-correction term and it is formulated in a bi-variate pth order vector error-

correction model (VECM) which is as follows:

27

( ) ( )( ) ( ) ⎥

⎤⎢⎣

⎡+⎥

⎤⎢⎣

⎡+⎥

⎤⎢⎣

⎡+

⎥⎥⎦

⎢⎢⎣

Δ

Δ⎥⎦

⎤⎢⎣

⎡+⎥

⎤⎢⎣

⎡=

⎥⎥⎦

⎢⎢⎣

Δ

Δ

=∑

2

1

2

1

11

11

1

1

1 2221

1211

2

1

ηη

λλ

CC

ECMECM

SERGDP

GDPPC

LdLdLdLd

KK

SERGDP

GDPPC

t

t

t

tp

it

t

(4)

where ∆ is a difference operator, ECM representing the error-correction term derived

from long-run co-integrating relationship via ARDL model, C (i = 1, 2) is constant

and (i = 1, 2) are serially uncorrelated random disturbance term with zero mean.

SERGDP is the services sector as a share of GDP. Through the ECM, the VECM

provide new directions for Granger causality to appear. Long-run causality can be

revealed through the significance of the lagged ECMs by t test, while F-statistic or

Wald test investigate short-run causality through the significance of joint test with an

application of sum of lags of explanatory variables in the model.

The Granger causality test is applied to equation (4) by firstly checking the statistical

significance of the lagged differences of the variables for each vector, which is a

measure of short run causality and second by examining the statistical significance of

the error-correction term for the vector that there exists a long run relationship.

To ascertain the goodness of fit of the ARDL model, the diagnostic test and the

stability test are conducted. The diagnostic test examines the serial correlation,

functional form, normality and heteroscedisticity associated with the model. The

stability test is conducted by employing the cumulative sum of recursive residuals

(CUSUM) and the cumulative sum of squares of recursive residuals (CUSUMsq).

Examining the prediction error of the model is another way of ascertaining the

reliability of the ARDL model. If the error or the difference between the real

observation and the forecast is infinitesimal, then the model can be regarded as best

fitting.

5.2 Unit Root Hypothesis

Prior to the application of the ARDL approach, the first step is to test for the

stationarity of each variable used in the model for unit roots. The use of non-

stationary variables in the time series analysis leads to misleading inferences (Libanio,

28

29

2005). The unit root test is applied to check the order of integration and it is a crucial

requirement for the existence of cointegration links (John, Nelson and Reetu, 2005).

The study uses the traditional Augmented Dicker Fuller (ADF) test to check for the

unit root in each variable and thereby determine the order of integration.

6. Findings

6.1 Results for Unit Root

Before applying the ARDL procedure, all variables are tested for stationarity. The

ADF test for stationarity analyses whether the mean and variance of the variables are

constant over time. It determines whether the variables in the model are stationary in

their levels or first difference forms. This enables us to assign the order of integration

for each variable i.e. I(0) or I(1) before identifying the possible long run linkages.

Table 5 below

Table 5: ADF Test Results

Variable Levels First Difference

Intercept Order of Integration Intercept Order of Integration

lnGDPPCt -4.01 I(0)

lnHotelGDPt -5.14 I(1)

lnWRTGDPt -5.79 I(1)

lnFinanceGDPt -6.42 I(1)

lnTransGDPt-1 -29.38 I(0)

Inflationt -3.41 I(0)

lnSert -8.01 I(1)

lnExpsGDPt -3.80 I(1)

Telt 12.13 I(0) Note: Critical value at 5% level is 2.95% for intercept but no trend

For the model to be valid, the variables must be either I(0) or I(1). Therefore the test

for stationarity confirmed this as seen by Table 5 above. GDP per capita, inflation,

telephone mainlines and the share of the transport sector to GDP; are stationary while

the other variables become stationary after differencing once.

30

6.2 Results for Bounds F test

The Bounds F test result in Table 6 below shows the results of the first stage with the

estimated F-test value indicative of the presence of the long run relationships among

the variables. As the calculated F-statistic of 4.11 exceeds the upper bound critical

value, then the null of no cointegration is rejected. As cointegration is confirmed, we

move to the second stage where the ARDL model can be established to determine

long run and short run relationships. We further estimate the long-run coefficients of

the GDP per capita equation and the associated ARDL error correction models.

Table 6: Bound F Test Results

Model Critical Values Band Estimated F test value

Pass/Fail

Equation (2) I(0) I(1)

2.850 3.805 4.11 Pass

6.3 ARDL Model and Long Run Dynamics

In the second stage, the ARDL, long run and the short run ECM coefficients are

estimated by using Schwartz Bayesian Criteria to select the appropriate lags. Given

the time series period from 1976 to 2009, the lag length has been set to maximum

order of 1. The model’s diagnostic tests for serial correlation, functional form,

normality of residuals and heteroscedasticity do not indicate any concern. The results

are reported in Table 7 below.

31

Table 7: ARDL (1, 0, 1, 1, 0, 0, 0, 0) selected based on Schwarz Bayesian Criterion.

Dependent Variable is lnGDPPCt

Variable Coefficient Standard Error T-ratio

lnGDPPCt-1 0.799*** 0.037 21.629

lnHotelGDPt 0.102* 0.057 1.810

lnWRTGDPt 0.212** 0.094 2.244

lnWRTGDP t-1 0.229** 0.090 2.547

lnFinanceGDPt 0.126*** 0.038 3.292

lnFinanceGDP t-1 0.178*** 0.055 3.226

lnTransGDP t-1 0.355*** 0.078 4.576

Inflationt -0.002** 0.0008 -2.525

lnExpGDPt 0.185** 0.078 2.375

lnSert 0.354** 0.163 2.170

Telt 0.003*** 0.0007 4.917

Constant 1.387* 0.716 1.931

R-squared 0.999 No of Obs. 33

Once we established that a long-run cointegration relationship existed, equation (2)

was estimated using the following ARDL (1, 0, 1, 1, 0, 0, 0, 0) specification. The long

run estimates of the model are presented in Table 8 below.

Table 8: Estimated long run coefficients using the ARDL approach selected based on

Schwarz Bayesian Criterion. Dependent Variable is lnGDPPCt

Variable Coefficient Standard Error T-ratio

lnHotelGDPt 0.509** 0.233 2.188

lnWRTGDPt 2.192*** 0.507 4.327

lnFinanceGDPt 1.514*** 0.201 7.528

lnTransGDP t-1 1.767*** 0.348 5.079

Inflationt -0.010*** 0.003 -2.895

lnExpGDPt 0.918** 0.395 2.327

lnSert 1.760** 0.731 2.408

Telt 0.017*** 0.002 6.743

Constant 6.873* 3.337 2.060

No of Obs. 33

32

The estimated coefficients of the long-run relationship show that the services sector in

terms of the tourism sector, whole sale retail trade, financial sector and transport and

communication have a very high significant positive impact on GDP per capita. A

1% expansion in the tourism sector for instance leads to approximately 0.10%

increase in GDP per capita. Similarly a 1% growth in transport and communications

leads to 1.77% increase in GDP per capita. Among the different service activities,

whole sale and retail trade seems to contribute more to per capita GDP. In fact

growth in this activity has been increasing substantially over the last decade. Other

variables like inflation for instance has a significant negative impact on standard of

living as high prices reduce purchasing power of individuals. Education captured by

secondary enrolment ratio has a positive effect on GDP per capita, showing that

education is an essential means to get people out of poverty. Higher education

implies better jobs and higher income levels. Telephone mainlines which is included

as a measure of development has a positive effect on GDP per capita. Good

communication services are crucial in the promotion of economic development.

Foreign investors are often attracted to location where the basic infrastructural

development and services are available. Good communication facilities among other

services thus contribute positively to economic performance and prospects of

Mauritius.

6.3 ARDL-ECM– Short Run Dynamics

In addition to the ARDL results, our next set of findings report the short run estimates.

The fact that the variables in the model are cointegrated provides support for the use

of an ECM representation in order to investigate the short run dynamics. Estimation

results still based on Schwartz Bayesian Criteria are presented in Table 8 below. the

R2 value of 0.814 suggests that the ECM fits the data reasonably well. In terms of the

short run relationships we observe a positive and significant impact of the different

services activities on per capita GDP. Higher positive short term effects are noted

from the transport and communication sector as well as wholesale retail trade

activities. The signs of the short run dynamics are maintained to the long run. The

other variables are as per prior expectations.

33

Table 8: Error Correction representation for the selected ARDL model

Dependent Variable is ∆lnGDPPCt

Variable Coefficient Standard Error T-ratio

∆lnHotelGDPt 0.102* 0.057 1.810

∆lnWRTGDPt 0.212** 0.094 2.244

∆lnFinanceGDPt 0.126*** 0.038 3.292

∆lnTransGDP t-1 0.355*** 0.078 4.576

∆Inflationt -0.002** 0.0008 -2.525

∆lnExpGDPt 0.185** 0.078 2.375

∆lnSert 0.354** 0.163 2.170

∆Telt 0.003*** 0.0007 4.917

Constant 1.387* 0.716 1.931

ECM t-1 -0.201*** 0.0369 -5.447

R-squared 0.814 No of Obs. 33

6.4 Stability of the Model

Finally, we examine the stability of the long-run coefficients together with the short-

run dynamics. In doing so we follow Pesaran and Pesaran (1997) and apply the

CUSUM and CUSUMSQ (Brown, Durbin, and Evans, 1975). The tests are applied to

the residuals of the model. Specifically, the CUSUM test makes use of the cumulative

sum of recursive residuals based on the first set of n observations and is updated

recursively and plotted against break points. If the plot of CUSUM statistics stays

within the critical bounds of 5% significance level [represented by a pair of straight

lines drawn at the 5% level of significance whose equations are given in Brown,

Durbin, and Evans (1975)], the null hypothesis that all coefficients in the error

correction model are stable cannot be rejected. If either of the lines is crossed, the null

hypothesis of coefficient constancy can be rejected at the 5% level of significance. A

similar procedure is used to carry out the CUSUMSQ test, which is based on the

squared recursive residuals. Figure 9 shows a graphical representation of the CUSUM

and CUSUMSQ plots. Neither CUSUM nor CUSUMSQ plots cross the critical

bounds, indicating no evidence of any significant structural instability.

Figure 9

2009

15 10 5 0

-152007200219971987 19921977 1982

-10-5

The straight lines represent critical bounds at 5% significance level

Plot of Cumulative Sum of Recursive Residuals

Plot of Cumulative Sum of Squaresof Recursive Residuals

2009

1.5

1.0

0.5

0.0

-0.5 2007200219971977 1982 1987 1992

The straight lines represent critical bounds at 5% significance level

6.5 Granger Causality Test

The Granger causality test indicates that the services sector has a positive and

significant long run effect on GDP per capita. Causality is established from the

services sector to GDP per capita in the long run while causality is observed from

GDP per capita and the services sector in the short run only. The services sector is

viewed as a long terms growth strategy which is seen to play a significant role for a

34

35

small island economy like Mauritius. Though the level of economic development

may also help to foster the services sector, we observe that it is important in the short

run only.

7. Conclusion and Policy Implications

The paper investigated the dynamic relationship between services sector development

and GDP per capita for Mauritius by using annual time series data from 1976-2009,

using the bounds testing (ARDL) approach to co integration. We examine the long

run and short run relationships between services sector development and GDP per

capita. The bounds test suggested that the variables of interest are bound together in

the long-run. The associated equilibrium correction was also significant confirming

the existence of long-run relationships. The equilibrium correction is also fairly fast

and is restored by less than three months of the year.

Our findings confirm that the services sector contribute positively to GDP per capita

and wholesale retail trade has the strongest impact on the economy followed by the

transport and communication sector and the financial sector. Tourism is also seen to

contribute positively to the Mauritian economy. The results also confirm that

secondary enrollment ratio, inflation, telephone mainlines and exports as a share of

GDP are important elements in explaining GDP per capita. Further the empirical

result shows that there is evidence of causality from the services sector to GDP per

capita in the long run while causality is observed from GDP per capita and the

services sector in the short run only.

The major limitation of our study rests on the measurement of poverty. We have used

a monetary indicator which is GDP per capita. We also tried another measure which

is the Human Development Index (HDI). The HDI is comprised of three sub-indices

that measure health and lifespan, education and knowledge, and standard of living. It

attempts to describe achievement of development goals related to quality of life. It is

aggregated from four indicators: life expectancy, adult literacy, the gross school

enrollment index, and GDP per capita. However, HDI data is available over a five

year period and we do not have a continuous time series data for the variable.

36

Nonetheless, we attempt to apply linear interpolation methodology and thereafter

apply the data for regression analysis using the same variables in the above analysis

(results not reported). One major problem is that the HDI does not vary much over

the years and may not be an appropriate index to use for time series analysis.

From the results, a policy suggestion for enhanced GDP per capita in Mauritius will

be the promotion of the services sector and its various activities. The government

may also focus on human resource development in an attempt to create the skilled

labour force which is highly required by the services sector. We have also noted that

trade openness has positive implication which implies that trade liberalisation of the

economy and export promotion must be among the priorities of policy makers.

Further a required level of development is also important to foster the development of

the services sector. We have seen that in the event of the world economic downturn,

the Mauritian government has attempted to mitigate the negative consequences of the

global economic crisis through an appropriate policy mix. Mauritius has been

considered as an outlier in the Sub Saharan African region and is further seen as an

example in setting the right strategies in difficult times. Mauritius has so far been

resilient to the crisis relative to other African countries or emerging economies. The

two main reasons which underline the economy’s resilience to such an unprecedented

external shock is the effectiveness of the reforms which have been implemented

during the past three years. The second is the robustness of the financial system as

recognised by the IMF. The reforms have opened the economy and made it more

versatile and have also given the country the fiscal space required to deal with such a

crisis.

37

References

Barry Eichengreen and Poonam Gupta, (2009), ‘The Two Waves of Service Sector

Growth’, NBER Working Papers 14968.

Chenery, H. and M. Syrquin (1975), Patterns of Development 1950-70. Oxford UP.

Chenery, H.B. (1960), ‘Pattern of Industrial Growth’, American Economic Review,

50, 624-654.

Clark, C. (1940), revised and reprinted in 1951, The Conditions of Economic

Progress, London, Macmillan.

Dutt, Amitava Krishna and Lee, Keun Young, (1993), ‘The Service Sector and

Economic Growth: Some Cross-Section Evidence’. International Review of Applied

Economics, 7(3), 311-29.

Fisher, A.G.B. (1939) Production, Primary, Secondary, Tertiary’, Economic Record,

15 , 24-38.

Glasmeier Amy and Marie Howland .1993. 'Service-Led Rural Development:

Definitions, Theories, and Empirical Evidence' International Regional Science

Review, 16 (1-2), 197-229.

Griliches, Zvi (1992), (ed.), Output Measurement in the Service Sectors, NBER

Studies in Income and Wealth, 56, University of Chicago Press, Chicago.

Gujarati Damodar N. (1988) Basic Econometrics, McGraw-Hill.

Harris, R. and Sollis, R., (2003), “Applied Time Series Modeling and Forecasting

Wiley, West Sussex.

Hill, T. P. (1977), ‘On Goods and Services’, Review of Income and Wealth, 23 (4),

315-338.

38

Hirschmann, A. O. (1958), The Strategy of Economic Development. New Haven,

Conn.:Yale University Press.

John Glynn, Perera Nelson and Verma, Reetu (2005), ‘Unit Root Tests and Structural Breaks: A Survey with Applications’, Revista De M’etodos Cuantitativos Parala Economia Y La Empresa 3, 63-79.

Kongsamut, Piyabha, Rebelo, Sergio, Xie, Danyang (2001), ‘Beyond Balanced

Growth’, IMF Working Paper.

Kuznets, Simon. (1953), ‘Shares of Upper Income Groups in Income and Savings’,

National Bureau of Economic Research.

Lewis, W. A. (1954), 'Economic Development with Limited Supplies of Labour,'

Manchester School of Social Science, 22, 139-91.

Libanio, G. A. (2005). Unit roots in macroeconomic time series: theory, implications and evidence. nova Economia Belo Horizonte15 (3)145-176.

Mikael Linden and Tahir Mahmood (2007), ‘Long run relationships between sector

shares and economic growth – A Panel Data Analysis of the Schengen Region’,

Keskustelualoitteita 50

Miles, I. and Boden, M. (2000), Introduction: Are services special?, Services and the

Knowledge-Based Economy, Edited by Boden, M and Miles, I, Continuum, London

and New York.

Pesaran and Shin (1995), ‘An Autoregressive Distributed Lag Modeling Approach to

Cointegration Analysis’, DAE Working Papers, 9514.

Pesaran, H. M and B. Pesaran (1997), Working with Microfit 4.0: Interactive

Economteric Analysis. London: Oxford University Press.

Pesaran, H. Shin, Y. and Smith, R. (2001). ‘Bound testing approaches to the analysis

of level relationships’, Journal of Applied Econometrics, 16, 289-326.

39

Singh Nirvikar, (2006), ‘Services-led Industrialization in India: Assessment and

lessons’; http://www.mpra.ub.uni-muenchen.de/ 1276/

World Bank (2008), World Development Indicators, Washington, D.C.: World Bank.

Wu,Yanrui.(2007), ‘Service Sector Growth in China and India: A Comparison China’,

An International Journal, 5 (1), 137-154.


Recommended