83
Session 2 - Budgeting Columbia University Medical Center Training Certification Program For Senior Financial Administrators - Session 2
| Date post: | 19-Dec-2015 |
| Category: |
Documents |
| View: | 217 times |
| Download: | 3 times |
Session 2 - Budgeting
Columbia University Medical CenterTraining Certification Program For Senior Financial Administrators - Session 2

Session 2 - Budgeting
Session 2: Fundamentals of Budgeting Part 1: Budgeting Basics
Part 2: Types of Budgets
Part 3: Overview: CUMC Integrated Planning Approach
Part 4: Developing Budgeting Metrics
Part 5: Multi-year Financial Planning
Part 6: Capital Planning and Budgeting
Part 7: Capital Assets and Depreciation
February 2005Session 2 - Budgeting Page 3
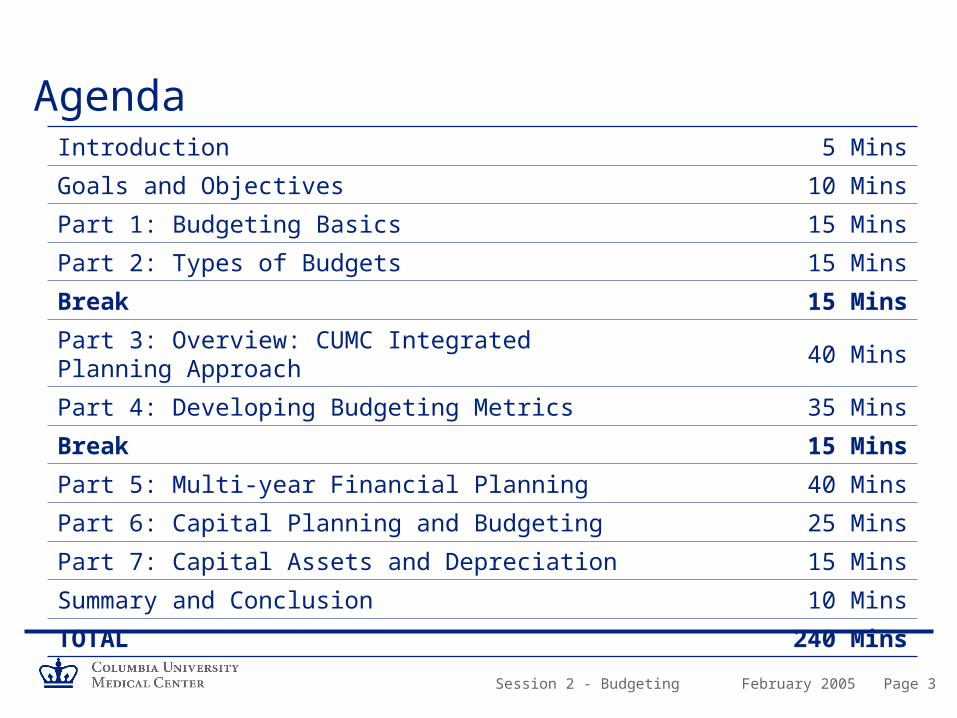
AgendaIntroduction 5 Mins
Goals and Objectives 10 Mins
Part 1: Budgeting Basics 15 Mins
Part 2: Types of Budgets 15 Mins
Break 15 Mins
Part 3: Overview: CUMC Integrated Planning Approach 40 Mins
Part 4: Developing Budgeting Metrics 35 Mins
Break 15 Mins
Part 5: Multi-year Financial Planning 40 Mins
Part 6: Capital Planning and Budgeting 25 Mins
Part 7: Capital Assets and Depreciation 15 Mins
Summary and Conclusion 10 Mins
TOTAL 240 Mins

February 2005Session 2 - Budgeting Page 4
Session Objectives
– Understand budgets and why they are so important
– Provide an overview of types of budgets
– Understand key roles and responsibilities in the budget process
– Understand “all funds” budgeting
– Understand how individual budget submissions rollup to overall at CUMC and University level
– Understand how budgeting performance metrics relate to the annual budget
– Understand strategic, long-term planning
– Understand the methodology for planning and budgeting of capital
– Understand how assets are capitalized and depreciated
Session 2 - Budgeting
Part 1 Budgeting Basics
February 2005Session 2 - Budgeting Page 6
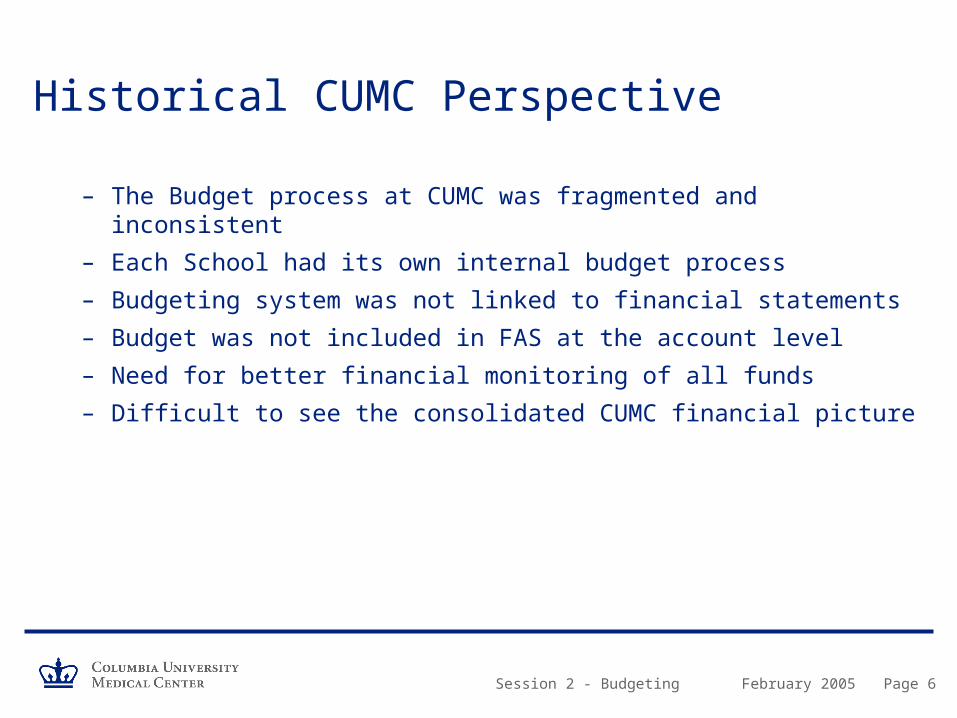
Historical CUMC Perspective
– The Budget process at CUMC was fragmented and inconsistent
– Each School had its own internal budget process
– Budgeting system was not linked to financial statements
– Budget was not included in FAS at the account level
– Need for better financial monitoring of all funds
– Difficult to see the consolidated CUMC financial picture

February 2005Session 2 - Budgeting Page 7
Current CUMC Perspective
– Implementation across University of all funds budgeting started in FY03/04
– Budgeting tool allowed departments to build a “bottom up” all funds budget, beginning at the (ten digit) account level
– The budget tool allowed direct import of budget information into the FAS system
– All funds budgeting provides better monitoring of results and available resources
– Both unrestricted and restricted accounts are budgeted
– Evolving process
February 2005Session 2 - Budgeting Page 8
What is a Budget?– A budget is a plan for projecting the achievement of an organization’s goals
– It is a plan of action for receiving and spending money within a specific period of time
– Budgets record the realistic goals and objectives of the organization.
– Expectations for achieving goals are based on past experience, current information and assumptions about the future
– Serves as a tool to ensure that financial exposure of the organization are anticipated

February 2005Session 2 - Budgeting Page 9
Why Is It Important?
Business StrategyVehicle for operationalizing strategy by aligning resources with goals and priorities
Resource AllocationMechanism for allocating limited resources to the various needs of an organization
Monitoring ActivitiesTool to monitor the financial activities during the year allowing management to adjust plans and spending as needed
ControlTool for controlling spending and avoiding deficits by encouraging sensible spending
CommunicationHelps to communicate plans and expectations around organizational goals

February 2005Session 2 - Budgeting Page 10
What Resources Drive the Program?– Number and type of students
– Number of procedures
– Payor mix• Managed care plans
• Health insurance plans
• Medicare
• Medicaid
• Self Pay
• Indigent
– Philanthropic Activities
– Space
February 2005Session 2 - Budgeting Page 11
What Resources Drive the Program? (cont’d)– Sponsored Research Mix
• Government NIH awards
• Government NSF awards
• Government DOD contracts
• Government training awards
• Foundation awards
• State grants and contracts
– F&A Cost Recovery
– Innovative “cutting edge” programs vs. traditional ones
– Seasonality• Cyclical - cash coming in
February 2005Session 2 - Budgeting Page 12
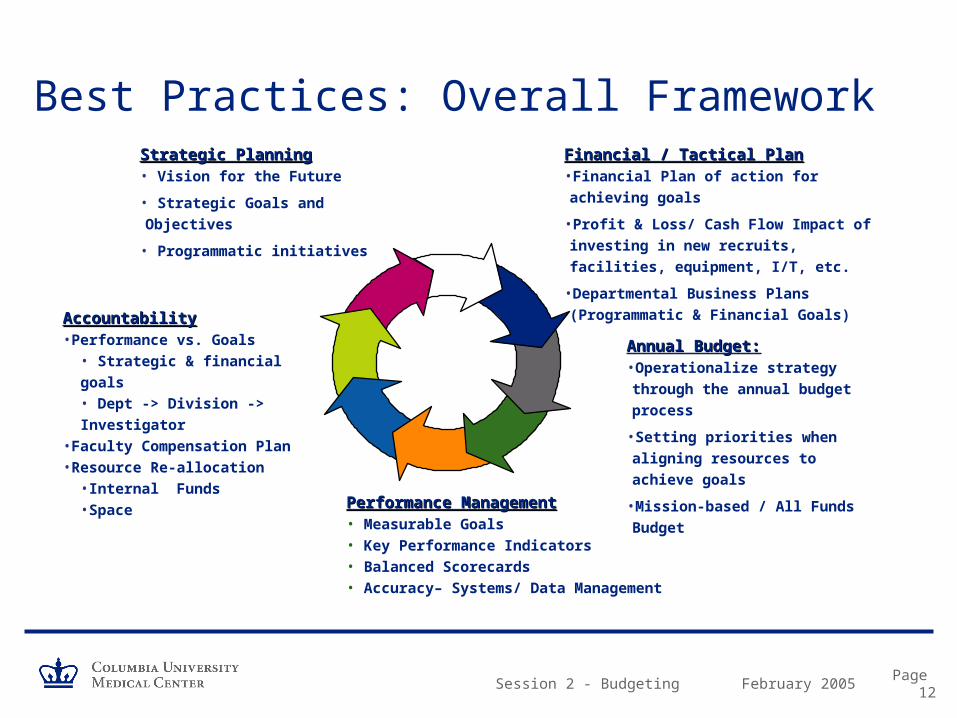
Best Practices: Overall FrameworkStrategic PlanningStrategic Planning• Vision for the Future
• Strategic Goals and Objectives
• Programmatic initiatives
Financial / Tactical PlanFinancial / Tactical Plan•Financial Plan of action for achieving goals
•Profit & Loss/ Cash Flow Impact of
investing in new recruits, facilities,
equipment, I/T, etc.
•Departmental Business Plans
(Programmatic & Financial Goals)
Annual Budget:Annual Budget:•Operationalize strategy through
the annual budget process
•Setting priorities when aligning
resources to achieve goals
•Mission-based / All Funds Budget
Performance ManagementPerformance Management• Measurable Goals• Key Performance Indicators• Balanced Scorecards• Accuracy– Systems/ Data Management
AccountabilityAccountability•Performance vs. Goals
• Strategic & financial goals• Dept -> Division -> Investigator
•Faculty Compensation Plan•Resource Re-allocation
•Internal Funds •Space
Session 2 - Budgeting
Part 2 Types of Budgets
1. Unrestricted Fund
2. Incremental
3. Zero-Base
4. Mission Base

February 2005Session 2 - Budgeting Page 14
Unrestricted Fund Budgeting– Unrestricted Income 1-XXXXX
• ICR
• Tuition and fees
• State aid
– Unrestricted Expenses 2-XXXXX• Deans’ central funds
– Academic program / Departmental administration
• Operation of Central Administration support
• University common costs
• Debt service
– All other funds not budgeted and loosely monitored

February 2005Session 2 - Budgeting Page 15
Incremental Budget Process– Analysis of various market driven indices
• Market basket Higher Education (HECPI)
• Research index
• Utilities– Gas, electric, oil
• Compensation benchmarks– Faculty
– Technical staff
– These indices were applied to prior year base-line budget
– New program initiatives were added
– Remove nonrecurring items

February 2005Session 2 - Budgeting Page 16
Zero-Base Budget Process– Reassess resource allocations to programs / departments / centers
– Define the basic needs of resources to perform the program or department services
– Evaluation of each incremental element or cost of operation• Position by position
• Service by service
– Each incremental resource unit is justified to mission and service delivery

February 2005Session 2 - Budgeting Page 17
Mission Based BudgetingWhat is it comprised of?
– Instruction• Student instruction
• Graduate research training
• Resident training
– Patient Care• Clinical activities
• Hospital activities
– Research• Sponsored research
• Institutionally funded research

February 2005Session 2 - Budgeting Page 18
Mission Based Planning and AnalysisBefore MBB costing, department results were presented as follows:
Revenues Clinical Income 32,000 Research/Grant & Contracts 23,700 F&A recovery 7,000 Clinical Trials 1,500 Gifts 400 Endowment 1,000 Total Revenues 65,600
Expenses Faculty Salaries 18,300 Support Salaries 9,500 Post Docs 4,100 Benefits 8,500 Other 14,500
Assessments FPP/ Deans tax 4,000 F&A recovery 7,000 Total Expenses 65,900
Department Results (300)
February 2005Session 2 - Budgeting Page 19
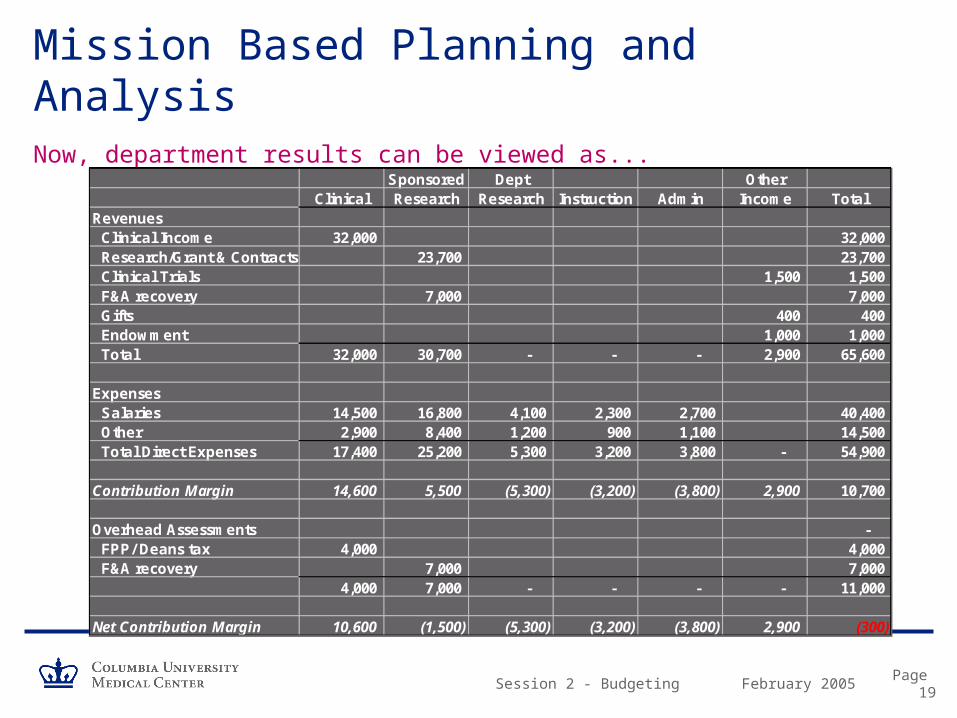
Mission Based Planning and AnalysisNow, department results can be viewed as...
Sponsored Dept OtherClinical Research Research Instruction Admin Income Total
Revenues Clinical Income 32,000 32,000 Research/Grant & Contracts 23,700 23,700 Clinical Trials 1,500 1,500 F&A recovery 7,000 7,000 Gifts 400 400 Endowment 1,000 1,000 Total 32,000 30,700 - - - 2,900 65,600
Expenses Salaries 14,500 16,800 4,100 2,300 2,700 40,400 Other 2,900 8,400 1,200 900 1,100 14,500 Total Direct Expenses 17,400 25,200 5,300 3,200 3,800 - 54,900
Contribution Margin 14,600 5,500 (5,300) (3,200) (3,800) 2,900 10,700
Overhead Assessments - FPP/ Deans tax 4,000 4,000 F&A recovery 7,000 7,000
4,000 7,000 - - - - 11,000
Net Contribution Margin 10,600 (1,500) (5,300) (3,200) (3,800) 2,900 (300)

Session 2 - Budgeting
Discussion Participant Examples:
Use of Budget at Other Institutions
What Worked and What Didn’t?
February 2005Session 2 - Budgeting Page 21
BREAK

Session 2 - Budgeting
Part 3 Overview: CUMC Integrated Planning Approach

February 2005Session 2 - Budgeting Page 23
Budget Cycle, Process, and Timeframe
BudgetBudget PlanningPlanning
Budget Budget DevelopmentDevelopment
Budget Review, Budget Review, Approval and Approval and
ImplementationImplementation
Budget Monitoring, Budget Monitoring, Tracking and Tracking and AdjustmentsAdjustments
Analysis of Analysis of Final ResultsFinal Results

February 2005Session 2 - Budgeting Page 24
Budget Roles and Responsibilities
Board Evaluates the overall institutional budget
PresidentEnsures that the budget is an accurate reflection of the strategic goals of the organization
Chief Financial OfficerDay-to-day management of budget development, implementation, and monitoring
Executive Vice President of CUMCResponsible for strategic planning of four schools and achieving the budget
School, Department, Program, Unit Mgr
Prepares budget proposals for their area and provide information on program needs, and monitors financial activity during the year

February 2005Session 2 - Budgeting Page 25
CUMC Overall Budget Construction– University budget arranged by “sector” in three-level hierarchy
• Top level: Morningside, Medical Center, University Central Administration
– Morningside and Medical Center include:• 100% tuition revenue
• Gift and endowment income
• Grants and contracts generated by schools
• Departments and faculties
• Financial aid
– University Central Administration includes:• Central administrative offices
• Insurance and utilities
• Auxiliaries and Institutional Real Estate
• Athletics, libraries fees, work-study
• Income from unrestricted endowment

February 2005Session 2 - Budgeting Page 26
CUMC Overall Budget Construction- FY04
Dental $ 43 M
Physicians & Surgeons 985 M
Nursing 18 M
Mailman School of Public Health 150 M
Total $ 1.2 Billion
School RevenuesSchool Revenues - - “every tub on its own bottom”“every tub on its own bottom”
February 2005Session 2 - Budgeting Page 27
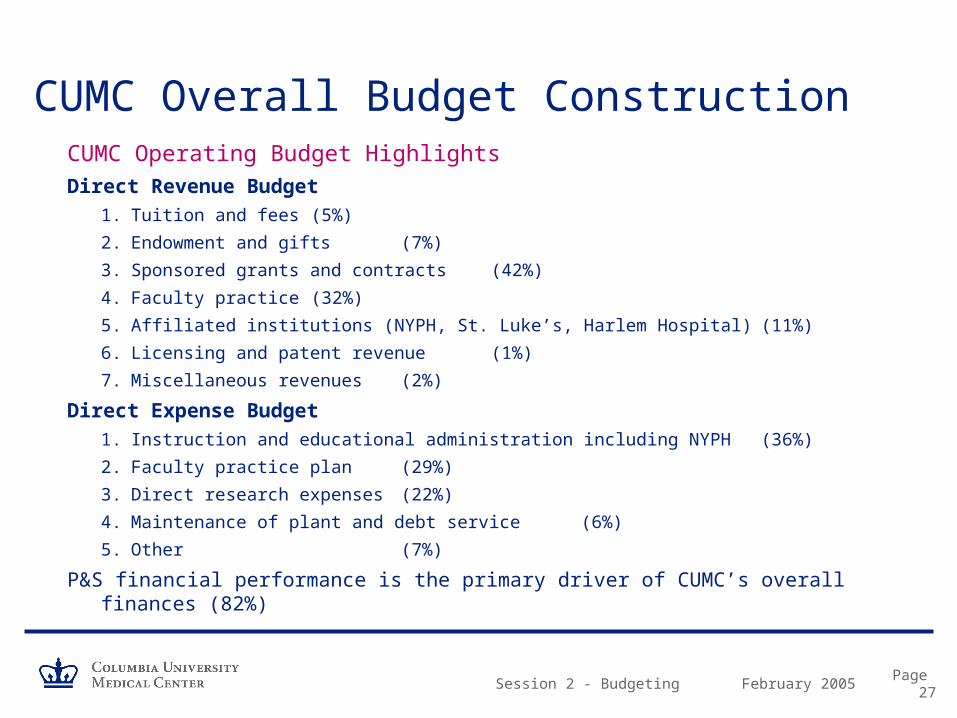
CUMC Operating Budget Highlights
Direct Revenue Budget
1. Tuition and fees (5%)
2. Endowment and gifts (7%)
3. Sponsored grants and contracts (42%)
4. Faculty practice (32%)
5. Affiliated institutions (NYPH, St. Luke’s, Harlem Hospital) (11%)
6. Licensing and patent revenue (1%)
7. Miscellaneous revenues (2%)
Direct Expense Budget
1. Instruction and educational administration including NYPH (36%)
2. Faculty practice plan (29%)
3. Direct research expenses (22%)
4. Maintenance of plant and debt service (6%)
5. Other (7%)
P&S financial performance is the primary driver of CUMC’s overall finances (82%)
CUMC Overall Budget Construction

February 2005Session 2 - Budgeting Page 28
CUMC’s Budget Methodology– All funds are budgeted
– All accounts, both unrestricted and restricted, are budgeted at the ten digit level• This includes both general ledger and subsidiary ledger accounts
• Proxy accounts are used to estimate prospective grant revenue
– Accounts are aggregated into management units (MU’s)
– Management units are aggregated into departmental budget submissions (BU’s)• Departmental chairs, program directors, institute chairs are accountable for budget submission
– Budget submissions are aggregated into schools
– Schools are aggregated into CUMC budget submission
– CUMC budget is one of the three sectors that comprise the Columbia University budget
– CU budget is approved by the Trustees of Columbia University
– Operating Budgets should reflect revenues and expenses in a 12-month period which increase or reduce Current Funds

February 2005Session 2 - Budgeting Page 29
Statement of Activities (Revenue/Expense statement)
COB: Consolidated Operating Budget
– Summarizes all of the activity of the organization for the entire period.
– Depicts how the resources of the organization are used in providing programs or services in order to meet its mission
• Revenues (Sources)
• Expenses (Uses)
– Reported by natural or functional groupings
– Reports revenue and expenses at gross amount and surplus and deficit at net amount
CUMC Overall Budget Construction

February 2005Session 2 - Budgeting Page 30
Consolidated Operating Budget:
– Includes all activities and accounting transactions that affect the sector’s “change in net assets to support current operations”
– Affected by:• Direct revenues and expenses (practice revenues, sponsored projects revenue,
employee compensation)
• Indirect sources and uses (internal allocations of cost and revenue)
• Non-operating activities (transfers of operating funds to and from long-term assets)
– The net of all three categories results in a change in current assets
CUMC Overall Budget Construction
February 2005Session 2 - Budgeting Page 31
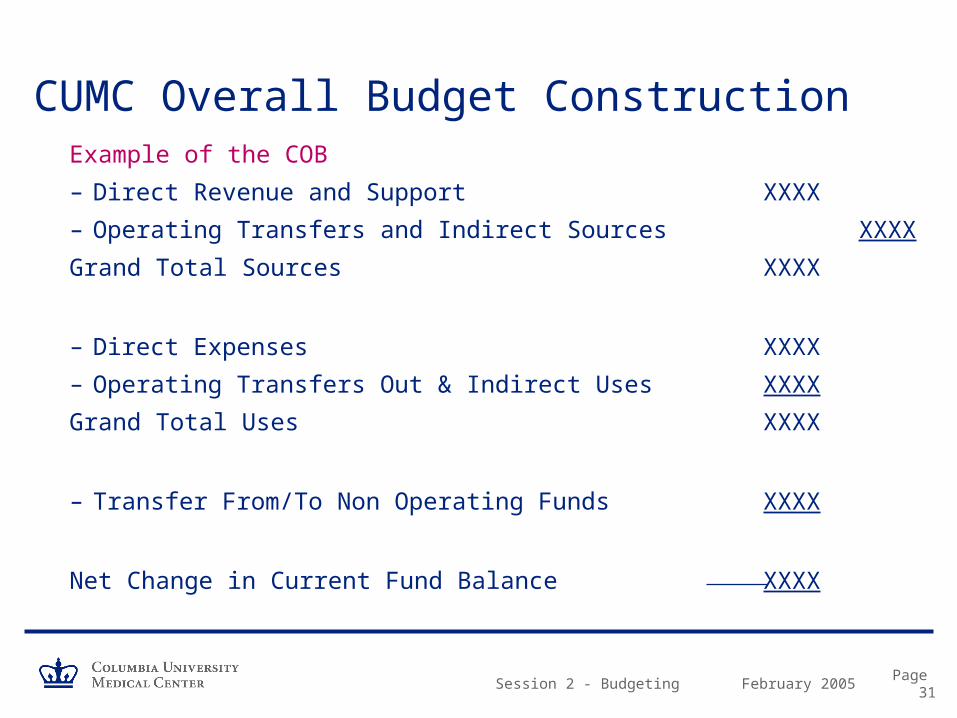
Example of the COB
– Direct Revenue and Support XXXX
– Operating Transfers and Indirect Sources XXXX
Grand Total Sources XXXX
– Direct Expenses XXXX
– Operating Transfers Out & Indirect Uses XXXX
Grand Total Uses XXXX
– Transfer From/To Non Operating Funds XXXX
Net Change in Current Fund Balance XXXX
CUMC Overall Budget Construction
February 2005Session 2 - Budgeting Page 32
Principal Budget Assumptions
A number of assumptions about the external economic environment and policy decisions are implicit in the budget process, including:
– Tuition and Fees• Each school proposes its own tuition and fee rates in its budget proposal
(subject to trustee approval)
– Enrollment• Approximately 4% of CUMC’s total revenue comes from tuition and fees
• The 2004-05 tuition revenue budget depends upon total enrollment of 2900 full time equivalent students
• CUMC accounts for 11% of University’s tuition revenue
CUMC Overall Budget Construction

February 2005Session 2 - Budgeting Page 33
Principal Budget Assumptions (continued)
– Sponsored Research Volume
• Consist of two components
1. Direct research funding that is highly restricted to specific projects
2. F&A recovery (ICR) which is calculated based upon federal cost allocation methodologies
• Once received, F&A recovery is unrestricted as to its use
• In total, sponsored projects almost equal to faculty practice
• F&A recovery was approximately $100 million
• Research (funding from all sources direct and indirect) represents 1/3 of CUMC’s overall budget
CUMC Overall Budget Construction

February 2005Session 2 - Budgeting Page 34
Principal Budget Assumptions (continued)
– Endowment Investment Returns• The University's endowment spending rule aims to distribute 5.0% of the previous
year’s beginning market value.
• By this measure, the 2004-05 base spending rate will be 5.1%
• Spending Rule: Driven by investment results and external market conditions– Regulates the annual amounts made available from the endowment for support of
University operations
– Balances current needs against the preservation of the purchasing power of the merged investment pool
CUMC Overall Budget Construction
February 2005Session 2 - Budgeting Page 35
Principal Budget Assumptions (continued)
– Medical Faculty Practice Plans• Represents 37% ($383 million) of activity
• 18 clinical departments– Patient volume, payor mix, collection rate, etc
– Other Budget Assumptions• Patent income
• Gifts
• Affiliation agreements
• Miscellaneous revenue
• Miscellaneous expenses– Financial aid, utilities, rent, common costs
• New / Expanded Programs
CUMC Overall Budget Construction

February 2005Session 2 - Budgeting Page 36
Statistical Background: CUMC Total – June 2004
STUDENTS
Enrollment 2,565
ADMISSIONS
Applicants 6,152
Admitted Students 2,059
Selectivity % 33%
Enrolled Students 1,012
Yield % 49%
FULL TIME EMPLOYEES
Tenured Faculty 212
Tenured Track 360
Other 1,322
Tenure of Title 61
Researchers 861
Librarians 10
Administrators 1,806
Support Staff 1,513
Total 6,145
OCCUPANCY
Net Usable Area 2,292,000 s.f.
CLINICAL PRACTICE
Full Time Physicians 1,000
Outpatient Visits 550,000
CUMC Hospital Admissions 55,000
Outpatient / ER Visits 600,000
PAYOR MIX
Managed Care 50%
Medicare 16%
Commercial 7%
Medicaid 6%
Self Pay 14%
Other 7%
CUMC Overall Budget Construction
February 2005Session 2 - Budgeting Page 37
Risks: Physicians and Surgeons
– P&S is vulnerable to several budget issues in 2004-05, notably:• The level of indirect cost recovery
• The ability to collect projected patient receipts
• The ability of operating units to absorb the costs of the new assessments
• To achieve budgeted central administrative cost savings
– Risks are mitigated by:• Fundraising and development potential
• Improvements as a result of better financial management policies and practice
• New research opportunities
CUMC Overall Budget Construction

Session 2 - Budgeting
Part 4 Developing Budgeting Metrics

February 2005Session 2 - Budgeting Page 39
Goals and Objectives– Metrics can be viewed at the Department, Division and individual physician
level• Budget expectations must be communicated and understood at the Department,
Division and individual faculty level in order to establish a sense of accountability at each level.
• Practice productivity expectations should be communicated, both revenue and expense, with emphasis on patient volume and payor mix estimates.

February 2005Session 2 - Budgeting Page 40
Planning AssumptionsEstimated Grant Increase from Current Faculty
– What effect will the future federal budget deficits have on the increase of the NIH appropriation?
– What is CUMC’s expectation of its market share of the NIH budget?
– Are there different assumptions for increases by the various research mix categories?
• NIH grants
• PHS training grants
• Clinical research
2000 2001 2002 2003 2004 2005 2006 2007 2008 2009
Annual % 4% 4% 4% 4% 4% 4% 4% 4% 4%

February 2005Session 2 - Budgeting Page 41
Planning AssumptionsAcademic Medical Center Strategic Planning Assumptions
NE Medical School
NE Medical School
SW Medical School
MW Medical School
Jesuit School
NE Hospital / University
NE Hospital
Start Up FundsChair $1,000,000 $1,000,000 $1,500,000 $1,300,000 $500,000 N/A $300,000Senior 500,000 500,000 840,000 600,000 500,000 300,000 200,000Associate 425,000 350,000 740,000 350,000 450,000 200,000 150,000Assistant 375,000 200,000 580,000 325,000 390,000 200,000 125,000
Salary (exclusive of fringe benefits)Chair N/A $220,000 N/A $250,000 N/A $120,000
Research Faculty $180,000Clinical Faculty 450,000
Senior 142,000 144,000 140,000 110,000 140,000 120,000Research Faculty 145,000Clinical Faculty 300,000
Associate 115,000 90,000 105,000 75,000 90,000 80,000Research Faculty 100,000Clinical Faculty 200,000
Assistant 80,000 75,000 72,000 60,000 70,000 60,000Research Faculty 70,000Clinical Faculty 110,000
Funding Target per PI (exclusive of F&A costs)Chair $240,000 $450,000 $500,000 $500,000 N/A $300,000Senior 400,000 500,000 750,000 300,000 300,000 300,000Associate 240,000 300,000 350,000 200,000 200,000 200,000Assistant 140,000 150,000 250,000 150,000 150,000 150,000
Funding Mix - Actual Targets:Federal 80% 75% 76% 72% 70% 75% 70%State (non Federal) 10% 2% 22% 5% 15%Industry 15% 18% 15% 10% 15%Foundation 8% 8% 10% 10%Other 10% 2% 5% 5%
Total 100% 100% 100% 103% 100% 100% 100%

February 2005Session 2 - Budgeting Page 42
Performance MetricsVariance Reporting: Department / Account Drill Down Approach
– Where is the variance occurring?• Department
– Division
» Faculty
– Is it a revenue variance?– Volume
– Payor Mix
– Collection Effectiveness
– Is it an expense variance?– Head count
– Salaries, including overtime
– OTPS
– Is it a profitability variance?– Average revenue per procedure compared to average cost

February 2005Session 2 - Budgeting Page 43
Clinical Example– Typical revenue performance metrics include:
• Revenue per FTE MD
• Volume indicator – Procedure Codes
– Relative Value Units
• Average revenue per procedure
• Measure of collection effectiveness: – Days in Accounts Receivable or
– “Bracket Creep”: increase in % of receivable in older buckets
• What is the mix of inpatient, procedural and office services?
• What is your payor mix and average payment rates?
– Typical Expense Metrics include:• Non-MD salary expense as a % of revenue
• All non-MD expense as a % of revenue
• Average cost per procedure
February 2005Session 2 - Budgeting Page 44
Discussion
– CUMC Financial Scorecard• What are the key outcomes that evidence a successful MU / BU?
• What fiscal / administrative metrics would you place on a school or departmental scorecard?

February 2005Session 2 - Budgeting Page 45
CUMC Financial Scorecard: A Draft Proposal
– Change in Net Assets (COB)
– Reserve Summary
– Revenue Summary– Tuition
– Patent Income
– Practice Revenue
– Sponsored Funding
» Direct & MTDC spending
» F&A (ICR)
» Training, research, service, financial aid
» Pipeline activity (applications, success rate, new & expired grants)

February 2005Session 2 - Budgeting Page 46
CUMC Financial Scorecard: A Draft Proposal
– Expense Summary• Utilities
• Faculty and Additional compensation
• Major equipment
• Unallowables
– Overdrafts• Number of overdrafts, $, Ledger
• Recurring overdrafts
– Affiliates• $ Receivables
• $ Payables

February 2005Session 2 - Budgeting Page 47
CUMC Financial Scorecard: A Draft Proposal
– Employee• Headcount
• Vacant positions
• Attendance performance
• Effort report verification
– Financial Aid• Number, $, eligible candidates
• Number of appeals
• $ Contingency balance
– Payroll suspense
– Unpaid vendor invoices• Number, $ aged

February 2005Session 2 - Budgeting Page 48
BREAK

Session 2 - Budgeting
Part 5 Multi-year Financial Planning
February 2005Session 2 - Budgeting Page 50
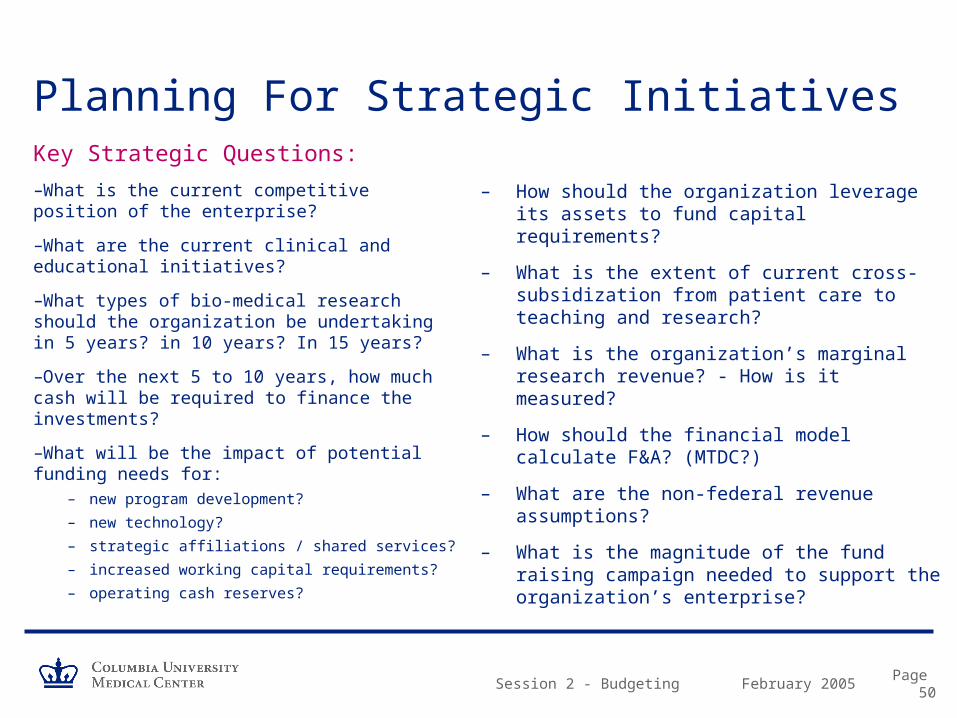
Planning For Strategic InitiativesKey Strategic Questions:
–What is the current competitive position of the enterprise?
–What are the current clinical and educational initiatives?
–What types of bio-medical research should the organization be undertaking in 5 years? in 10 years? In 15 years?
–Over the next 5 to 10 years, how much cash will be required to finance the investments?
–What will be the impact of potential funding needs for:
– new program development?
– new technology?
– strategic affiliations / shared services?
– increased working capital requirements?
– operating cash reserves?
– How should the organization leverage its assets to fund capital requirements?
– What is the extent of current cross-subsidization from patient care to teaching and research?
– What is the organization’s marginal research revenue? - How is it measured?
– How should the financial model calculate F&A? (MTDC?)
– What are the non-federal revenue assumptions?
– What is the magnitude of the fund raising campaign needed to support the organization’s enterprise?

Session 2 - Budgeting
Example Financial Planning: Medical/Dental Facility
February 2005Session 2 - Budgeting Page 52
SDOS Strategic Priority
Established Community DentCare Network 1996
– Goals• Provide patient-centered dental services to underserved populations in Northern
Manhattan
• Offer improved framework for educating dental and other health professional students at CUMC
– Currently Includes• Six school-based dental clinics
• Mobile dental van
• Linkages with community health centers
• Thelma Adair Community Health Center

February 2005Session 2 - Budgeting Page 53
Case Example – Select Points
– Community DentCare clinical research findings (1996-97) suggested that majority of elderly in central Harlem had unmet dental needs
– Community stakeholders recommended that any new facility targeted to seniors, include medical primary care services as well as dental
– Next step Feasibility analysis to construct state-of-the-art primary care facility in central Harlem & secure financing
February 2005Session 2 - Budgeting Page 54
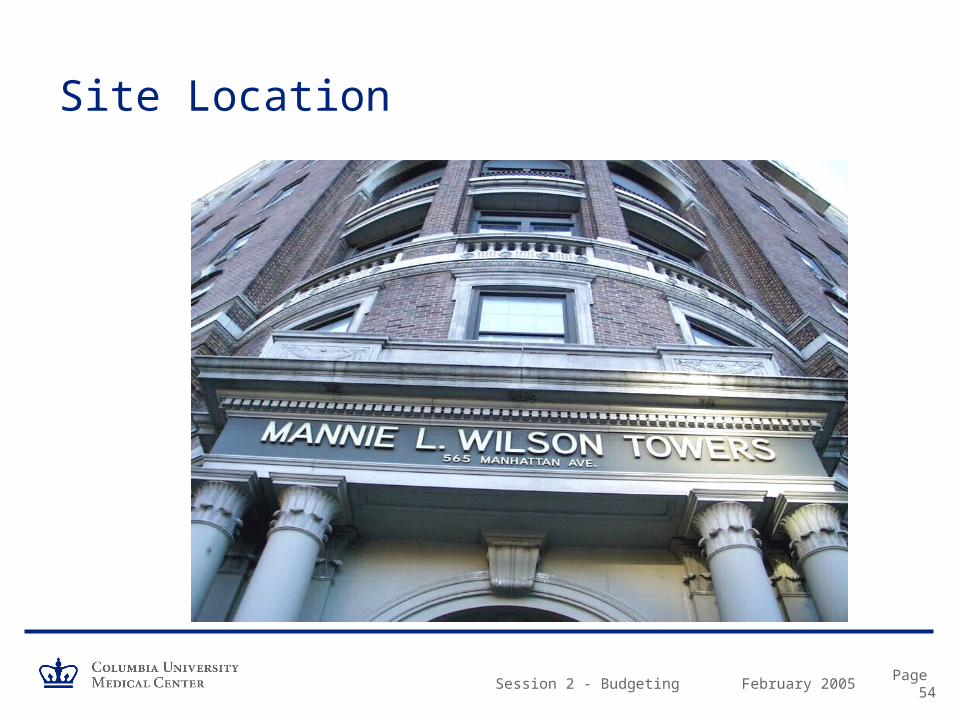
Site Location

February 2005Session 2 - Budgeting Page 55
Capital Project Budget
– Renovation of 5,050 Square ft• 13 medical exam / dental operatories
– Financing
Loan - Primary Care Development Corp (PCDC) $ 2.04 m
Grants (PCDC) $ 0.475 m
CUMC $ .185 m
TOTAL $ 2.7 million

February 2005Session 2 - Budgeting Page 56
Feasibility & Financial Models
– If we build it … will they come? Demographic & market analyses
– What does the multi-year financial plan show?• best case
• middle case
• worst case
– What are the key assumptions in the financial model?
February 2005Session 2 - Budgeting Page 57
Select Key Assumptions
– REVENUE • Provider Mix & Productivity
• Reimbursement rates & payor mix
• Utilization and rate of ramp up
– EXPENSE• Staffing & Salaries
• OTS expenses (various methodologies)

February 2005Session 2 - Budgeting Page 58
Payor Mix Assumptions
Medical Payor Mix Year 1 Year 2 Year 3 Year 4 Year 5MEDICAID 23.5% 23.5% 23.5% 23.5% 23.5%MEDICAID CAPITATED 8.0% 8.0% 8.0% 8.0% 8.0%MEDICARE 30.0% 30.0% 30.0% 30.0% 30.0%SELF PAY 32.5% 32.5% 32.5% 32.5% 32.5%COMM INS FFS 3.0% 3.0% 3.0% 3.0% 3.0%COMM INS CAPITATED 3.0% 3.0% 3.0% 3.0% 3.0%OTHER
100.0% 100.0% 100.0% 100.0% 100.0%MC Visits per Member per Year 3.5 3.5 3.5 3.5 3.5
Dental Payor Mix Year 1 Year 2 Year 3 Year 4 Year 5MEDICAID 65.0% 55.0% 45.0% 45.0% 45.0%MEDICAID CAPITATED 10.0% 10.0% 10.0%MEDICARESELF PAY 20.0% 20.0% 20.0% 20.0% 20.0%COMM INS FFS 10.0% 15.0% 15.0% 15.0% 15.0%COMM INS CAPITATED 5.0% 10.0% 10.0% 10.0% 10.0%OTHER
100.0% 100.0% 100.0% 100.0% 100.0%MC Visits per Member per Year 0.6 0.6 0.6 0.6 0.6

February 2005Session 2 - Budgeting Page 59
Provider Assumptions
Productivity & Salaries
Initial Year 1 Year 2 Year 3 Year 4 Year 5 Minimum
Position Salary Productivity Productivity Productivity Productivity Productivity Utilization
Medical Providers
Internist 110,000 2,900 3,100 3,300 3,300 3,300 2,900
Physician Assistant 70,000 1,750 1,900 2,100 2,100 2,100 1,750
Medical Director 135,000 2,900 3,100 3,300 3,300 3,300 2,900
Specialist 120,000 2,900 3,100 3,300 3,300 3,300 2,900
Dental Providers
Dentist/Dental Director 90,000 1,500 2,000 2,500 2,500 2,500 2,500
Dental Fellow 5,000 1,250 1,500 1,500 1,500 1,500 1,500
Hygienist 37,500 1,500 1,500 2,000 2,000 2,000 2,000

February 2005Session 2 - Budgeting Page 60
Revenue AssumptionsPROJECTED PATIENT SERVICE YEAR 1 YEAR 2 YEAR 3 YEAR 4 YEAR 5 REVENUE: Total Total Total Total TotalMEDICAID 984,856 1,578,705 1,621,003 1,621,003 1,621,003MEDICAID CAPITATED 48,113 76,426 364,549 368,195 371,876MEDICARE 175,410 275,879 295,360 295,360 295,360SELF PAY 77,388 133,930 155,114 155,890 156,669COMM INS FFS 141,445 378,847 463,090 463,090 463,090COMM INS CAPITATED 85,661 303,650 372,671 372,671 372,671OTHER 0 0 0 0 0DELIVERIES 0 0 0 0 0
TOTAL PATIENT REVENUE $1,512,873 $2,747,439 $3,271,786 $3,276,207 $3,280,668
PROJECTED PAYOR MIX: YEAR YEAR YEAR YEAR YEAR (TOTAL VISITS) 1 2 3 4 5
MEDICAID 7,677 12,304 12,637 12,637 12,637MEDICAID CAPITATED 703 1,106 3,219 3,219 3,219MEDICARE 2,638 4,149 4,442 4,442 4,442SELF PAY 4,584 7,787 8,882 8,882 8,882COMM INS FFS 1,127 2,884 3,497 3,497 3,497COMM INS CAPITATED 695 2,061 2,479 2,479 2,479OTHER 0 0 0 0 0
TOTAL 17,424 30,291 35,155 35,155 35,155
PROJECTED RATES: YEAR YEAR YEAR YEAR YEAR (COMPOSITE) 1 2 3 4 5
MEDICAID 128.29 128.31 128.28 128.28 128.28MEDICAID CAPITATED 68.40 69.08 113.24 114.37 115.51MEDICARE 66.50 66.50 66.50 66.50 66.50SELF PAY 16.88 17.20 17.46 17.55 17.64COMM INS FFS 125.52 131.35 132.44 132.44 132.44COMM INS CAPITATED 123.19 147.32 150.32 150.32 150.32OTHER 0.00 0.00 0.00 0.00 0.00

February 2005Session 2 - Budgeting Page 61
Staffing FTE AssumptionsSTAFFING PLAN Middle
PROJECTED FTE's: YEAR YEAR YEAR YEAR YEAR1 2 3 4 5
Medical ProvidersInternist 1.73 2.20 2.20 2.20 2.20Physician Assistant 0.92 1.00 1.00 1.00 1.00Medical Director 0.80 0.80 0.80 0.80 0.80Specialist 0.50 0.85 0.85 0.85 0.85
0.00 0.00 0.00 0.00 0.000.00 0.00 0.00 0.00 0.000.00 0.00 0.00 0.00 0.00
Dental ProvidersDentist/Dental Director 4.62 5.90 5.90 5.90 5.90Dental Fellow 2.40 2.40 2.40 2.40 2.40Hygienist 0.00 1.00 1.00 1.00 1.00
TOTAL PROVIDERS 10.97 14.15 14.15 14.15 14.15
Practice Manager 1.00 1.00 1.00 1.00 1.00Dental Director (Admin) 0.20 0.20 0.20 0.20 0.20Dental Fellow (non-clinical) 0.60 0.60 0.60 0.60 0.60Dental Asst& Coordinator 4.58 6.10 6.10 6.10 6.10Book/AA/MR 2.50 3.00 3.00 3.00 3.00Social Worker 1.00 1.00 1.00 1.00 1.00Medical Director (Admin) 0.20 0.20 0.20 0.20 0.20Nurse 2.00 2.00 2.00 2.00 2.00LPN 2.73 3.20 3.20 3.20 3.20Front Desk/Med Rec/Biller 6.02 7.60 7.60 7.60 7.60Support Staff 0.00 0.00 0.00 0.00 0.00
TOTAL FTE's 31.80 39.05 39.05 39.05 39.05

February 2005Session 2 - Budgeting Page 62
OTPS AssumptionsOTHER EXPENSES A - Annual MCD COST Cash
V - Per Visit* FlowF - Sq. Ft. A - Allow LagS - Start up N-Non-Allow
Cost P - By Provdr C - Capital ( 0 - 6)Data Processing/Software/Comp 6,900 A A 1Accounting 2,160 A A 1Clinical Supplies 3.00 V A 1Medical Malpractice 10,000 PM A 1Lab-Dental & Gloves 2.80 VD A 1Office Supplies 1.00 V A 1Telephone & Answering Service 16,500 A A 1Rent 0.00 F A 1Eq. Rental & Repair 6,060 A A 1Printing & Postage 4,500 A A 1Medical Waste 1,300 A A 1Marketing 2,500 A A 1Audit/Cost Report 8,640 A A 1Insurance-Gen Liab & Officers 32,300 A A 1Dental Malpractice 3,000 PD A 1Start-up 185,000 S C 0Utilities ($3.50) & Housekeeping ($6) 9.50 FSecurity 50,000 ATravel/Education 3,000 P
OTPS increase annually at 3.00%Facility Square feet 5,050
February 2005Session 2 - Budgeting Page 63
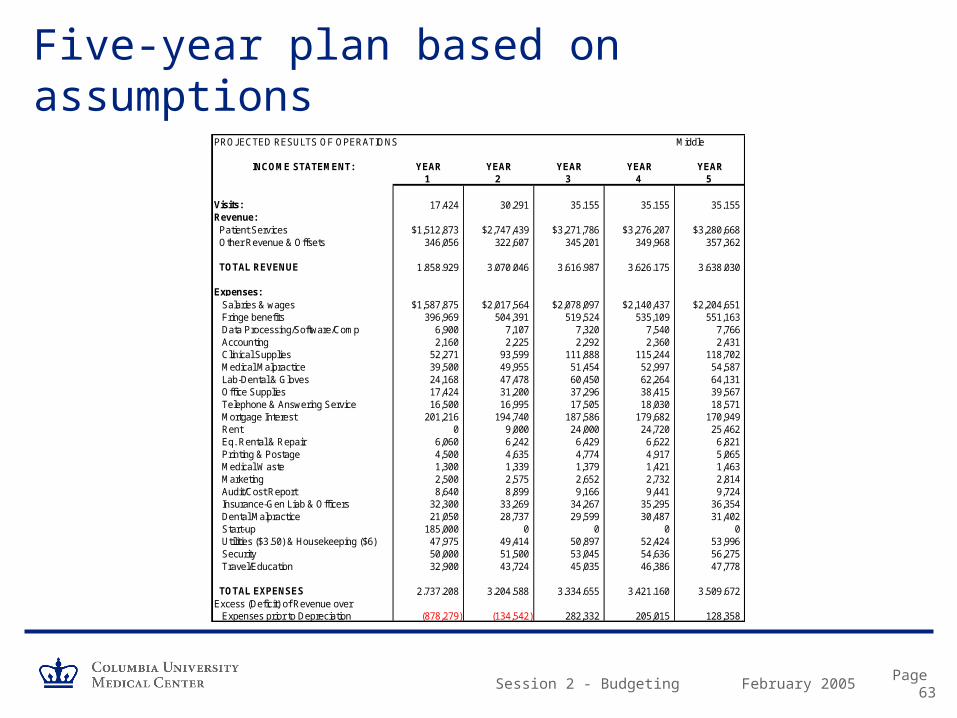
Five-year plan based on assumptionsPROJECTED RESULTS OF OPERATIONS Middle
INCOME STATEMENT: YEAR YEAR YEAR YEAR YEAR1 2 3 4 5
Visits: 17,424 30,291 35,155 35,155 35,155Revenue: Patient Services $1,512,873 $2,747,439 $3,271,786 $3,276,207 $3,280,668 Other Revenue & Offsets 346,056 322,607 345,201 349,968 357,362
TOTAL REVENUE 1,858,929 3,070,046 3,616,987 3,626,175 3,638,030
Expenses: Salaries & wages $1,587,875 $2,017,564 $2,078,097 $2,140,437 $2,204,651 Fringe benefits 396,969 504,391 519,524 535,109 551,163 Data Processing/Software/Comp 6,900 7,107 7,320 7,540 7,766 Accounting 2,160 2,225 2,292 2,360 2,431 Clinical Supplies 52,271 93,599 111,888 115,244 118,702 Medical Malpractice 39,500 49,955 51,454 52,997 54,587 Lab-Dental & Gloves 24,168 47,478 60,450 62,264 64,131 Office Supplies 17,424 31,200 37,296 38,415 39,567 Telephone & Answering Service 16,500 16,995 17,505 18,030 18,571 Mortgage Interest 201,216 194,740 187,586 179,682 170,949 Rent 0 9,000 24,000 24,720 25,462 Eq. Rental & Repair 6,060 6,242 6,429 6,622 6,821 Printing & Postage 4,500 4,635 4,774 4,917 5,065 Medical Waste 1,300 1,339 1,379 1,421 1,463 Marketing 2,500 2,575 2,652 2,732 2,814 Audit/Cost Report 8,640 8,899 9,166 9,441 9,724 Insurance-Gen Liab & Officers 32,300 33,269 34,267 35,295 36,354 Dental Malpractice 21,050 28,737 29,599 30,487 31,402 Start-up 185,000 0 0 0 0 Utilities ($3.50) & Housekeeping ($6) 47,975 49,414 50,897 52,424 53,996 Security 50,000 51,500 53,045 54,636 56,275 Travel/Education 32,900 43,724 45,035 46,386 47,778
TOTAL EXPENSES 2,737,208 3,204,588 3,334,655 3,421,160 3,509,672Excess (Deficit) of Revenue over Expenses prior to Depreciation (878,279) (134,542) 282,332 205,015 128,358
February 2005Session 2 - Budgeting Page 64

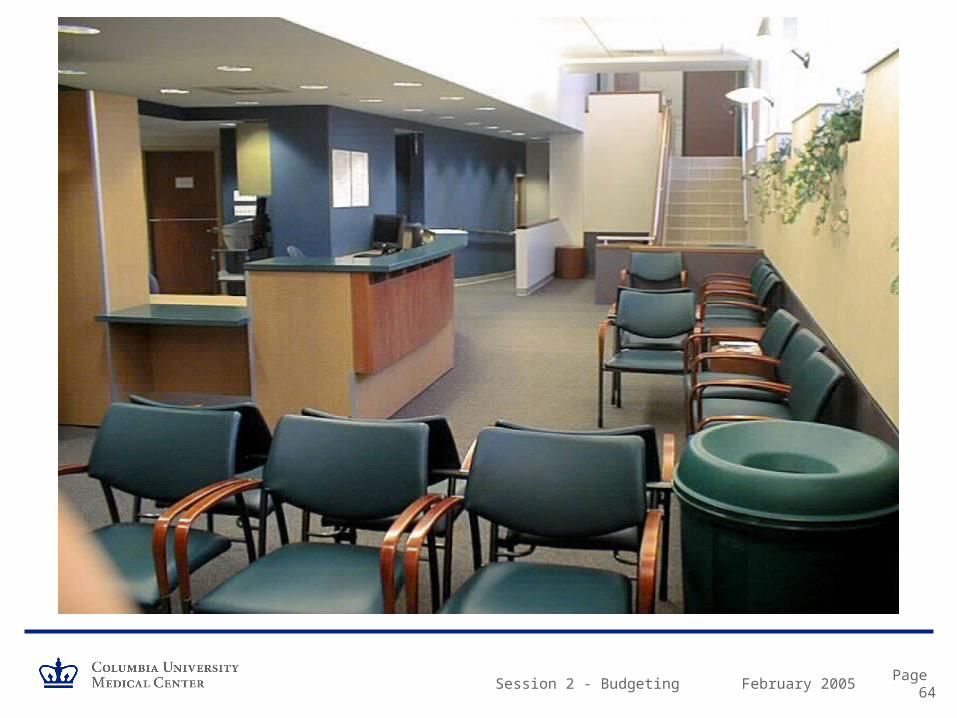
February 2005Session 2 - Budgeting Page 65
Updating Multi-year Financial Plans
Thelma C. Davidson Adair Clinic
– Opened June 2002
– Annual Budget ~$1.3 million
– Annual Visits ~8,000
Session 2 - Budgeting
Part 6 Capital Planning and Budgeting

February 2005Session 2 - Budgeting Page 67
What Is A Capital Plan?
– A management tool intended to assist schools in the overall management of projects and the capital assets that support their programs.
– A Capital Plan is a tool to assess the long-term capital project requirements of an entity and to establish funding of high-priority projects in a timely and cost-effective manner.
– A Capital Plan also promotes the provision of continuous efficient services. The written plan identifies and describes capital projects, the years in which funding each project is to occur and the method of funding.
– While a Capital Plan may be designed to forecast any period of time, it generally extends beyond the current operating cycle and usually covers a three to five year time frame.

February 2005Session 2 - Budgeting Page 68
What Is A Capital Plan?
– Financial considerations include:• Availability of reserves
• Fund raising potential
• Impact on operating budget– Borrowing vs. doing without
• Debt capacity– Statutory limits
– Institutional policy
– Strength of revenue streams
– Bond rating
• Bank debt vs. public markets– Tax-exempt securities

February 2005Session 2 - Budgeting Page 69
Overview of Capital Planning Process at CU
– University’s capital planning program addresses physical plant, including academic, research, recreational and administrative buildings, as well as utility systems, outdoor spaces and technical infrastructure
– Initiatives often require large investments that cannot be completely funded from current operating revenues or gifts
– Financing mechanisms are used to amortize the cost of a project over its useful life against future revenue streams:
• Financing primarily comes from tax-exempt bonds, and commercial paper issued by DASNY (Dormitory Authority State of New York).
• The annual long-range budget planning process ensures that the repayment of all financial commitments is carefully integrated into the University’s operating plan, including cash flow needs.
• The University currently has outstanding debt of ~ $1 billion and a AAA bond rating, the most favorable evaluation.

February 2005Session 2 - Budgeting Page 70
Overview of Capital Planning Process at CU: Example
Manhattanville expansion project
– The university's continued growth has necessitated the development of about 1 million square feet since 1994. There is not enough space available for development within the existing CUMC and Morningside campuses or through the development of nearby university-owned properties to sustain such a growth rate. Columbia has had facilities in Manhattanville for decades, where it has owned or leased about one-third of the area.
– Manhattanville, which consists of about 20 acres, is located between the Morningside campus and the uptown CUMC campus, extending roughly from West 125th Street to 133rd Street and from Broadway to 12th Avenue. The area, currently zoned for industrial use, is comprised of warehouses, car service stations and other industrial buildings. The economically depressed area has experienced an employment decline of more than 40 percent since 1984.
February 2005Session 2 - Budgeting Page 71
Overview of Capital Planning Process at CU
– 2003-04 was the final year of a “five-year” capital improvement program.
– An early step in the capital planning process for developing the next “plan” was an assessment of capital conditions and financing needs across all campuses and sectors of the University
– The plan will also benefit from a campus expansion study conducted by two preeminent urban architectural and planning firms, the Renzo Piano Building Workshop and Skidmore Owings and Merrill.

February 2005Session 2 - Budgeting Page 72
CU Prior 5-Year Plan Ending 2003-04
– Total spending of $1.375 billion• Sources
– External financing 38%
– Gifts & Grants 13%
– School / Department 25%
– Endowment 7%
– Other Internal Sources 17%
• Uses– Housing 16%
– Academic / Research Programs 44%
– IRE 9%
– Technology 4%
– Libraries 6%
– Student Services 8%
– Building Infrastructure 11%
– Other 2%
Housing, 16%
Academic / Research Programs,
44%
IRE , 9%
Technology, 4%
Libraries, 6%
Student Services, 8%
Building Infrastructure,
11%
Other , 2%
External f inancing ,
38%
Gifts & Grants, 13%
School / Department ,
25%
Endow ment, 7%
Other Internal Sources, 17%
February 2005Session 2 - Budgeting Page 73
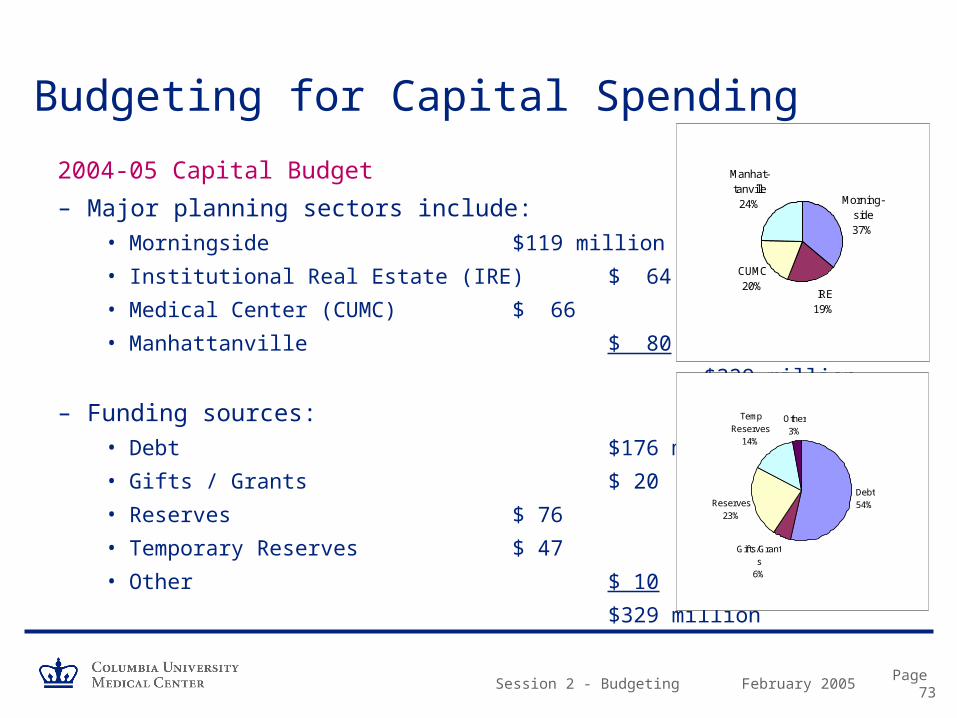
Budgeting for Capital Spending
2004-05 Capital Budget
– Major planning sectors include: • Morningside $119 million
• Institutional Real Estate (IRE) $ 64
• Medical Center (CUMC) $ 66
• Manhattanville $ 80
$329 million
– Funding sources: • Debt $176 million
• Gifts / Grants $ 20
• Reserves $ 76
• Temporary Reserves $ 47
• Other $ 10
$329 million
IRE19%
CUMC20%
Manhat-tanville24% Morning-
side37%
Debt54%
Gifts/Grants
6%
Reserves23%
Temp Reserves
14%
Other3%

February 2005Session 2 - Budgeting Page 74
Capital Budget Approval Process at CU
– Capital projects include new construction, renovations, and infrastructure and information systems improvements with a total cost of > $100K
– A “Capital Project Document,” detailing the scope of work, schedule, project cost, funding and operating budget impact is prepared (by Facilities Management at CUMC)
– Central University project approval may include the University Office of Management & Budget, the EVP for Administration, Provost, University Planning and Budget Committee, and Trustees
February 2005Session 2 - Budgeting Page 75
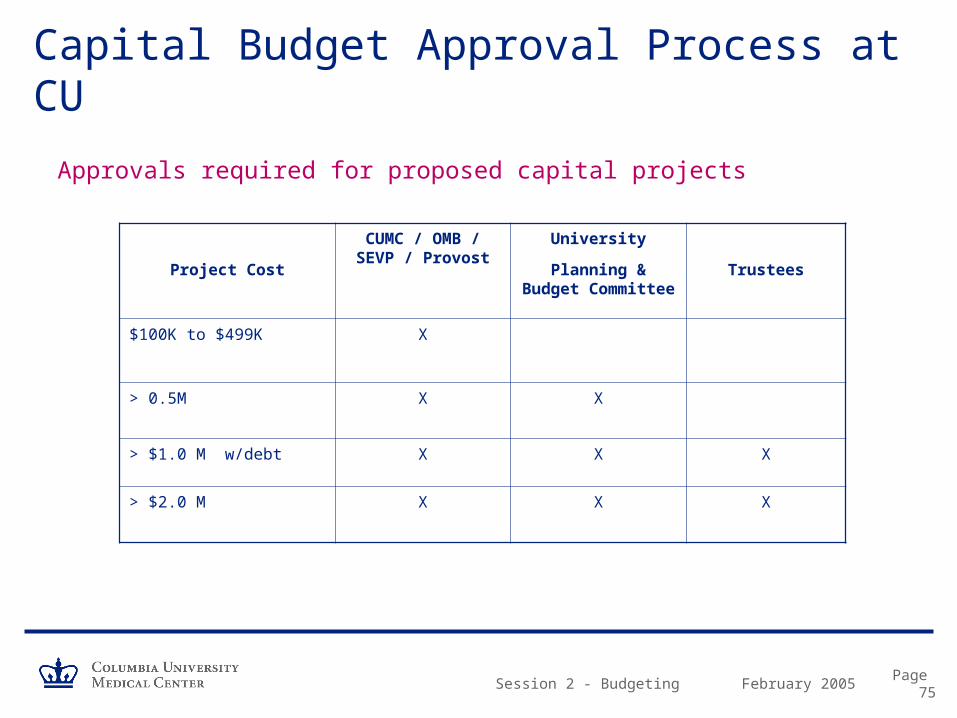
Capital Budget Approval Process at CU
Approvals required for proposed capital projects
Project Cost
CUMC / OMB / SEVP / Provost
University
Planning & Budget Committee
Trustees
$100K to $499K X
> 0.5M X X
> $1.0 M w/debt X X X
> $2.0 M X X X

February 2005Session 2 - Budgeting Page 76
Capital Budget Approval Process at CU
The “80% Rule”
– At least 80% of the project cost must be “in hand” before a project is considered for approval
• In certain circumstances, design and planning aspects of a project can be approved even though the 80% funding threshold has not been reached.
• Financing for projects that include fund raising can meet the 80% target through firm pledges.
• Projects that are funded through fund raising must include a contingency plan to address potential shortfalls.

February 2005Session 2 - Budgeting Page 77
Capital Budget Approval Process at CU
– Projects are administered at CUMC by Facilities Management• Guide planning and approval process
• Bid and negotiate contracts
• Assure compliance with codes, regulations
• Oversee construction, installation, etc.
• Pay vendors
– Capital costs are separately accounted for in FAS Ledger 7 Plant Fund accounts

Session 2 - Budgeting
Part 7 Capital Assets and Depreciation

February 2005Session 2 - Budgeting Page 79
Valuing Capital Assets on the University’s Financial Statements
– FASB requires colleges and universities to recognize the cost of “using up” long-lived assets on their financial statements
• Depreciation is the gradual conversion of the cost of a capital asset into an expense, over the asset’s useful life
• Historical cost is depreciated, not market value or replacement cost
• By not including depreciation, the financial statements would understate the cost of doing business
– Along with preparing financial statements, depreciation is used to derive the F&A sponsored project funding rate
February 2005Session 2 - Budgeting Page 80
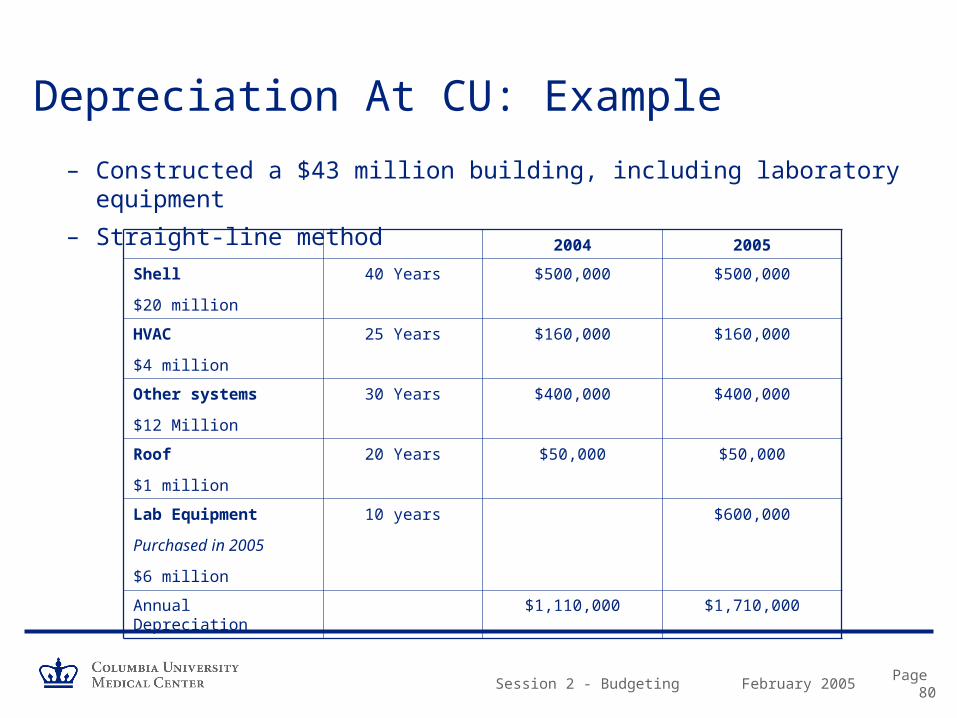
Depreciation At CU: Example
– Constructed a $43 million building, including laboratory equipment
– Straight-line method
2004 2005
Shell
$20 million
40 Years $500,000 $500,000
HVAC
$4 million
25 Years $160,000 $160,000
Other systems
$12 Million
30 Years $400,000 $400,000
Roof
$1 million
20 Years $50,000 $50,000
Lab Equipment
Purchased in 2005
$6 million
10 years $600,000
Annual Depreciation $1,110,000 $1,710,000

February 2005Session 2 - Budgeting Page 81
CU’s Capitalization Policy and Equipment Tagging
– Which assets are capitalized?• Equipment items costing $2K or more, with a useful life 2 or more years
– Controller captures data via expense subcode
» Subcode 61XX Externally purchased» Subcode 63XX Internally fabricated (requires prior approval)
• Certain equipment leases
• Physical plant projects costing more than $50K (Ledger 7)
– Equipment tagging• Control
• Disposal
• Periodic inventory
• Includes clinical practice equipment
• Linked to depreciation process

Session 2 - Fundamentals of Budgeting
QUESTIONS?

Session 2 - Fundamentals of Budgeting
COURSE EVALUATION
Please complete course evaluation form.
Session 2


![PARCC TRAINING FOR TEST ADMINISTRATORS 2017 · •Final session assignments are done. ... [PNP] by March 20th, 2017. Emergency Test Administrators Responsible for providing a secure](https://static.documents.pub/doc/80x56/6027ac7701a86062363363cb/parcc-training-for-test-administrators-2017-afinal-session-assignments-are-done.jpg)


