16
Session 6 Performance Indicator Tracking Tables (PITT) and Systems Document Version Date: 2014-01-17 Performance Monitoring

Session 6
Performance Indicator Tracking Tables (PITT) and Systems
Document Version Date: 2014-01-17
Performance Monitoring

Session Objectives
By the end of this Session, participants should be:
• Familiar with the Performance Indicator Tracking Tables

What do you do with the data your implementing partner submits?

1. COLLECTING/COMPILING data
2. SUMMING data from various sources: Implementing partners Sites/Regions Target groups
Use an indicator compilation worksheet or database.
Compiling Performance Data

3. CLEANING data:Ensure that data is complete & accurate.
Errors can add up.
Basic error checks make a big difference. Check totals & carry overs.
Cleaning Performance Data

Into a Performance Indicator Tracking Table or a system such as AIDtracker Plus!
Where does your Data go?
Baseline FY 2012 FY 2013
Indicator Date Actual Target
RationaleTarget Actual Target
RationaleTarget Actual
1.1.
1
Number of public policies
introduced, adopted,
repealed, changed or
implemented consistent with
citizen input
2012 0 Mechanisms for
citizen input
need
development
1 1 Mechanisms for
citizen input
improved
5 4
Dimension of NGO
Sustainability Index:
Advocacy
2011 4.3 Trend analysis
of last 5 years4.2 4.2 Project gains
momentum4.0 4.2
1.1.
2
Dimension of NGO
Sustainability Index: Legal
Environment
2011 3.3 Expert
judgment3.3 3.5 Project gains
momentum3.0 3.5
Number of laws and
regulations adopted/amended
to improve CSO enabling
environment
2012 0 Political
environment
restrictive; no
current bills
underway
1 1 Improved
advocacy
practice by
CSOs
3 3
1.1.
3
Number of laws and
regulations
adopted/amended to
improve media environment
03/2013 4 Project will
support adoption
of 4 laws in
process + 2 new
ones
6 6 Project supports
6 laws6 3
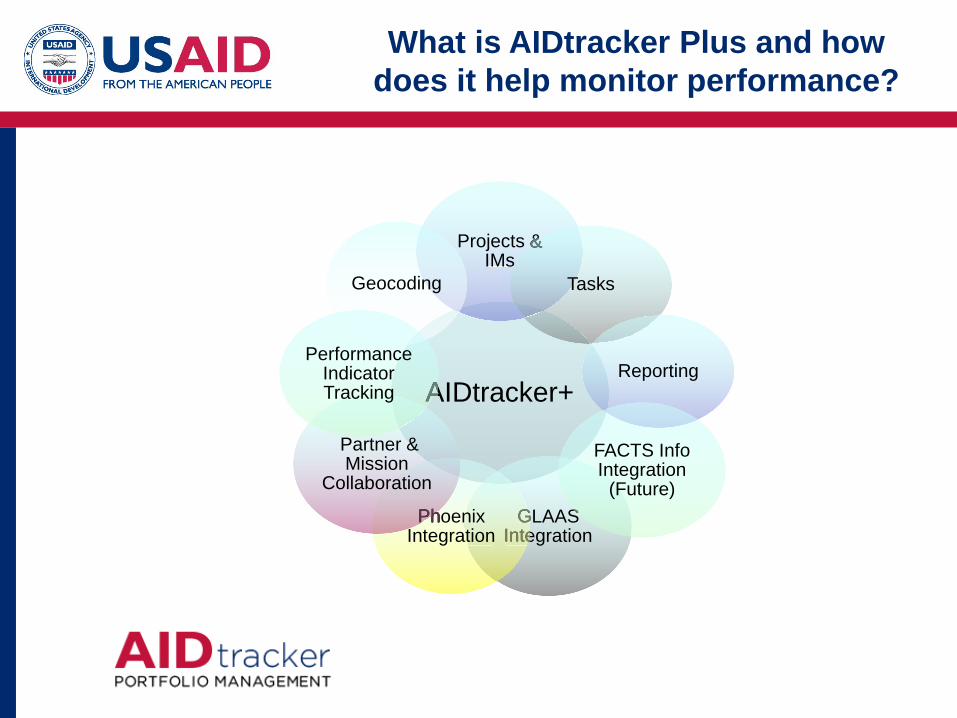
What is AIDtracker Plus and how does it help monitor performance?
AIDtracker+
Projects & IMs
Projects &
TasksGeocoding
Reporting
GLAAS Integration
GLAAS Integration
Phoenix Integration
Phoenix
Partner & Mission
Collaboration
AIDtracker
Partner &
Performance Indicator Tracking
GLAAS
FACTS Info Integration
(Future)

• 16 Missions have been selected for AT+ for the upcoming year:• Africa: DRC, Ethiopia, Kenya, Ghana, Mali, Rwanda, Senegal• Asia: Bangladesh, Nepal, RDMA, Vietnam• E&E: Kosovo, Ukraine• LAC: El Salvador, Peru• Middle East: Lebanon
• Joint venture with PPL/SPP, PPL/LER and M/CIO. Includes Program Cycle experts from PPL as well as technological experts from M/CIO.
• PPL’s ongoing role is to coordinate activities and share lessons learned with each new Mission coming on board.
• PPL encourages peer-to-peer learning and sharing! Since AIDTrackerPlus is new, feedback and learning is essential throughout the process.
AIDtracker Plus

How AT+ supports the Program Cycle
CDCS:• Tracks the Results
Framework indicators• Tracks DOs, IRs, sub-
IRs
Project Design• Tracks LogFrame indicators• Tracks Mechanism indicators• Tracks Activity indicators• Manages implementing
partners’ reporting
Learning and Adapting• Improves feedback loops• Informs future CDCS and
PADs
Monitoring and Evaluation• Facilitates mission-wide
PMP• Streamlines M&E plans• Enhanced reporting
capabilities (PPRs, Portfolio Review)

AIDtracker+: Indicator Summary

AIDtracker+: Entering Indicator Information

- Performance data analysis (e.g., identifying trends)
- Storage of implementing partner performance and financial reports
Other ways in which AIDtracker Plus helps manage performance
- Activity geocoding
- Activity financial information
- Reports to facilitate portfolio reviews, the PPR, other reporting, and learning

AIDtracker+: Reporting Functionality
Analysis and reporting made easier…
Standard Reports: 11 standard reports already pre-loaded for export and analysis Analysis: Less time collecting, organizing data and more time understanding results Customization: Generate custom reports based on real time data. Use “drag and drop”
functionality to customize reports to meet specific needs
Analysis and reporting made easierAnalysis and reporting made easierAnalysis and reporting made easier

How is Indicator Data entered intoAIDtracker Plus?
CDCS/Strategy
Project
Activity
CDCS Results
Framework
Project LogFrameand M&E
Plan
AIDtrackerPlus
Level of Performance Monitoring
What informs monitoring?
Which indicators?
Indicators to monitor progress toward CDCS objectives
Indicators for project monitoring; refines CDCS indicators (generally at IR level and below)
Who enters indicators into AT+?
Mission
Implementers
Mission
Activity M&E Plan
Indicators for activity monitoring; informed by project M&E plan

Data systems are only the tip of the
iceberg!
What are the Conditions for Success?
IT SYSTEMS
PROCESSES
MISSION BUY IN• Management• Change Management• Technical Officers
POLICY
• Mission Orders• Staffing• Teamed with CIO
• ADS• Agency Policies• Implementation Support
UnderlyingConditions

…So What’s Next?
Session 7: Data Quality


