1 Severe malnutrition: going from emergency to post-emergency management “A thesis submitted for the degree of Master of Science at the University of Aberdeen” Elodie MARCHAND Department of Medicine and Therapeutics, University of Aberdeen September 2000
Transcript
1
Severe malnutrition:going from emergency
to post-emergency management
“A thesis submitted for the degree ofMaster of Science at the University of Aberdeen”
Elodie MARCHAND
Department of Medicine and Therapeutics,University of Aberdeen
September 2000
2
Declaration Page
“I declare that this thesis has been composed entirely by myself and it has not been
accepted in any previous application for a degree. The work, of which it is a record,
has been done by myself. Quotations have been distinguished by quotation marks, and
sources of information have been specifically acknowledged.”
E.M.
3
DEDICATION
To all the people I have met during my different humanitarian
mission for the great job they are doing in the field.
To all people who have died because it was too late…..
4
Acknowledgements
I would like to thanks my supervisor Mike Golden for this project and for some
meeting in the field which had lead to going back one more time to school….
Special thanks to Yvonne Grellety who provides fiches for this project draw in the last
minute, without this data waiting to be analysed in some cartons I don't know what
will have been the issue of this MSc.
Thanks to the nutrition department of ACF for archives reports covering the period of
this thesis.
Thanks to all my family and "friends" who supported me along this year and this had
1.1.ASSESSMENT OF MALNUTRITION ................................................................................................... 131.1.1.Clinical features..................................................................................................................... 131.1.2.Nutritional status evaluation.................................................................................................. 141.1.3.Facilities ................................................................................................................................ 18
1.2.TREATMENT OF MALNUTRITION..................................................................................................... 181.2.1.Assessment criteria for the smooth running of the centre ...................................................... 201.2.2.Prudhon Index........................................................................................................................ 211.2.3.Closing of centres .................................................................................................................. 22
1.3.COUNTRY AND CONTEXT ............................................................................................................... 231.4. HYPOTHESIS ................................................................................................................................. 24
2.1.DATA COLLECTION ........................................................................................................................ 252.1.1.Criteria admission and discharge for feeding centre............................................................. 262.1.2.Missing patients data ............................................................................................................. 272.1.3.Variables collected from the fiches........................................................................................ 282.1.4.Clinical check and reporting in the fiches. ............................................................................ 292.1.5.Data entry by centre............................................................................................................... 30
2.2.ANALYSIS OF THE DATA................................................................................................................. 302.3. SOFTWARE USED........................................................................................................................... 33
3.1. GENERAL DESCRIPTION ................................................................................................................ 343.1.1. By age group......................................................................................................................... 343.1.2. By age and sex ...................................................................................................................... 343.1.3. Outcome by centre and age group. ....................................................................................... 353.1.4. By anthropometric indicators ............................................................................................... 373.1.5. By clinical malnutrition ........................................................................................................ 383.1.6. Breast-feeding....................................................................................................................... 393.1.7. Length of stay by outcome..................................................................................................... 393.1.8. Length of stay for cured and phase 1. ................................................................................... 403.1.9. Clinical signs ........................................................................................................................ 41
3.2.GAIN OF WEIGHT............................................................................................................................ 443.2.1 Rate of weight gain ................................................................................................................ 443.2.2.Catch up weight gain by type of malnutrition........................................................................ 45
6
3.3. MORTALITY.................................................................................................................................. 473.3.1.By centre ................................................................................................................................ 473.3.2. By type of malnutrition.......................................................................................................... 483.3.3. By Degree of oedema............................................................................................................ 493.3.4. By weight loss ....................................................................................................................... 503.3.5. Mortality by clinical signs .................................................................................................... 513.3.6. Mortality by time from admission ......................................................................................... 513.3.7. Mortality with respect to minimum weight............................................................................ 533.3.8. Cusum: examination of temporal changes in mortality ........................................................ 54
Despite improved understanstanding of pathophysiology and treatment of the severely
malnourished child the median case fatality rate has remained unchanged over the last
50 years and is typically 20-30%, with the highest levels of (50-60%). Since low
mortality levels from malnutrition can be achieved using appropriate treatment
regimens, under NGO supervision, when the phasing out time comes the question
remains as the most appropriate way in which this has to be achieved. That is, to who
and how should the handing over be achieved?
Records were collected from four centres in Liberia that were operated by ACF
(France) for the management of severe malnutrition. Two were therapeutic feeding
centres. As they were closed, the patients were transferred and new cases admitted to
either a SNU in the local hospital (Phebe, Gbanga) or to a Day Care Centre run by a
local NGO (Buchanan, Bong). All the centres used the same protocol and products
and were trained similarly. The data were analysed for mortality using the methods of
Prudhon et al (1996) and Grellety and Golden (unpublished).
The observed mortality in the two TFCs and the Day Care Centre was not different
from the expected mortality. In contrast there was a significantly higher mortality in
Phebe hospital. The rates of weight gain in the 4 centres were comparable.
It is concluded that the management and training of the senior medical staff in Phebe
hospital is insufficient to allow them to adequately manage severe malnutrition and to
achieve the same low mortality that is achieved in TFCs. This is not related to the
different diets that are used or the basic protocol. Care should be taken in the way in
which facilities are transferred at the end of an emergency.
8
List of abbreviations
ACF: Action contre la Faim
DCC: Day Care Centre
HA:Height for Age
MSF: Medecins Sans Frontieres
MUAC: Middle Upper Arm Circumference
NGO: Non Governemental Organisation.
SD: Standard Deviation
SFC: Supplementary Feeding Centre
SNU: Small Nutritional Unit
TFC: Therapeuthic Feeding Centre
UNHCR: United Nations High Committee Refugee
WA: Weight for Age
WA: Weight For Age
WH: Weight for Height
WHM: Weight for Height in Percentage of the Median
WHO World Health Organisation.
WHZ: Weight for Height in Z-Score
Centre:
Phebe: SNU in hospital Gbangha
Kolila: TFC in Gbangha
Buch_Tfc: TFC in Buchanan
Buch_Dcc: DCC in Buchanan
9
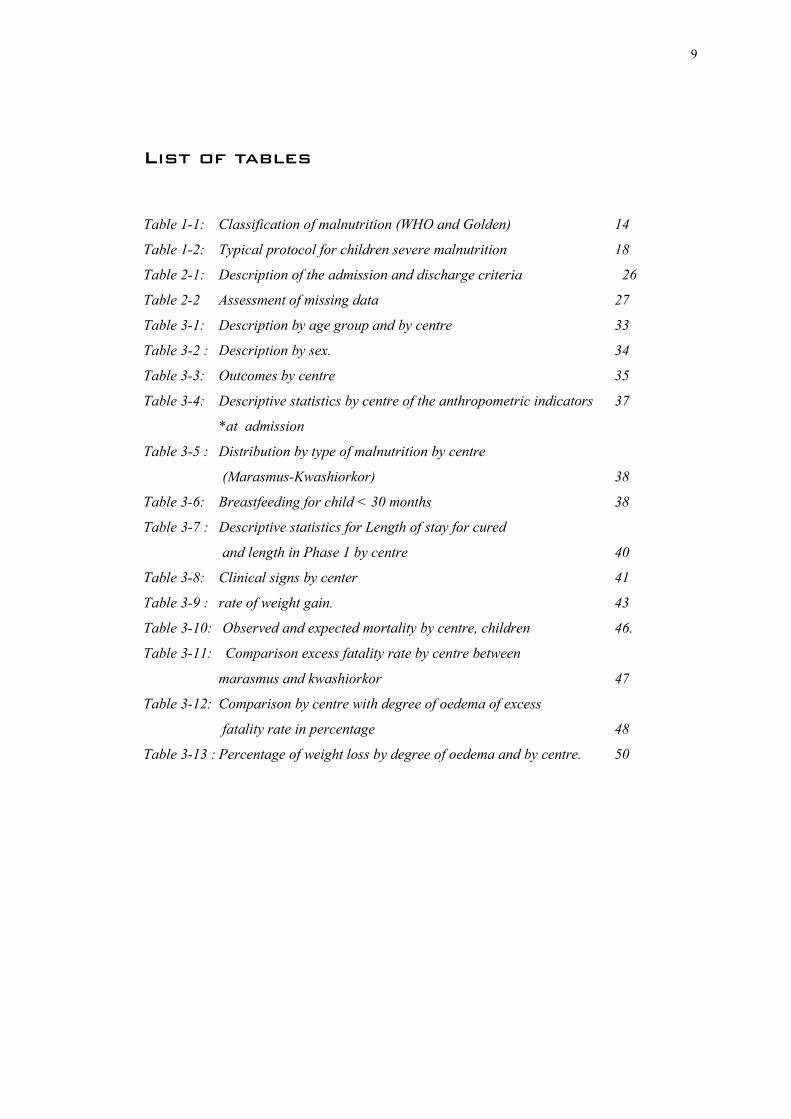
List of tables
Table 1-1: Classification of malnutrition (WHO and Golden) 14
Table 1-2: Typical protocol for children severe malnutrition 18
Table 2-1: Description of the admission and discharge criteria 26
Table 2-2 Assessment of missing data 27
Table 3-1: Description by age group and by centre 33
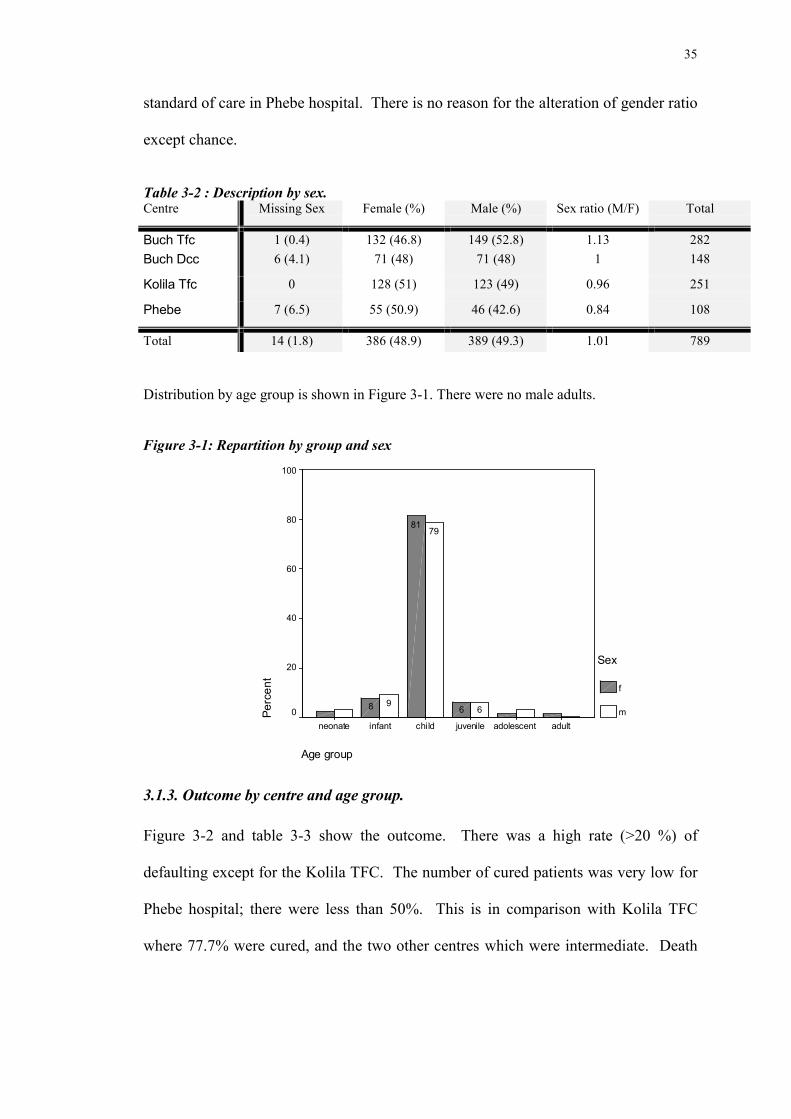
Table 3-2 : Description by sex. 34
Table 3-3: Outcomes by centre 35
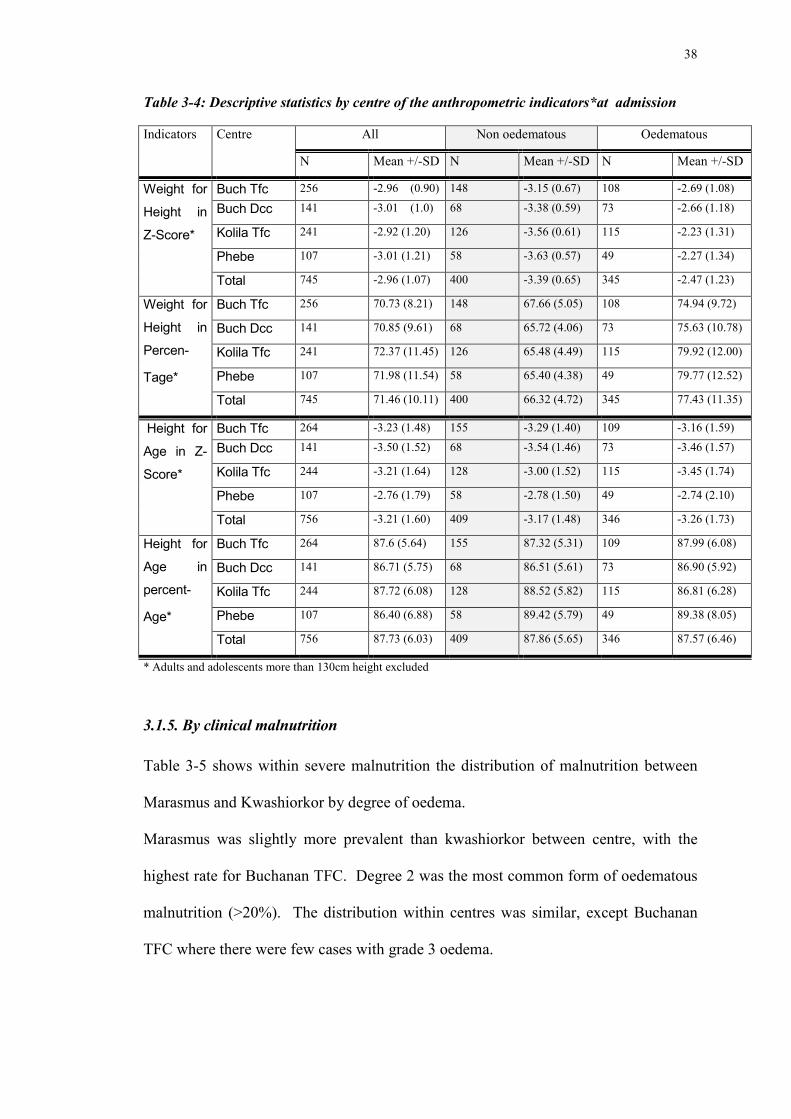
Table 3-4: Descriptive statistics by centre of the anthropometric indicators 37
*at admission
Table 3-5 : Distribution by type of malnutrition by centre
(Marasmus-Kwashiorkor) 38
Table 3-6: Breastfeeding for child < 30 months 38
Table 3-7 : Descriptive statistics for Length of stay for cured
and length in Phase 1 by centre 40
Table 3-8: Clinical signs by center 41
Table 3-9 : rate of weight gain. 43
Table 3-10: Observed and expected mortality by centre, children 46.
Table 3-11: Comparison excess fatality rate by centre between
marasmus and kwashiorkor 47
Table 3-12: Comparison by centre with degree of oedema of excess
fatality rate in percentage 48
Table 3-13 : Percentage of weight loss by degree of oedema and by centre. 50
10
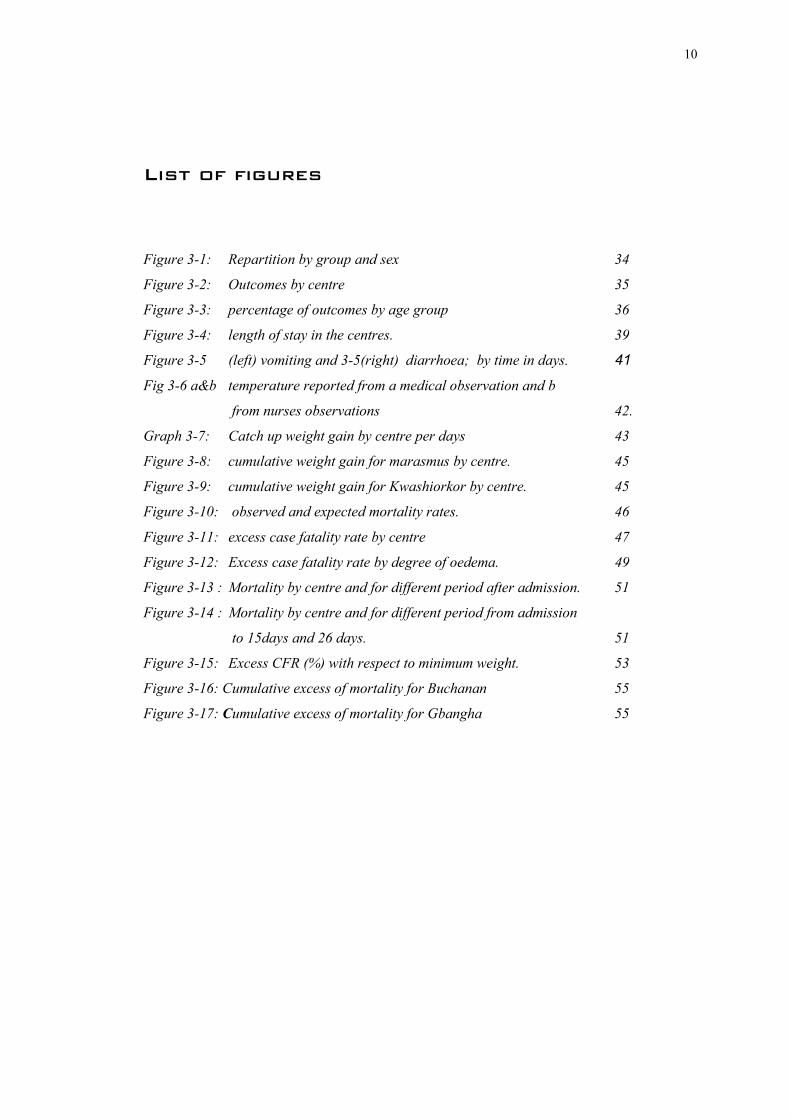
List of figures
Figure 3-1: Repartition by group and sex 34
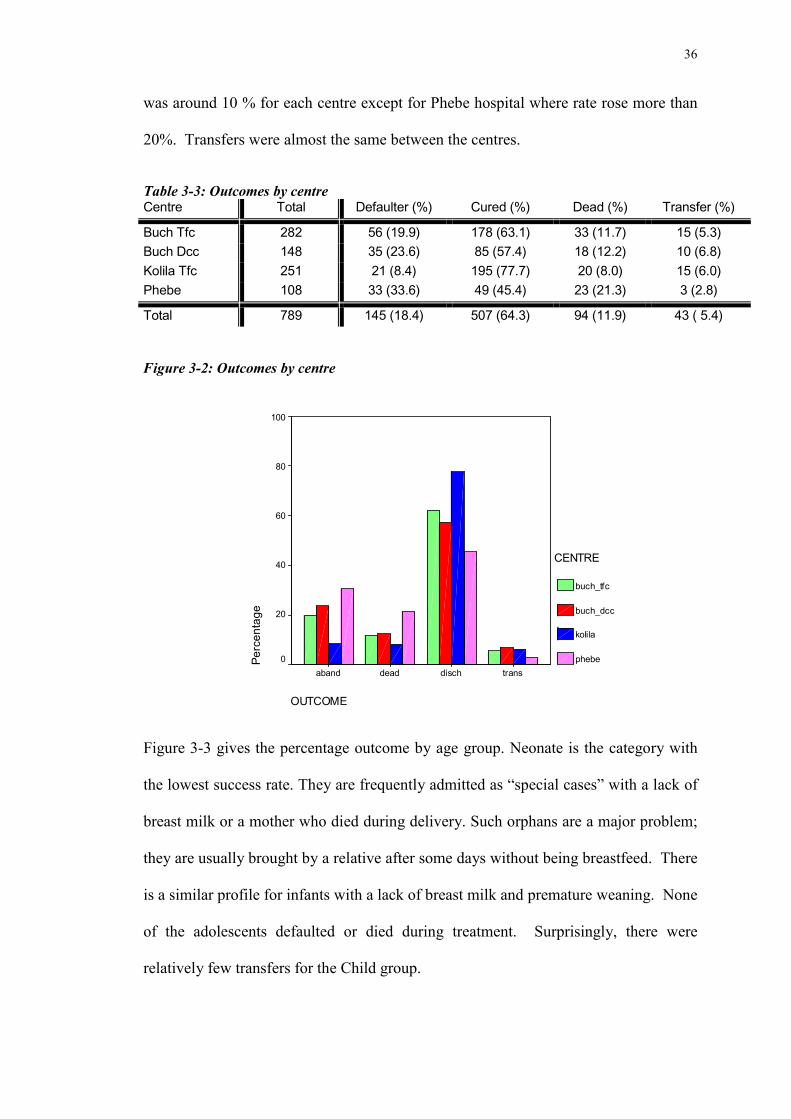
Figure 3-2: Outcomes by centre 35
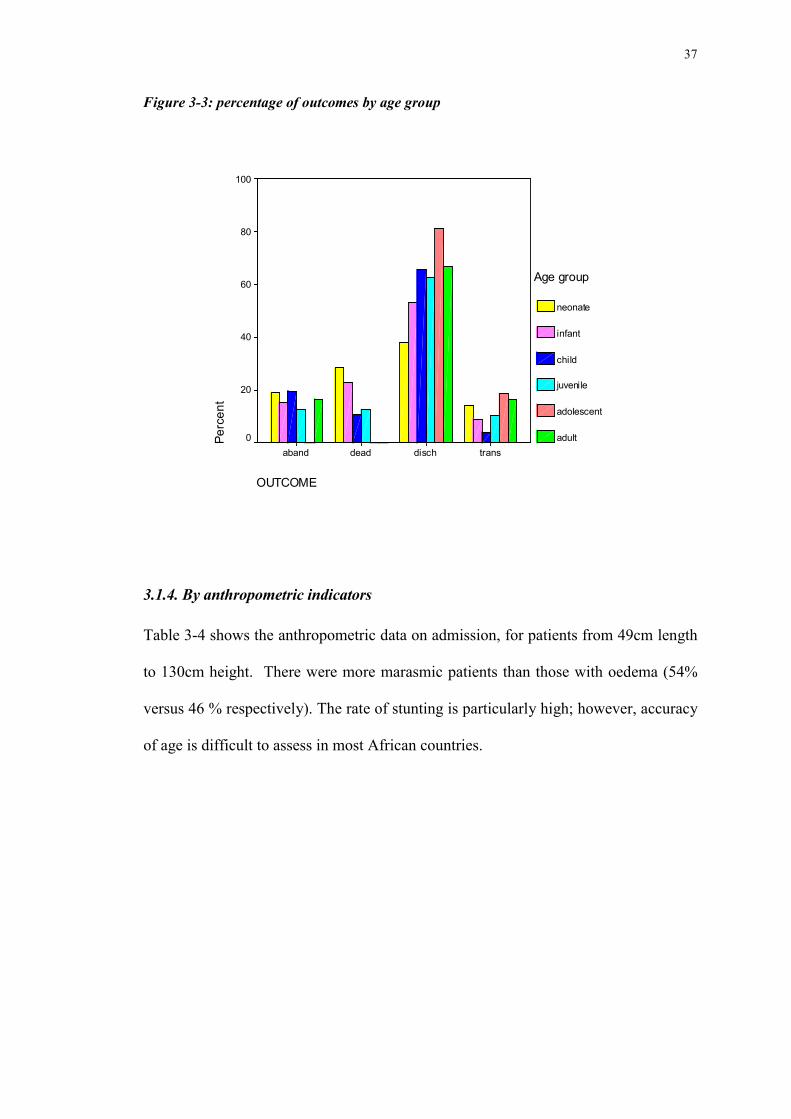
Figure 3-3: percentage of outcomes by age group 36
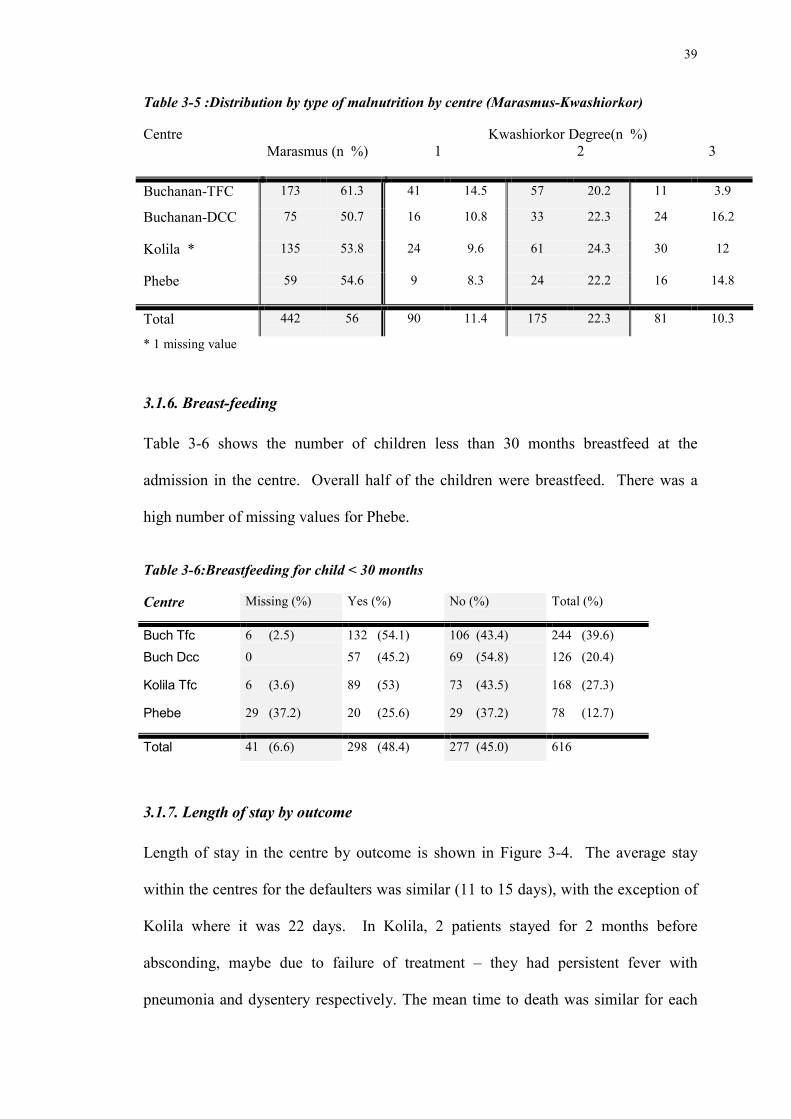
Figure 3-4: length of stay in the centres. 39
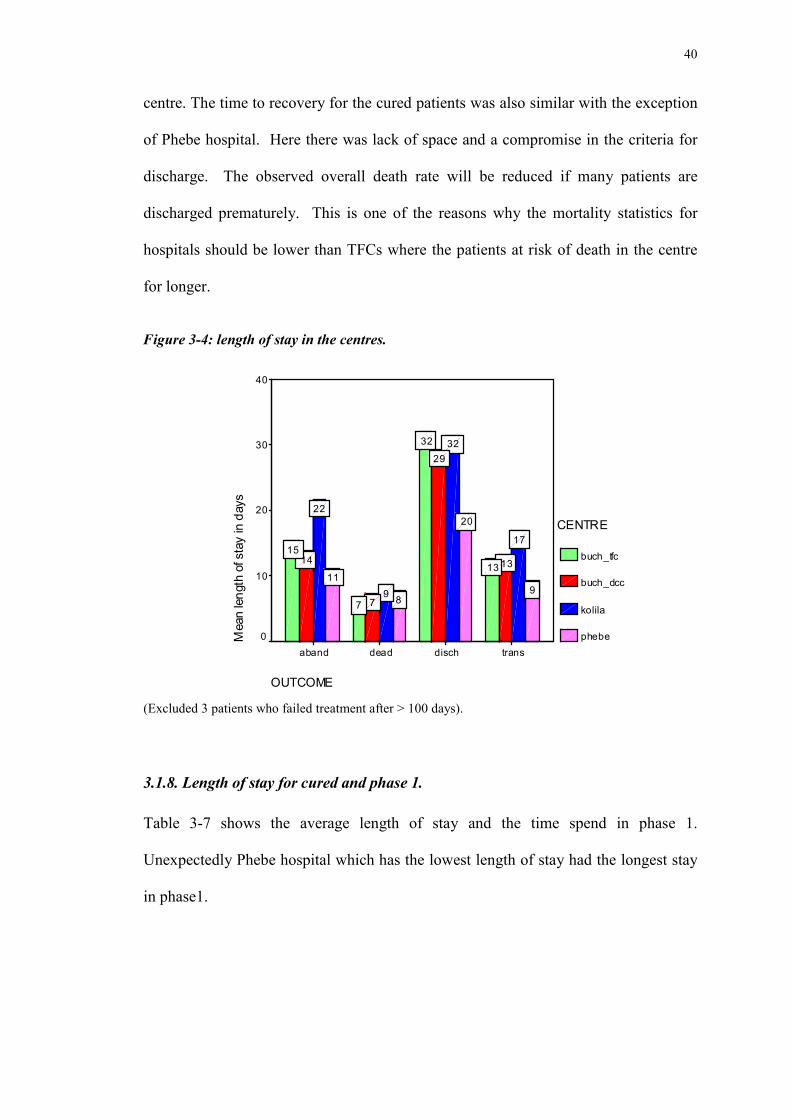
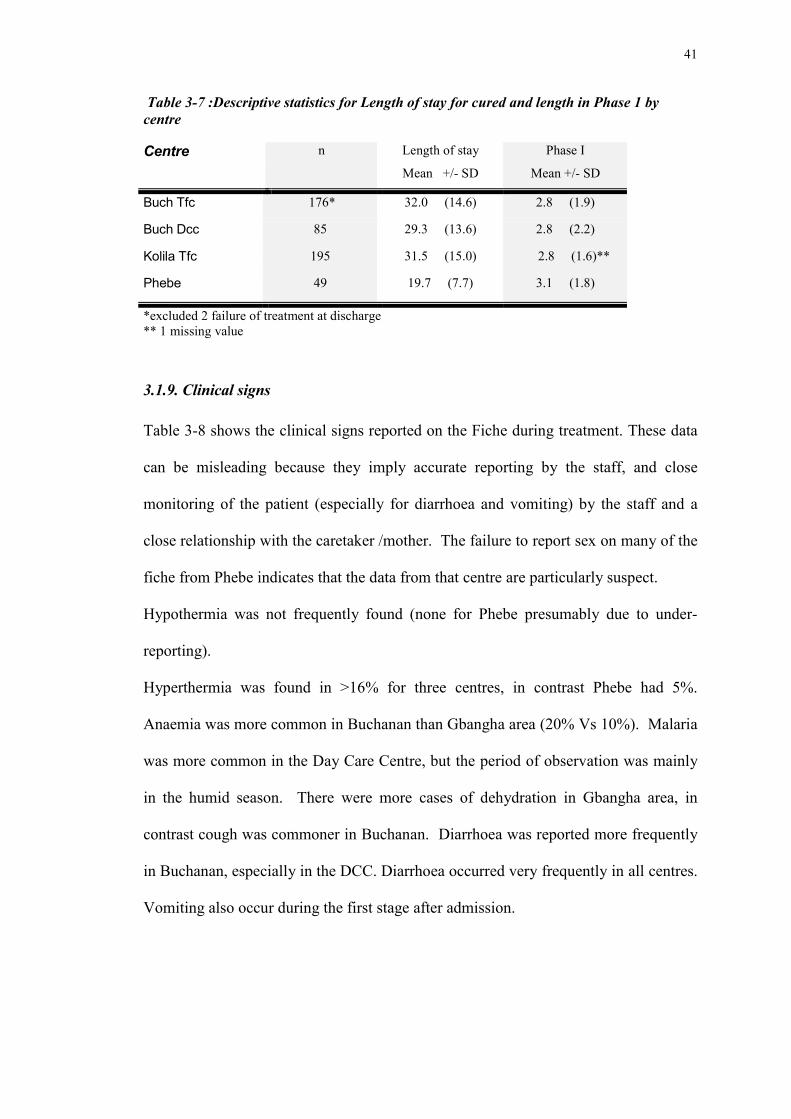
Figure 3-5 (left) vomiting and 3-5(right) diarrhoea; by time in days. 41
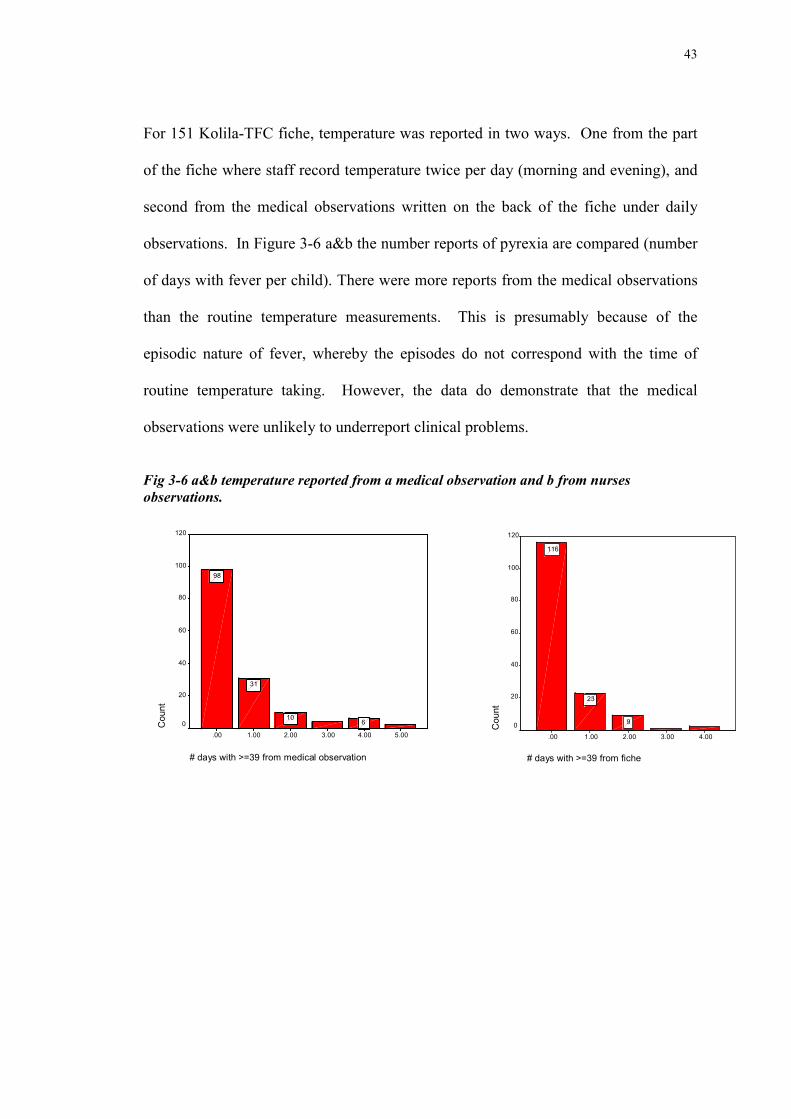
Fig 3-6 a&b temperature reported from a medical observation and b
from nurses observations 42.
Graph 3-7: Catch up weight gain by centre per days 43
Figure 3-8: cumulative weight gain for marasmus by centre. 45
Figure 3-9: cumulative weight gain for Kwashiorkor by centre. 45
Figure 3-10: observed and expected mortality rates. 46
Figure 3-11: excess case fatality rate by centre 47
Figure 3-12: Excess case fatality rate by degree of oedema. 49
Figure 3-13 : Mortality by centre and for different period after admission. 51
Figure 3-14 : Mortality by centre and for different period from admission
to 15days and 26 days. 51
Figure 3-15: Excess CFR (%) with respect to minimum weight. 53
Figure 3-16: Cumulative excess of mortality for Buchanan 55
Figure 3-17: Cumulative excess of mortality for Gbangha 55
11
1.Introduction
Hunger and malnutrition remain amongst the most devastating problems facing the
world's poor and needy. They continue to dominate the health of the world's poorest
nations. As a result national socio-economic development is retarded. About half of
the 10 million deaths among under-five year old children each year in the developing
world have malnutrition as the underlying cause (WHO Netscape, 1999).
Nowadays the median case fatality rate of severe malnourished children treated in
hospitals is 23.5%; a rate which has not change over the last 50 years. In fact this
figure does not show the wide discrepancy between facilities – mortality varies from
5% to 50%. In 1974, Cook asked the question whether hospital was the best place to
treatment severe malnutrition. He argued that the admission rate exceeded the capacity
of the hospital to admit and care for them, so that they were normally in-extremis
when they were admitted and kept for a very short time so that they were discharged
before recovery. He also noted the danger of cross infection due to the lack of the
facility to isolate children in the ward; there was nearly always such a lack of space
that more than one child was kept in a crib. He suggested an alternative as the
standard for treatment: under-five clinics and nutrition rehabilitation centres (NRCs).
These units differed from the hospital in that they were better equipped to deal with
malnutrition with more hygienic environment. In such centres the percentage of
deaths was lower. But this did not demonstrate that the NRCs were better at treating
the most severe cases as most NRCs referred the serious cases to hospital for medical
management. Thus, it would be expected that the NRC would have a lower case
12
fatality rate than the hospital as they were effectively treating children with a much
better prognosis. When it appeared that one of the children was becoming moribund it
was transferred to the hospital, maintaining the NRCs low mortality and increasing the
hospital’s case fatality rate. This has been consistently argued as the underlying cause
of the difference in mortality rate between NRC and hospitals since that time.
The treatment in feeding centres is qualitatively different from the treatment in
hospital practice, and furthermore the management differs from one centre to other.
The high mortality rate can be related to the use of inappropriate and unsafe
treatments. This was pointed out by Schofield et al. (1996) who reviewed the
literature over the past five decades and concluded that the median case fatality from
severe malnutrition has remained unchanged over this period; it was, and is, typically
20-30%, with the highest levels (50-60%) being among those with oedematous
malnutrition. They concluded that the main cause for this continuing high mortality
was faulty case-management. Through this survey of treatment centres worldwide (n
= 79) showed that for acutely ill children, inappropriate diets that are high in protein,
energy and sodium and low in micronutrients were commonplace. However, it is
relatively recently that the concepts of malnutrition have changed so that such diets
are now considered inappropriate – in the recent past it was considered unethical not
to give a high protein, high energy diet; most standard text-book still maintain that this
is the correct management and the WHO guidelines that advocate a modest protein,
restricted energy and sodium intake on admission were only published in 1999
(although the NGOs had access to an early draft of this manual from 1994 and had
implemented it in their treatment regimens since that time). However, Schofield et al
also found that other practices, that could have fatal consequences, such as prescribing
diuretics for oedema, were found also widespread; such treatments have not been
13
advocated for decades. Schofield et al conclude that outmoded practice was
widespread and that the teaching manuals were often contradictory. Certainly there is
no evidence of an effort being made by any of the international organisations to
educate and disseminate best practice.
On other hand, there are reports, such as Rooswalen (Roosmalen - Wiebenga
et al, 1986), which show good results from treatment in hospital when there is an
appropriately adapted protocol and close monitoring of the patient. In his study,
carried out in Tanzania between 1980-83, there was 9% fatality rate, despite the usual
constraint in all such institutions such as shortage of staff, time and money. More
recently it was reported that with a proper treatment along standardised lines case
fatality rates could reduced by about half in severe malnutrition, in particular where
management of diarrhoea during the first 48 hours is along modern lines (Tahmeed,
1999).
1.1.Assessment of malnutrition
1.1.1.Clinical features
Marasmus, kwashiorkor and nutritional dwarfism, usually associated with poverty,
deprivation and infection are the clinical syndromes of severe malnutrition. They often
coexist in the same individual to give a mixed picture. Patients with classical
marasmus have obviously lost weight with gross loss of muscle and almost complete
loss of subcutaneous fat. The classical face of the marasmic child looks like an “old
man”. The clinical feature of the kwashiorkor syndrome is a child with friable,
discoloured hair who develops a typical skin rash, oedema and hepatomegaly. In
nutritional dwarfism, the child usually appears perfectly normal; it is only when the
age of the patient is ascertained that the short stature becomes apparent. However, the
14
body proportions change so that the dental and facial structure is less retarded than
height (Garrow and James, 2000)
1.1.2.Nutritional status evaluation.
The anthropometric assessment of a population is used to assess the prevalence of
severe malnutrition, whether there are “pocket areas” of particular deprivation and the
need for services. Mortality and food security surveys are used to identify the groups
at most risk of a poor functional outcome (morbidity and mortality) and who therefore
are in most need of evaluation or intervention. (Gorstein, 1994).
Malnutrition is usually defined using anthropometric indices (table I-1). Weight and
height are measured and, with age, used to derive the following indicators; height-for-
age (HA), weight-for-height (WH) and weight-for-age (WA). Each indicator gives
specific nutritional information when compared to standard values of the National
Centre for Health Statistics (NCHS) based on the anthropometry of American children
(NCHS, 1977).
15
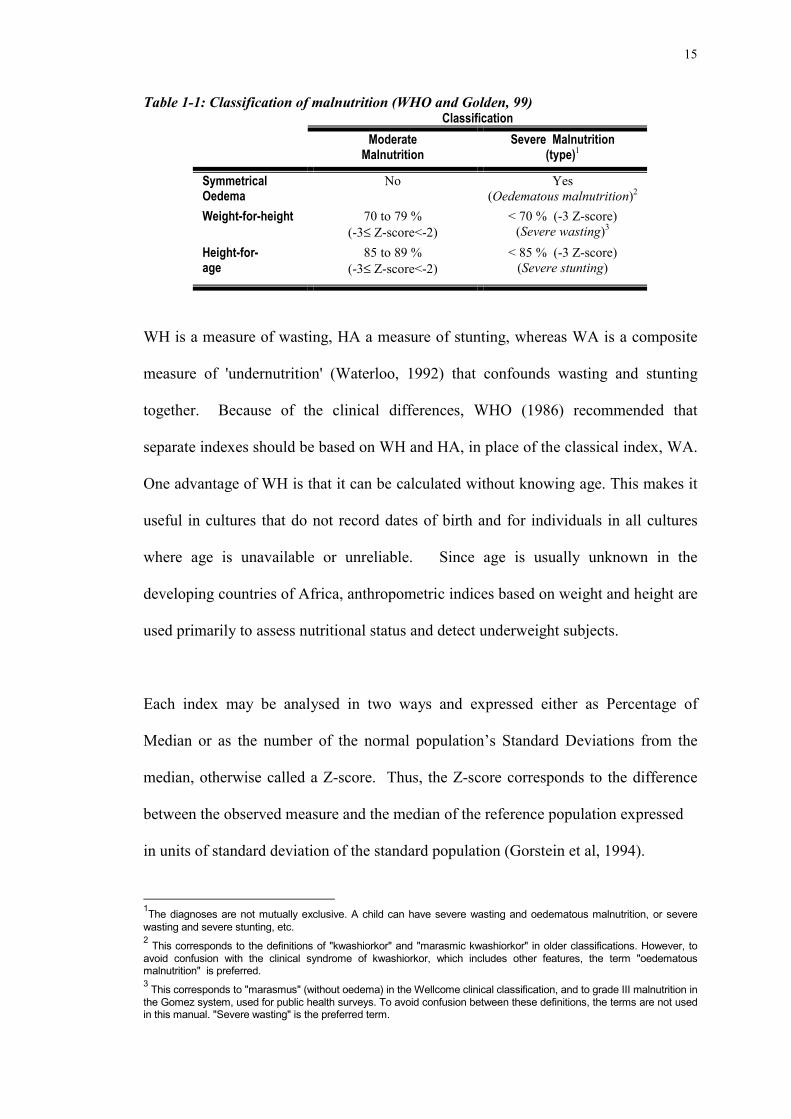
Table 1-1: Classification of malnutrition (WHO and Golden, 99)Classification
ModerateMalnutrition
Severe Malnutrition(type)1
SymmetricalOedema
No Yes(Oedematous malnutrition)2
Weight-for-height 70 to 79 %(-3≤ Z-score<-2)
< 70 % (-3 Z-score)(Severe wasting)3
Height-for-age
85 to 89 %(-3≤ Z-score<-2)
< 85 % (-3 Z-score)(Severe stunting)
WH is a measure of wasting, HA a measure of stunting, whereas WA is a composite
measure of 'undernutrition' (Waterloo, 1992) that confounds wasting and stunting
together. Because of the clinical differences, WHO (1986) recommended that
separate indexes should be based on WH and HA, in place of the classical index, WA.
One advantage of WH is that it can be calculated without knowing age. This makes it
useful in cultures that do not record dates of birth and for individuals in all cultures
where age is unavailable or unreliable. Since age is usually unknown in the
developing countries of Africa, anthropometric indices based on weight and height are
used primarily to assess nutritional status and detect underweight subjects.
Each index may be analysed in two ways and expressed either as Percentage of
Median or as the number of the normal population’s Standard Deviations from the
median, otherwise called a Z-score. Thus, the Z-score corresponds to the difference
between the observed measure and the median of the reference population expressed
in units of standard deviation of the standard population (Gorstein et al, 1994).
1The diagnoses are not mutually exclusive. A child can have severe wasting and oedematous malnutrition, or severewasting and severe stunting, etc.2 This corresponds to the definitions of "kwashiorkor" and "marasmic kwashiorkor" in older classifications. However, toavoid confusion with the clinical syndrome of kwashiorkor, which includes other features, the term "oedematousmalnutrition" is preferred.3 This corresponds to "marasmus" (without oedema) in the Wellcome clinical classification, and to grade III malnutrition inthe Gomez system, used for public health surveys. To avoid confusion between these definitions, the terms are not usedin this manual. "Severe wasting" is the preferred term.
16
Percentage of Median is the ratio of the measure and the median of reference
expressed as a percentage. In practice the latter is most commonly used as the entry
criteria in targeted treatment programmes because it is easily calculated and
understood, whereas in nutritional surveys prevalence is usually expressed in both Z-
scores and percentages. Even if the cut off points chosen by convention have little
biological significance they allow comparison between surveys. (WHO, 1986).
Weight for height is also the best index to show a recent lost of weight commonly
referred to as acute malnutrition. Prudhon found recently (Prudhon et al, 1996) that
the WH index expressed as the percentage of median is superior to the WH expressed
as Z-score for the prediction of death.
The Mid Upper Arm Circumference is also widely used as a measure of thinness, and
it is also the most meaningful outcome measure to assess children from 6 to 60
months in terms of risk of death (Briend et al, 1986). Children with a MUAC below
110 cm at age 6 to 60 months are considered at particularly high risk of death.
In an emergency the extent of “global” acute malnutrition (defined as all those with
moderate or severe wasting or oedema) indicates the need for nutritional intervention
as an emergency health issue. As relief health NGOs are often the only organisations
with a full time field presence, the general health and nutrition status of the population
in the need usually depend upon their activities. The impact of selective programmes
is a major issue for the population as they are the main means of preventing high
levels of malnutrition and deaths, especially for vulnerable group. Children are
usually the first affected with deterioration of the situation and this is reflected most
sensitively by a change of anthropometric indicators. In some cultures however, such
17
as Bosnia, other groups such as the elderly or females may be the most likely to suffer
deprivation. Nevertheless, evaluation of the operation of food aid usually involves
monitoring the under 5's as they are considered to be the most vulnerable group. The
logic being that if there is a decline in this group's nutritional status then the relief is
adequate. Consequently the response to deterioration in under 5's nutritional status
should be to provide a better general ration and other forms of population relief (e.g.
food-for-work programs), as well as programs specifically designed to treat those
already malnourished with rehabilitation diets in therapeutic or supplementary feeding
centres. The prevalence of malnutrition is assessed from nutritional surveys and
ongoing nutrition assessments. In crisis situations the local health structures are
normally overwhelmed and their resources further reduced as salaries, supplies and
logistics are channelled to armed forces and the local health staff migrates. Surveys
then indicate an unacceptable rate of malnutrition which justifies implementation of a
programme outside the normal health structures. The situation is judged as follows
for targeted programmes (UNHCR (1999) without aggravating factors/MSF (1995)):
- acceptable for a malnutrition rate <10%
No need for population level intervention
- alert for a malnutrition rate between 10-14% / 10-19%
Targeted supplementary feeding programme and therapeutic feeding
programme
- serious for a malnutrition rate ≥ 15% / 20 %
Blanket supplementary feeding programme and therapeutic feeding
programme
18
1.1.3.Facilities
For Severe Malnutrition
The Therapeutic Feeding Centre (TFC): is usually defined as a residential 24 hour care
centre where there is a surveillance day and night.
The Day Care Centre (DCC) is a day care feeding centre that gives care during the
daytime. The centre can be residential or non-residential depending on logistic,
security, facilities in the centre and the distance from home.
The Special Nutrition Unit (SNU) is an area in a hospital usually integrated in the
paediatric wards that is dedicated to the initial phase and the rehabilitation phase of
severe malnutrition. The patient is admitted to a residential 24 hours care.
For moderate Malnutrition
The Supplementary Feeding Centre (SFC) can take two forms “wet” and “dry” rations.
-Wet rations are prepared once or twice daily in the kitchen of a feeding centre and
consumed on site
-Dry rations are distributed weekly for take-home preparation and consumption.
1.2.Treatment of malnutrition
Recent years have seen an extension of existing knowledge in relation to treatment of
severe malnutrition. From nutrition teams in research unit (Asworth 69, Picou 1975
Waterlow 1975&92 Golden, 88& 96) basic recommendations were made. From these
recommendations guidelines were adapted and incorporated by those relief agencies
specialising in nutrition such as OXFAM, MSF and ACF and the international
organisation WHO (1981&1999). Dissemination of guidelines and through the efforts
of NGOs, which have developed appropriate nutritional and medical protocols and
19
systems for their practical application amid the most difficult conditions, should have
lead to a significant reduction in fatality rates. In order to simplify treatment in such
difficult conditions a meeting was hosted in 93 by MSF, at which most agencies and
those few academics still active in research in severe malnutrition. This lead to the
development of a standardised protocol for therapeutic feeding (Golden & Briend 93).
Consequently there have been considerable advances in the quality and effectiveness
of Therapeutic feeding programmes in emergencies. There remains a need to transfer
this knowledge and experience from NGO personnel to those working for Ministries
of Health and to update international agencies. This is particularly the case at the end
of an emergency when the national health structures are being re-build, are increasing
capacity and are taking over the management from the NGOs. Thus, during the
recovery stage after an emergency, when the NGOs phase out their operation,
demonstration centres and local training guidelines would be useful to achieve this
transfer of knowledge and experience (WHO, 2000)
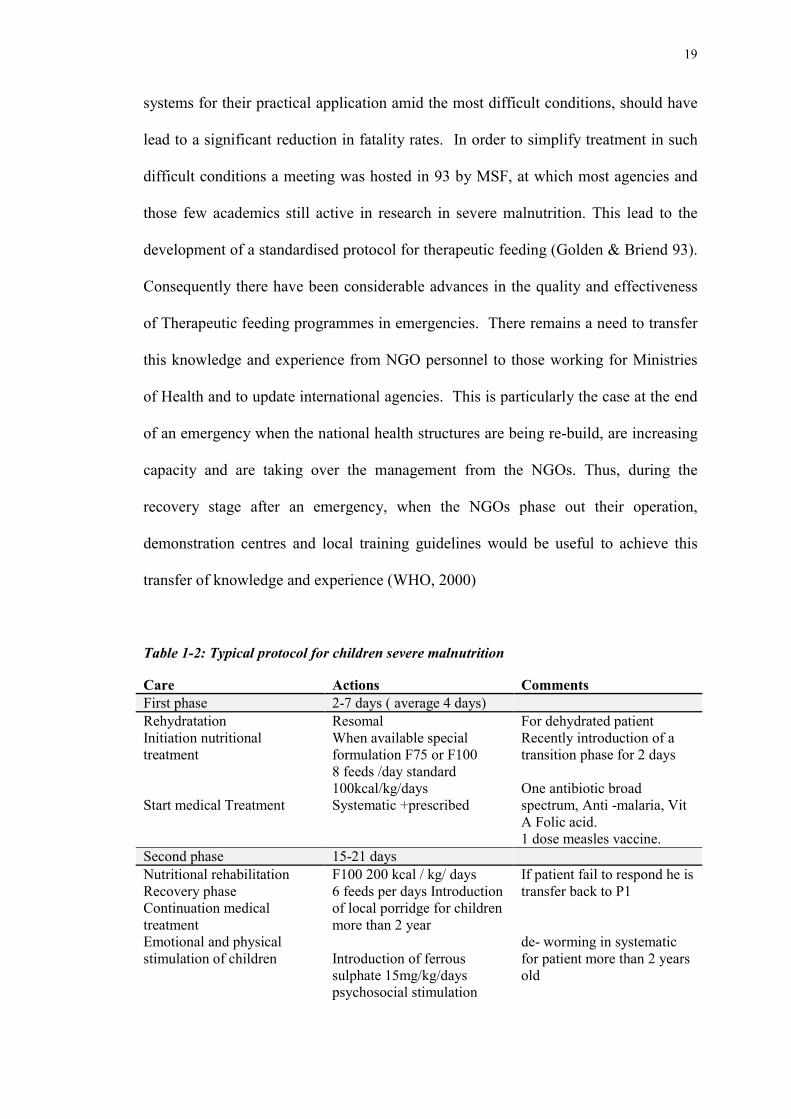
Table 1-2: Typical protocol for children severe malnutrition
Care Actions CommentsFirst phase 2-7 days ( average 4 days)RehydratationInitiation nutritionaltreatment
Start medical Treatment
ResomalWhen available specialformulation F75 or F1008 feeds /day standard100kcal/kg/daysSystematic +prescribed
For dehydrated patientRecently introduction of atransition phase for 2 days
One antibiotic broadspectrum, Anti -malaria, VitA Folic acid.1 dose measles vaccine.
Second phase 15-21 daysNutritional rehabilitationRecovery phaseContinuation medicaltreatmentEmotional and physicalstimulation of children
F100 200 kcal / kg/ days6 feeds per days Introductionof local porridge for childrenmore than 2 year
Introduction of ferroussulphate 15mg/kg/dayspsychosocial stimulation
If patient fail to respond he istransfer back to P1
de- worming in systematicfor patient more than 2 yearsold
20
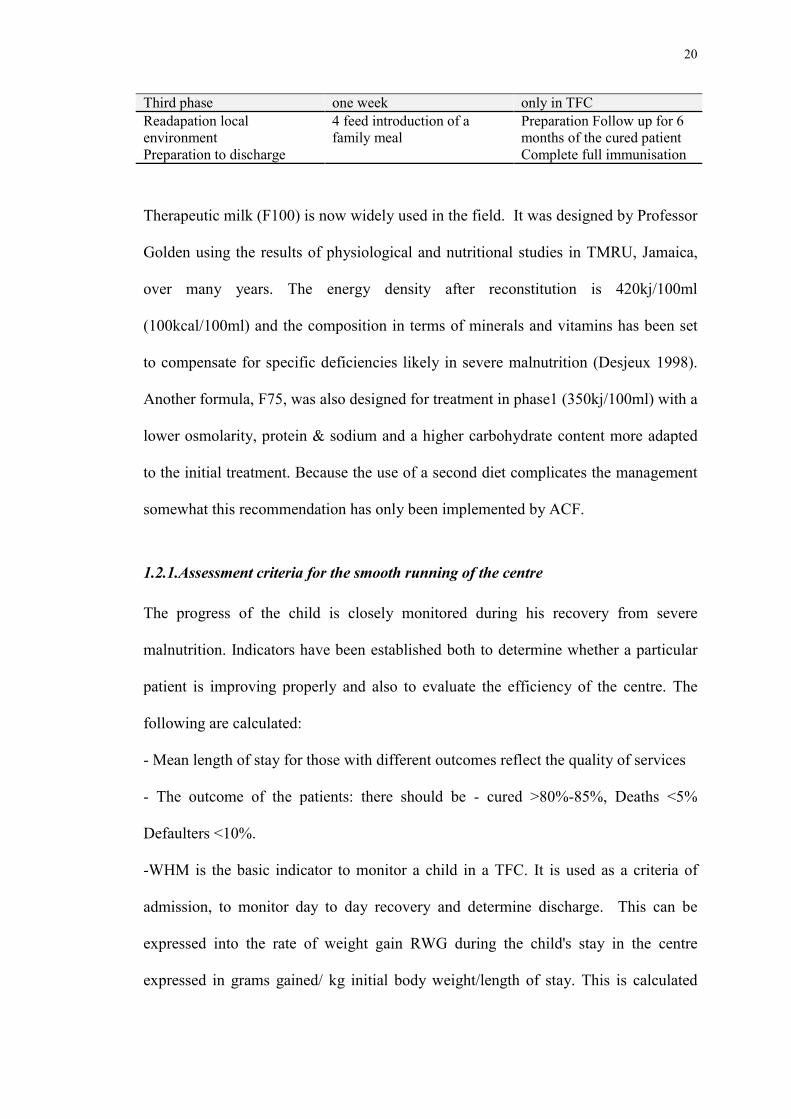
Third phase one week only in TFCReadapation localenvironmentPreparation to discharge
4 feed introduction of afamily meal
Preparation Follow up for 6months of the cured patientComplete full immunisation
Therapeutic milk (F100) is now widely used in the field. It was designed by Professor
Golden using the results of physiological and nutritional studies in TMRU, Jamaica,
over many years. The energy density after reconstitution is 420kj/100ml
(100kcal/100ml) and the composition in terms of minerals and vitamins has been set
to compensate for specific deficiencies likely in severe malnutrition (Desjeux 1998).
Another formula, F75, was also designed for treatment in phase1 (350kj/100ml) with a
lower osmolarity, protein & sodium and a higher carbohydrate content more adapted
to the initial treatment. Because the use of a second diet complicates the management
somewhat this recommendation has only been implemented by ACF.
1.2.1.Assessment criteria for the smooth running of the centre
The progress of the child is closely monitored during his recovery from severe
malnutrition. Indicators have been established both to determine whether a particular
patient is improving properly and also to evaluate the efficiency of the centre. The
following are calculated:
- Mean length of stay for those with different outcomes reflect the quality of services
- The outcome of the patients: there should be - cured >80%-85%, Deaths <5%
Defaulters <10%.
-WHM is the basic indicator to monitor a child in a TFC. It is used as a criteria of
admission, to monitor day to day recovery and determine discharge. This can be
expressed into the rate of weight gain RWG during the child's stay in the centre
expressed in grams gained/ kg initial body weight/length of stay. This is calculated
21
from the minimum weight to the weight at discharge and it is expected to lie between
10 and 20 g/kg/day. Thus, once medical complications have resolved the management
of severe malnutrition involves monitoring weight frequently to assess recovery from
wasting and loss of oedema from kwashiorkor.
- Perhaps the most important criterion of success is the case fatality rate; this is the
number of deaths in the centre by the average number of children registered during the
month with an objective of being <10%. However this method of determining crude
case fatality rate does not reflect the variation of degree of severity of cases, which
can clearly influence the crude mortality.
1.2.2.Prudhon Index
A new tool has been developed to circumvent this problem - the Prudhon Index.
Variations in mortality rates can be ascribed both to inherent differences in the
children and differences in management, the problem is to distinguish between these
two effects so that the relative contribution to mortality can be explored.
Mortality among children treated for malnutrition varies considerably among different
centres in both emergency and non emergency settings. Mortality is clearly related to
the degree of malnutrition on admission, and also to other physiological disturbances
such as the presence of dehydration, electrolyte imbalance, hepatic dysfunction, the
presence of specific nutritional deficiencies and presence and severity of associated
infections. However, differences in therapeutic feeding practices and other
interventions clearly also influence the mortality rate. In order to standardise the
severity of the disease, Prudhon et al (1997) analysed the risk of death based upon
anthropometric data from 1047 children that survived and 147 who died during
treatment in centres run by MSF and ACF in Africa, in 1993. The predictive equations
derived were then tested in a further series of centres: the ones that were thought to be
22
functioning well had a mortality rate, which was not different from the expected
mortality rate. Several centres that were known to have experienced problems, had
inappropriate protocols or had inexperienced staff had a significantly higher mortality
that predicted.
Mortality index was calculated using a logistic regression model derived by Prudhon.
By adding the total Prudhon Index of all severe malnutrition the predicted rate can be
calculated. This can be compared to the observed mortality rate and conclusion can be
drawn. This is a current method of assessing the efficiency's in TFC under support and
management ACF. The principal and rational behind this mortality index together
with it's calculation is central to this thesis, as mortality is commonly used to assess
the effectiveness of treatment of severely malnourished children either in hospital or
nutritional rehabilitation centres.
1.2.3.Closing of centres
Once the number of malnourished patients reduces, so that the number of patients in
charge is less than twenty, feeding centres should be closed down (MSF criterion).
New cases are then referred to the nearby hospital or health centre. At this level it is
thought that it may be more efficient to manage the severely malnourished individuals
through health facilities and community based programmes. The decision to close a
feeding programme should be done after a nutritional survey has clearly shown a
significant decrease of global acute malnutrition in the population prevalence, with a
low and stable population prevalence so that a major influx is not expected.
23
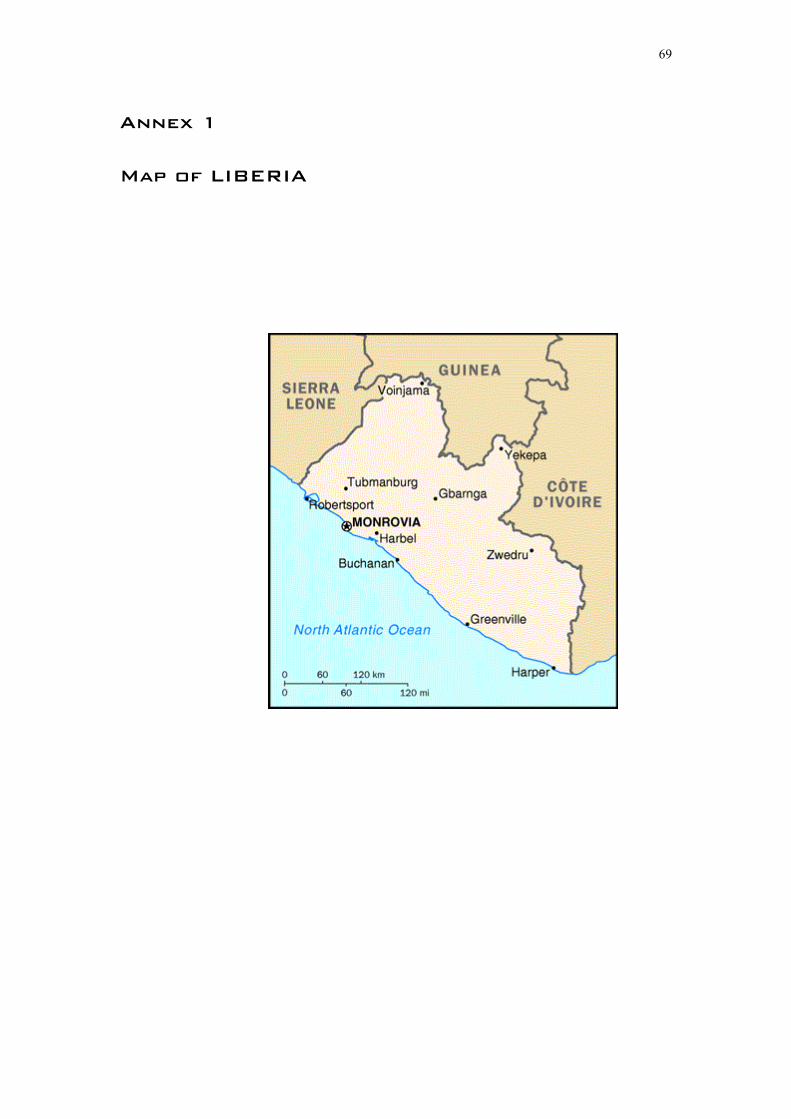
1.3.Country and context
Following the April 6, 1996 crisis in Monrovia, Liberia an emergency programme for
nutrition assistance and food security was instituted (global acute malnutrition >20%).
In 1997 nutritional surveys in the 3 counties where ACF was working showed a
decrease in global and severe malnutrition rates. In the post war environment, the
population had improved its access to land and markets. In the mean time,
humanitarian agencies distributed food and seeds and tools to improve the food
security of the accessible population. In that context, programmes in Liberia were in
transitional phase, shifting towards a rehabilitation approach. Results from the last
nutritional survey in 1998 remained stable showing a global acute malnutrition < 10%
and severe malnutrition ≈1%. Since the beginning of 1998 in view of the positive
evolution of the Liberian situation ACF started to phase out its active involvement and
hand over its operations to the National Health Structures for the treatment of
moderate and severe malnutrition. In Buchanan and Kolila the TFCs were transferred
to the local health structures, one to the Hospital and one to a private Clinic. Training
in both structures were carried on during the 4 previous months in order to leave
ensure continuity of good feeding practices and treatment for severe malnutrition.
Since low mortality levels from malnutrition can be achieved using appropriate
treatment regimens, under NGO supervision, when the phasing out time comes the
question remains as the most appropriate way in which this is to be achieved. That is,
to who and how should the handing over be achieved? Hospitals which seems
logically designed to treat children in paediatric ward or some small health centre with
less medical care but more care in feeding practice?
24
1.4. Hypothesis
Hypothesis to be tested is that there is no change in mortality rate, rate of weight gain
or other measures of good care when TFCs are handed over to a hospital unit or to
private health centres for treatment of the severe malnutrition.
25
2.Methods
2.1.Data collection
This is a retrospective study involving data collected in the field and transported back
to ACF Paris, by Mme Y Grellety, between October 1997 and September 1998. For
this study anthropometric data and medical follow-up from 4 feeding centres were
used.
Data were collected from two towns : Buchanan in the Grand Bassa county and
Gbarnga in the Bong County. In Each town a TFC was running under management of
ACF which was transferred to a National Health facility.
Buchanan:
The TFC was run from the early phased of the war in Liberia until 31st May 1998; at
that time it was closed due to the decrease of malnutrition. In anticipation, ACF has
started to train and improve the capacity of the government to face the malnutrition
problem through creation of a growth monitoring system and also the management in
clinics for the moderately and severely malnourished children.
Transfer of treatment has been done to a Clinic Day Care Centre (daytime treatment of
severe malnutrition) run and managed by a local nurse. It was supported by a local
NGO - LWF (Lutherian Worldwide Fellowship). It covered Buchanan Town and
surrounding area. Continuous turn over of staff has been a constraint which obliged
ACF to conduct regular training on the management of severe malnutrition.
Gbangha Bong County:
The transfer of the programme into National Structures at the field level was
successful although the need of the supervision and close follow up was appreciated.
26
The concept of this hand-over of the programme to the local hospital received a
favourable response from the Ministry of Health, with a view to using the nutritional
surveillance system and later integrating it at the National programme level.
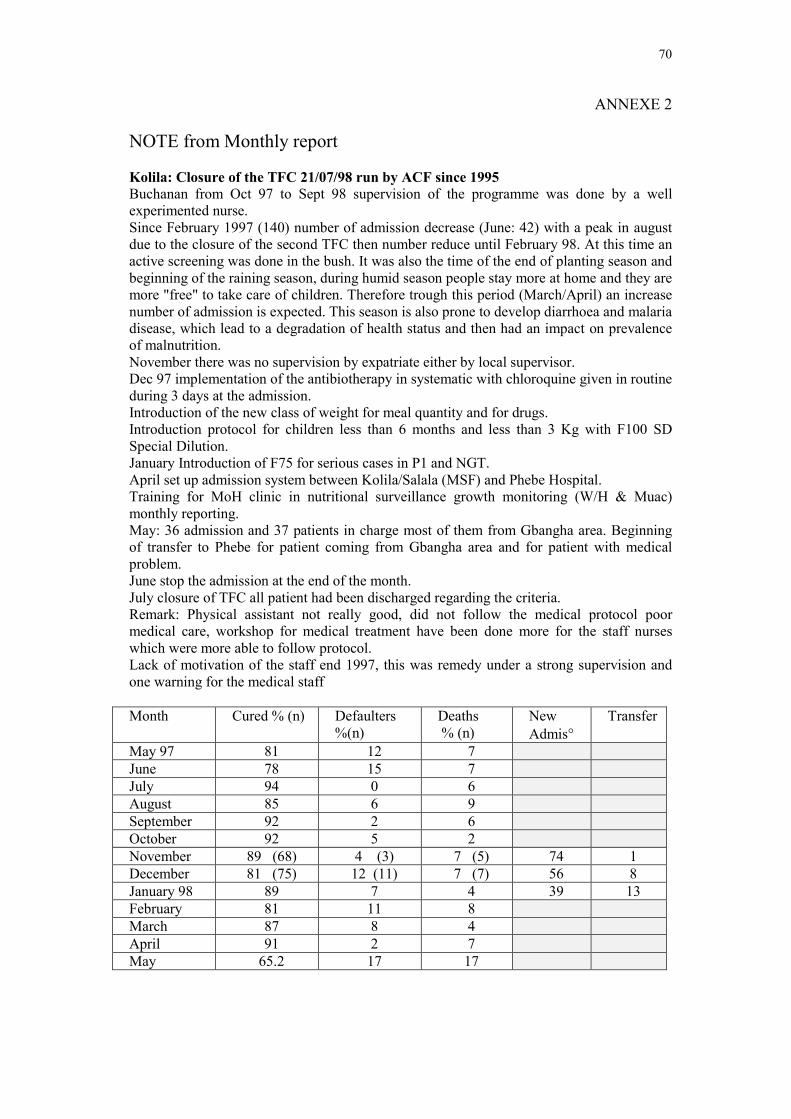
Transfer of treatment from kolila TFC began in May 1998 when the staff of the
paediatric ward of Phebe hospital had been trained on the management of severe
malnutrition. The TFC at Kolila was kept open until 27 July 1998. The 20 bedded
paediatric ward designated 4 beds as a Special Nutrition Unit for the management of
severe malnutrition. This involved 24 hour treatment. On 5th of October 1998 a Day
Care Centre was also implemented in Gbarnga as the number of children admitted to
the hospital was too high to be managed with the facilities available. The DCC was
hosted in LAM clinic, with the staff trained in September 1998; it was able to manage
an average of 30 children.
2.1.1.Criteria admission and discharge for feeding centre
On admission, patients were registered, weighed, had their height measured and the
presence of bilateral oedema recorded. Table M-1 shows the admission and discharge
criteria that were used.
The diagnosis of severe malnutrition was based on Weight-for-Height in percentage of
the median (WHP), MUAC, or oedema. Pitting bilateral oedema was graded: 0 =
absent, + = presence of oedema on the dorsum of the feet, ++ = presence of oedema
visible up to the ankle, +++ = oedema generalised. The presence of oedema was
sufficient to define a patient as being severe malnourished irrespective of their degree
of wasting (i.e. including marasmic - kwashiorkor). MUAC below 110mm was used
to identify children from 12 months (or with a height of 75 cm or more) for admission
(Briend and Wojtyniak, 1987) as severely malnourished. Either a trained local
27
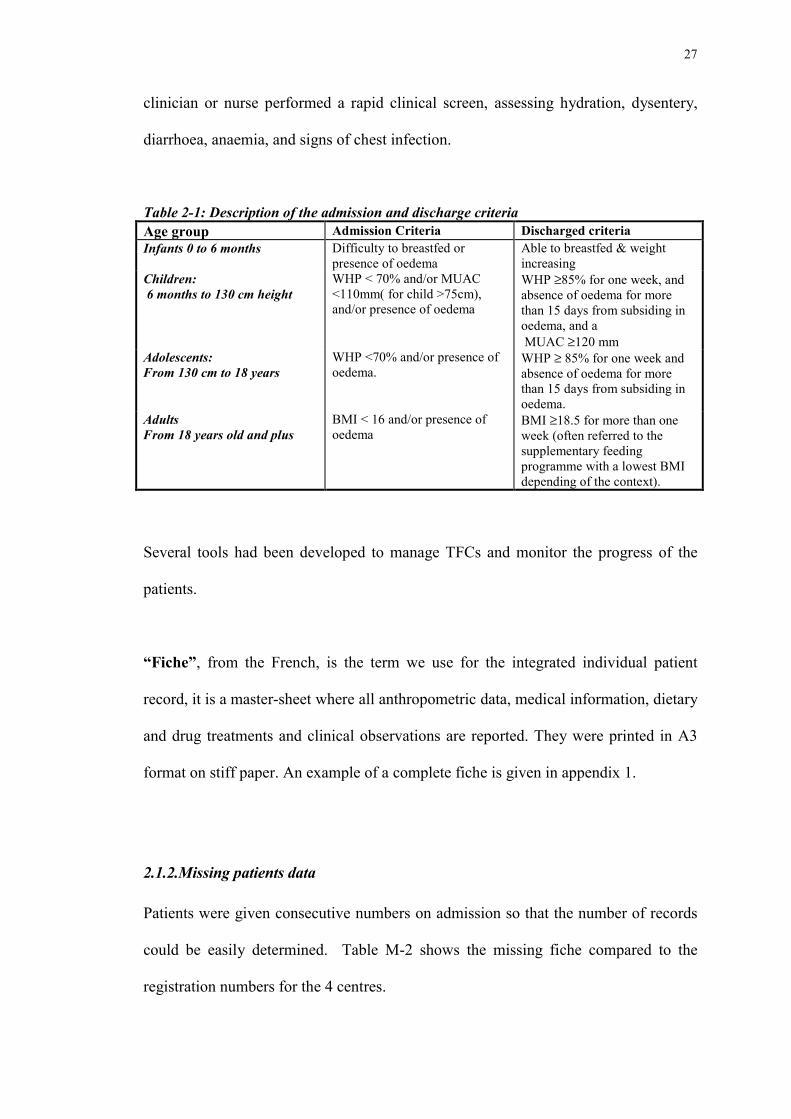
clinician or nurse performed a rapid clinical screen, assessing hydration, dysentery,
diarrhoea, anaemia, and signs of chest infection.
Table 2-1: Description of the admission and discharge criteriaAge group Admission Criteria Discharged criteriaInfants 0 to 6 months Difficulty to breastfed or
presence of oedemaAble to breastfed & weightincreasing
Children: 6 months to 130 cm height
WHP < 70% and/or MUAC<110mm( for child >75cm),and/or presence of oedema
WHP ≥85% for one week, andabsence of oedema for morethan 15 days from subsiding inoedema, and a MUAC ≥120 mm
Adolescents:From 130 cm to 18 years
WHP <70% and/or presence ofoedema.
WHP ≥ 85% for one week andabsence of oedema for morethan 15 days from subsiding inoedema.
AdultsFrom 18 years old and plus
BMI < 16 and/or presence ofoedema
BMI ≥18.5 for more than oneweek (often referred to thesupplementary feedingprogramme with a lowest BMIdepending of the context).
Several tools had been developed to manage TFCs and monitor the progress of the
patients.
“Fiche”, from the French, is the term we use for the integrated individual patient
record, it is a master-sheet where all anthropometric data, medical information, dietary
and drug treatments and clinical observations are reported. They were printed in A3
format on stiff paper. An example of a complete fiche is given in appendix 1.
2.1.2.Missing patients data
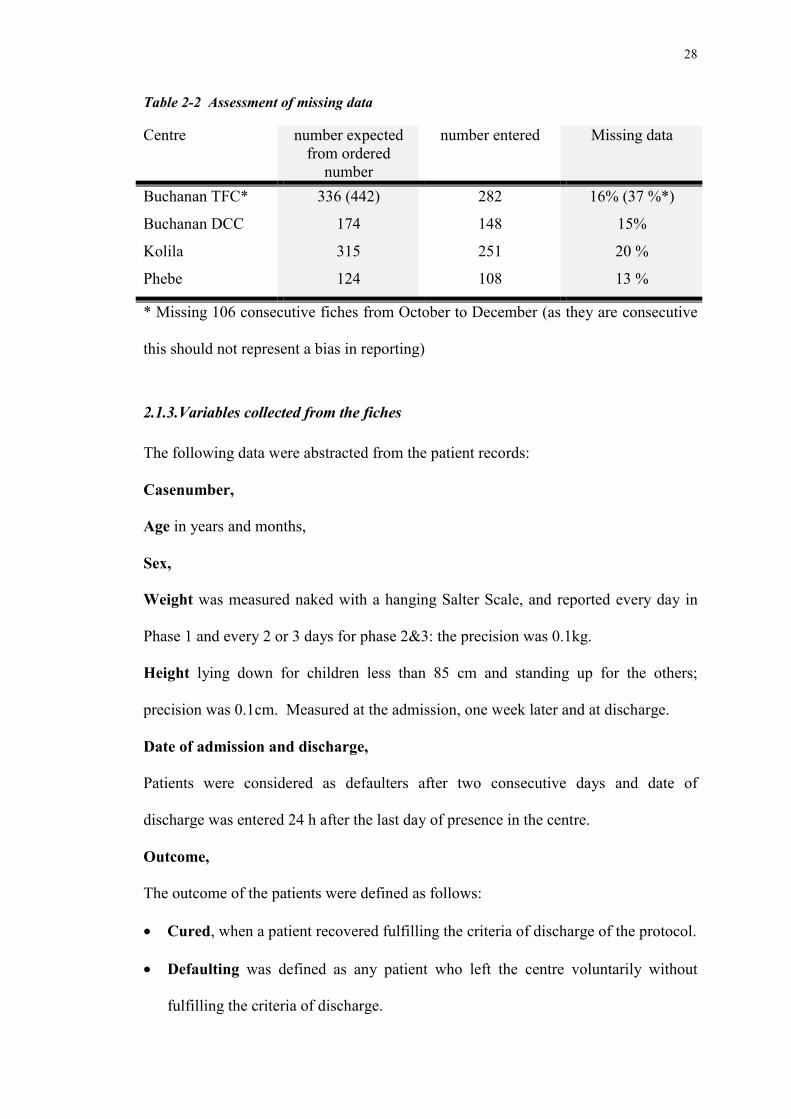
Patients were given consecutive numbers on admission so that the number of records
could be easily determined. Table M-2 shows the missing fiche compared to the
registration numbers for the 4 centres.
28
Table 2-2 Assessment of missing data
Centre number expectedfrom ordered
number
number entered Missing data
Buchanan TFC* 336 (442) 282 16% (37 %*)
Buchanan DCC 174 148 15%
Kolila 315 251 20 %
Phebe 124 108 13 %
* Missing 106 consecutive fiches from October to December (as they are consecutive
this should not represent a bias in reporting)
2.1.3.Variables collected from the fiches
The following data were abstracted from the patient records:
Casenumber,
Age in years and months,
Sex,
Weight was measured naked with a hanging Salter Scale, and reported every day in
Phase 1 and every 2 or 3 days for phase 2&3: the precision was 0.1kg.
Height lying down for children less than 85 cm and standing up for the others;
precision was 0.1cm. Measured at the admission, one week later and at discharge.
Date of admission and discharge,
Patients were considered as defaulters after two consecutive days and date of
discharge was entered 24 h after the last day of presence in the centre.
Outcome,
The outcome of the patients were defined as follows:
• Cured, when a patient recovered fulfilling the criteria of discharge of the protocol.
• Defaulting was defined as any patient who left the centre voluntarily without
fulfilling the criteria of discharge.
29
• Transfer to another healthy facility for special care. This was normally for further
medical investigation (tuberculosis) and/or special treatment (abscess, blood
transfusion). It could also happen to have a transfer from the hospital to a Feeding
centre located in other area.
• Dead : Patients who died in the centre.
If the patient was transferred to hospital and then died this was considered as a
transfer. The death was however recorded. In the analyses it was assumed that 30% of
transferred children would have died if they had remained in the centre.
2.1.4.Clinical check and reporting in the fiches.
Diarrhoea: was defined as the passage of four or more stools per day. Number of
days was recorded/entered in the database for the first 4 days and for the 21 days after
admission.
Vomiting during the first 4 days and for the 21 days after admission.
Dehydration: number of days as judged by medical staff using clinical signs during
the first 21 days.
Respiratory symptoms: number of days of coughing or tachypnea in the first 21
days.
Body temperature was measured twice daily. The number of days with temperature
recorded below or equal to 35.5 and above or equal to 39 centigrade Celsius were
entered in the database.
When it was recorded Malaria and Anaemia were also entered in the database.
30
2.1.5.Data entry by centre
The raw data were entered directly from the fiches into Excel and then transferred to
RS/I database.
2.2.Analysis of the data
The data was transferred from Excel to RS1, SPSS windows, SYSTAT and Excel 8.
The generation of the new variables was performed in RS1 and the main statistical
analysis in SPSS.
New variables:
Anthropometry
The anthropometric variables, weight-for-height and height-for-age were generated by
a program (“anthro”) in RS1 based upon the NCHS standards. There is no equation
of weight-for-height (WH) for individuals of over 130cm.
Weight change
During the first phase daily weight were normally taken. After weights were taken on
alternate days. The missing daily weights were calculated by linear interpolation.
Rate of weight gain
The rate of weight gain is conventionally defined as the weight change from the time
of minimum weight to discharge divided by the length of time and the minimum
weight. It is expressed in g/kg/day.
Cumulative weight gain
Another RS1 program was used to convert the daily weight change of each patient
into increments over the minimum weight (in grams) per kilo minimum body weight.
The data were then entered into a separate database, newly generated by the program.
31
These data represent ten times the increase in body weight when expressed in % of
body weight terms.
Measurement of Case fatality rate & mortality risk
The program “Tfc_pru” was used in RS1 to calculate the likely hood of death of the
patients (prognostic index) according to the equations published by Prudhon and al
(Prudhon et al., 1996). These are based upon the weight and height of the patient and
the presence of oedema. This index was only calculated for children aged 6 to 59
months of age (regardless of height). These equations “standardise” the severity of
malnutrition and generate a risk of mortality, Prudhon et al’s equation was used to
estimated an “expected” mortality rate for each centre and then compared the
observed to expected mortality rate using the Poisson distribution to assess
significance.
Prudhon’s equation used to calculate “Prudhon’s Index” was calculated by an RS1
routine as follows:
Prudhon’s Index = 1/(1 + EXP(-(20.6 - 9.99*LOG(WT)/(HT**1.74)) +(1.36*OED)))
where WT = weight; HT = height; oed = the presence or absence of oedema.
Calculation of risk of death for defined periods of the after admission
• Using these equations the proportion of the total risk of death of a child was
assigned to a time period, using equations for the time of death derived by Grellety
and Golden (unpublished). If the observed number of deaths fell out with the
32
confidence interval of the expected number of deaths from the Poisson distribution
then it was considered that there was a significant excess or deficit of deaths during
the period under consideration.
• Consideration of defaulting children
Children that abandoned during the period being analysed were considered at risk for
the specific number of days they were in the centre. This risk was individually
computed and added to the total expected number of death for the period being
considered.
• Admission to discharge
If a child abandoned treatment before discharge he was assumed to be at risk of death
in the centre for the period of time he was in the centre.
• Children transferred to other centres
Children that were transferred before the period under consideration were not included
in the analysis of that period. Children that were transferred after the period under
consideration were fully included in the analysis because they were in the centre, at
risk of death, but did not die during the period.
For the purposes of the analyses reported in this project, it was assumed that 30% of
children transferred during the period under consideration would have died had they
remained in the centre.
Measurement of Cusum
The use of the cumulative sum (cusum) has been suggested for both surveillance and
quality control in medical practice over time. A separate section of the program,
TFC_pru computed the cumulative sum of the observed minus the expected deaths to
generate a “running total”. The cumulative sum was incremented by the risk of death
33
for each child sequentially and decremented by 1 for each death and by 0.3 for each
child that was transferred.
2.3. Software used
The programs was conceived and written by Golden to adjust the Prudhon index with
the time, and is described above. For specific analysis, the results of RS1 data
analysis were exported and further analysed in Systat and SPSS version 8 and Excel 8.
For a full description of these indices are given in the thesis of Y. Grellety
“Management of severe malnutrition in Africa” (submitted).
34
3.Results
3.1. General description
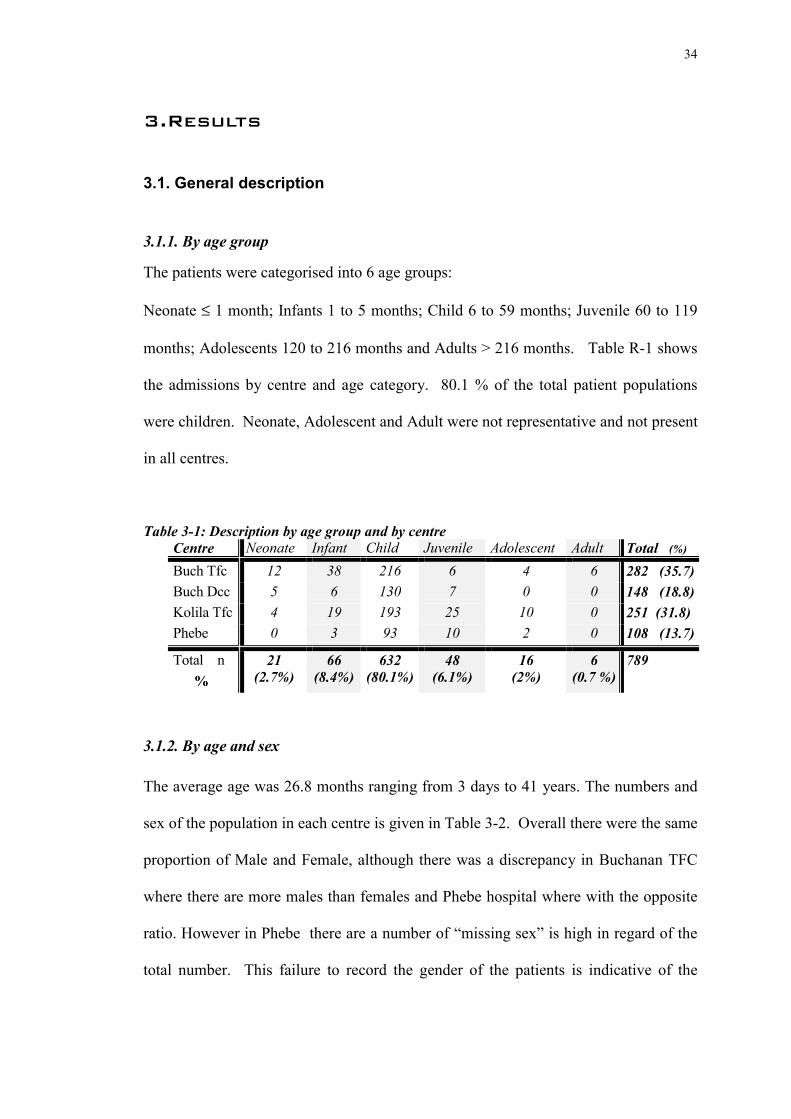
3.1.1. By age group
The patients were categorised into 6 age groups:
Neonate ≤ 1 month; Infants 1 to 5 months; Child 6 to 59 months; Juvenile 60 to 119
months; Adolescents 120 to 216 months and Adults > 216 months. Table R-1 shows
the admissions by centre and age category. 80.1 % of the total patient populations
were children. Neonate, Adolescent and Adult were not representative and not present
in all centres.
Table 3-1: Description by age group and by centreCentre Neonate Infant Child Juvenile Adolescent Adult Total (%)
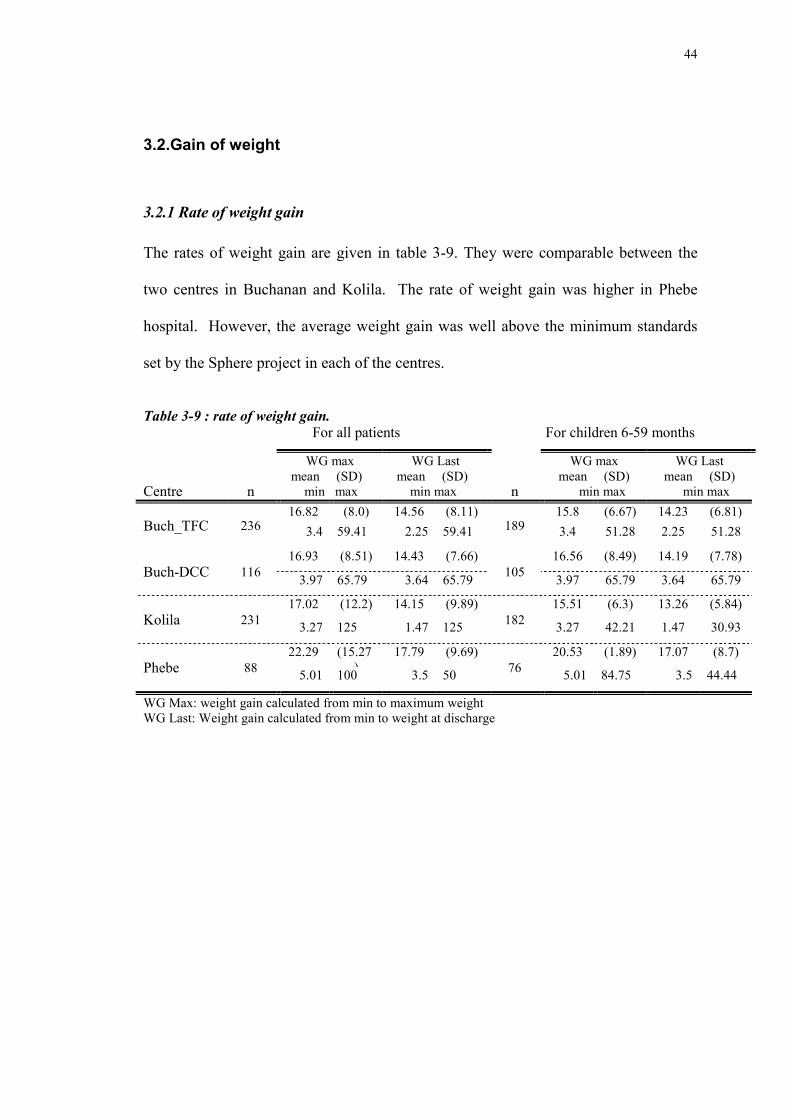
WG Max: weight gain calculated from min to maximum weightWG Last: Weight gain calculated from min to weight at discharge
45
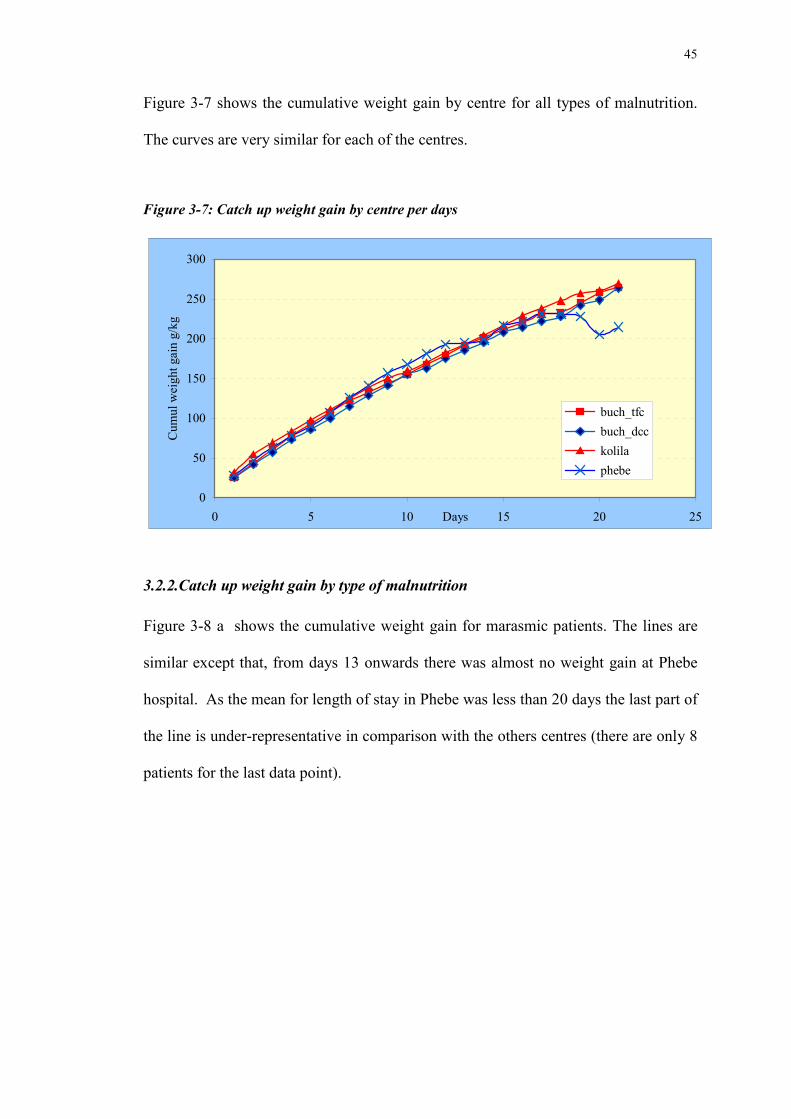
Figure 3-7 shows the cumulative weight gain by centre for all types of malnutrition.
The curves are very similar for each of the centres.
Figure 3-7: Catch up weight gain by centre per days
3.2.2.Catch up weight gain by type of malnutrition
Figure 3-8 a shows the cumulative weight gain for marasmic patients. The lines are
similar except that, from days 13 onwards there was almost no weight gain at Phebe
hospital. As the mean for length of stay in Phebe was less than 20 days the last part of
the line is under-representative in comparison with the others centres (there are only 8
patients for the last data point).
0
50
100
150
200
250
300
0 5 10 15 20 25Days
Cum
ul w
eigh
t gai
n g/
kg
buch_tfc buch_dcc kolila phebe
46
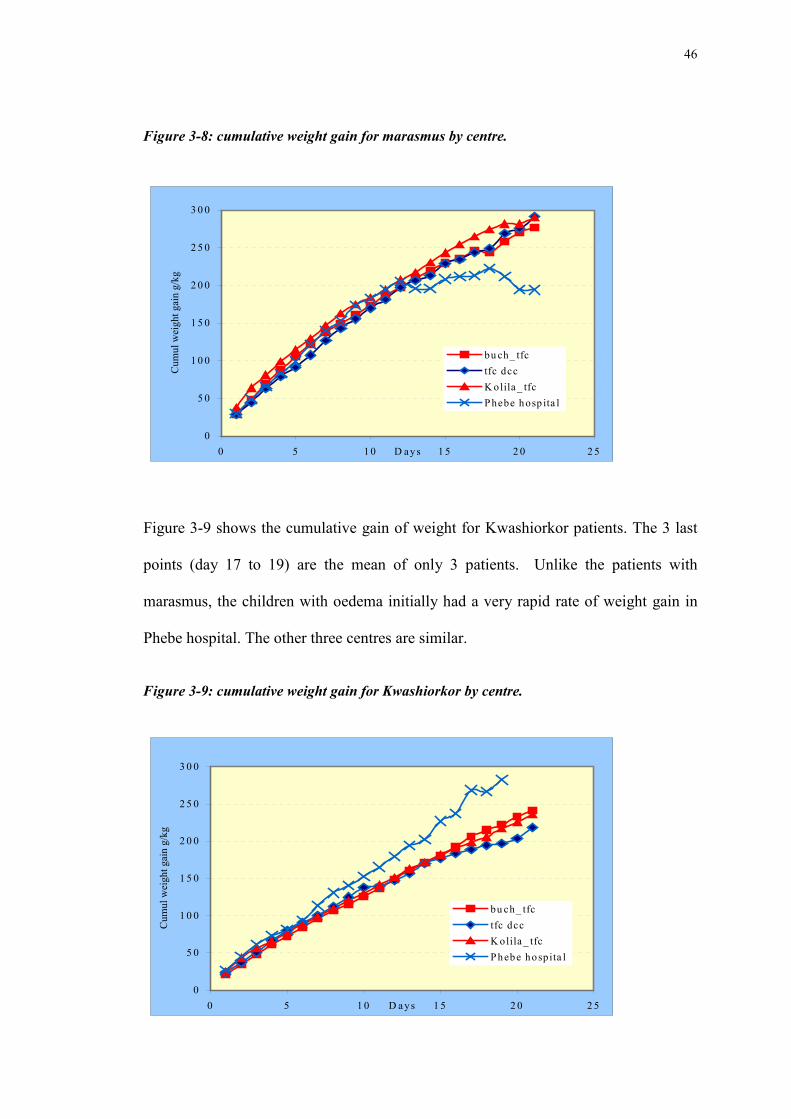
Figure 3-8: cumulative weight gain for marasmus by centre.
Figure 3-9 shows the cumulative gain of weight for Kwashiorkor patients. The 3 last
points (day 17 to 19) are the mean of only 3 patients. Unlike the patients with
marasmus, the children with oedema initially had a very rapid rate of weight gain in
Phebe hospital. The other three centres are similar.
Figure 3-9: cumulative weight gain for Kwashiorkor by centre.
0
5 0
1 0 0
1 5 0
2 0 0
2 5 0
3 0 0
0 5 1 0 1 5 2 0 2 5D a ys
Cum
ul w
eigh
t gai
n g/
kg
bu ch_ tfctfc dccK olila _ tfcP hebe hospita l
0
5 0
1 0 0
1 5 0
2 0 0
2 5 0
3 0 0
0 5 1 0 1 5 2 0 2 5D ays
Cum
ul w
eigh
t gai
n g/
kg
bu ch_ tfctfc dccK olila _ tfcPhebe hosp ita l
47
3.3. Mortality
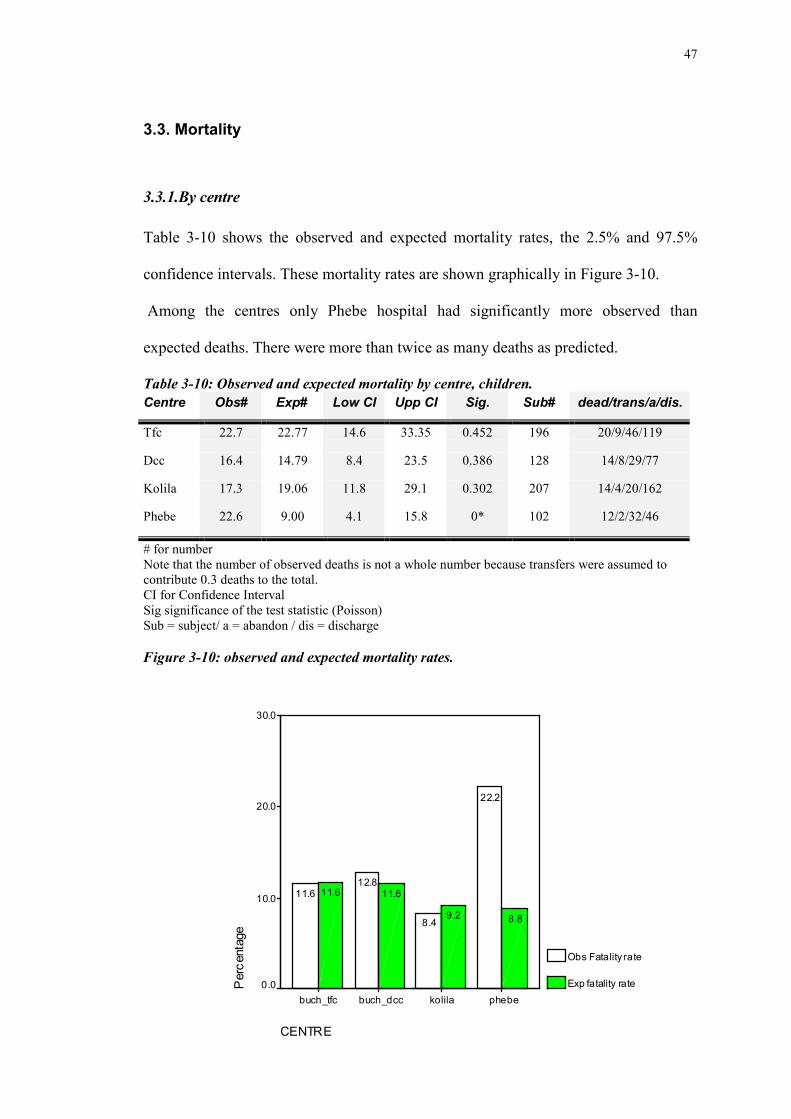
3.3.1.By centre
Table 3-10 shows the observed and expected mortality rates, the 2.5% and 97.5%
confidence intervals. These mortality rates are shown graphically in Figure 3-10.
Among the centres only Phebe hospital had significantly more observed than
expected deaths. There were more than twice as many deaths as predicted.
Table 3-10: Observed and expected mortality by centre, children.Centre Obs# Exp# Low CI Upp CI Sig. Sub# dead/trans/a/dis.
Tfc 22.7 22.77 14.6 33.35 0.452 196 20/9/46/119
Dcc 16.4 14.79 8.4 23.5 0.386 128 14/8/29/77
Kolila 17.3 19.06 11.8 29.1 0.302 207 14/4/20/162
Phebe 22.6 9.00 4.1 15.8 0* 102 12/2/32/46
# for numberNote that the number of observed deaths is not a whole number because transfers were assumed tocontribute 0.3 deaths to the total.CI for Confidence IntervalSig significance of the test statistic (Poisson)Sub = subject/ a = abandon / dis = discharge
Figure 3-10: observed and expected mortality rates.
CENTRE
phebekolilabuch_dccbuch_tfc
Per
cent
age
30.0
20.0
10.0
0.0
Obs Fatality rate
Exp fatality rate
8.89.2
11.611.6
22.2
8.4
12.811.6
48
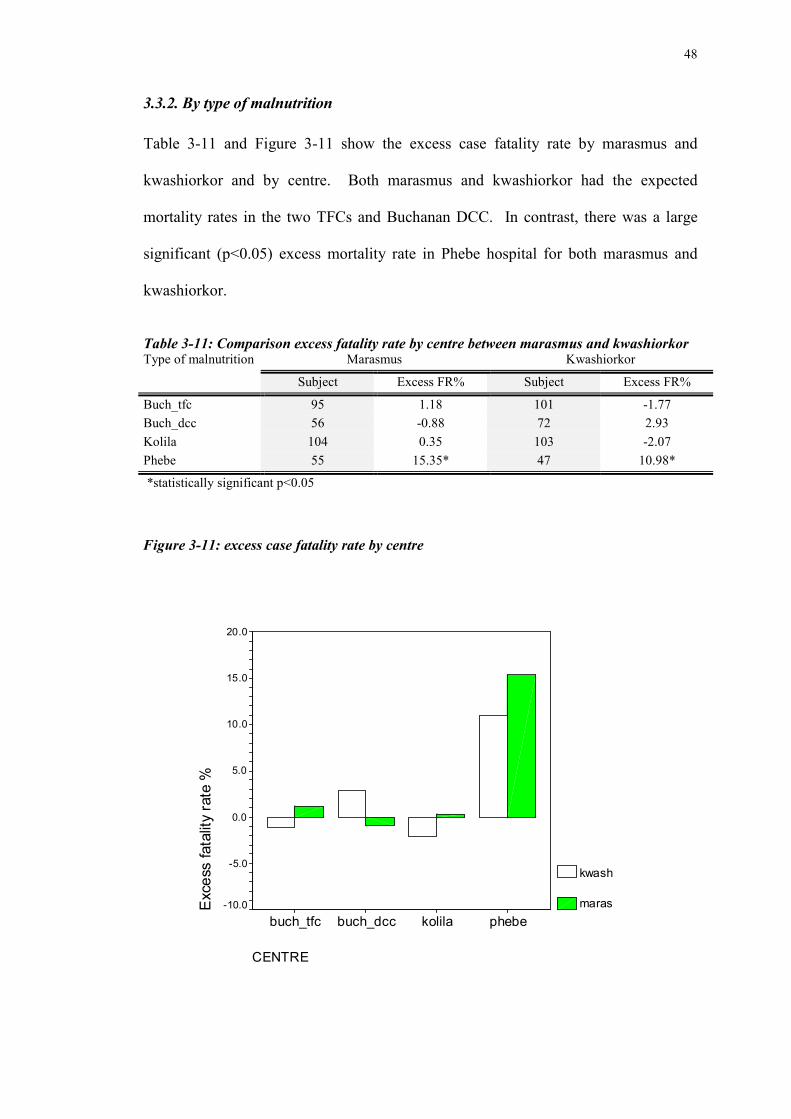
3.3.2. By type of malnutrition
Table 3-11 and Figure 3-11 show the excess case fatality rate by marasmus and
kwashiorkor and by centre. Both marasmus and kwashiorkor had the expected
mortality rates in the two TFCs and Buchanan DCC. In contrast, there was a large
significant (p<0.05) excess mortality rate in Phebe hospital for both marasmus and
kwashiorkor.
Table 3-11: Comparison excess fatality rate by centre between marasmus and kwashiorkorMarasmus KwashiorkorType of malnutrition
There was significant excess of mortality for patients diagnosed as having dehydration in
Phebe hospital where the excess was 19.9% for patient with signs of dehydration Vs 5.0 % for
those without ( p<0.05). In Phebe, patients with anaemia had a 28.8% mortality compared to
11.6 % for those without (p<0.05). However, there were many missing data for the clinical
signs in Phebe so that this result should be treated with caution as it is subject to the reporting
bias. There was no significant excess mortality for the others clinical signs in Phebe. There
was no relationship between clinical signs and mortality from any of the other centres.
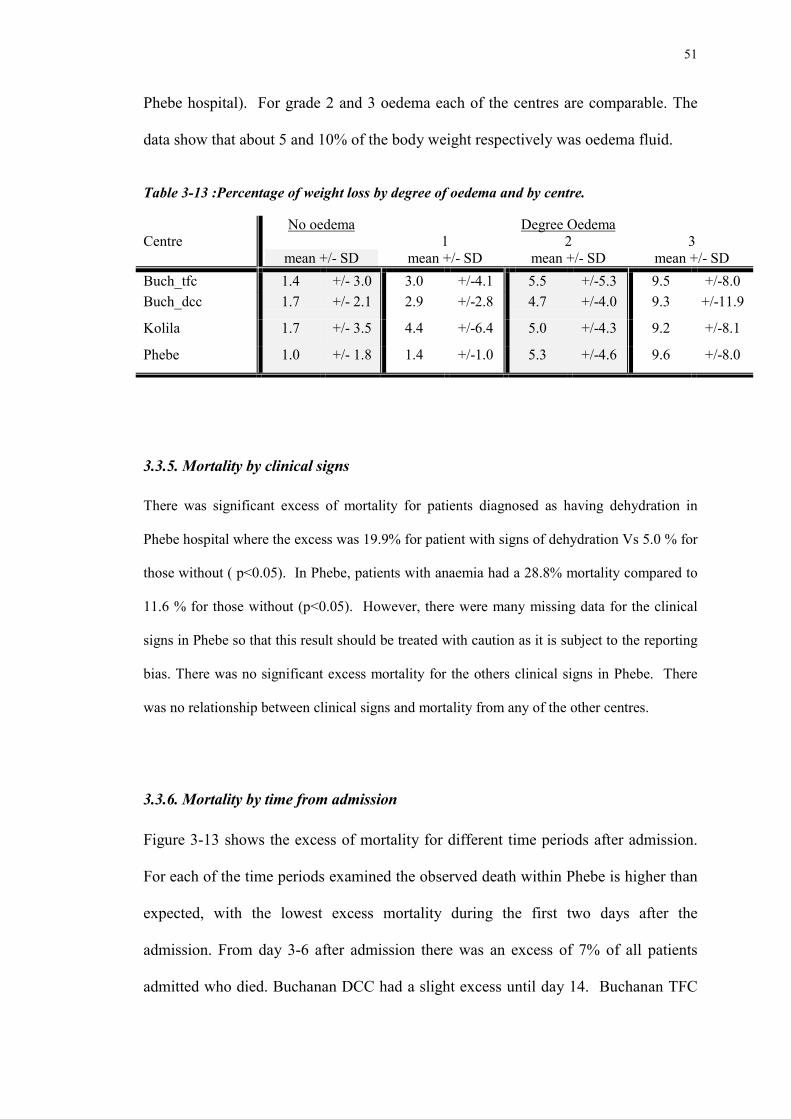
3.3.6. Mortality by time from admission
Figure 3-13 shows the excess of mortality for different time periods after admission.
For each of the time periods examined the observed death within Phebe is higher than
expected, with the lowest excess mortality during the first two days after the
admission. From day 3-6 after admission there was an excess of 7% of all patients
admitted who died. Buchanan DCC had a slight excess until day 14. Buchanan TFC
52
had lower expected mortality rate from 7 and 26. In Kolila the expected number of
deaths occurred throughout treatment and there did not appear to be a critical time.
Figure 3-13: Mortality by centre and for different period after admission.
-2
0
2
4
6
8
10
ad-2d 3-6d 7-14d 15-26d >26d
Exce
ss fa
talit
y ra
te %
buch_tfcbuch_dcckolilaphebe
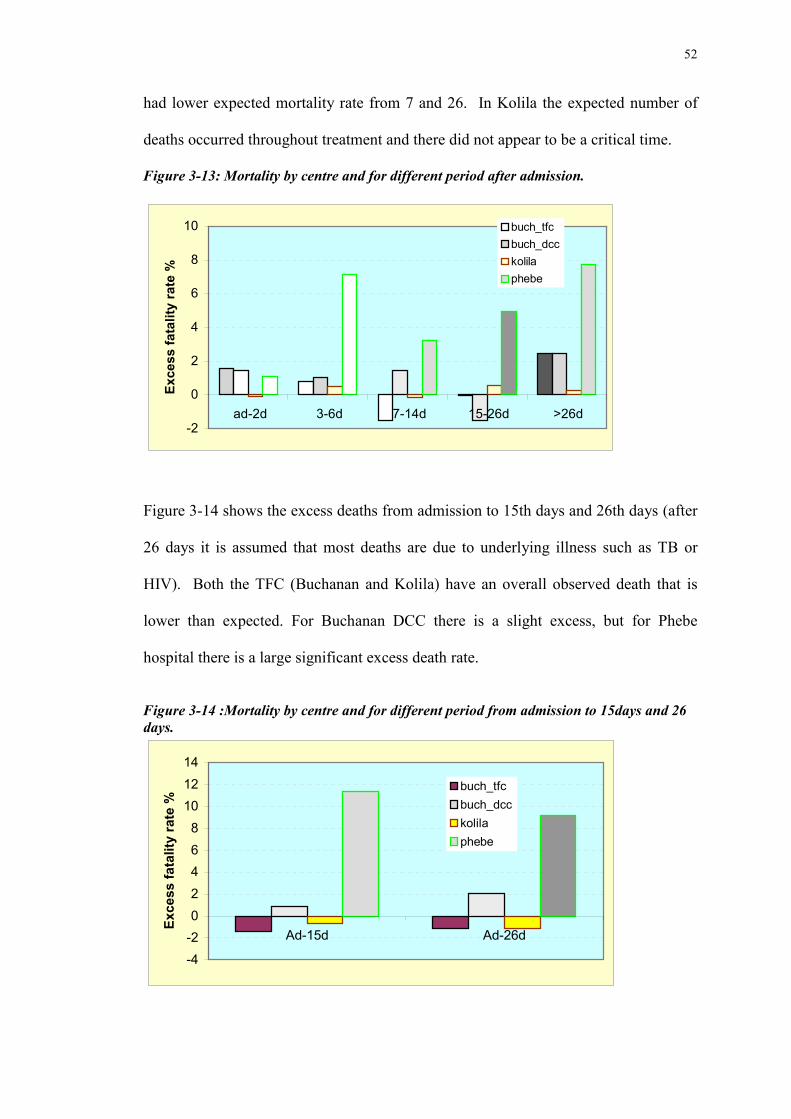
Figure 3-14 shows the excess deaths from admission to 15th days and 26th days (after
26 days it is assumed that most deaths are due to underlying illness such as TB or
HIV). Both the TFC (Buchanan and Kolila) have an overall observed death that is
lower than expected. For Buchanan DCC there is a slight excess, but for Phebe
hospital there is a large significant excess death rate.
Figure 3-14 :Mortality by centre and for different period from admission to 15days and 26days.
-4-202468
101214
Ad-15d Ad-26d
Exce
ss fa
talit
y ra
te %
buch_tfcbuch_dcckolilaphebe
53
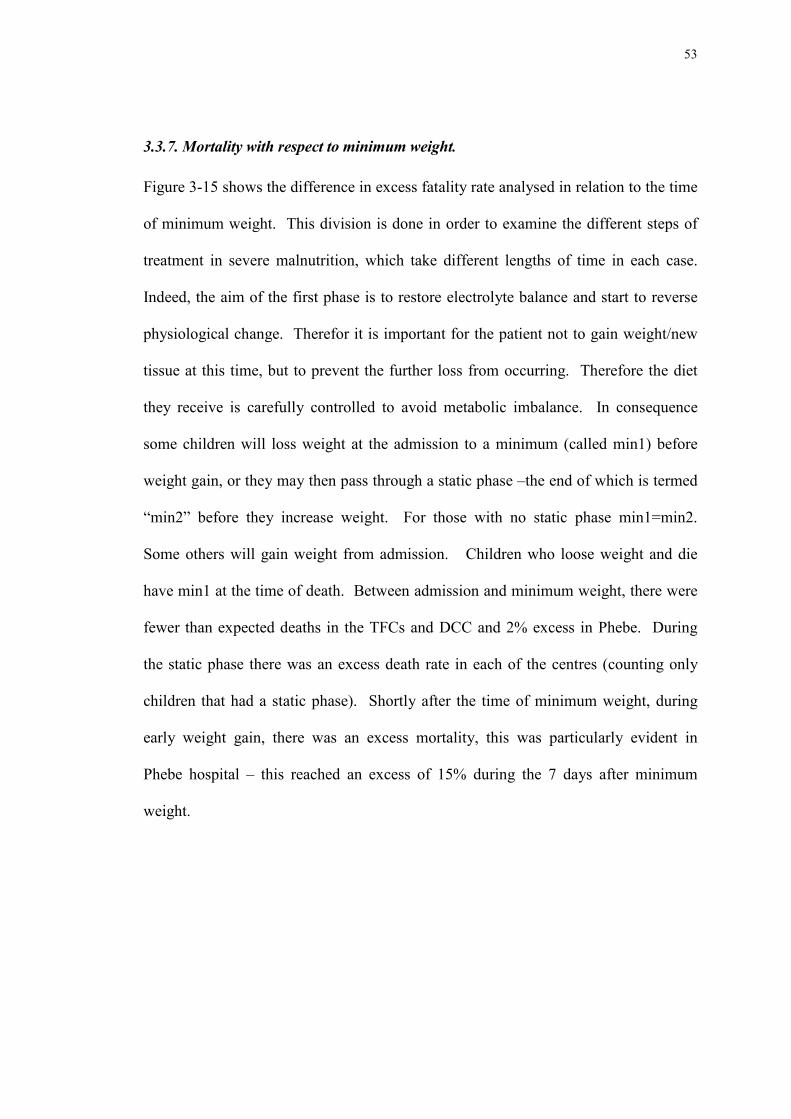
3.3.7. Mortality with respect to minimum weight.
Figure 3-15 shows the difference in excess fatality rate analysed in relation to the time
of minimum weight. This division is done in order to examine the different steps of
treatment in severe malnutrition, which take different lengths of time in each case.
Indeed, the aim of the first phase is to restore electrolyte balance and start to reverse
physiological change. Therefor it is important for the patient not to gain weight/new
tissue at this time, but to prevent the further loss from occurring. Therefore the diet
they receive is carefully controlled to avoid metabolic imbalance. In consequence
some children will loss weight at the admission to a minimum (called min1) before
weight gain, or they may then pass through a static phase –the end of which is termed
“min2” before they increase weight. For those with no static phase min1=min2.
Some others will gain weight from admission. Children who loose weight and die
have min1 at the time of death. Between admission and minimum weight, there were
fewer than expected deaths in the TFCs and DCC and 2% excess in Phebe. During
the static phase there was an excess death rate in each of the centres (counting only
children that had a static phase). Shortly after the time of minimum weight, during
early weight gain, there was an excess mortality, this was particularly evident in
Phebe hospital – this reached an excess of 15% during the 7 days after minimum
weight.
54
Figure 3-15: Excess CFR (%) with respect to minimum weight.
min1 only for case which increase when they have reach minimum weightmin1-min2 for cases who have a steady phasemin2 for case increase after the steady phasemin2/3d for all cases increasing weight from min2 for 3 daysmin2/7d for all cases increasing weight from min2 for 7 days
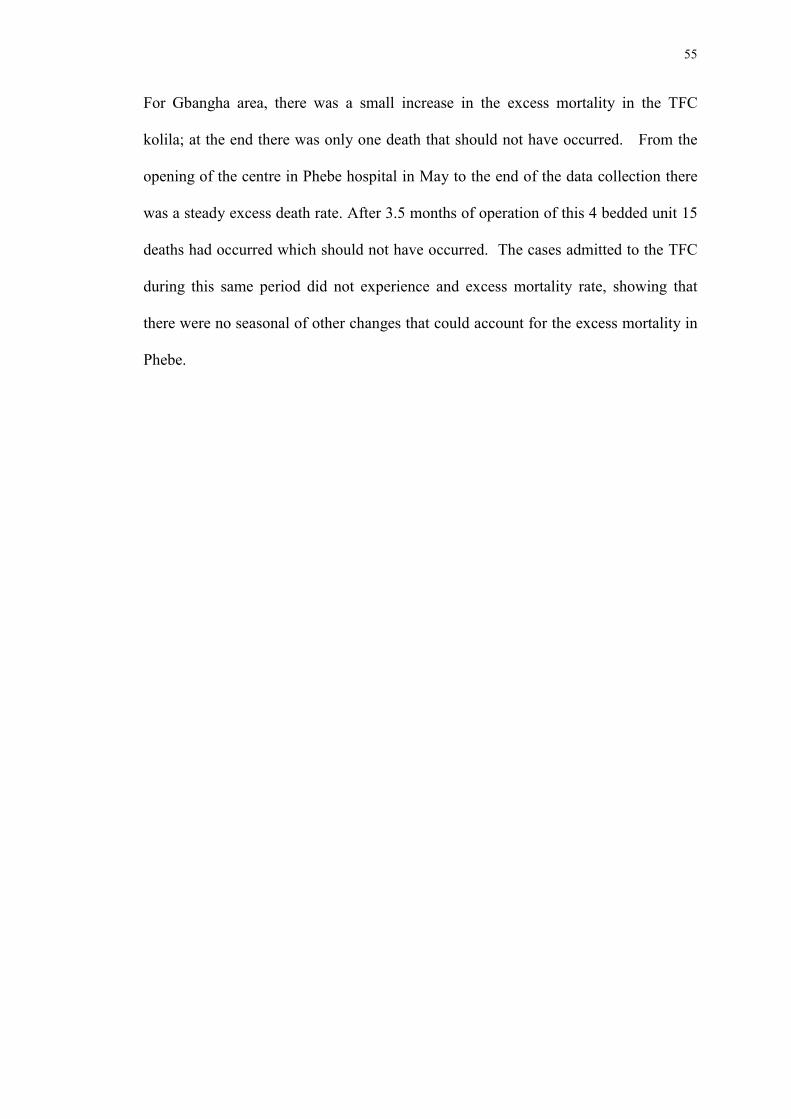
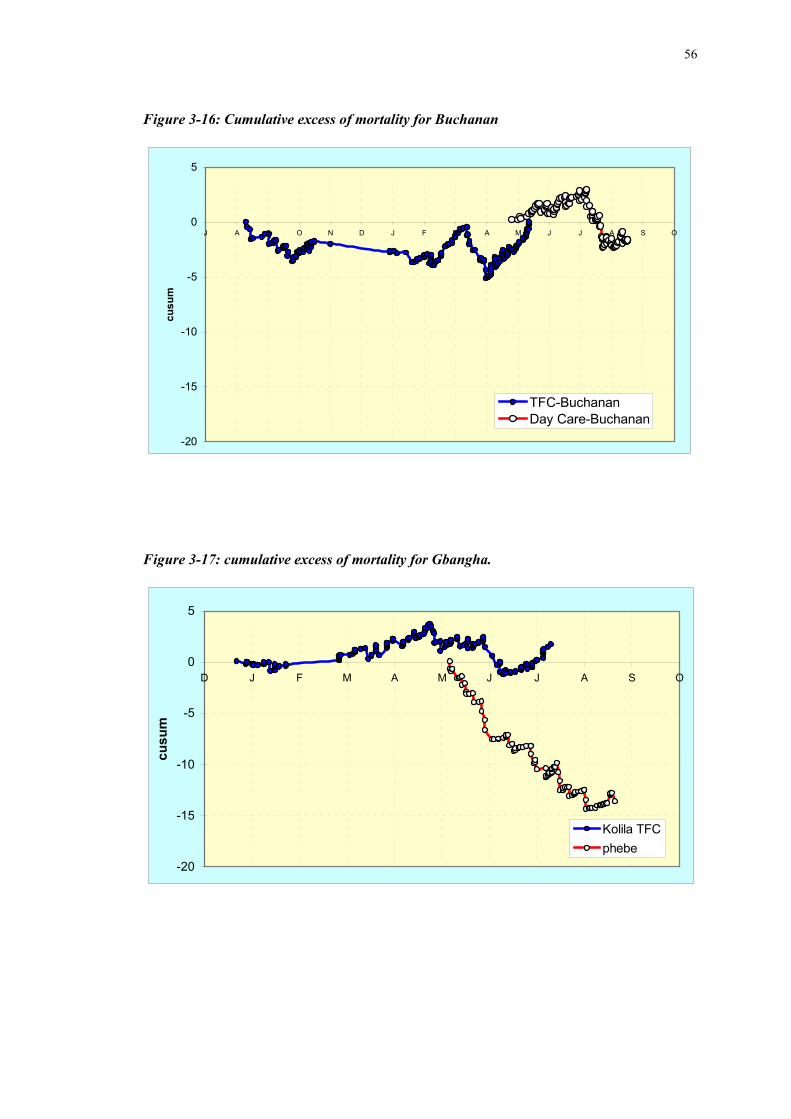
3.3.8. Cusum: examination of temporal changes in mortality
Figures 3-16 and 3-17 show the cumulative excess of mortality in the two pairs of
centres as the management is handed over from the TFC to the National facility. For
Buchanan TFC there is a gap from missing fiche from November to January, after this
the TCF mortality goes down, is stable for one month, goes up for the following
month, falls again and then increases slightly for the month prior to closure of the
TFC. This latter rise could be related to lack of motivation of the staff when they hear
that the centre is to close. The hand over to the DCC was successful. For the first
months there was a slight increase of death as the staff became used to the routine and
then reduced to a negative overall excess until the end of the data collection.
-4
-2
0
2
4
6
8
10
12
14
16
m in1 m in1_m in2 m in2 m in2/3d m in2/7d
Exce
ss fa
talit
y ra
te %
buch_tfcbuch_dcckolilaphebe
55
For Gbangha area, there was a small increase in the excess mortality in the TFC
kolila; at the end there was only one death that should not have occurred. From the
opening of the centre in Phebe hospital in May to the end of the data collection there
was a steady excess death rate. After 3.5 months of operation of this 4 bedded unit 15
deaths had occurred which should not have occurred. The cases admitted to the TFC
during this same period did not experience and excess mortality rate, showing that
there were no seasonal of other changes that could account for the excess mortality in
Phebe.
56
Figure 3-16: Cumulative excess of mortality for Buchanan
-20
-15
-10
-5
0
5
J A S O N D J F M A M J J A S O
cusu
m
TFC-BuchananDay Care-Buchanan
Figure 3-17: cumulative excess of mortality for Gbangha.
-20
-15
-10
-5
0
5
D J F M A M J J A S O
cusu
m
Kolila TFCphebe
57
4.Discussion
The work of international relief organisations for the treatment of severe malnutrition
during complex emergencies and other major national crises, remains a necessity as
national health structures are not able to cope with the sharp increase in severe
malnutrition. Precarious food supplies lead to destruction of the coping mechanisms
for food security. And the national health services are depleted because of migration
and non-payment of staff, to diversion of funds to the fighting forces, and to the sheer
scale of the catastrophe which overwhelms normal capacity.
During emergencies, nutrition programmes are designed to deal with the influx of
population affected by malnutrition. They programs are located in places where there
are the highest needs and where the affected population can have secure (or
reasonably secure) access. Implementation of feeding centres is done with physical
structures that are able to cope with the number of patients likely to become severely
malnourished. All staff categories received a training, specific to their duties, with a
clear job description. Evaluation of the centre is done regularly under the supervision
of an experienced expatriate, who has back-up from headquarters and ready access to
help and information. The programs are readjusted where the evaluation shows a fault
in management; where the key criteria of success and the monthly analysis of
mortality and morbidity shows that there is a problem then a field visit is arranged by
experienced head-quarters staff. Along with the daily running of the centre, in-
service workshops are conducted on various topics to continuously upgrade
knowledge and the quality for treatment of malnutrition.
At the end of the emergency and into the post emergency stage, when the time for
phasing out arises, there remains the need to leave in place this knowledge in
58
treatment of severe malnutrition to National Health Structures and to have a smooth
and efficient transition. Methods of doing this successfully have not been examined
and evaluated before. International NGOs are frequently criticised for rushing in with
lots of resources to deal with the crisis, taking all available national staff and thus
weakening an already dysfunctional service, and then leaving as soon as the acute
emergency has passed or concentrating on the “next emergency” somewhere else, and
leaving nothing of real value behind. As malnutrition remains an important cause of
death in developing countries when there is not a crisis this is a justifiable criticism
where it occurs. The correct method of “withdrawal” which leaves the most behind
and prepares the country for the next disaster, is a critical topic that has not been
adequately addressed.
In this study, phasing out was deliberately done at same time in two similar towns to
two different types of health structures: Hospital and Clinic. This comparison was
designed a priori by Mme Yvonne Grellety, then head of nutrition for ACF-France.
In both cases the hand-over was done in the best way possible in attempt to ensure
that they were both successful. Both of the centres received similar training in
months prior to the transfer; they were equipped with anthropometric equipment and
supplied with the therapeutic food, F100, drugs, kitchen equipment and all the logistic
supplies necessary to manage severely malnourished patients. Both had to face the
same problems of lack of staff (opening time was run with ACF staff see annex), lack
of money and lack of motivation. The huge difference came in the cost of treatment.
During emergency crisis feeding centres run by NGO's are free for the patients. In
hospitals a fee was requested for admission and for medical treatment and a fee
depending on the time of hospitalisation. This is part of the cost-recovery programs
59
instituted in nearly all developing countries and espoused by the World Bank and
Unicef. In Clinics only drugs for medical treatment out with those for systematic
treatment were required. Consequently the hospital had a motive for providing
services that cost less than the charges (despite the free material supplied by ACF):
the patients also left the unit before they reached discharge criteria in order to escape
the bill (reported to be very expensive despite the support of the NGO – or perhaps
because of it where there was a perception that the treatment would be “superior”!).
In Buchanan they faced a similar problem when transferred to hospital as they were
charged at double of the normal price. It was not deemed possible to effectively
transfer responsibility to Buchanan hospital due to the poor standard of overall
medical care
In terms of the protocol both TFCs were run with 3 phases, unlike the Day Care and
the hospital where 2 phases were establish to reduce both the workload and logistic
facilities required. All centres used F100 for feeding. Kolila was the only one to use
F75 (from January 98) and special dilution of F100 for special cases and those failing
with normal dilution.
All facilities gave systematic Vitamin A & folic acid at the start of treatment and,
except for Phebe hospital, systematic antibiotics and anti-malaria treatment. This was
done later instituted (October 1998, as well for ferrous sulphate in phase 2). It took
this time to overcome the resistance of doctors and convince them to try the benefits
of using antibiotics at the beginning treatment. Prior to this they were given on a case
to case basis, largely as a cost-saving exercise.
60
Medical follow up: it was reported by the expatriate that The Physical Assistant in
TFC kolila took some “freedom” from protocol (more understandable/followed by
nursing staff) which was not well accepted by the patients. Medical follow-up and
treatment in Phebe hospital was frequently not reported in the fiche and was clearly
inconsistent, haphazard and regarded as an un-necessary chore. They were very poor
regarding medical information.
In the DCC (Clinic) medical supervision was more done by nurse-aids rather than the
nurse, who was working for the clinic consultation. To improve the level of the staff
involvement and skills a workshop was carried out on medical assessment and
monitoring in August 1998.
Both facilities had to face an unexpected influx of patients. The DCC was planed to
treat 20 patients, but due to the influx, the capacity of this centre was increased up to
40 persons with some building rehabilitation. In Phebe hospital the location of the
nutrition unit at the opening was within paediatric ward: of 20 beds in the ward, 4
were reserved for the treatment of severe malnutrition. With the high attendance, the
capacity of the hospital was rapidly exceed and the patients scattered throughout the
ward. After long and difficult discussions, the size of the “unit” was increased to 8
beds in October 1998, gathered in one half room, then under the supervision of a head
nurse within one month a full room, with 18 beds, were occupied by severely
malnourished children. As these patients were less able and likely to pay their fees,
the expansion of the treatment facilities was resisted by the medical management and
administrators of the hospital.
61
Staff transferred from the ACF TFCs, who should have stayed only during the time to
finalise the hand over, had to stay for longer than planned: until the 15th of July for
the DCC. In Phebe hospital there were an extra 3 staff (one per shift) assigned by
ACF from August until November, after which 5 hospital staff were assigned full time
to this ward. At that time only one ACF staff was retained in the unit for the night
shift. For the first months nutrition staff were suppose to help for the transition phase;
in reality, hospital staff was assigned to the unit only during the weekend, and during
these days the fiche were left entirely blank without any data at all being entered.
All these management problems are important constrains on successful hand-over and
could explain some of the figures. However, they would not explain the dramatic
difference between the DCC and the SNU.
Review of the evaluation criteria for nutrition centre:
The length of stay and proportion of defaulters, deaths and cure reflect the quality of
service. None of the centre reaches the 80% cured patient, except for Kolila, which
was very close, this can be explained by the high rate of defaulters. For Phebe
hospital the fee is one reason for defaulting (however, a reputation for the hospital
being a mortuary is also a factor). Furthermore there was more defaulting during the
week-end (30% of defaulters were present on Friday and absent on Monday morning
– but as it was the hospital staff on duty alone over the week-end, the actual times of
departure were not recorded). For the day care centre, as the mother returned home
every night, when they themselves felt that the child had recovered enough the no
longer made the effort to come to the centre each day. For Buchanan Kolila Tfc the
increase in defaulting was mainly during the last months of the centre which was
related to the news of TFC’s pending closure.
62
For the clinical signs, when I entered the raw data into the computer file, I had the
impression that there was over-reporting from the DCC, mainly for diarrhoea and
vomiting, and marked under reporting from Phebe, where there were blank pages and
poor filling of all section of the fiche. This impression is reinforced by the data
presented. Indeed, all the clinical data should be treated very cautiously as is
particularly related to the quality of supervision and the good will and
conscientiousness of the staff.
Gain of weight reported both in terms of a rate (g/kg/d) assessed for each child and
also as cumulative weight gain by centre (where the data is essentially cross
sectionally analysed). There was no difference in the rate of weight gain except for an
higher increment in Phebe assessed longitudinally – this is only apparent for the
children with kwashiorkor from the cumulative weight gain analysis. However with
the short length of stay in Phebe it is likely that the longitudinal data include many
children who were assessed over a short period of time, when weight gain is
influenced by fluid retention as well as tissue accretion. As children with
kwashiorkor are much more likely to retain sodium than those with marasmus, such
an early rate of weight gain may not be a “good” sign at all, and may indicate the
reason for the excess mortality. Certainly, the majority of those that died had a
weight gain in the few days before they succumbed. A further more sophisticated
analysis is necessary to investigate the relationship between early changes in weight
and mortality.
Expected mortality was calculated with the Prudhon index. This to a large extent
overcomes the problem of the bias towards the worse children being admitted to
hospital and the less-severe cases to the TFC as the basis for the difference in
63
mortality. This new tool now gives us the ability to critically examine the
management. Interestingly, the severity of the cases admitted to Phebe was LESS and
not more than the severity of those admitted to the TFCs (expected case fatality rate
was lower in Phebe than elsewhere), thus the criticism that there were more severe
cases appears to be without foundation. Further, the excess mortality was present for
both marasmus and kwashiorkor, the centres were, for a time running concurrently,
they were drawing their patients from the same population which had undergone the
same privations. There is no reason to suppose that the patients differed in any way in
their anthropometric severity or in the associated illnesses or deficiencies. The
difference lies elsewhere.
Crude mortality in percentage by centre for data validated by Prudhon index.
TFC DCC Kolila Phebe
10.2 10.9 6.8 21.6
The Day care centre and the TFC in Buchanan had a relatively high crude mortality
10.9 &10.2%, but this translated into an excess of mortality of only 1.26 & -0.04%. It
would seem that Bong County was slightly more affected than Gbanga where the
crude mortality for Kolila was only 6.8%. This should be compared with Phebe
hospital with a crude mortality of 21.6% and an excess mortality of 13.3 %. This
case fatality rate had been explored to attempt to determine the origin of this
difference: faulty management? For the type of malnutrition (marasmus or
kwashiorkor), degree of oedema (except for oedema grade 1), different periods after
admission, different time from admission, different times in relation to minimum
weight - the excess case fatality rate is always positive. Although, for children who
died more than after 2 weeks of admission it can be ascribed to AIDS, TB, malaria or
64
pneumonia. This same late excess mortality was not seen elsewhere, in particular, it
was not seen at Kolila which drew its patients from the same population. The excess
could not be ascribed to the diet, per se, as they both used the same product F100 and
were supposed to follow the same protocol. The clear difference is in ward
management, leadership quality and staff motivation and attitudes. Another clear
difference is the presence of medical staff in Phebe Hospital, but not elsewhere. The
medical staff would not accept the routine use of antibiotics and insisted upon making
individual judgements about dehydration and the need for and method of fluid
replacement. The nursing and nutritional staff did not have the authority to vary from
their instructions. They were nearly all trained at a time before the modern
management of severe malnutrition was developed and such information is not taught
in medical schools or given in text-books present in Liberia. Medical staff will not
take “instruction” from nursing or nutritional staff.
The results clearly show that the hand-over of treatment for severe malnutrition in the
post-emergency period was different between a hospital and a non-residential day
care supported by a local NGO. The null hypothesis was not proven.
Initial management requires frequent, careful clinical evaluation and anticipation of
common problems so they can be prevented or recognised and treated at an early
stage. One difference between the nutrition centre and hospital is that the phases are
physically separate and children are regrouped by phase to improve monitoring and
move physical to one to the second. It is recommended to dedicate a special area in
the DCC so that the children can be easily monitored, and isolated from other patients.
In hospital, the malnourished children were scattered within the paediatric ward,
65
making monitoring very difficult and cross infection more likely. Furthermore,
infections in severely malnourished children are difficult to detect as they do not react
with fever and inflammation like well nourished children, but rather become apathetic
or drowsy: it was only after much discussion that systematic antibiotic therapy was
implemented. If the hospital had been implementing the management without outside
assistance (in terms of drugs and products as well as expertise) antibiotic treatment
would not have been instituted at all.
Use of intravenous infusion within the hospital environment is widespread; this
should be avoided except when absolutely essential.
We could have expected an increase in death rate with transfer of care to the Day Care
Centre, because treatment was only given during the daytime and child are at risk of
developing hypoglycaemia and hypothermia at night if they are not fed. The results
imply that this was not a major problem. Although it is stated that then severely
malnourished need to be fed every 4 to 6 hours to prevent hypoglycaemia during the
first stages of the renutrition, the present results indicate that this is not the dominant
problem it is usually conceived to be. If the difference in mortality between the
Buchanan TFC and DCC can be ascribed to failure to treat children at night then such
omission would cause a very small proportion of the observed deaths.
It should be emphasised that both centres, at opening, had some "well" trained staff
who were familiar with (and had transferred from) the operation of the TFC.
Therefore we could have expected approximately the same results regarding the
mortality. Notwithstanding all the skills needed to treat severe malnutrition the
results show a major discrepancy from that expected. For the day care centre, after
the contract with ACF staff was stopped the mortality remain stable.
66
For the Hospital situation was deteriorated month after month. We can not ascribe
this to the lack of staff for at least for the 3 first months. Poor involvement of the
hospital and high staff turnover affected to the ward. Due to the poor relationship
between the medical and nursing staff and their disregard for nutrition, there was
unmotivation of the staff actually looking after the children. In this situation
protocols are not followed with fidelity.
Conclusion:
This is the first time we have had the opportunity to analyse data from the transition
phase of an NGO in a post emergency situation in the same country for the treatment
of severe malnutrition with different health structures. The result is obvious. It will
be interesting to see if a strong head nurse, willing to improve the care of severe
malnutrition and able to run her ward as she wants to without interference would
make a difference. Motivated staff who see what can be achieved, and enough staff
specially dedicated to this service could reverse the trend. The children do not look
attractive on admission, but they need special attention need to be stimulated
surrounded by all.
Malnutrition often occurs among poor populations. They can be marginalised in
nutrition units and staff can be reluctant to have contact with these patients. The
results from Liberia need to be confirmed elsewhere. However, it is becoming clear
that patients die in hospital iatrogenically as frequently as from the illness for which
they were admitted.
67
References
• ACC/SCN: Fourth Report on the World Nutrition Situation . 2000.
• Briend A & Golden MHN. Conference Treatment of severe child malnutrition in refugee
camp. European Journal of Clinical Nutrition 1993 47,750-754.
• Briend A, Dykewicz C,Graven K. Usefulness of nutritional indices and classifications in
predicting death of malnourished children. Br. Med. J. 1986; 293: 373-375.
• Cook R. Is hospital the place for the treatment of malnourished children ? Environ Child
Health, 1971;17 :15-25.
• Desjeux JF et al. Definition et evaluation d'un aliment therapeuthique pour les enfants
severement malnutris, en situation d'urgence humanitaire. Bull academie natle med 1998
182 (8) 1679-1695.
• Garrow and James. Human nutrition and dietetics 10th ed. Churchill Livingston, 2000 :
515-526.
• Golden MHN & Briend A. Treatment of malnutrition in refugee camps. Lancet 1993;
342:360.
• Gorstein J, Sullivan K, Yip R, M. de Onis, Trowbridge, Fajans F,Clugston. Issues in the
assessment of nutritional status using antropometry. Bull. World Health Organisation
1994; 72(2): 273-283.
• Grellety Y: “Management of severe malnutrition in Africa” (submitted).
• MSF 1995 Medecins Sans frontieres. Nutrition guidelines in emergency situation Paris ,
1995.
• NCHS 1977 National centre for health statistics growth curves for children, birth to 18
Years. United states, Rockville MD, N.C.H.S, Vital and Health Statistics 1977; 11 (165).
• Prudhon C, Golden MHN, Briend A, Mary JY.A model to standardise mortality of
severely malnourished children using nutritional status on admission to therapeutic
feeding centres European Journal of clinical nutrition 1997 51 771-777.
• Prudhon C, Briend A, Laurier D, Golden MHN, Mary JY.Comparison of weight and
height based indices for assessing the risk of death in severely malnourish children. Am.
J. Epidemiol 1996; 144 (2): 116-123.
• Roosmalen-Wiebenga MW. et al. Nutrition rehabilitation in hospital- A waste of time and
money? Evaluation of nutrition rehabilitation in rural district hospital in southwest
Tanzania. J. Trop. Ped. 1986; (32): 240-243.
• UNHCR Handbook for Emergencies second edition. Geneva 1999:184-210.
• Schofield C & Ashworth A. Why have mortality rates for severe malnutrition remained
so high? Bull. World Health Organisation; 1996 (74): 223-229.
68
• Tahmeed A, Ali M, Ullah MM et al. Mortality in severely malnourished children with
diarrhoea and use of a standardised management protocol. Lancet 1999; 353: 1919-23.
• Waterloo JC. Protein Energy Malnutrition. Edward Arnold 1992.
• WHO Management of Severe Malnutrition: A manual for physicians and senior health
workers 1999.
• WHO Use and interpretation of Anthropometric indicators of nutritional status. Reviews
Analyses Bull. World Health Organisation 1986; 64: 929-941.
• WHO Malnutrition the global picture : http://www.who.int/nut/
ANNEXE
69
Annex 1
Map of LIBERIA
70
ANNEXE 2
NOTE from Monthly report
Kolila: Closure of the TFC 21/07/98 run by ACF since 1995Buchanan from Oct 97 to Sept 98 supervision of the programme was done by a wellexperimented nurse.Since February 1997 (140) number of admission decrease (June: 42) with a peak in augustdue to the closure of the second TFC then number reduce until February 98. At this time anactive screening was done in the bush. It was also the time of the end of planting season andbeginning of the raining season, during humid season people stay more at home and they aremore "free" to take care of children. Therefore trough this period (March/April) an increasenumber of admission is expected. This season is also prone to develop diarrhoea and malariadisease, which lead to a degradation of health status and then had an impact on prevalenceof malnutrition.November there was no supervision by expatriate either by local supervisor.Dec 97 implementation of the antibiotherapy in systematic with chloroquine given in routineduring 3 days at the admission.Introduction of the new class of weight for meal quantity and for drugs.Introduction protocol for children less than 6 months and less than 3 Kg with F100 SDSpecial Dilution.January Introduction of F75 for serious cases in P1 and NGT.April set up admission system between Kolila/Salala (MSF) and Phebe Hospital.Training for MoH clinic in nutritional surveillance growth monitoring (W/H & Muac)monthly reporting.May: 36 admission and 37 patients in charge most of them from Gbangha area. Beginningof transfer to Phebe for patient coming from Gbangha area and for patient with medicalproblem.June stop the admission at the end of the month.July closure of TFC all patient had been discharged regarding the criteria.Remark: Physical assistant not really good, did not follow the medical protocol poormedical care, workshop for medical treatment have been done more for the staff nurseswhich were more able to follow protocol.Lack of motivation of the staff end 1997, this was remedy under a strong supervision andone warning for the medical staff
Phebe4th may 98 opening datePrivate hospital supported by LWS (Lutheran…) organisation and different privateAmerican donors. This hospital is the reference for the county. 80 beds for medicinepaediatric and obstetric + OPD.Negotiation have beginning in November 97 to start the unit in May 98.Training was done for 2 doctors 11 nurses, 3 CMW, 1 cook 3 NA 1 student nurse and theresponsible for LWF supply split in two groups one in January and one in March. 1 weekand half for theoretical and 3 days practice in TFC. Plan to run the special unit in April, buthospital was reluctant to open to face this problem 6 staff from ACF were transferred to thehospital for one month: one nurse, 3 NA 1 Register 1 cook the time to open the unit and tofinalise the training. They stayed until end of July then reduce the participation to 3 persons.20 beds in paediatric ward only 4 assigned for nutrition unit
Protocol P1&2 as in TFC no P3 not yet F75 and F100 SD.Medical: Vit A and folic acid given in systematic try to convince doctor to give ATB andChloroquine. At this time treatment is given on case by case.In May: 27 admission, 2 cured, 6 dead, 8 default, 2 transfer back to MSF. 8 patients incharge at the end of the months.Important there is a fee for admission in nutrition unit and the cost depend on the time ofhospitalisation this can explain the high rate of defaulters. High rate of death explainedbecause unit is reference centre so they receive the most serious cases and cases withmedical problem.June Improve relation between medical and nutritional team, arrange a schedule to give acomplete participation of hospital staff during weekend. Consultation made daily by ACFcounterpart then relative to doctors.July: Overcrowding 2 child per bed, lack of space change discharge criteria ( W/H ≥ 80%,no medical problem, MUAC =120mm and no oedema since 15 days for patient which canhave follow up in dry ration.).
August Expatriate push for the systematic treatment was given in time. Reduce ACF staff to 1nurse and 2 NA in charge of the feeding (I for the day shift one in night shift), during the WEPhebe staff take over just fed the children child in P1 are not weighed.
"Reduce death rate because of a close F-up of patient especially those drop in weight in theunit".September new expatriate nurse with field experience Sept98 to Jan 99 (too much confidentin the doctor practice)They had problem to have hot water during night as hospital kitchen was closed. Nochlorination so water needs to be boiled to be safe. Solve by a purchase of an electrichotplate.October half room for the unit (8 beds). Treatment of ferrous in P2 + amoxicillin insystematic at the admission. Introduction of the transition phase: 2 days in P1 , go back toP1 for critical casesUse of perfusion/infusion ringer lactate for dehydration, glucose only for quinine (may bemore than they needed) still 3 acf staff. Training for the staff (those working only during theWE)November nutrition unit had now a special room: 18 beds. New head nurse who wasinterested by the nutritional unit good motivation try to improve the unit, 5 persons wereaffected to the unit. Improve the surveillance of the meal by gathering together the mothersgood impact.Problem with the fee really expensive mother left before to pay � meeting in perspectivewith the administrationJanuary implementation of the protocol sugar water/resomalFebruary only 1 acf staff in night shift 5 others staff involve work very well from theexpatriate nurse (the same as the previous year Feb-March 99). Just a Pb with theconsumption of milk need to have sometimes some close supervision to avoid tentation…
72
Give one antibiotic at the admission but they did not adjust in case of deterioration.Prescription did by nurse, needs to assess the drug distribution.RMQ:High rate of defaulters during week end.Problem with proposal for financial support. Lack of motivation for hospital staff, at thebeginning salary is not given on time or not entirely so behaviour less professional. Noincentive.Mixed with the paediatric ward till October whereas this point was discussed before thetransfer of the unit to the hospital which should had allocate a special room, postponed.No interest in the programme, without ACF staff hospital would have been able to cope witha nutrition unit.Reduction in criteria when overcrowded like in June/July.
BuchananDCC WWM opening date 6th mayClinic supported by World Wide Mission (based in capital)Expatriate nurse in charge was a first mission but she had well managed.March/April Plan to transfer 8 staff from TFC for 2 months training : 1 store keeper/ 1 HE/1 cook/ 1 nurse/ 4 NA. This latter in April were in charge of the 2 weeks training to theclinic staff.A shelter was build with cement floor and zinc sheet for a maximum capacity of 20 patients.EPI should be implemented after the MoH training for the vaccinator.Service will be free for feeding and systematic treatment except for special medical care(consultation 15ld =0.37$ us) which will be charge according to a price list.During the same period training on detection of malnutrition in 26 health centre andnutritional surveillance.May: On 15th Clinic allowed ACf to use 2 more rooms to cope with the increase number ofadmission 34 due to beginning raining season.End of the month remains 4 acf staff (3 per days) poor involvement of the WWC staff: lackof money, lack of staff support expected from WWM from middle of June.Misunderstanding from the Mou staff expected to receive incentive.Vaccination started on the 14thHalf of the admission came from the bush.July 15/07 end of the 2 months training by ACF staffs try to involve more in nutritionprogramme the wwm staff. 15 to 27th only under supervision of counterpart.New expatriate nurse for 2 monthsMaximum capacity 40 childDuring the firsts months regular meeting were hold between Acf and Clinic in order toevaluate the on going of the day care. End of July 7 persons were involved to run thefeeding centre: 4 NA, 1 Nurse, 1 cook and 1 storekeeper.August lack of medical staffs only one nurse, which is also working for the clinicconsultation.
73
Workshops in medical assessment, try to improve the monitoring in phase, milk calculation,detection of oedema, try to increase the level of the staffSeptember: 8 staff to run the dcc. New PA in transit so he did not receive any training anddid not follow advises.Nov 98 received no more support from ACF except expatriate supervision
74
KILBY TFC BUCHANANClosure dates 1st June 1998.For years of 97 rate of defaulter was 23.5% and for death 8.5 %.Nov 97 Transferred received nutritional feeding during hospitalisationDec 97: 13 Transfer to hospital 4 read/ 3 died /3 defaultJan 98 new expatriate nurseFeb 98 death occurs most of them in P1 staff postpone the transfer due to the poor medicalcare in the reference hospital. Approach Clinic for sustainability of the programme.March 98: Workshop on Antibiotic to avoid abusive prescription of metronidazolechloremphinicolApril 98: from the new admission 62% came from the town.Problem with the hospital which charge the double of the normal price.May 98: keep only Phase 2 and phase 3 discharge on 25th (64 disch 8 out the criteria butonly 2< 85%) from the 6th admission done in DCC with 8 acf staff. Discharge TB patientwith appropriate treatmentNews concerning the closure of the TFC impact on the number of defaulters TFCReduce criteria of discharge: W/H > 80% no oedema for 10 days.
The specific objectives of this nutritional program are :
* To build the capacities of Phebe hospital for treatment of severe malnutrition
- To introduce the recommended protocol for the management of severe malnutrition.
- To train the pediatric staff on malnutrition detection, treatment and follow-up.- To provide the specific food (milk F-100, F-75, ReSoMal...)to the hospital duringthe first fourth months of the program.
- To liase with UN agencies and donors to ensure a continuous supply of therapeuticmilk and food.
* To assist the medical authorities for the monitoring of the nutritional statusof the population, specially of the children under 5 years old.
- To train the clinics staff of the monitoring of malnutrition
- To assist district authorities in the definition of nutritional survey methodologies.
- To train the staff to conduct nutritional surveys.
- To assist in drawing of recommendations from surveys and in program definition.
77
INDEX
1. INTRODUCTION11. Learning objectives12. Presentation of Action Contre la Faim
2. TEST OF EVALUATION
3. MEASURING AND MONITORING THE GROWTH OF CHILDREN
4. NUTRITION41. Definitions42. Which food do we eat ?43. What is a normal diet?44. Breast-feeding45. Weaning food
5. MALNUTRITION51. Causes of malnutrition52. Different types of malnutrition
6. DIFFERENT STEPS OF MALNUTRITION61. Anthropometric measures62. Criterias of admission for TFC (severe malnutrition)63. Criterias of admission for dry ration (moderate malnutrition)
7. ANATOMICAL AND FUNCTIONAL CONSEQUENCES OF SEVEREMALNUTRITION
71. organs functions72. Changes to body composition73. Severe dehydration and septic shock74. Infections75. Dermatosis of kwashiorkor
8 . TREATMENT OF SEVERE MALNUTRITION81. Phase I82. Phase II83. Nutritional products84. Emotional and physical stimulation85. Failure to respond to treatment86. Evaluation of the center
9. FOLLOW-UP OF THE SEVERE MALNUTRITION91. The day of discharge92. One week after93. Two weeks after the first visit94. One month after the second visit
10. MANAGEMENT OF NUTRITIONAL CENTER10.1 Sanitation and hygiene10.2 Participation of the mothers
11. HEALTH EDUCATION11.1 Nutritional education
78
11.2 Food demonstration11.3 Health education according the phase.
79
8 TREATMENT OF SEVERE MALNUTRITION
81. PHASE 1
When first seen, the child with severe malnutrition is often a medical emergency.Recently admitted, children should be kept in special area in order to be constantly monitored.
The child should not be kept near a window or in a draft, he should be properlycovered with clothes and blankets. Washing should be done during the day, and after he mustbe dried immediately and carefully.
* Principal tasks during initial treatment :- treat or prevent hypoglycemia and hypothermia- treat or prevent dehydration and restore electrolyte balance- treat incipient or fully developed septic shock, if present- start to feed the child- identify and treat the other problems (vitamin deficiency, anemia...)
ADMISSION
* Whilst the child is waiting for the first feed
- for marasmus and kwashiorkor with history of diarrhoea° ReSoMal 5ml / kg / hour
- for kwashiorkor with no diarrhoea° water 100 ml with 5 % sugar 5 ml / kg / hour
PHASE I
* Feeding protocol
- F-75 : 130 ml / 100 Kcal / kg / day 8 feeds per day
6 am - 9 am - 12 am - 3 pm - 6 pm - 9 pm - 12 pm - 3 am
* Systematic treatment
- Vitamin A : children < 1 year : 100.000 IU day 1 and 2 “ > 1 year : 200.000 IU day 1 and 2
- Folic Acid : 5 mg single dose on day of admission
- Systematic antibiotic : Amoxicillin 60 mg /kg/day divided in 3 doses( for all the days in phase 1) For severe cases ADD
Chloramphenicol 75 mg/kg/day divided in 3 doses
- Malaria prophylaxie : 10 mg/kg/ day (day 1 and 2)5 mg / kg / day (day 3)
* Immunisation
The clinic of those children that require this service all children to be vaccinatedon admission for measles
80
* Check up EVERY DAY
- Weight, oedema and calculation of percentage- Number of stool, vomiting, urine and temperature...- Calculation of the quantity of milk he has received- Quantity of milk taken- All these informations have to be reported on the chart
* Criterias to move into phase 2
- Marasmus : as soon as the appetite returns
- Kwashiorkor : as soon as the oedema starts to decrease
* Length of stay in phase 1 :
From 1 to 7 days. The average is 4 days. If the length of stay is above 10 days that is meansthat there is a failure of the nutritional treatment and we have to find out the reason.
82. Phase 2
Phase 2 is the rehabilitation phase.Transition to the rehabilitation phase involves increasing the amount of diet given at
each feed. The amount of each feed offered and taken should be recorded on the feeding chartand any food taken should be discarded. Never reuse it for the next feed. It is appropriate tointroduce semi-solid food. CSB porridge
- Principal tasks during Phase 2 :
° encourage the child to eat as much as possible
° stimulate emotional and physical development
81
PHASE II
* Feeding protocol
F-100 : 200 ml/Kcal/kg/day 6 feedsIf the child finish his feed give more
° Mebendazole : < 1 year Nil 1- 2 year 250 mg single dose (on day 1 in phase 2) > 2 years 200 mg / day for 3 days
° Ferrous sulfate : 15 mg / kg / day (each day) 200 mg in 2 liters in the milk
° Vitamin A : < 1 year : 100.000 IU ) 3 rd dose before> 1 year : 200.000 IU ) discharge
° Systematic antibiotic : Amoxicillin 60 mg / kg / day divided in 3 doses for the first fourth days in phase 2
° Malaria prophylaxie : 5 mg / kg / week
* Check up EVERY 2 DAYS
- Weight,oedema and calculation of percentage- Number of stool, vomiting, urine and temperature...- Calculation of the quantity of milk he has received- Quantity of milk taken- All these informations have to be reported on the chart
* Immunisation :
Before discharging the child : Re-give a second dose of measles vaccine
* Criterias of discharged
- W/H >= 85 % in two consecutive measurementsand/or - Absence of oedema 15 days after the beginning of loss of oedema
after 2 consecutive measurements- MUAC >= 120 mm
82
83. Nutritional products
* F-75
Therapeutic milk phase 1. This milk is suited for the first days of dietetic treatment of severemalnutrition.Attention, this milk is not intended to make the child gain weight. Its use should be restrictedto phase 1 of the treatment.
- Utilisation : Administer at the rate of 130 ml / kg / day in 8 meals As the caloric density is 75 Kcal for 100 ml
- Dilution : 1 sachet = 410 gAdd 2 liters of boiled water for 1 sachet in order to obtain 2,4 l of milk
- Nutritional value : For 1 liter :Kcal : 750Proteins : 9 gFats : 20,1 gCarbohydrates : 133,5 g
- Contents of the milk :° Vitamins : A, D, E, complex B, C, folic acid° Minerals : calcium, phosphorous, potassium, magnesium, zinc, copper, iron, iodine.
* F-100
We can used it in phase 1 : 100 ml / kg / day, for normal cases (children without seriousmedical problems)It’s therapeutique milk for phase 2.
- Utilisation : Administer at the rate of 200 ml / kg / day in 6 mealsAs the caloric density is 100 kcal for 100 ml
- Dilution : Add 2 liters of boiled water to 1 sachet in order to obtain 2,4 L of milk
- Nutritional value : For 1 liter of milkKcal : 1010Proteins : 28 gFats : 59 gCarbohydrates : 92 g
- Contents of the milk : This milk contains the same vitamins and mineral as F-75.
The special therapeutique milk (F-75, F-100) contents all vitamins and mineral needed, it isnot necessary to add them into the milk or to give them as treatment.
* RESOMAL (ORS NUTRISET)
It is a special product adapted for the treatment of DHA in case of severe malnutrition.
- Utilisation : 1 sachet contents 420 g. Add 10 liters of boiled water.
83
It may occur that the quantity to prepare is too important in comparison to the quantity ofpeople treated, in that way, you can prepare less quantity doing :
Severely malnourished children may have delayed mental and behavior developmentand they are perturbed, which is not taking care, can become the most serious long term resultof malnutrition. Emotional and physical stimulation through play programs that start duringrehabilitation and continue after discharge can substantially reduce the risk of permanentmental and emotional damage.
It is essential that the mother be with her child, and that she be encouraged to feed,hold, comfort and play with him as much as possible. Each adult should talk, smile and laughaffectionately with the child.Medical procedures, such as venipuncture should be done preferably out of earshot and sightof the other children. Immediately after any unpleasant procedure, the child should be heldand comforted.
Toys must be available in the child’s play area. Inexpensive toys, made fromcardboard boxes, plastic bottle, tin cans and similar materials are best because the motherscan copy them.
* Emotional stimulation and play
Care must be taken to avoid sensory deprivation. The child’s face must not becovered. He must be able to see and hear what is happening around him.
The malnourished child needs interaction with other children during rehabilitation.These activities do not increase appreciably the risk of cross-infection and the benefit for thechild is substantial.
Learning through play should be fun for the child. A child’s effort to achieve a taskshould always be praised and never criticized.
* Physical activity
Physical activity promotes the development of essential motor skills and may alsoenhance growth during rehabilitation. For immobile children, passive limb movements arehelpful. For mobile children, play should include such activities as rolling or tumbling on amattress, running after...
* Training the parents
Nearly all parents want to learn how to stop malnutrition from recurring. Before thechild is discharged, ensure that the parents understand the causes of malnutrition and how toprevent relapse, including correct feeding and continuing to stimulate the child’s mental andemotional development.
The staff must be friendly and treat the mothers as partners in the care of the children.Moreover, helping, teaching the mothers is an essential part of the long term treatment of thechild.
85. Failure to respond to treatment
84
When the treatment guidelines are followed, a severely malnourished child withoutcomplication should show definite improvement within a few days and should continue toimprove thereafter.A child who meets any of this criteria should be diagnosed as failure to respond to treatment :
Criterias Time after admission- Fails to regain appetite by day 4- Fails to start to lose oedema by day 4- Oedema still present by day 10- Fails to gain weight at more than by day 10
5 g / kg / day
The objective is to identify the cause for failure to respond and correct the problem bymaking specific changes in practice. The treatment should never be changed blindly.
The most frequent causes of failure to respond are :
* Problems with treatment facility
- Problems with preparing and giving food
° no good storage of the food° no respect of the hygiene during the preparing food° no respect of the milk dilution and recipe° mistake in the milk requirement calculation° no monitoring during the meals
- Inaccurate weighing machines :
° this give misleading information on the progress of the child. In order to avoid it,weighing machines must be checked and adjusted daily.
- when malnourished child is treated in pedriatic ward :
° risk of cross-infection is increased° difficulty to provide the special intensive care
* Medical problems
- feeding :
° pancreatic insufficiency and fat malabsorption
- Rumination :
Severe form of self-stimulation that occurs in up to 10 % of severely malnourished,emotionally impaired children. It should be suspected when a child eat well, but fails the gainof weight.
A ruminating child regurgitates food from the stomach into the mouth, and thenspits much of it out.A ruminating child usually thought to have vomiting without diarrhoea, because they oftensmell of vomit, and may have vomit-stained clothes or bedding.
This usually happens when the child is ignored. Ruminated is best treated by staffmembers who have experience with this problem and give special attention to the child. They
85
need to consistently show disapproval when the child begins to ruminate, without beingintimidation, and to encourage other less harmful behaviors.
- Infections :
Unrecognised infection is a frequent cause to failure to respond. Check carefully for infection.(HIV, hepatitis, TB, helminthiasis, dysenteria, malaria, otitis, pneumonia, urinary tractinfection, skin infection, oral candidiasis...)
86. Evaluation of the center
This evaluation is done by :
* The success rate : the number of children reaching criteria of discharged dividedby the number of children enrolled in the center.
* The mortality rate : the number of deaths in the center divided by the number ofchildren enrolled in the center.
* Evaluation of the gain of weight : This calculation estimate the quality of thetreatment that the children received.A child who does not gain at least 5 g / kg / day for any 3 days period is failing to respond totreatment With high energy feeding, most of the severely malnourished children reach 85 %W/H after 2 - 4 weeks.
Calculation of the gain of weight : normal rate is 10 to 15 gr / kg / day
Weight at discharge in grams - the lowest weight in gramsLowest weight in kilo x total of days after the lowest weight *
* Total of days = discharge day - day of the lowest weight.
9 . FOLLOW - UP OF THE SEVERE MALNOURISHED CHILDREN
Children who reached 85 % are discharged from the center. Even if we consider themas cured , such children are at risk of recurrence of malnutrition or of developing seriousillness. As the risk of relapse is greatest soon after discharge.In order to monitor their evolution and prevent any relapse, we refer them to a dry rationcenter for the follow-up after discharge.
91. The day of discharge
The child receive one dry ration of Premix (CSB, oil and sugar) for one week.
86
And the mother has to be informe about the nearest dry ration center, to carry her child thefollowing week. Each child referred for the follow-up must receive from the therapeutiquecenter an individual card.
92 . One week after
The child goes to the dry ration center for the screening (height, weight, MUAC and oedema).- Still >= 85 % : receive one dry ration and is told to come back in 2
weeks time
- Between 80 and 85 % : receive one dry ration and is told to come back every weekuntil he reaches 85 %
- < 80 % : Dry criteria
- < 70 % : TFC criteria
93 . Two weeks after the 1 St. visit
The child comes back for the screening and dry ration- Still >= 85 % receive one dry ration and is told to come back in month time
- Between 80 and 85 % receive one dry ration and is told to come back in week time. And he will come back every week until he reach 85 %.
- < 80 % : Dry criteria
- < 70 % TFC criteria
94 . One month after the 2nd visit
The child comes back for the screening and dry ration- Still >= 85 % receive one dry ration and is discharged from the follow up
- Between 80 and 85 % receive one dry ration and is told to come back in 1 weektime. He will come back every week until he reach 85 %, so
will start again the normal follow-up and come back 2 weekslater.
- < 80 % Dry criteria
- < 70 % TFC criteria
10. MANAGEMENT OF A NUTRITIONAL CENTER
10.1 Sanitation and hygiene
* Sanitation :
Twenty liters of water should be available per child per day.
87
Every body should wash their hands with chlorinated water after going to latrine, beforeeating, before preparing the meal.
* Hygiene :
The participation of the mother is essential. They are responsible of the cleaning of their areaand also for their children.
10.2 Participation of the mothers
The mother should be present at the nutritional area with her child as much aspossible. This may be facilitated by providing the mother meals.
The mother, in turn, should help to prepare her child’s food and feed and look afterher child.
A rotation of mothers may also be organised to help with general activities on theward, including playing, cooking, feeding, bathing and changing her child under supervision.Through this the mother learns how to care of her child home. She also feels she iscontributing to the work of the center.
Teaching the mothers should include regular sessions at which important parentingskills are demonstrated and practiced. Each mother should taught the play activities that areappropriate for her child, so she and others in the family can continue to make toys and playwith the child after discharge.
11 . HEALTH EDUCATION
A health worker’s most important job is to encourage sharing of knowledge, skills,experiences and ideas. But it depend on approach and welcome. Once the child is admitted inthe hospital, explain to the mother all treatment.
11.1 Nutritional education
Talk about locally available foods only in your center and let them to know the needs of foodfor the growth and development of their children.
Sometimes nutrition talks are very disappointing because of :
- economic obstacles- belief obstacles- taste and habit obstacles
11.2 Food demonstration
Let the mother prepare the food for their malnourished children themselves. With themothers, prepare some recipes with the right quantity and balance diet.Use food that are available in local market or grown in family gardens to make specimen andlater teach them how to prepare.
88
11.3 Health education according the phase
During the time that mothers stay in the center, the health educator can make healtheducation according the main problem.
* Phase 1
- Welcome and presentation and explanation about the nutrition center.- Cause of malnutrition- Objective of the treatment- How does the child take the milk
* Phase II
- Introduction of the porridge- Teaching of new recipe of porridge with local food- Health education about hygiene- Care to give to the child- Prepare the return at home