SewerSnort: A Drifting Sensor for In-situ Wastewater Collection System Gas Monitoring Jung Soo Lim, Jihyoung Kim, Jonathan Friedman † , Uichin Lee * Luiz Vieira ∓ , Diego Rosso ‡ , Mario Gerla, Mani B Srivastava † UCLA CS, UCLA EE † , KAIST KSE * Federal University of Minas Gerais ∓ , UCI CEE ‡ {jlim,jhkim,gerla}@cs.ucla.edu, [email protected]* , {jf,mbs}@ee.ucla.edu † , [email protected]∓ , [email protected]‡ Abstract—Biochemical reactions that occur in sewer pipes produce a considerable amount of hydrogen sulfide gas (H 2 S corrosive and poisonous), methane gas (CH 4 explosive and a major climate change contributor), carbon dioxide (CO 2 a major climate change contributor), and other volatile substances (collectively known as in-sewer gases). These toxic gases lead to contamination of natural environment, sewer pipe corrosion, costly operational expense, public safety issues, and legal disputes. In order to prevent biochemical reactions and to maintain healthy sewer pipes, frequent inspections are vital. Thus far, various schemes have been designed and developed to identify functional deficiencies in Wastewater Collection System (WCS). Neverthe- less, the current inspection techniques are not for mapping the sewer gas concentration. In addition, because of such a harsh and hazardous environment a comprehensive sewer gases inspection has been prohibitively expensive. In this paper we propose SewerSnort, a low cost, unmanned, fully automated in-sewer gas monitoring system. A sensor float is introduced at the upstream station and drifts down sewer pipeline, while the sensor float collects gas measurements along with location information of sampling points. At the end of the journey, the gas measurements are retrieved from the float and used to generate an accurate gases concentration profile to be used for maintenance or repair. The key innovations of Sewer- Snort are the fully automated, end-to-end monitoring solution and the low energy self localizing strategy. From the imple- mentation standpoint, the key enablers are the float mechanical design that fits the sewer constraints and the embedded sensor design that matches the float form factor and complies with the tight energy constraints. Experiments based on a dry land emulator demonstrate the feasibility of the SewerSnort concept, in particular, the localization technique and the embedded sensor design. I. I NTRODUCTION A Wastewater Collection System (WCS) collects and trans- ports wastewater generated from households and industries to treatment plants or disposal sites by means of a system of underground pipelines. During the transportation process a periodic inspection and maintenance of sewer pipe must be performed particularly for aging pipes reaching or past its life expectancy since WCS components are prone to damage from aging, excessive traffic, and biochemical reactions [6]. In addition, untreated sewer escaped from WCS through leaks or U. Lee is the corresponding author. overflow endangers public health by contaminating the source of drinking water and polluting natural environment [5]. Organic material transported by the sewer accumulates along the bottom (forming a sediment), and walls (forming a coating known as “bio-film”), of the pipeline. Due to anaerobic conditions, where insufficient electrons are available to accept ions, biochemical reactions that occur in these sediments and bio-film generates substantial amount of hydrogen sul- fide (H 2 S), methane (CH 4 ), and other volatile substances (collectively, in-sewer gases) [13]. Hydrogen sulfide, which is toxic and odorous gas, is a precursor to the formation of sulfuric acid (H 2 SO 4 ) which is corrosive to metal and concrete and noxious to human [48]. On the other hand, methane gas is highly flammable and forms explosive mixtures with air. Also, methane gas is an asphyxiant and may displace oxygen in an enclosed space [38]. In addition, there is growing consensus that sewage systems contribute a significant fraction of greenhouse gases (GHG) such as carbon dioxide (CO 2 ) and methane [34], [10]. Due to such an unfriendly and harsh environment di- rect sewer inspection and maintenance operations are life- threatening. A number of complicated and expensive indirect methods has developed in the past. For example, pipe leakage detection can be accomplished via the injection of smoke and fluorescent dyes [42], [33] or via remote inspection with cameras and sonar systems attached to tethered probes [42] or mobile robots [1]. Sewer flow monitoring can be achieved by installing flow meters at strategic locations so that the drainage system can be properly controlled to prevent or to minimize overflows [43]. Also, sediment control can be accomplished via localized flushing or chemical treatments [5]. While pipe damage detection and flow monitoring have been actively studied in both academia and industry, in-sewer gas monitoring has received little attention due to the difficulty of in-situ measurements and the relative lack of sensor in- stallations – mostly in treatment plants. Also, areas that are easily approached and instrumented are principally limited to manholes. However, manhole-based sensor readings are poor indicators of toxic gas concentration due to the fresh air flowing through the manhole (called the “chimney effect”). To fill the gap the United States Environmental Protection Agency
Transcript
SewerSnort: A Drifting Sensor for In-situWastewater Collection System Gas Monitoring
Jung Soo Lim, Jihyoung Kim, Jonathan Friedman†, Uichin Lee∗
Luiz Vieira∓, Diego Rosso‡, Mario Gerla, Mani B Srivastava†
Abstract—Biochemical reactions that occur in sewer pipesproduce a considerable amount of hydrogen sulfide gas (H2Scorrosive and poisonous), methane gas (CH4 explosive anda major climate change contributor), carbon dioxide (CO2 amajor climate change contributor), and other volatile substances(collectively known as in-sewer gases). These toxic gases leadto contamination of natural environment, sewer pipe corrosion,costly operational expense, public safety issues, and legal disputes.In order to prevent biochemical reactions and to maintain healthysewer pipes, frequent inspections are vital. Thus far, variousschemes have been designed and developed to identify functionaldeficiencies in Wastewater Collection System (WCS). Neverthe-less, the current inspection techniques are not for mapping thesewer gas concentration. In addition, because of such a harsh andhazardous environment a comprehensive sewer gases inspectionhas been prohibitively expensive.
In this paper we propose SewerSnort, a low cost, unmanned,fully automated in-sewer gas monitoring system. A sensor floatis introduced at the upstream station and drifts down sewerpipeline, while the sensor float collects gas measurements alongwith location information of sampling points. At the end of thejourney, the gas measurements are retrieved from the float andused to generate an accurate gases concentration profile to beused for maintenance or repair. The key innovations of Sewer-Snort are the fully automated, end-to-end monitoring solutionand the low energy self localizing strategy. From the imple-mentation standpoint, the key enablers are the float mechanicaldesign that fits the sewer constraints and the embedded sensordesign that matches the float form factor and complies withthe tight energy constraints. Experiments based on a dry landemulator demonstrate the feasibility of the SewerSnort concept,in particular, the localization technique and the embedded sensordesign.
I. INTRODUCTION
A Wastewater Collection System (WCS) collects and trans-ports wastewater generated from households and industriesto treatment plants or disposal sites by means of a systemof underground pipelines. During the transportation processa periodic inspection and maintenance of sewer pipe mustbe performed particularly for aging pipes reaching or past itslife expectancy since WCS components are prone to damagefrom aging, excessive traffic, and biochemical reactions [6]. Inaddition, untreated sewer escaped from WCS through leaks or
U. Lee is the corresponding author.
overflow endangers public health by contaminating the sourceof drinking water and polluting natural environment [5].
Organic material transported by the sewer accumulatesalong the bottom (forming a sediment), and walls (forming acoating known as “bio-film”), of the pipeline. Due to anaerobicconditions, where insufficient electrons are available to acceptions, biochemical reactions that occur in these sedimentsand bio-film generates substantial amount of hydrogen sul-fide (H2S), methane (CH4), and other volatile substances(collectively, in-sewer gases) [13]. Hydrogen sulfide, whichis toxic and odorous gas, is a precursor to the formationof sulfuric acid (H2SO4) which is corrosive to metal andconcrete and noxious to human [48]. On the other hand,methane gas is highly flammable and forms explosive mixtureswith air. Also, methane gas is an asphyxiant and may displaceoxygen in an enclosed space [38]. In addition, there is growingconsensus that sewage systems contribute a significant fractionof greenhouse gases (GHG) such as carbon dioxide (CO2) andmethane [34], [10].
Due to such an unfriendly and harsh environment di-rect sewer inspection and maintenance operations are life-threatening. A number of complicated and expensive indirectmethods has developed in the past. For example, pipe leakagedetection can be accomplished via the injection of smokeand fluorescent dyes [42], [33] or via remote inspection withcameras and sonar systems attached to tethered probes [42] ormobile robots [1]. Sewer flow monitoring can be achieved byinstalling flow meters at strategic locations so that the drainagesystem can be properly controlled to prevent or to minimizeoverflows [43]. Also, sediment control can be accomplishedvia localized flushing or chemical treatments [5].
While pipe damage detection and flow monitoring have beenactively studied in both academia and industry, in-sewer gasmonitoring has received little attention due to the difficultyof in-situ measurements and the relative lack of sensor in-stallations – mostly in treatment plants. Also, areas that areeasily approached and instrumented are principally limitedto manholes. However, manhole-based sensor readings arepoor indicators of toxic gas concentration due to the fresh airflowing through the manhole (called the “chimney effect”). Tofill the gap the United States Environmental Protection Agency
(USEPA) recommends an analytical modeling to predict sed-iment buildups and gas concentrations [5]. Nonetheless, it isextremely difficult to model and fit a sewer system due tothe large spatio-temporal variability and the lack of legitimatedata. To this reason, a proper maintenance is not usuallyperformed, or rather sewer flushing is performed only whenodor complaints are received or legal disputes are occurredwhich results endangering public health and causing expensivelitigations [2].
Thus, there is a strong rationale for in-sewer gas monitor-ing especially when sewer gas is a key indicator of sewerconditions (sediment buildups, corrosion, and explosion) [13].Also, accurate and effective sewer gas monitoring can suggestareas for targeted supplemental study or corrective actions. Inaddition, the accurate information of toxic gases can reducethe occupational health and safety risks of personnel workingin sewer pipes. As in-sewer fiber optical cable installationsbecome prevalent, the safety issues become more of con-cern [49]. Moreover, researchers can have a better understand-ing in-sewer gas phases and can estimate accurate amount ofGHG production in sewers [34], [10].
In this paper, we design a low cost in-sewer gas monitoringsystem. The proposed system would allow frequent WCSinspection, comprehensive WCS sewer gas measurement, andearly detection of problems. In addition, the system allows tar-geting of accurate sewer flushing measure which substantiallyimproves service uptime, reduces the maintenance expense,enhances illegal toxic chemical dumping enforcement, reducesthe risks of contaminating the source of drinking water, andreduces the risks of polluting our natural environment.
To this end, we propose SewerSnort, a novel method involv-ing drifting sensors that monitor in-sewer gases. A SewerSnortnode is dispensed upstream of the WCS. It measures in-sewer gas concentrations while floating downstream and marksmeasurement readings along with their geographic location ob-tained from a set of beacons located beneath manholes. Uponthe completion of journey, a SewerSnort node is extractedat a wastewater treatment plant, pumping station, or sewermanhole. The data acquired by SewerSnort can be collectedthrough traditional public network infrastructure systems suchas municipal Wi-Fi, an emerging low-power high-availabilitymesh networking systems such as Streetline [40]. Additionally,the data in SewerSnort can be manually retrieved throughshort-range wireless communication upon retrieval since phys-ical contact with the probe once deployed in the sewer is notadvisable due to surface contamination and biohazard.
In this paper, we make the following contributions to thefield:• We show the feasibility of a mobile drifting sensor
by analyzing the sewer flow statistics and present thepotential applications of in-sewer gas monitoring.
• We design an “inner-tube” shaped hull to handle thelateral force that pushes the drifter to the side of thesewers (known as the bank suction effect).
• We present the first single-supply differential ratiometricdata acquisition architecture that targets electrochemical
Building sewers
(e.g., residential,
commercial, etc.)
Lateral sewers
(branch/collecting
sewers)
Main
sewer
Intercepting sewerTrunk sewerManholes
Fig. 1. Illustration of a sewer system
sensors for WCS monitoring applications. The designis implemented and evaluated. Controlled experimentsconfirm the accuracy of our gas sensor module.
• We propose a Received Signal Strength Indicator (RSSI)based localization scheme that provides meter-level ac-curacy in the underground GPS-denied sewer environ-ment. Over ground experiments based on a programmablemobile robot emulator confirm the viability of proposedmethod.
This paper significantly enhances our earlier work [17]as follows. First, we include the description of environmen-tal/health impact of sewer gas (Section II). Second, we pro-vide a detailed description of ratiometric siginal conditioning(Section IV). Third, we elaborate the enhancement scheme forlocation estimation using flow velocity and discuss a method ofhandling the case when a beacon is unreachable or failed (Sec-tion IV-C). Fourth, we analyze the storage space requirementof SewerSnort (Section IV-D). Fifth, we discuss mechanismsfor fault recovery using a convoy of drifters (Section IV-F).Finally, we present possible research directions such as driftermobility modeling and networked drifters (Section VII).
II. BACKGROUND
A. Wastewater Collection System
A Wastewater Collection System collects wastewater gen-erated from households or industries and transports them totreatment facilities or disposal sites. The system is categorizedas a separate sewer system or a combined sewer systemdepending on whether sanitary wastewater is separated fromstorm water. The separate sewer system has two wastewaterdrainage systems in parallel; i.e., a sanitary sewer dischargingwastewater to a wastewater treatment plant and a storm sewerdischarging storm water to a receiving water basin.1 Thecombined sewer system drains both sanitary and storm waterto a wastewater treatment plant. There are two types of sanitarysewers based on hydraulic characteristics and purposes: gravityand pressure sewers. The gravity sanitary sewers transportwastewater by gravity and are commonly used to collectwastewater from wastewater sources (residential, commercial,
1A receiving water basin denotes a stream or river that has water flowingin it, or a lake, pond, dugout, or slough that has water standing in it.
Wastewater
Atmosphere
Biofilm
(fermentation, sulfate
reduction)
Sediment/Biofilm
(fermentation, sulfate reduction,
methanogeenesis)
Suspended water
(fermentation)
Sewer wall
(sulfide oxidation and corrosion)Mass transfer
(emission/dissolution):
O2, H2S, CO2, CH4
Tra
nsfo
rmation o
f o
rganic
ma
tter,
nitro
gen a
nd s
ulfur
in b
ulk
wate
r,
bio
film
and
se
dim
ent
Hydrogen sulfide
Methane
Carbon dioxide
Ventilation
Fig. 2. Illustration of in-sewer processes
industrial sources). Gravity sewers are used when the naturalslopes are sufficient enough to convey a flow. The pressure orpumped sewer transports wastewater using pressure to collectwastewater from residential sources where the construction ofa gravity sewer is unsuitable (e.g., uphill slopes). It is alsopossible to use a combination of gravity and pressure sewers.
A typical separate sanitary collection system illustrated inFigure 1 is organized as follows:• Lateral sewers (also called branch or collecting sewers)
are used to collect wastewater from buildings (entrypoints) and convey it to the main sewer. They are usuallylocated underneath streets or utility easements.
• Main sewers are used to convey wastewater from lateralsewers to larger sewers (trunk or intercepting sewers).
• Trunk sewers are large sewers that are used to conveywastewater from main sewers to the treatment or disposalfacilities or to large intercepting sewers.
• Intercepting sewers are large sewers that are used tointercept a number of main and trunk sewers and conveywastewater to the treatment or disposal facilities.
• Manholes are used for sewer cleaning and inspection.They are located where the pipe system changes direction,grade, or diameter, at junctions, and, for small diametersewers (d < 1.2m) at intervals no greater than 120m.
B. In-sewer processes
In-sewer processes that occur during conveyance of wastew-ater are physical, chemical and biological in nature. Physicalprocesses are related to the build-ups and erosion of sewersediment. Chemical and physico-chemical processes occur dueto the gas transfer over the air-water interface (e.g., emission ofhydrogen sulfide) and the chemical oxidation and precipitationof sulfide. In biological processes, bacteria degrade organiccompounds, such as formaldehyde (CH2O), obtain carbon forcellular growth/reproduction and energy for cellular activity.As a result, wastewater compounds are transformed and thebiodegradability of the wastewater is changed.
As shown in Figure 2, in-sewer biological processes happen
in five phases [13]: suspended water, biofilm (slime layer), sed-iment, atmosphere, and the sewer wall. These phases interactand exchange relevant substances across the phase boundaries.An in-sewer bio-process will have different behavior based onmicrobial redox conditions: aerobic respiration when dissolvedoxygen is present, anoxic respiration when nitrate/nitrite ionsare present and anaerobic respiration when none of these (oxy-gen, nitrate/nitrite ions) are present.2 In Table I, we summarizedifferent redox conditions and relevant sewer gases generatedin various types of sewers. Aerobic/anoxic respiration pro-duces carbon dioxide, whereas anaerobic respiration generatesnumerous volatile substances that vaporize or evaporate atatmospheric pressure such as hydrogen sulfide (product ofsulfate reduction), carbon dioxide (product of fermentation),and methane (product of methanogenesis).
In particular, hydrogen sulfide diffused into a thin liquid filmon the sewer surface (see Figure 2) can be oxidized to sulfuricacid (H2SO4) by microbial reactions [13]. Then, sulfuric acidmay react with the alkaline cement (CaSO4) in the concretepipes causing corrosion.
Each of these in-sewer processes can be analytically mod-eled using differential equations [45], [50]. The models typi-cally consider various factors that influence reactions [45]. Forinstance, a sulfate reduction model takes the following factorsas inputs: quantity of sulfate, Chemical Oxygen Demand(COD), temperature, pH, area-to-volume ratio (i.e., biofilm andsediment), flow velocity, and anaerobic residence time [50].3
In practice, however, accurately fitting a model to in-sewerprocesses is greatly challenging, for the present approachesmake in-situ measurement extremely laborious and substantialdata collection must be performed to count and to under-stand the spatio-temporal variability of the underlying modelparameters while biological processes are correlated [45].Understanding the overall sewer reactions in sewers is achallenging area of active interest in the urban water researchcommunity. Note that the goal of this paper is not to accuratelyestimate the model parameters of in-sewer processes, but todirectly observe the behavior of various gas phases and topredict their potential impact on sewer maintenance and green-house-gas emission given the sewer structure.
C. Environmental and health impacts of sewer gas
High concentration of sewer gas is a warning signal ofsystem failure that initiates hazardous environments (i.e. en-dangering public health and contaminating our natural environ-ment). Sewer gas not only generates obnoxious malodors, butalso contains harmful toxic gases such as hydrogen sulfide andcarbon dioxide which endanger public safety. Moreover, byconsidering the growing consensus that sewer gas representsa significant fraction of GHG, the sewer gas substantially
2A microbial “respiration” process consists of two steps (called redoxprocess): oxidation of organic matter and reduction of an electron acceptor. Inother words, bacteria break down organic matter and transfer electrons fromthe electron donor (organic matter) to the relevant electron accepter (e.g.,oxygen, nitrate/nitrite ions, sulfate ions)
3Chemical Oxygen Demand (COD) is defined as the quantity of a specifiedoxidant that reacts with a sample under controlled conditions.
TABLE ISEWER GASES UNDER DIFFERENT REDOX CONDITIONS
pollutes our natural environment.4 However, the current effortto quantify GHG emissions from wastewater conveyance andtreatment industries has largely overlooked the sewers becauseof the lack of basic knowledge about sewer internal dynamicsand access limitations of the current sewer inspection technolo-gies. Especially when we consider the fact that a significantfraction of wastewater components nowadays (e.g., soaps,detergents) are petrochemical derivatives with definite impacton GHG, acquiring accurate gas concentration distributions insewer becomes more critical than ever before.
Up until now the current sewer models have been based onpunctual measurements of methane gas, with immense loss ofthe opportunity of measuring a suite of components throughoutthe sewer network. Thus, the proposed method to solve thisimportant environmental problem makes it feasible to probethe entire WCS and to overcome the limits of current sewergas emission models that rely only on punctual measurements.
III. SEWERSNORT SYSTEM OVERVIEW
A. System design requirements
Our main goal is to design an in-sewer gas monitoringsystem that considers the following requirements:• The system should be independent of pipe profile (mate-
rial, shape, or size). The most widely used image capturetechnologies such as Closed-Circuit Television (CCTV),Sewer Scanner and Evaluation Technology (SSET), andsonar only work with a limited set of the pipe materialsand shapes deployed in WCS’s [42].
• The system should be scalable. A large metropolitan citylike Los Angeles has a WCS composed of over 12,000km of pipelines [28].
• The system should be able to access the entire extentof the WCS. All current physical assessment methods arelimited to a comparatively small travel distance from theiraccess point into the WCS.
• The system should be fielded with reasonable cost suchthat the deployment, maintenance, and operational ex-penses allow for near continual redeployment. At present,CCTV inspection costs $2.26/foot and SSET inspectioncosts $3.47/foot. For the city of Los Angeles it couldcost upwards of $12.7 million USD to perform a singlecomprehensive inspection. A reduction of at least two
4According to New York Mayor’s report in 2007, 17% of GHG emissionwas caused by sewer [26]
Sewer flow
Beacon
manhole
Beacon
manhole
SewerSnort
Drifting Sensor
Fig. 3. SewerSnort monitoring scenario
orders of magnitude for an entire year of deployments isdesired [31].
B. SewerSnort: Gas monitoring using drifting sensorsWe propose SewerSnort, a drifting sensor which monitors
in-sewer gases (Figure 3). Knowing that small sewers aretypically under the aerobic redox condition and do not producegases of interest (hydrogen sulfide and methane), we mainlyprovide inspection coverage to main, trunk, and interceptingsewers of WCS. During the deployment, SewerSnort dis-pensers are deployed at strategic locations by analyzing thesewer map and inspection demands. The strategic points aretypically located at an entry point to the sewer. SewerSnortdispensing schedule can be configured based on the applicationscenario. For instance, if engineers want to understand how in-sewer gas level changes over time, they can dispense driftersat regular intervals for continual sampling.
Once a drifter is deployed, we need to keep track of itsposition. Since the Global Positioning System (GPS) transmitssignals from very high altitudes using only 50W transmittersby microwave-frequency carriers, the GPS signal does notreadily penetrate the ground. Thus, we propose a GPS-free lo-calization scheme by exploiting beacons and Received SignalStrength Indicator (RSSI). First, preprogrammed beacons areinstalled under sewer manholes in the region of interest. Then,beacons broadcast messages which include their physicallocations and time-stamps by pre-determined interval. Second,a SewerSnort listens to the beacons and collects RSSI valuesfrom received beacon messages, when traversing down pipes.Then, a SewerSnort estimates its proximity based on beaconmessages and the strength of their respective signals (via off-line processing).
The main advantage of sewer drifters is their immunity topipe profile. It is neither sensitive to the materials nor depen-dent on the shape of a sewer pipe. Yet, they compare favorably
Floating Inner Tube
802.15.4Gas Sensor
Micro Controller
Flash Memory
Fig. 4. SewerSnort drifter design. The size of a tube can be adjusted basedon the size of pipe
in other metrics as well. Conventional robotic systems arebulky, heavy, and require sufficient flow rate, external power,or internal power generation [24]. SewerSnort drifters aresmall, light, and battery-operated (e.g., < 30cm in diameter,and < 0.5kg in weight) and can operate during low flow rateconditions.
C. Feasibility of drifting sensors in sewers
The fluid flow in a pipe is classified as either laminar (astable and streamlined flow) or turbulent (a highly irregularand random motion). To determine the type of flow weuse its Reynolds number, i.e., Re = ρυδ/γ where ρ is thefluid density, υ is the fluid velocity, δ is geometrical lengthassociated with flow, and γ is the viscosity that characterizesthe degree of internal frictions in the fluid.
We consider the sewer flow to be laminar based on thefollowing facts. First, sewers contain a high concentration ofsuspended solids which create great internal frictions and de-crease the flow velocity. The concentration of suspended solidsin a sewer has not been systematically measured. However,approximately 100 milligram per liter (mg/l) of suspendedsolids exists in the effluent after the primary treatment in thewastewater treatment plant, while the tap water contains lessthan 1 mg/l [46]. Second, the gravity slope of most pipelinesis rather mild to control the flow velocity, thus preventingsewer erosion. For instance, the sewer design manual ofBureau of Engineering at Los Angeles specifies 0.003 radian(or 0.1719 ) for the pipe slope [37]. Third, concrete, whichcreates relatively more internal friction than copper, plastic oriron, is the most widely used material for sewer pipelines [5].According to the Nikuradse’s definition of mean height ofroughness; copper and glass are 0.003, iron is 0.15, plasticis 0.03, and concrete is 6.0. Here, the larger the number, thehigher is the roughness of surface. Thus, the sewer flow canbe classified as laminar; in other words, it is steady and stableenough not to significantly affect in-situ gas measurement.
IV. SEWERSNORT SYSTEM DESIGN
A. Hull design
When a surface vessel moves through a constricted water-way, the current velocity gradient pushes the craft toward thenearest bank ultimately resulting in a collision. Our drifter willsuffer from this phenomenon, known as the “bank suction”
Fig. 5. A simplified schematic of the electrochecmical gas sensor and analogsignal conditioning elements. This differential ratiometric approach consumes< 15µW in our current implementation. Electromagnetic compatibilityelements are not shown for clarity.
MicaZ mote
SewerSnort H2S
Sensor BoardRAE H2S
Gas Sensor
Fig. 6. The SewerSnort gas sensor board with a MicaZ mote
effect [7]. As our drifter approaches the sewer wall the waterchannel size reduces and in turn increases the velocity of thewater on that side. The asymmetric flow around the driftercauses pressure differences. As a result, a lateral force willpush the drifter to the side of the pipeline. The drifter willbounce against the wall as it lacks any on-board motioncontrol. We propose an inner tube hull that can roll alongthe pipeline sidewall (Figure 4). The sensing unit is placedin the middle of the inner tube to prevent wastewater fromsubmerging it and the hull is tall enough to sustain the sensorabove waterline in the event high turbulence capsizes thedrifter.
B. Gas sensing unit
1) Electrochemical Gas Detection: Electrochemical sensorsdetect a particular Gas Of Interest (GOI) by reacting with itand producing an electrical current proportional to the gasconcentration. This current is developed between the sensor’sanode and cathode electrodes (Figure 5) as one is oxidizedand the other reduced. The exact chemistry is specific to theconstruction of the sensor and the GOI. In the following, wefocus on hydrogen sulfide gas sensing, as it is one of the keysewer condition indicators.
Our SewerSnort drifters are equipped with an RAE 032-0102-000 electrochemical sensor element [32] and a customAnalog Front End (AFE) that provides bias and signal con-ditioning functions. The oxidation reaction that takes place atthe anode is:
H2S + 4H2O → H2SO4 + 8H+ + 8e− (1)
Note that the inputs include water. It is provided insidethe sensor as an electrolyte into which the electrodes are
immersed and sealed in by a gas-permeable hydrophobicmembrane (Figure 5). Besides sealing in the electrolyte (wateris repelled from the membrane – hydrophobia) and offeringmechanical protection to the sensor, the membrane performsthe additional function of filtering out unwanted particulates.A scrubber filter of activated charcoal is installed in front ofthe membrane to further enhance the sensor’s selectivity (thesensor’s preference for the GOI over other look-alike gasses).
These internal design choices reflect a fundamental tradeoffbetween the selectivity (ability to target just the GOI – allowfewer molecules in) and the sensitivity (encourage as muchreaction as possible – allow more molecules in) of the sensor.Given that the detection reactions are basic public chemistry,the design of the capillary, choice of the filter material, and theshape of the electrodes are the most important differentiatingelements among commercial vendors and, correspondingly,these are the design aspects most heavily patented. Carefulattention should be paid to application requirements whenselecting a vendor. With SewerSnort we chose an element withvery high selectivity and moderate sensitivity.5
2) Power Concerns: It is important to have a stable andconstant voltage at the anode electrode (w.r.t. the cathode),because, unaided, the voltage will fluctuate as the reactiontaking place on its surface is continuously introducing mobilecharges. These fluctuations void the calibration curve as thevoltage changes in the electrolyte correspond to energy storageinstead of a conversion to an electrical current which may besensed. However, the SewerSnort drifters are battery-poweredand must remain small, light, and inexpensive – precludingthe use of large battery packs. Although, the use of modernSwitch-Mode Power Supplies (SMPS) can achieve near 90%efficiencies, a SMPS must operate continuously to maintainthe regulated output voltage conditioning the electrodes. Giventhat the SewerSnort drifter must travel an enormous distance(compared to its own dimensions) and do so at slow speeds(due to low flow rate), it will take measurements at a very lowsample rate. During the inter-sample interval, the sensor elec-tronics will be idle, and minimizing power consumed in this“sleep” state is substantially more important than minimizingactive sampling power. This presents the drifter design with adifficult tradeoff: Regulate the sensor power supply to stabilizethe operating conditions and hence ensure the accuracy of thesensor’s calibration, but risk battery exhaustion, or allow thevoltage to drift, empower data collection over the entire trip,but compromise the sensor calibration and, therefore, collectpotentially meaningless data.
3) Ratiometric Signal Conditioning: In this work we ex-plore an alternative that proffers to circumvent the conflictbetween calibration accuracy and power consumption and inthe process present the first single-supply differential ratio-metric data acquisition architecture that targets electrochemicalsensors for WCS monitoring applications. To maintain the sen-sor’s calibration curve the sensor must experience a nominal
5The data sheet of RAE 032-0102-000 [32] reports that it is highly selectiveagainst carbon monoxide, nitric oxide, hydrogen, etc.
0V bias condition (Vanode = Vcathode for Ielectrolyte = 0and the amplifier must have sufficient dynamic-range (headroom) to handle the increasing voltage of the amplified output.To meet these two conditions without the use of a powersupply, we connect the amplifiers directly to the battery ina single-sided configuration (no negative voltage provided).An intermediate reference voltage is generated that is anarithmetic ratio of the battery voltage (in our implementationwe used a ratio of 1
2 ). This ratiometric reference potential isrouted to both the transconductance amplifier responsible forsinking current from the cathode and the feedback amplifierresponsible for driving the anode. As both terminals of thesensor are biased by the same potential, absent charge injectionfrom a reaction (no GOI present), the 0V condition is achieved.As the battery voltage decreases over its cycle life, thereference voltage decreases as well preserving the amplifiershead room.
4) Implementing Signal Conditioning: Series resistors R1
and R2 form a voltage divider delivering R2R1+R2
percent ofthe battery’s native voltage to the voltage-follower amplifierU1. The choice of values for R1 and R2 are controlled toachieve two objectives – minimize quiescent power and obtainthe desired divider output voltage.
Achieving the former requires the use of large valuedresistors which are limited only by the constraint:
Vbattery,max
R1 + R2À IU1,bias (e.g. > 10 IU1,bias) (2)
where Vbattery,max is the battery voltage when fully chargedand IU1,bias is the input bias current of the U1 amplifier.Due to the mass trasport requirements (diffusion, limitedaperature, catalytic conversion) inherent in electrochemicalsensing, its transient performance is rather poor. For thechosen sensing element, the 10-90 response time is 30 seconds[32]. At this bandwidth, low-frequency, low-bias, operationalamplifiers with Junction Field Effect Transistor (JFET) basedinput architectures are ideally suited. [22] from MicrochipCorporation is an example of this type of amplifier. Over theindustrial temperature range its input bias current requirementis a mere 0.1nA. Accordingly equation 2 indicates that R1+R2
could be as large as 300 Gigaohm when supplied from a 3 Voltbattery. However, as resistance increases its Johnson thermalnoise component increases as well. For a 300 Gigaohm resistorthis translates into a 22.5uV offset at 0.1Hz of bandwidth,but to achieve this performance the signal must be sampledcontiuously over the 100ms period. Microcontroller-basedcomputer systems consume active power in the order of tensof milliwatts so supporting shorter sampling aperatures byincreased sampling bandwidth requires the use of a smallerresistance to offset the increase in thermal noise from theincrease in frequency. In our implementation we chose 10Megaohm values as a good compromise.
The second design goal, orthogonal to the first, is to create avoltage somewhere in between the battery and ground. Giventhe known polarity of the redox reaction in the sensor cell,the AFE need not be equally adept at handling both positive
and negative sensor voltage deviations. Electrons are generatedat the anode and travel to the cathode. Due to the differencein convention between physicists and engineers, electron flowinto a terminal will counter-intuitively raise the voltage ofthat terminal. However, the amplifiers, not being provideda negative voltage source, perform best when the signal isbetween its two power supply Voltages. In this case, thatis equal to one-half of the battery’s voltage and choosingR1 = R2 ensures this condition is realized and maintainedduring operation.
As the sensor operates, the voltage at the cathode increases,but the anode may fluctuate as well (as previously discussed).Amplifier U3 provides a Reference-Anode feedback drive toensure that despite U1 providing a positive voltage 1
2 thebattery’s, from the sensor’s perspective the potential difference(voltage) anode-to-cathode is effectively 0. This bias conditionis necessary to preserve the sensor by not artificially inducingthe redox reaction. U2 functions as a current mirror with a1000-fold gain. These values were chosen in a manner similarto selecting R1 and R2 – by balancing similar noise floorconstraints.
C. Localization
We build a radio-frequency (RF) based system to locateand to track a drifter. RF based localization has been widelyused for indoor positioning via triangulation using measuredsignal strengths from multiple beacons [3], [21]. We can useeither an empirically measured signal strength map [3], [21]or a theoretical model that captures signal attenuation overdistance [3], [29]. Recent measurement studies by Howitt etal. proposed a radio wave propagation model for concretestorm drain pipes in 2.4 - 2.5GHz frequency band [11]. Byusing this model we estimate the location of the drifter insidethe sewers. Unlike previous methods of “online” locationtracking methods [3], [21], [29], we perform “off-line” signalprocessing on the measured signal strength samples to betterestimate the trajectory of a drifter.
1) RSSI-based SewerSnort localization: To define a geospa-tial coordinate system RF beacons are embedded beneathmanholes in the area of interest. The beacons broadcast theiridentity (i.e. geo-tag) periodically, which corresponds to a spe-cific physical location.6 Aboard a drifter the beacon messageis heard and decoded to determine the beacon’s identity whilethe average signal envelope power – the RSSI – is measured.
The relationship between RSSI and inter-radio distance maybe approximated by the radio wave propagation model forconcrete storm drain pipes as [11]:
RSSI(d)rx = Ptx − α(a,σ) × d−ACL (3)
where RSSI(d)rx is the received power at distance d,Ptx is the transmitted power in dB, α(a,σ) is the multimode
6Numerous techniques for low power medium access control exist andcould be leveraged to reduce battery drain. These include supplemental “wake-up” RF circuitry [30] and low-power ultra-low drift clocking systems [36] tosupport extremely low duty-cycle time-division protocols [35]
B
A: actual distance
d1
d2
d: measured
distanceSewer flow
B
Beacon
R
Fig. 7. Distance estimation in sewers
attenuation loss (dB/m) which is dependent on radius (a) andconductivity (σ) of a concrete pipe, and ACL is the antennacoupling loss given in dB. A value of ACL changes based ona position of a beacon inside a pipe [11]. For example, if adrifter is located at the bottom of pipe , the value of ACL,when a beacon is located in the center of pipe, is smaller thanthe value of ACL, when a beacon is located on the top ceilingof pipe. Hence, by anchoring positions of beacons on the topof pipes, it is possible to calculate the depth of the water if weknow the value of ACL of the pipe. Also,the value of ACL andα(a,σ) are depending on the radius (a) and conductivity (σ)of the concrete pipe and these values are empirically derivedfrom multiple experiments [11].
We want to find the distance A for SewerSnort localizationas illustrated in Figure 7. Knowing the radius of a pipe (R), weneed to find d1, d2, and B to calculate A. Also, as explainedin section IV, bank suction may drift a SewerSnort to thewall of pipeline. Thus, we assume d1 = 0; i.e., (d2−d1)
2 =d22 . Then, the current flow level (2R − B) can be estimated,
when the drifter passes by the beacon, which can be detectedby tracking the changes of RSSI (i.e., maximum point); i.e.,B = R +
√R2 − (d2
2 )2. The distance A can be estimated as:
A =√
(d2 − (d22 )2)−B2.
2) De-noising RSSI samples: A de-noising process mustbe done beforehand to apply the channel model in a realworld. Although destructive/constructive reflections have asmall impact on measured RSSI values when there exists adominant LOS [19], they cause rapid fluctuation. To de-noisethe raw RSSI data we choose to use the Empirical ModeDecomposition (EMD) [12]. The EMD effectively filters outnoise from the non-stationary time series signals such as RSSIdata in SewerSnort.
Briefly, EMD is a data-driven signal processing technique.EMD decomposes signals into n empirical modes first andproduces the residue which is the mean trend or constants.EMD algorithm is comprised of successive steps as follows:
1) Identify all local maxima and local minima.2) Connect all local maxima using a cubic spline line as
an upper envelope.3) Repeat step 2) for all local minima as a lower envelope.4) Compute the mean as m(t) = Emax(t)+Emin(t)
2 .5) Extract the local detail h1 as h(t)1 = X(t)−m(t) where
X(t) is a RSSI data at time t.6) Repeat step 1–5 by treating the local detail hi from
the previous sifting as the raw data until h(t)m =
h(t)m−1−m(t)m. For example, h1, the detail obtainedafter the first sifting, becomes data for the second siftingas h(t)2 = h(t)1 −m(t)2.
7) Then, the intrinsic mode function component of the databecomes C(t) = h(t)m. C(t) is a de-noised signal attime t.
3) Enhancement of location estimation assisted by flowvelocity: The location of a drifter can be estimated using Equa-tion (3) and the de-noised RSSI data. However, the dynamicnature of signal propagation inside the pipe under mobileenvironments can influence the accuracy of de-noised RSSIdata as we have seen in our experiments (Section V). Underthis circumstance, such a direct mapping can produce abruptjumps and reverse of directions which results in high errors.Knowing that the sewer flow is laminar and exhibits spatio-temporal coherence as illustrated in the feasibility analysissection, abrupt changes of drifter proximity are not likely tohappen in practice. On the basis of such characteristics, wepropose to utilize the flow velocity in addition to Equation (3)and the de-noised RSSI data to improve the accuracy. Also, weexploit the fact that the RSSI values peak right below beaconnodes and manhole’s locations are known. Thus, whenevera peak is detected, localization error can be corrected, andlocation estimation restarts from the beacon node’s location.
A drifter’s location estimates can be improved using flowvelocity as follows. For a given beacon node, we first de-noisethe measured RSSI samples. From de-noise data, we find thepeak and use the beacon’s location as a departure position.Assuming that the drifter has travelled at a constant velocityV , we substitute the distance d in Equation (3) with V t wheret is time, i.e., RSSI(V t)rx = Ptx−α(a,σ)×V t−ACL. Recallthat all the variables in Equation (3) except the velocity V areknown. Thus, we can find the velocity V that minimizes thesum of square errors between the modified model and the de-noised RSSI data.
In the event that a drifter has received RF signals from twoadjacent beacon nodes while drifting (denoted as A and B),we have two different velocity estimates (VA: moving awayfrom A, and VB : approaching to B). Since error is minimizedright below a beacon node, both speeds are used to estimatelocations as follows: from A, VA is used for tA unit times (Ato B), and from B, VB is used for tB unit times (B to A). Saythe distance between A and B is dAB and drifting durationis tAB , then, the following conditions must be satisfied toproperly align estimated location from both directions: (1)VAtA + VBtB = dAB and (2) tA + tB = tAB . Hence, wehave tA = dAB−vAtAB
VB−VA, and tB = vBtAB−dAB
VB−VA. However, note
that there is a sudden speed change in this scheme (say aftertA unit times).
For a given pipe, parameters in Equation (3) such asα(a,σ) and ACL are affected by the changes of water depth.Calibrating these model parameters under a set of differentwater depths is greatly laborious task when there is a sewerflow. An alternative is to estimate the average speed betweentwo beacon nodes, namely dAB/tAB . In this case, there isno sudden change of speed within a pipe segment formed by
these consecutive beacons (e.g., A and B), yet can result inhigher errors compared to the previous approach. Nonetheless,this approach can be very useful for handling the case whenthe distance between two consecutive manholes is too far toreceive beacon messages or an intermediate beacon fails.7
D. Data Acquisition
The acquired data can be packed and stored onboard all theway through the journey and collected after it is retracted.Even though the amount of data, with high sampling fre-quency, will grow rapidly, the required storage can be reducedsignificantly by compressing and storing the difference fromthe previous value.
First, we summarize the approximate storage requirementsfor the acquired data before the compression as listed in TableII. Then, we can compress data by taking their characteristicsinto account.
TABLE IITHE APPROXIMATE STORAGE REQUIREMENTS
Type Data sizeH2S gas 2 bytesTotal (sample data) 2 bytesGeoTag 2 bytesTimestamp 4 bytesSignal strength (RSSIval) 1 byteTotal (beacon) 7 bytes
Since, the sensor measurements are collected totally asyn-chronously from the beacon sensing, we account the storagerequirement as
Storage = (2bytes ∗ f) + (7bytes ∗ I), (4)
where f is sampling frequency and I is beacon interval. Forexample, if f = 1 sample/500 ms8 and I = 1 beacon/1s, wecollect 39,600 bytes/hr = 14,400 (sampling) bytes/hr + 25,200(beacon message) bytes/hr. In general, 24 hours is sufficientfor a drifter to travel from upstream to a wastewater treatmentplant [42]. Thus, a drifter may collect up to 1MB for the entiretrip. However, the required storage can be reduced significantlyby compressing data and storing a difference from the previousvalue.
For example, considering the fact that the range of H2Sgas real-world sample data is no greater than 100 ppm andthe environment does not change drastically from one regionto the right next [4], we can use delta-compression. Since deltabetween two consecutive samples can be stored in one byte,
7In practice, we do not anticipate an extended unreachable distance,because the average distance between sewer manholes is 71.93m [27] and thetransmission range of 802.15.4 radio is 30m indoor and 70m outdoor [51].
8In general, the sewer flow velocity is approximately 0.2m/s - 1m/s. Thus,the sampling frequency of 500 ms provides a reading for every 10 cm - 50cm, and this is sufficient for “Meter” type accuracy. Since factual travelingpath of SewerSnort may unprecedented, this velocity does not account for thenonlinear traveling path of SewerSnort.
we can truncate meaningless leading 8 bits without loss ofinformation. Thus, we can reduce the storage requirementsfor sample data by half. Also, a beacon message can beextensively compressed by considering the fact that GeoTagis sequential and timestamp has small delta between adjacenttimestamps. Thus, we can truncate leading 8 bits from a deltaof GeoTag and leading 24 bits from a delta of timestampwithout losing data. Consequently, a beacon message can becompressed into 3 bytes. After compressed the data, we have18,000 bytes/hr = 7,200 (sampling) bytes/hr + 10,800 (beaconmessage) bytes/hr and 432KB in 24 hours.
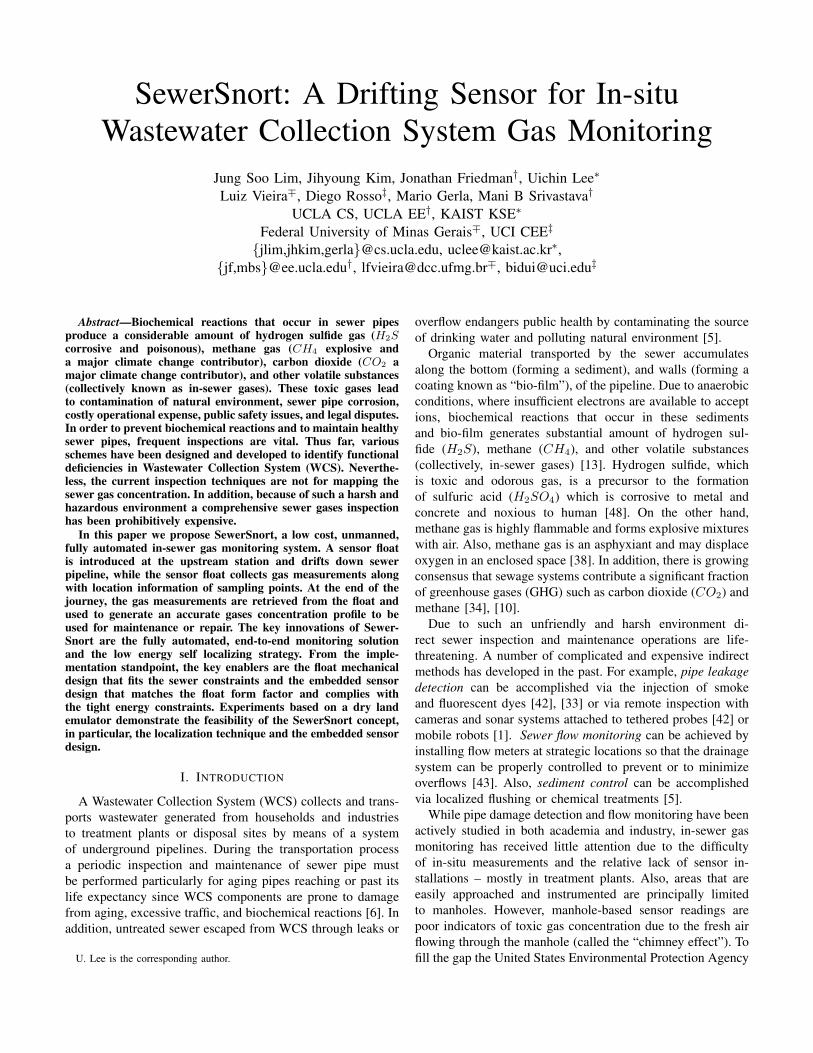
Although, a drifter can carry all acquired data to thedestination, we may upload a portion of data to a base stationfor an emergency. When a drifter uploads data, the energy costcan be estimated as
Etotal = Etx ∗ (Mbits + Headers), (5)
where Etx is energy required to transmit one bit, and Mis total bits to be uploaded. For example, if 2KB (payload2,048 * 8 bits + UDP Header 64 bits + IP Header 160 bits+ 802.15.4 header 112 bits) are uploaded, we would depleteapproximately 76.5mAs and free 2,048 bytes in flash memoryassuming that there is no retransmission and we spend 5mJ/bitto upload while 1µJ/byte to read/write flash memory usingIEEE 802.15.4 and MICAz flash memory [51]. Depending onthe urgency and on the amount of data to be uploaded, wemay equip a drifter with additional batteries.
Gateway
GSM/802.11
Lamppost
sidewalksidewalkpavementmanhole
gateway
beacon
802.15.4
802.15.4
802.15.4
Lamppost
manhole cover
SewerSnort
pavement
Fig. 8. Illustration of gateway/base station
Fig. 9. Images of manhole cover
E. Emergency notification
Wastewater collection systems are buried underground andthey are not noticeable until a system failure occurs. Althoughmost of system failures are caused by aging infrastructure,malicious attacks such as terrorism or sabotage can resultcatastrophic disaster. The disastrous series of sewer gas ex-plosions in Guadalajara, Mexico on Wednesday, April 22,1992, which caused death of 206 people and left almostunrecoverable damages to the city [44], demonstrates thepotential impact of terrorist attack using underground sewerlines.
To deliver prompt alarms in case of emergency spills, fraud-ulent dumps, or astronomical explosive gas concentration,SewerSnort may upload collected data to base stations on astreet level while traversing WCS before it reaches to thedestination. As illustrated in Figure 8, urgent data can betransmitted to a beacon node installed under a manhole cover.Then, the beacon node can relay the received data to a gatewaynode deployed on a nearby lamppost which will eventuallydeliver the data to a central node (to make a decision and takean action on it).
For wireless communications, ZigBee can be used betweena beacon and a gateway if the distance is within the radio rangeof ZigBee. Alternatively, WiFi can be used if the distance isnot within the ZigBee radio range. Finally, a gateway node cantransmit data to the central office either via wireless accessnetworks such as 2/3G or wired access networks such asDigital Subscriber Line (DSL) and Passive Optical Network(PON).
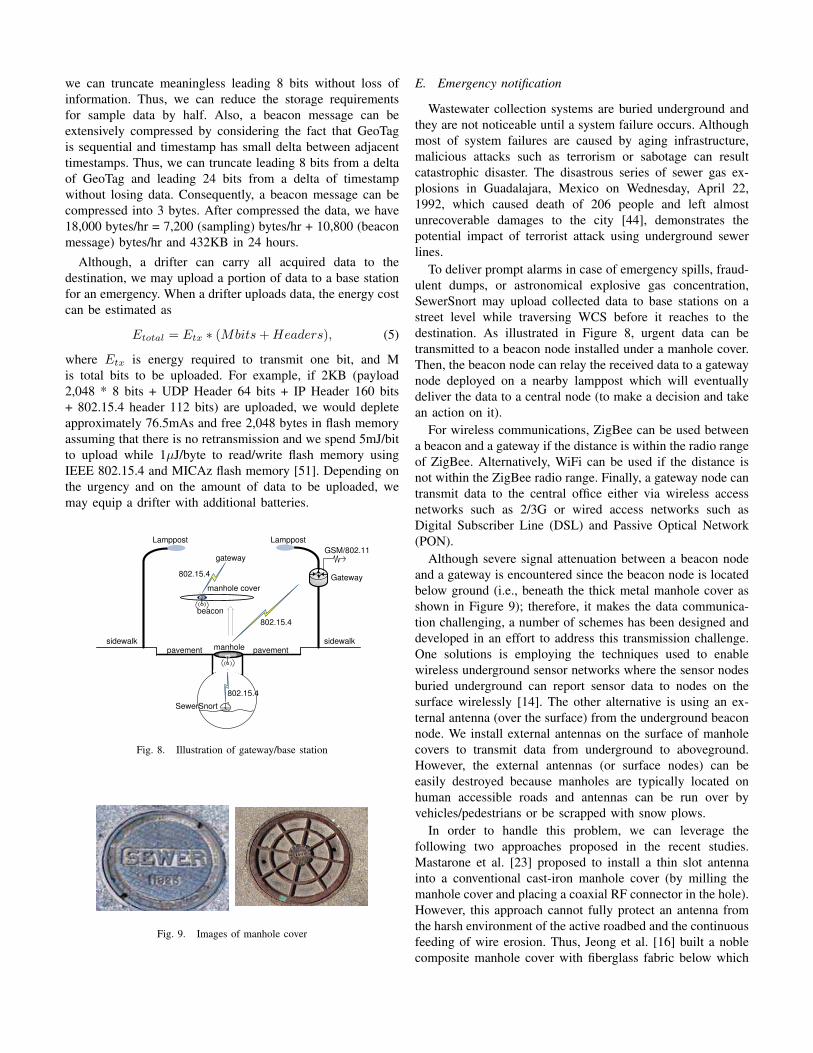
Although severe signal attenuation between a beacon nodeand a gateway is encountered since the beacon node is locatedbelow ground (i.e., beneath the thick metal manhole cover asshown in Figure 9); therefore, it makes the data communica-tion challenging, a number of schemes has been designed anddeveloped in an effort to address this transmission challenge.One solutions is employing the techniques used to enablewireless underground sensor networks where the sensor nodesburied underground can report sensor data to nodes on thesurface wirelessly [14]. The other alternative is using an ex-ternal antenna (over the surface) from the underground beaconnode. We install external antennas on the surface of manholecovers to transmit data from underground to aboveground.However, the external antennas (or surface nodes) can beeasily destroyed because manholes are typically located onhuman accessible roads and antennas can be run over byvehicles/pedestrians or be scrapped with snow plows.
In order to handle this problem, we can leverage thefollowing two approaches proposed in the recent studies.Mastarone et al. [23] proposed to install a thin slot antennainto a conventional cast-iron manhole cover (by milling themanhole cover and placing a coaxial RF connector in the hole).However, this approach cannot fully protect an antenna fromthe harsh environment of the active roadbed and the continuousfeeding of wire erosion. Thus, Jeong et al. [16] built a noblecomposite manhole cover with fiberglass fabric below which
a thin slot antenna is attached to isolate from the externalphysical environment yet to efficiently radiate electromagneticwaves.
manholemanhole
78 65
BaseStation 5
BaseStation 6
blockages
Fig. 10. Illustration of fault recovery
F. Fault recovery
Since a drifter is carried by sewer flow and has no controlon its movements, it is unable to move around an obstaclewhen it gets stuck in blockage. To rescue a stranded drifterit is necessary to estimate its position. We can utilize basestations as follows. Each base station keeps a log of theperiodic message exchanges heard from drifters that pass by.By analyzing the logs, we can find the section where thestranded drifter resides. As illustrated in Fig 10, base station5 heard drifter 7, but base station 6 did not; drifter 7 is stuckbetween base station 5 and base station 6. For a more preciseestimate, if we deploy a “convoy” of drifters that can hearand log each other probing messages, we can more preciselydetermine the location of the lost drifter. Upon retracting thesurviving drifters at the end of the journey, we can estimatefrom their logs how many drifters are lost and can computetheir approximate lost positions.
V. EXPERIMENTS
We validate the end-to-end capability of our custom H2Ssensor board by comparing it with that of QRAE PLUSMulti-Gas Monitor. QRAE is an off-the-shelf gas monitorthat is equipped with the same type of RAE H2S electro-chemical sensor element. Mounting our sensor system atopan Amigobot, a commercial mobile robot, and using it tomimic the sewer’s flow rate, we evaluate the overall systemperformance.
A. SewerSnort gas sensor board evaluation
Industrial grade electrochemical sensor data acquisitionmodules cost in the thousands of dollars (far outside viability
0
1
2
3
4
5
6
7
0 10 20 30 40 50 60
Con
cent
ratio
n(pp
m)
Timestamp
QRAE PLUSCustom Sensor Board
Fig. 11. Measured gas concentration using the QRAE industrial gas monitorand our SewerSnort AFE. The results agree almost exactly given that thesensor element uncertainty is ±0.5ppm.
for SewerSnort). It is then incumbent to demonstrate thatour low-power low-cost alternative (Figure 6) performs suf-ficiently well. Sensing fidelity is fundamentally limited by theelectrochemical element itself. For our chosen element [32],the maximum sensitivity9 to H2S is 0.75 µA
ppm , yet internalfluctuations and variations over temperature, limit accuracy to± 1
2ppm. We chose a value of 4.7Ω for the transconductanceelement R3 (Figure 5) and a gain of 1000 (R4 = R3 × gain)as it minimizes offset and Johnson thermal noise, while stillresolving 0.5ppmH2S changes into an output signal abovethe quantization threshold of the 10-bit ratiometric Analog-to-Digital Converter (ADC) in our chosen low-cost low-powerprocessing node (a Crossbow MicaZ). The transfer functionfor a 1ppm signal (0.75µA) follows:
mV
ppm= 0.75
µA
ppmR3
R4
R3≈ 3.5
mV
ppm(6)
For evaluation, we placed the QRAE and SewerSnortmonitors in an airtight container and introduced a 10ppmH2S gas via a sealed injection tube. Figure 11 presents themeasured gas concentration in ppm. The figure shows thatthe measurement results from our AFE are within 0.5ppmof the QRAE on average – e.g. below the sensor element’sinternal uncertainty. Since the experiments was performed ononly H2S gas, the sensor’s selectivity was not analyzed at thistime.
B. SewerSnort evaluation in a mobile environment
The SewerSnort gas board is interfaced with the MicaZmote. Since the MicaZ mode has a 2.4 GHz IEEE 802.15.4compatible radio, we also use it as a beacon node. We developa TinyOS driver for the SewerSnort gas sensor board. Thedriver stores the following information in its flash memory:the gas measurements, the beacon messages that include theposition of a beacon node, and the received signal strength ofthe beacon messages.
In the experiments, we first tried to derive the values ofACL and α(a,σ) in Equation (3) for 10m concrete pipes withdiameters of 1.5m and 1.8m. In order to estimate ACL andα(a,σ) for each pipe, we used a robust linear algorithm inMatlab. We place a beacon at the end of the pipes, andmeasure the RSSI values from 0m to 10m, incrementing themeasure point by 0.5m. Each measure collects 20 RSSIs,where every RSSI is averaged over a set of 500 samples.Thus, every measure requires 10000 samples. We configurethe beacon to send out a beacon packet every 10ms, at thehighest transmission power of the MicaZ. Figure 14 and Figure15 show results of linear regression using Equation(3).
After obtaining ACL and α(a,σ) for Equation (3), weconsider the mobility scenario of the SewerSnort drifter.We mimic the mobility of a SewerSnort drifter by usingan Amigobot robot, a programmable, wirelessly controllablemobile robot. The SewerSnort node is placed on top of the
9In this context, Parts Per Million (ppm) denotes the number of particlesof a desired gas per one million particles of the background gas or gases
H2S Gas (10ppm)
10m3.5m
Amigobot
SewerSnortNode
Fig. 12. Experiment scenario
0
1
2
3
4
5
0 2 4 6 8 10
Concentration(ppm)
Distance(m)
Gas Concentration inside 1.5m pipeGas Concentration inside 1.8m pipe
Fig. 13. Measured H2S gas concentration (ppm) in 1.5m,1.8m pipes
-82
-80
-78
-76
-74
-72
-70
-68
-66
-64
-62
0 2 4 6 8 10
Power Received(dBm)
Distance(m)
Raw RSSI valuesLinear RSSI-distance Model
Fig. 14. Average received power results for 1.5m pipe
-80
-75
-70
-65
-60
-55
0 2 4 6 8 10
Power Received(dBm)
Distance(m)
Raw RSSI valuesLinear RSSI-distance Model
Fig. 15. Average received power results for 1.8m pipe
-85
-80
-75
-70
-65
-60
-55
0 2 4 6 8 10
Power Received(dBm)
Timestamp(sec)
Raw RSSI valuesRSSI Residue after EMD
Linear RSSI-distance Model
Fig. 16. Comparison with measured RSSI, EMD filtered RSSI,and Linear RSSI-distance Model (1.5m pipe)
-90
-85
-80
-75
-70
-65
-60
-55
-50
0 2 4 6 8 10
Power Received(dBm)
Timestamp(sec)
Raw RSSI valuesRSSI Residue after EMD
Linear RSSI-distance Model
Fig. 17. Comparison with measured RSSI, EMD filtered RSSI,and Linear RSSI-distance Model (1.8m pipe)
Amigobot. We program the Amigobot to move from one endto the other with a constant speed of 1m/s in a straight line.A H2S gas cylinder (10ppm) is placed 3.5m away from thestarting point. The overall scenario is summarized in Figure12. In our experiment, mainly the sensor’s sensitivity wasexamined and there was no effect of wind or ventilation. Inthe future, we plan to include chimney effect by incorporatingwind or ventilation to lab experiment scenarios.
Figure 13 shows that the measured gas concentration startsrapidly increasing around the 3.4m and then drastically de-creasing after the 3.7m. This range includes the positionwhere we place the gas cylinder. The reason why we observelower concentration than 10ppm is due to gas diffusion in the
air. A spike located at around 2.5m in 1.5m pipe is due torandomness of the gas diffusion.
For localization, we apply the EMD algorithm to denoisethe RSSI measurement data in Figure 16 and Figure 17.We identify all local maxima Xmax(t) as X(t − 1) <Xmax(t) > X(t + 1) and all local minima Xmin(t) asX(t − 1) > Xmin(t) < X(t + 1) where X(t) is RSSI valueat time t. We then use cubic Bezier curves and Bernsteinpolynomials to connect all local maxima and all local minimafor the upper envelope and for the lower envelop respectivelyas follows: E(x) =
∑ni=1
(3i
)Xi(1 − t)3−iti. After the 4th
iteration of sifting, we reach the termination condition. Figure16 and Figure 17 show the final residue after de-noising.
Equation (3) can be directly used to estimate distance usingmeasured RSSI data. As shown in the figures, however, theresulting distance estimates over time tends to fluctuate andmay have abrupt jumps and reverse of directions, resultingin higher errors. For better location estimation, we exploit thefact that a flow velocity is relatively steady within a short pipesegment. Assuming that SewerSnort is drifting along the pipeat a constant speed V , we substitute d in Equation (3) with V t.This allows us to search for the drifter speed V that minimizesthe errors from the smoothed RSSI values. In Figure 16 andFigure 17, we plot measured RSSI values, EMD filtered RSSIvalues, and our linear model with speed V that minimizeserrors. The results show that the estimated speed is very closeto the experiment scenario (less than 5% error). This meter-level accuracy may be sufficient for most sewer gas monitoringscenarios. If an application requires more accuracy, we needadditional devices such as an inertial navigation device anda probabilistic localization model, which is part of our futurework.
VI. RELATED WORK
Wireless sensor networks have been widely utilized invarious environmental monitoring systems. Among the wealthof research contributions, this section reviews only the fewthat are most significantly related to SewerSnort.
A. Advanced pipeline monitoring systems
Mobile robots can perform sewer inspection (e.g., anomalydetection) by autonomously navigating a pipeline. They aretypically equipped with lights and cameras for pipeline pro-filing, and various sensors (e.g., sonar, infrared, laser) forautonomous navigation. To name a few prototypes, there areKURT developed by Kirchner et al. [18] and KANTARO byAhrary et al. [1]. Mobile robot research in sewers has beenfocused on localization using an internal map and featuredetection (e.g., manholes and inlets). Teichgraber et al. [41]proposed SEK, a “cable-guided” floating inspection tool thatconducts camera inspections, recording major abnormalitiessuch as erosion, deposits, obstacles and leaks in the gas space.SEK differs from SewerSnort in that (1) SewerSnort is an“unteathered” lightweight drifter that monitors in-sewer gases,and (2) SewerSnort performs localization using the beaconsinstalled beneath sewer manholes.
Wireless sensor networks have recently employed in sewermonitoring [39], [15]. PipeNet [39] uses a network of fixedwireless sensors to detect and locate leaks in the “full flowing”water transmission pipeline. The system collects pressure, flowvelocity, and acoustic/vibration data at the fixed points alongthe pipelines. Then, an analytic algorithm is applied to detectand to locate the leaks. The IDEAS laboratory in Purdueuniversity used a wireless sensor network for developing asystem to prevent Combined Sewer Overflow (CSO) in SouthBend, IN [15]. The system transmits an alert alarm througha wireless channel to facilitate automatic flow diversion whenthe flow level reaches the threshold.
B. Mobile robot localization in sewers
Mobile robot localization may be classified as relative, ab-solute, or a mixture of both. Relative localization uses internalsensors to estimate its current location such as odometry usinginternal sensors and dead reckoning using gyroscopes andcompasses. As the robot moves, its actual position may deviatedue to the accumulation of errors (e.g., wheel slippage). Thus,periodic absolute localization is crucial to long-term perfor-mance. Absolute localization requires either active beaconsthat transmit signals with position information (e.g., GPS), orknown landmarks recognizable by the robot. The most popularapproach is relative localization with landmark recognition. Insewers, there are only a few local features such as manholes,junctions, pipe joints and inlets that can be used as landmarksfor localization [24]. Unfortunately, landmark detection insewers experiences uncertainty with regard to detection andidentity. Bayesian models are typically used to solve thisproblem using the conditional probability of the estimatedlocation with respect to the observation and to the a prioriprobability distribution. Popular Bayesian methods includeKalman filtering [25], Markov [9], and Particle filtering (orMonte Carlo localization) [8]. A SewerSnort drifter localizesitself using active 802.15.4 beacons installed in sewer man-holes. We are currently exploring augmenting the drifter withan inertial navigation sensor suite based on the works of [47];and the Hidden Markov model (used in speech reorganization)will be used to find the trajectory that minimizes the error [20].
VII. CONCLUSION AND FUTURE WORK
This paper has presented an innovative sewer gas monitoringsystem based on a floating, drifting embedded sensor platform,the SewerSnort. We discussed the feasibility of a mobiledrifting sensor by analyzing the sewer flow statistics andpresent the potential applications of in-sewer gas monitoring.Then, we designed an “inner-tube” shaped hull to handle thelateral force that pushes the drifter to the side of the sewers,presented the first single-supply differential ratiometric dataacquisition architecture that targets electrochemical sensorsfor WCS monitoring applications, and proposed a ReceivedSignal Strength Indicator (RSSI) based localization scheme forSewerSnort. Experiments based on a dry land robotic emulatorhave demonstrated the feasibility of the system, with extremelyaccurate gas readings aboard the float and adequate locationestimates (errors within 5% over hundreds of meters).
The preliminary results are encouraging and will stimulatefurther research in the field. First, we will develop newapplications sensors (or augment existing approaches) usingdrifting sensors such as pipe maintenance, flow characteristicsmonitoring, leak detection, exceptional dump monitoring, andsewer surveillance. For instance, preventive metal pipe main-tenance will be assisted by the comparison of historical gasreadings with typical pipe decay. Second, these applicationsmay require a convoy of drifters deployed for better coverage(time/space), and enabling wireless communications amongdrifters will be very useful for adaptive sensing, localization,
and near real-time data reporting. We will analyze communi-cation patterns/requirements and develop efficient networkingprotocols for sewer drifter networks. Third, we will developa realistic mobility model for drifters in sewer pipes, whichwill allow us to better understand sensor coverage and net-working protocol performance (e.g., network connectivity andpacket delivery ratio), especially when a convoy of sensorsis deployed. Finally, we will study the trade-offs betweenlocalization accuracy and beacon deployments – the more thenumber of beacons, the better the accuracy.
ACKNOWLEDGEMENT
We thank RAE Systems for providing a QRAE gas detectorand H2S electrochemical sensors (RAE 032-0102-000). Wethank Woonghee Lee for providing 3D SewerSnort schematic.We appreciate the courtesy of Mr. Cowden, CEO of RialtoConcrete Pipe company, who provided us the experimentalenvironment. This work is supported in part by the NationalScience Foundation under Grant No. 0722046.
REFERENCES
[1] A. Ahrary, L. Tian, S. ichiro Kamata, and M. Ishikawa. Navigation of anAutonomous Sewer Inspection Robot Based on Stereo Camera Imagesand Laser Scanner Data. Int’l Journal on Artificial Intelligence Tools,16(5):611–625, Aug. 2008.
[3] P. Bahl and V. Padmanabhan. RADAR: An In-Building RF-based UserLocation and Tracking System. In INFOCOM’00, Tel-Aviv, Israel, Mar.2000.
[4] P. Churchill and D. Elmer. Hydrogen Sulfide Odor Control in WastewaterCollection Systems. NEWEA Journal, 33(1):57, May 1999.
[5] C.-Y. Fan, R. Field, and F. hsiung Lai. Sewer-Sediment Control:Overview of an EPA Wet-Weather Flow Research Program. TechnicalReport EPA-600-J-03-188, US-EPA, National Risk Management Labo-ratory, Water Supply and Water Resource Division, Urban WatershedManagement Branch, Edison, NJ, USA, 2006.
[6] R. Fenner. Approaches to Sewer Maintenance: A Review. Urban Water,2(42):343–356, Dec. 2000.
[7] M. W. Fincham. Big Boats, Narrow Channels. Chesapeake QuarterlyOnline, 4(2), Dec. 2005.
[8] D. Fox, W. Burgard, F. Dellaert, and S. Thrun. Monte Carlo Localization:Efficient Position Estimation for Mobile Robots. In National Conferenceon Artificial Intelligence, Orlando, FL, July 1999.
[9] D. Fox, W. Burgard, and S. Thrun. Markov Localization for MobileRobots in Dynamic Environments. Journal of Artificial IntelligenceResearch, July.
[10] A. Guisasola, D. de Haas, J. Keller, and Z. Yuan. Methane Formationin Sewer Systems. Water Research, 42(6-7):1421–1430, Oct. 2008.
[11] I. Howitt, J. Khan, and S. Khan. Lumped Parameter Radio WavePropagation Model for Storm Drain Pipe. In Proceedings of FirstInternational Conference on Computer, Control and Communications,Karachi, Pakistan, Nov 2007.
[12] N. E. Huang, Z. Shen, S. R. Long, M. C. Wu, H. H. Shih, Q. Zheng, N.-C. Yen, C. C. Tung, and H. H. Liu. The Empirical Mode Decompositionand the Hilbert Spectrum for Nonlinear and Non-stationary Time SeriesAnalysis. Royal Society of London Proceedings Series A, 454(1971):903,1998.
[13] T. Hvitved-Jacobsen. Sewer Processes: Microbial and Chemical ProcessEngineering of Sewer Networks. CRC, 2001.
[14] E. P. Ian F. Akyildiz. Wireless underground sensor networks: Researchchallenges. Ad Hoc Networks, 4(2006):669–686, July 2006.
[16] S. Jeong, C. Yang, J. Courter, S. Kim, B. Pipes, and W. Chappell.Multilayer Composite for Below Ground Embedded Sensor Networking.In IEEE Int. Conference of Antennas and Propagation, 2008.
[17] J. Kim, J. Lim, J. Friedman, U. Lee, L. Vieira, D. Rosso, M. Gerla, andM. Srivastava. SewerSnort: A Drifting Sensor for In-situ Sewer GasMonitoring. In IEEE SECON’09, Rome, Italy, June 2009.
[18] F. Kirchner and J. Hertzberg. A Prototype Study of an AutonomousRobot Platform for Sewerage System Maintenance. Autonomous Robots,4(4):319–331, Apr. 1997.
[19] E. Kjeldsen and M. Hopkins. An Experimental Look at Rf Propagationin Narrow Tunnels. In MILCOM’06, Washington DC, Sep. 2006.
[20] J. Krumm and E. Horvitz. LOCADIO: Inferring Motion and Locationfrom Wi-Fi Signal Strengths. In Mobiquitous’04, Boston, MA, Aug.2004.
[21] K. Lorincz and M. Welsh. MoteTrack: A Robust, Decentralized Ap-proach to RF-Based Location Tracking. In LoCA’05, Munich, Germany,May 2005.
[22] Datasheet. MCP6041: 600nA, Rail-to-Rail Input/Output Op Amps,Microchip Corporation, 2002.
[23] J. Mastarone and W. Chappell. Urban sensor networking using thickslots in manhole covers. In IEEE Antennas and Propagation SocietyInternational Symposium, 2006.
[24] A. Nassiraei, Y. Kawamura, A. Ahrary, Y. Mikuriya, and K. Ishii. ANew Approach to the Sewer Pipe Inspection: Fully Autonomous MobileRobot “KANTARO”. In IECON 2006, Paris, Nov. 2006.
[25] R. Negenborn. Robot Localization and Kalman Filters. Technical ReportINF/SCR-0309, Utrecht University, 2003.
[26] Inventory of New York City GREENHOUSE GAS EMISSIONS. http://www.nyc.gov/html/om/pdf/ccp report041007.pdf.
[27] A. S. of Civil Engineers. Protocols for Identifying Sanitary SewerOverflows. Technical Report CX 82697-01-0, USEPA, June 2000.
[28] L. A. D. of Public Works Bureau of Sanitation. Year at a Glance 2008-2009, City of Los Angeles, Department of Public Works, Bureau ofSanitation. Technical Report YAG 2008-2009, City of Los Angeles,2009.
[29] P. Pathirana, N. Bulusu, A. Savkin, and S. Jha. Node Localization UsingMobile Robots in Delay-Tolerant Sensor Networks. IEEE Transactionson Mobile Computing, 4(3), May/June 2005.
[30] N. Pletcher and J. M. Rabaey. Ultra-Low Power Wake-Up Receivers forWireless Sensor Networks. PhD thesis, EECS Department, Universityof California, Berkeley, May 2008.
[32] Datasheet. Electrochemical H2S Sensor 032-0102-000, RAE Systems.[33] D. M. Revitt, J. B. Ellis, and N. Paterakis. Comparison of Tracer
Techniques for Monitoring Sewer Losses. Journal of EnvironmentalMonitoring, 8(5):564–571, Apr. 2006.
[34] D. Rosso and M. K. Stenstrom. The Carbon-sequestration Potential ofMunicipal Wastewater Treatment. Chemosphere, 70(8):1468–1475, Feb.2008.
[35] T. Schmid, J. Friedman, Z. M. Charbiwala, Y. H. Cho, and M. B.Srivastava. Low-Power High-Accuracy Timing Systems for EfficientDuty Cycling. In ISLPED’08, Bangalore, India, Aug. 2008.
[36] T. Schmid, J. Friedman, Z. M. Charbiwala, Y. H. Cho, and M. B. Sri-vastava. XCXO: An Ultra-low Cost Ultra-high Accuracy Clock Systemfor Wireless Sensor Networks in Harsh Remote Outdoor Environments.In ISSCC/DAC’08, San Francisco, CA, Feb. 2008.
[37] Sewer Design Manual – Part F. http://eng.lacity.org/techdocs/sewer-ma/index.htm.
[38] A. U. Spencer, S. S. Noland, and L. J. Gottlieb. Bathtub Fire: AnExtraordinary Burn Injury. Journal of Burn Care & Research, 27(1):97–98, Jan./Feb. 2006.
[39] I. Stoianov, L. Nachman, and S. Madden. PIPENET: A Wireless SensorNetwork for Pipeline Monitoring. In IPSN’07, Cambridge, MA, Apr.2007.
[40] Streetline City Infrastructure Technologies. http://www.streetlinenetworks.com/site/index.php.
[41] B. Teichgraber, J. Stemplewski, H. Althoff, and N. Elkmann. RemoteControlled Inspection Device for Large Sewers. Water Practice &Technology, Sep.
[42] US-EPA. Guide For Evaluating Capacity, Management, Operation, andMaintenance (CMOM) Programs At Sanitary Sewer Collection Systems.Technical Report EPA-305-B-05-002, US-EPA Office of Enforcementand Compliance Assurance, Jan. 2005.
[43] US-EPA. Real Time Control of Urban Drainage Networks. TechnicalReport EPA-600-R-06-120, US-EPA Office of Research and Develop-ment, Sep. 2006.
[44] P. Varley. Responding to Disasters: The Story of the Guadalajara SewerExplosion. Technical Report C16-94-1180.0 p3-6, Kennedy School ofGovernment Case Program, 1994.
[45] J. Vollertsen, A. H. Nielsen, H. S. Jensen, and T. Hvitved-Jacobsen.Modeling the Formation and Fate of Odorous Substances in CollectionSystems. Water Environment Research, 80(2):118–126, Feb. 2008.
[46] Wellcare Information for You about Turbidity in Drinking Water. http://www.watersystemscouncil.org.
[47] O. J. Woodmann. An Introduction to Inertial Navigation. TechnicalReport TR-696, UCAM-CL, 2007.
[48] C. Yalamanchili and M. D. Smith. Acute Hydrogen Sulfide Toxicity dueto Sewer Gas Exposure. The American Journal of Emergency Medicine,26(4):518.e5–518.e7, Apr. 2006.
[49] L. Zeindlhofer. Filling the Sewer Pipe – Advanced FTTH DeploymentTechnologiess. In FTTH Conference Expo’07, Orlando, FL, Sep.-Oct.2007.
[50] L. Zhang, P. D. Schryver, B. D. Gusseme, W. D. Muynck, N. Boon,and W. Verstraete. Chemical and Biological Technologies for HydrogenSulfide Emission Control in Sewer Systems: A Review. Water Research,42(1-2):1–12, Jan. 2008.
[51] Specification of ZigBee Technology). http://www.ZigBee.org/.