www.eia.gov U.S. Energy Information Administration Independent Statistics & Analysis For Chatham House Annual Conference on Middle East and North Africa Energy London, U.K., January 27 th 2015 By Faouzi Aloulou, Senior Economist Office of Petroleum, Natural Gas and Biofuels Analysis A game changer for the U.S. energy market and a possibility for North Africa Shale Gas and Tight Oil:
Transcript
www.eia.gov U.S. Energy Information Administration Independent Statistics & Analysis
For Chatham House Annual Conference on Middle East and North Africa Energy London, U.K., January 27th 2015 By Faouzi Aloulou, Senior Economist Office of Petroleum, Natural Gas and Biofuels Analysis
A game changer for the U.S. energy market and a possibility for North Africa
Shale Gas and Tight Oil:
EIA Mission: Independent Statistics and Analysis
Faouzi Aloulou Chatham House MENA Energy Conference, London, 27 January 2015 2
• The EIA was created by act of Congress in 1977
• The agency collects, analyzes, and disseminates independent and impartial energy information to promote sound policymaking, efficient markets, and public understanding of energy and its interaction with the economy and the environment
• EIA is the Nation's premier source of energy information and, by law, its data, analyses, and forecasts are independent of approval by any other officer or employee of the U.S. Government
Half of EIA annual budget is spent on operating more than 64 active data collection surveys and forms in the U.S.
Faouzi Aloulou Chatham House MENA Energy Conference, London, 27 January 2015 3
Schematic representation of EIA surveys on petroleum marketing data collection
The energy industry and markets rely heavily on EIA’s data
4
EIA’s weekly release of petroleum and natural gas data has an immediate impact on markets
Data Represent NYMEX Henry Hub Natural Gas Near-Month Futures Contract July 6, 2012 Source: Bloomberg Finance LP (July 9, 2012) after the release of the EIA Weekly Natural Gas Storage Report
10:30 am EIA natural gas data released
Data Represent NYMEX Light, Sweet Crude Oil (WTI) Near-Month Futures Contract July 5, 2012 Source: Bloomberg Finance LP (July 9, 2012) after the release of EIA Weekly Petroleum Status Report
10:30 am EIA petroleum data released
Faouzi Aloulou Chatham House MENA Energy Conference, London, 27 January 2015
World energy consumption will remain heavily reliant on hydrocarbon sources
U.S. tight oil production million barrels of oil per day
0
5
10
15
20
25
30
35
40Marcellus (PA & WV)
Haynesville (LA & TX)
Eagle Ford (TX)
Fayetteville (AR)
Barnett (TX)
Woodford (OK)
Bakken (ND)
Antrim (MI, IN, & OH)
Utica (OH, PA & WV)
Rest of US 'shale'
U.S. dry shale gas production billion cubic feet per day
Sources: EIA derived from state administrative data collected by DrillingInfo Inc. Data are through December 2014 and represent EIA’s official tight oil & shale gas estimates, but are not survey data. State abbreviations indicate primary state(s).
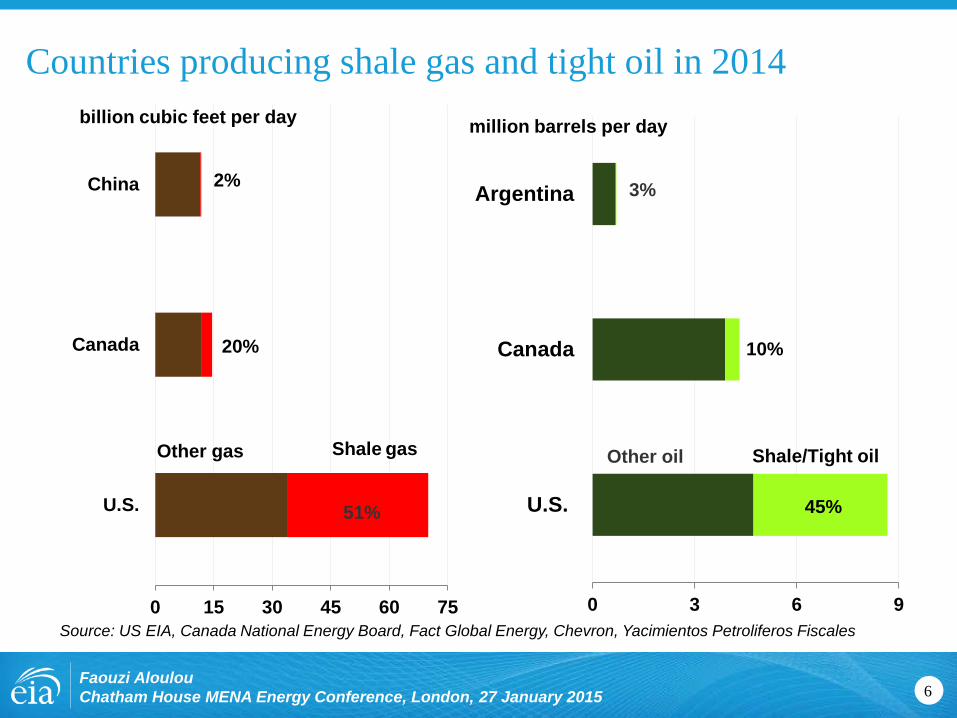
Faouzi Aloulou Chatham House MENA Energy Conference, London, 27 January 2015
8
Source: U.S. Energy Information Administration based on data from various published studies. Canada and Mexico plays from ARI.
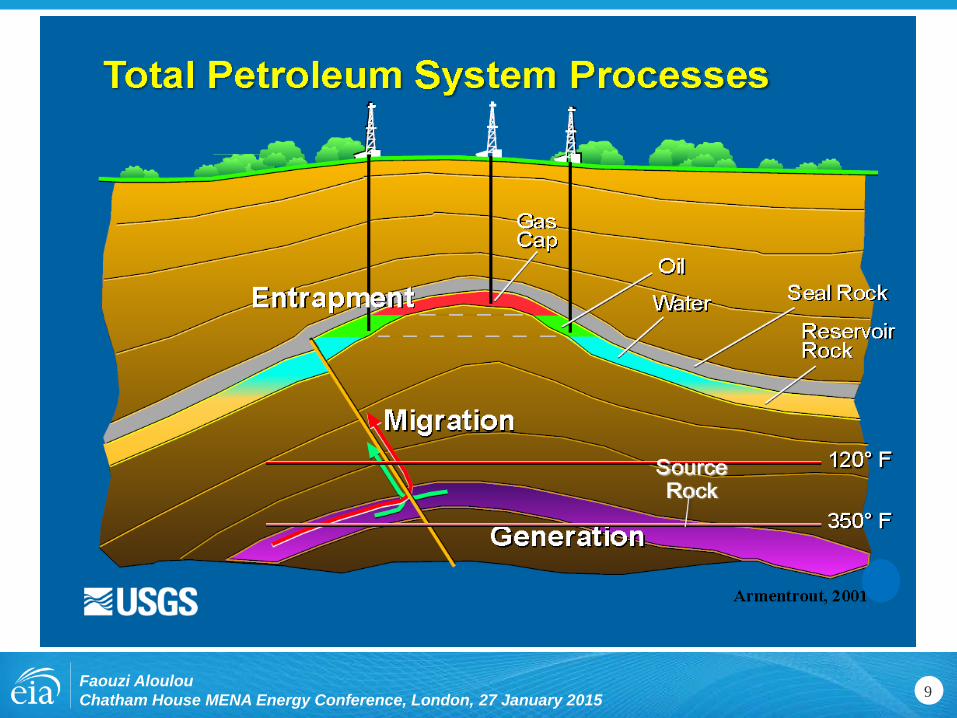
Faouzi Aloulou Chatham House MENA Energy Conference, London, 27 January 2015
9 Faouzi Aloulou Chatham House MENA Energy Conference, London, 27 January 2015
Drilling Productivity Report (DPR) represents a step change in analyzing production metrics
10
• Prior to the “shale development breakthrough” – Drillers targeted either oil or natural gas formations
– Production was relatively stable over a long period from each well
– Simple rig count was sufficient to monitor and forecast production
• Drilling in tight formations – New applications of technology: Horizontal drilling and hydraulic fracturing
– Pad drilling: Multiple wells per rig from one surface location
– High initial production rates driven by better technology
– Steep production declines
– Formations yielding both oil and natural gas
– Regional differences contrast rig and well productivity
Faouzi Aloulou Chatham House MENA Energy Conference, London, 27 January 2015
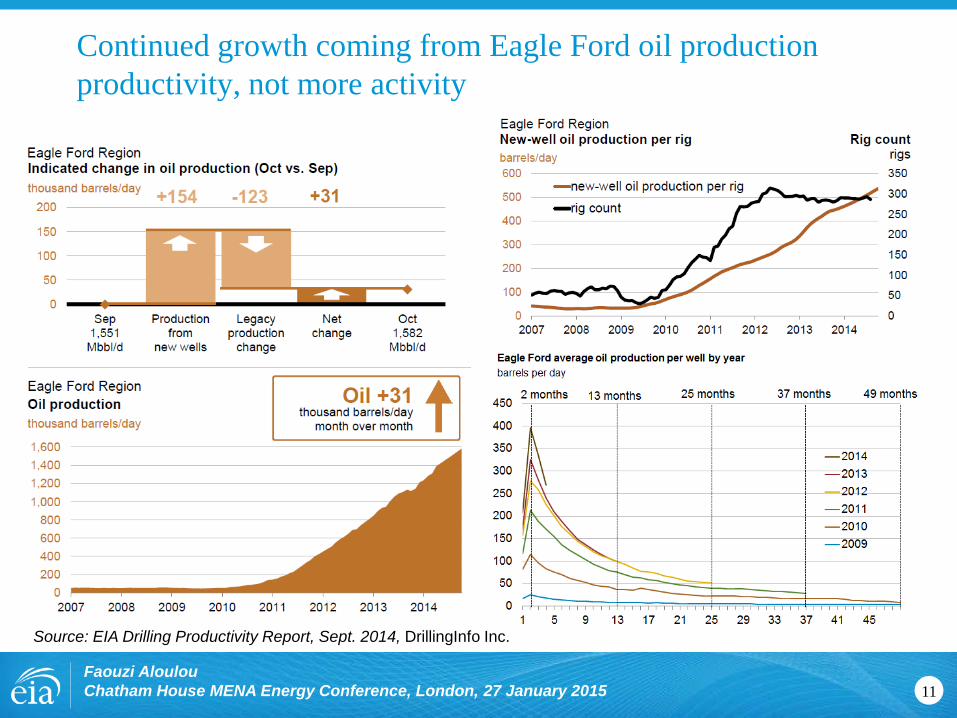
Continued growth coming from Eagle Ford oil production productivity, not more activity
11
Source: EIA Drilling Productivity Report, Sept. 2014, DrillingInfo Inc.
Faouzi Aloulou Chatham House MENA Energy Conference, London, 27 January 2015
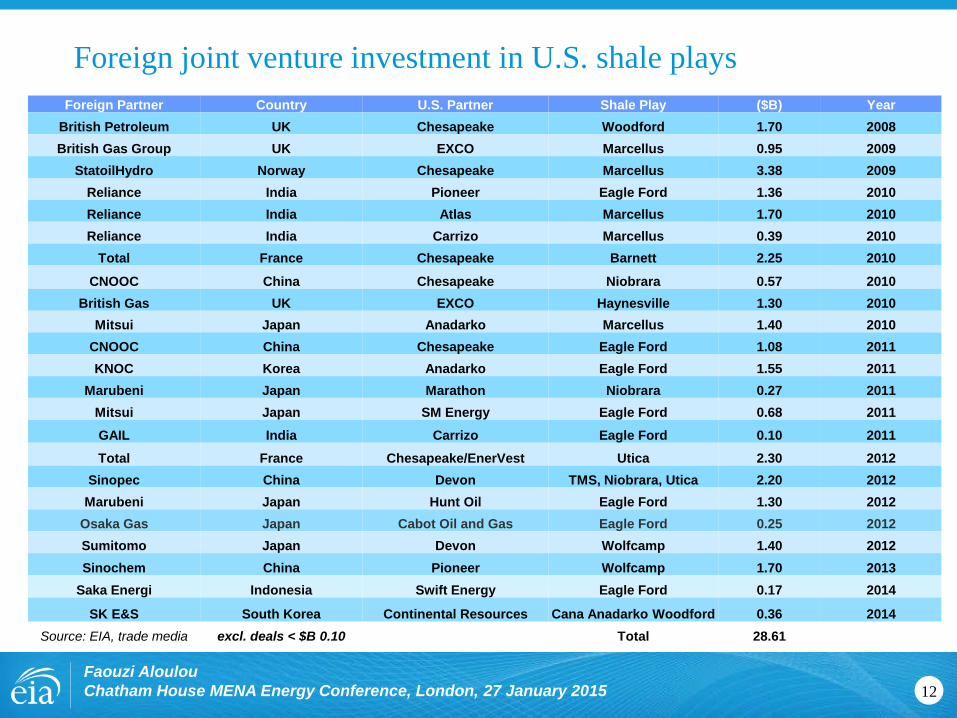
Foreign joint venture investment in U.S. shale plays
12
Foreign Partner Country U.S. Partner Shale Play ($B) Year British Petroleum UK Chesapeake Woodford 1.70 2008 British Gas Group UK EXCO Marcellus 0.95 2009
StatoilHydro Norway Chesapeake Marcellus 3.38 2009 Reliance India Pioneer Eagle Ford 1.36 2010 Reliance India Atlas Marcellus 1.70 2010 Reliance India Carrizo Marcellus 0.39 2010
Total France Chesapeake Barnett 2.25 2010
CNOOC China Chesapeake Niobrara 0.57 2010 British Gas UK EXCO Haynesville 1.30 2010
Mitsui Japan Anadarko Marcellus 1.40 2010 CNOOC China Chesapeake Eagle Ford 1.08 2011 KNOC Korea Anadarko Eagle Ford 1.55 2011
Marubeni Japan Marathon Niobrara 0.27 2011 Mitsui Japan SM Energy Eagle Ford 0.68 2011 GAIL India Carrizo Eagle Ford 0.10 2011 Total France Chesapeake/EnerVest Utica 2.30 2012
Sinopec China Devon TMS, Niobrara, Utica 2.20 2012 Marubeni Japan Hunt Oil Eagle Ford 1.30 2012
Osaka Gas Japan Cabot Oil and Gas Eagle Ford 0.25 2012 Sumitomo Japan Devon Wolfcamp 1.40 2012 Sinochem China Pioneer Wolfcamp 1.70 2013
Saka Energi Indonesia Swift Energy Eagle Ford 0.17 2014
SK E&S South Korea Continental Resources Cana Anadarko Woodford 0.36 2014 Source: EIA, trade media excl. deals < $B 0.10 Total 28.61
Faouzi Aloulou Chatham House MENA Energy Conference, London, 27 January 2015
Map of 106 basins assessed for shale oil and shale gas resources in 46 countries
13 Faouzi Aloulou Chatham House MENA Energy Conference, London, 27 January 2015
Source: EIA/ARI World Shale Oil and Shale Gas Resource Assessment 2013
U.K. total: 26 Tcf and 0.7 Billion barrels Shale Gas: North UK Carbonifurous formations.
• Thick, gas-bearing shales (thicker than the Marcellus shale)
• More faulting and geologically complex than North America
Shale Oil: Wessex/Weald basins in the south contain the shale oil Activities: 6 tested wells in North UK after
lifting the moratorium in Dec. 2012. • No horizontal shale wells yet • Current operators: Cuadrilla Resources,
IGAS, Dart Energy, Coastal Oil & Gas Ltd., Celtique Energie, and Eden Energy
United Kingdom
Faouzi Aloulou Chatham House MENA Energy Conference, London, 27 January 2015
Can North Africa compete with the Americas and Asia Pacific for foreign
investment to develop their shale resources?
Faouzi Aloulou Chatham House MENA Energy Conference, London, 27 January 2015 17
Top ten countries with technically recoverable shale resources
18
Shale gas Rank Country Trillion cubic feet
1 China 1,115
2 Argentina 802
3 Algeria 707
4 Canada 573
5 United States 555
6 Mexico 545
7 Australia 429
8 South Africa 390
9 Russia 287
10 Brazil 245
Total for 46 countries
7,509
Shale oil Rank Country Billion barrels
1 Russia 75.8
2 United States 60.2
3 China 32.2
4 Argentina 27.0
5 Libya 26.1
6 UAE 22.6
7 Chad 16.2
8 Australia 15.6
9 Venezuela 13.4
10 Mexico 13.1
Total for 46 countries
400.8
Source: EIA, USGS and ARI 2015 Preliminary Results
Faouzi Aloulou Chatham House MENA Energy Conference, London, 27 January 2015
Algeria’s pipeline infrastructure proximity to shale basins
Source: EIA, ARI, IHS_EDIN
19 Faouzi Aloulou Chatham House MENA Energy Conference, London, 27 January 2015
The potential of shale oil development at Neuquen’s Vaca Muerta formations in Argentina
20
Argentina total: 802 Tcf; 27 Billion bbl
Argentina has world-class shale gas and shale oil potential – possibly the most prospective outside of North America.
Neuquen basin: 583 Tcf of shale gas and 20 Billion bbl of shale oil technically recoverable
Activities: YPF with Chevron (already producing); Exxon Mobil with Gas y Petróleo del Neuquén (announced large flow in late May 2014); Total; Statoil; Dow Chemical, Apache, EOG…
Faouzi Aloulou Chatham House MENA Energy Conference, London, 27 January 2015
The potential of shale resource development in Burgos and Tampico basins in Mexico
21
Mexico total: 545 Tcf; 13.1 B bbl
• Burgos: 393 Tcf; 6.3 B bbl
• Sabinas: 124 Tcf
• Tampico: 23 Tcf; 5.5 B bbl
• Tuxpan: 2 Tcf; 1 B bbl
• Veracruz: 3 Tcf; 0.3 B bbl
Activities: Pemex explored 6 shale wells with modest results. Energy reforms have been enacted in 2014
Source: EIA/ARI World Shale Oil and Shale Gas Resources Assessment June 2013
Faouzi Aloulou Chatham House MENA Energy Conference, London, 27 January 2015
The potential of shale gas development from Sichuan basin in China
22
China total: 1, 115 Tcf; 32.2 billion bbl
Sichuan basin: 626 Tcf
(Si = four; chuan = rivers in Chinese mandarin)
Activities: over 100 exploration wells vertical & horizontal. PetroChina, Sinopec, new startups, Shell, Chevron, ConocoPhillips
Source: EIA/ARI World Shale Oil and Shale Gas Resources Assessment June 2013
Faouzi Aloulou Chatham House MENA Energy Conference, London, 27 January 2015
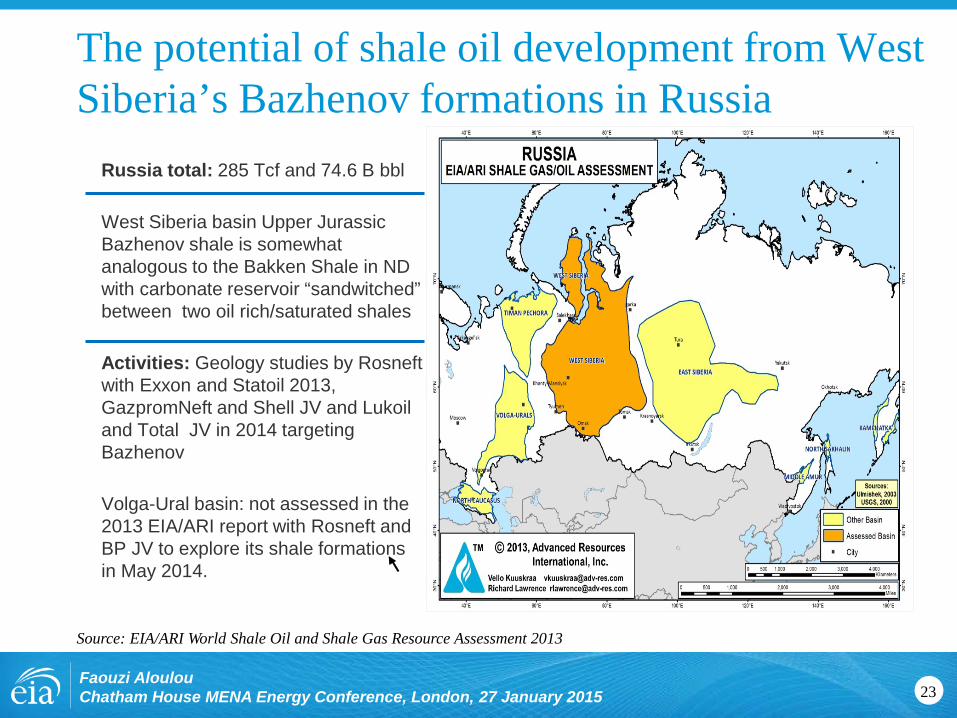
The potential of shale oil development from West Siberia’s Bazhenov formations in Russia
23
Russia total: 285 Tcf and 74.6 B bbl
West Siberia basin Upper Jurassic Bazhenov shale is somewhat analogous to the Bakken Shale in ND with carbonate reservoir “sandwitched” between two oil rich/saturated shales
Activities: Geology studies by Rosneft with Exxon and Statoil 2013, GazpromNeft and Shell JV and Lukoil and Total JV in 2014 targeting Bazhenov
Volga-Ural basin: not assessed in the 2013 EIA/ARI report with Rosneft and BP JV to explore its shale formations in May 2014.
Source: EIA/ARI World Shale Oil and Shale Gas Resource Assessment 2013
Faouzi Aloulou Chatham House MENA Energy Conference, London, 27 January 2015
For more information U.S. Energy Information Administration home page | www.eia.gov