19
Shangri-La Asia Ltd 2020 Annual Results 26 March 2021
Shangri-La Asia Ltd2020 Annual Results26 March 2021
FY2020 Results Highlights
2
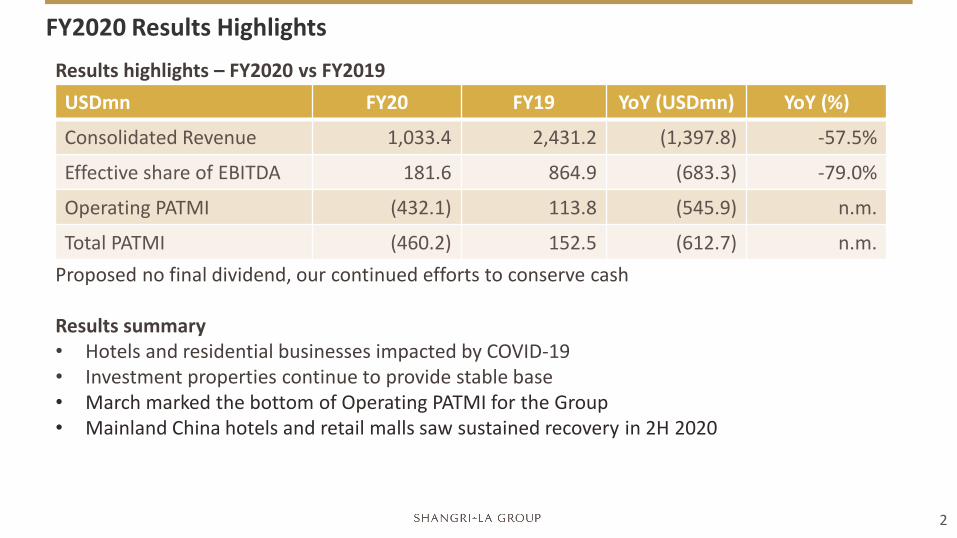
Results highlights – FY2020 vs FY2019
Proposed no final dividend, our continued efforts to conserve cash
Results summary• Hotels and residential businesses impacted by COVID-19• Investment properties continue to provide stable base• March marked the bottom of Operating PATMI for the Group• Mainland China hotels and retail malls saw sustained recovery in 2H 2020
USDmn FY20 FY19 YoY (USDmn) YoY (%)
Consolidated Revenue 1,033.4 2,431.2 (1,397.8) -57.5%
Effective share of EBITDA 181.6 864.9 (683.3) -79.0%
Operating PATMI (432.1) 113.8 (545.9) n.m.
Total PATMI (460.2) 152.5 (612.7) n.m.
FY2020 Business update
3
Mitigation actions• Launched “Shangri-La Cares”, our health and safety commitment, to ensure safety of our
guests and staff• Streamlined organisation structure and implemented cost control measures• Maximised cash conservation, reduced capex plans and put on hold all new projects
Initiatives• Increased focus on domestic leisure market with promotions in family and staycation
packages• Hotel vouchers programme to improve cashflow and increase business volume• Drove F&B takeaway and delivery business• Promoted sales of holiday goodies
FY2020 Business update
4
Major events of the yearHotelsNew Opening • Shangri-La Zhoushan (January 2020)• Shangri-La Putian (December 2020)New hotels• Signed management agreement with Kerry Properties Limited for Jen Hangzhou by Shangri-La (Sept 2020)• Signed management agreement with Shenzhen Metro Group and China Vanke for Shangri-La Hotel in
Shenzhen Bay Huiyun Centre (November 2020)
Other Developments• Opened Shang Brew (management contract) in Shougang Park, Beijing, Mainland China (October 2020)• Opened office building Shangri-La Centre, Wuhan, Mainland China (November 2020)
Strong balance sheet• Group cash at USD991mn as at 31 December 2020• Total committed undrawn facilities at USD1.3bn as at 31 December 2020
Financial Highlights – FY20 Actual vs FY19 Actual
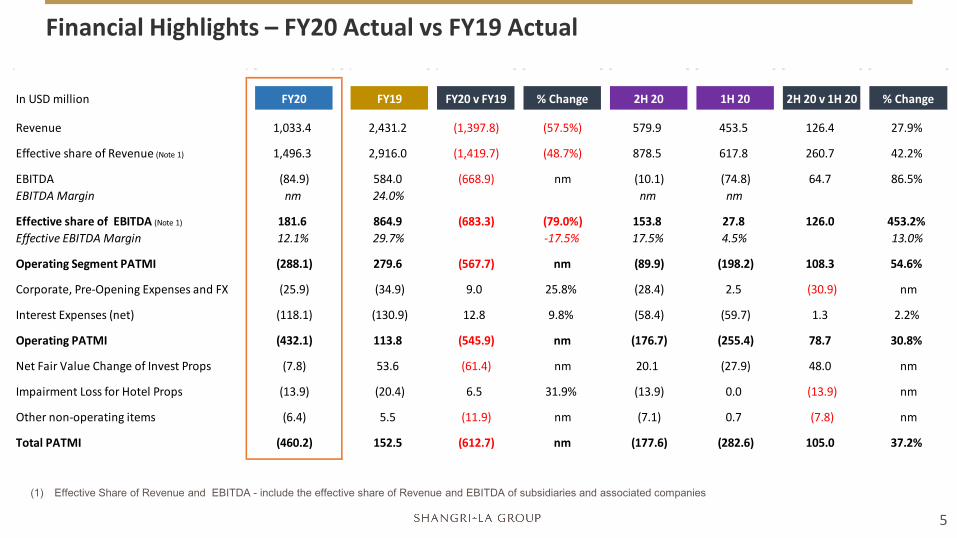
(1) Effective Share of Revenue and EBITDA - include the effective share of Revenue and EBITDA of subsidiaries and associated companies
5
In USD million FY20 FY19 FY20 v FY19 % Change 2H 20 1H 20 2H 20 v 1H 20 % Change
Revenue 1,033.4 2,431.2 (1,397.8) (57.5%) 579.9 453.5 126.4 27.9%
Effective share of Revenue (Note 1) 1,496.3 2,916.0 (1,419.7) (48.7%) 878.5 617.8 260.7 42.2%
EBITDA (84.9) 584.0 (668.9) nm (10.1) (74.8) 64.7 86.5%EBITDA Margin nm 24.0% nm nm
Effective share of EBITDA (Note 1) 181.6 864.9 (683.3) (79.0%) 153.8 27.8 126.0 453.2%Effective EBITDA Margin 12.1% 29.7% -17.5% 17.5% 4.5% 13.0%
Operating Segment PATMI (288.1) 279.6 (567.7) nm (89.9) (198.2) 108.3 54.6%
Corporate, Pre-Opening Expenses and FX (25.9) (34.9) 9.0 25.8% (28.4) 2.5 (30.9) nm
Interest Expenses (net) (118.1) (130.9) 12.8 9.8% (58.4) (59.7) 1.3 2.2%
Operating PATMI (432.1) 113.8 (545.9) nm (176.7) (255.4) 78.7 30.8%
Net Fair Value Change of Invest Props (7.8) 53.6 (61.4) nm 20.1 (27.9) 48.0 nm
Impairment Loss for Hotel Props (13.9) (20.4) 6.5 31.9% (13.9) 0.0 (13.9) nm
Other non-operating items (6.4) 5.5 (11.9) nm (7.1) 0.7 (7.8) nm
Total PATMI (460.2) 152.5 (612.7) nm (177.6) (282.6) 105.0 37.2%
518.8
(95.4)
259.4
243.9
113.3
49.0
(26.6)
(15.9)2019A 2020A
Effective Share of EBITDA by Segment – FY20 Actual vs FY19 Actual
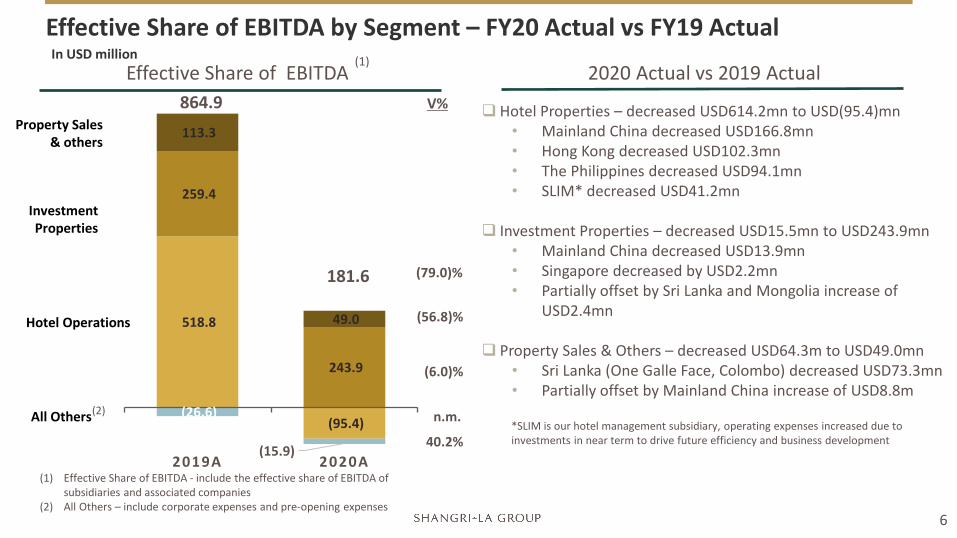
Effective Share of EBITDA (1)
(1) Effective Share of EBITDA - include the effective share of EBITDA of subsidiaries and associated companies
(2) All Others – include corporate expenses and pre-opening expenses
In USD million
Hotel Operations
Property Sales & others
Investment Properties
All Others(2)
181.6
864.92020 Actual vs 2019 Actual
Hotel Properties – decreased USD614.2mn to USD(95.4)mn• Mainland China decreased USD166.8mn• Hong Kong decreased USD102.3mn• The Philippines decreased USD94.1mn• SLIM* decreased USD41.2mn
Investment Properties – decreased USD15.5mn to USD243.9mn• Mainland China decreased USD13.9mn• Singapore decreased by USD2.2mn• Partially offset by Sri Lanka and Mongolia increase of
USD2.4mn
Property Sales & Others – decreased USD64.3m to USD49.0mn• Sri Lanka (One Galle Face, Colombo) decreased USD73.3mn• Partially offset by Mainland China increase of USD8.8m
V%
(79.0)%
(56.8)%
40.2%
(6.0)%
n.m.
6
*SLIM is our hotel management subsidiary, operating expenses increased due to investments in near term to drive future efficiency and business development
Financial Highlights – FY2020 Non-operating items
7
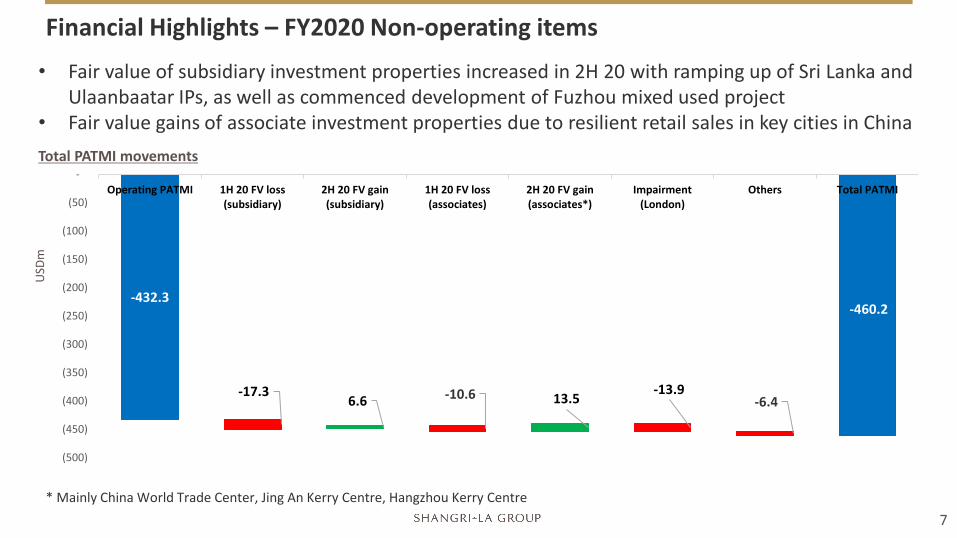
Total PATMI movements
USD
m
-432.3
-17.36.6 -10.6 13.5 -13.9
-6.4
-460.2
(500)
(450)
(400)
(350)
(300)
(250)
(200)
(150)
(100)
(50)
-Operating PATMI 1H 20 FV loss
(subsidiary)2H 20 FV gain(subsidiary)
1H 20 FV loss(associates)
2H 20 FV gain(associates*)
Impairment(London)
Others Total PATMI
* Mainly China World Trade Center, Jing An Kerry Centre, Hangzhou Kerry Centre
• Fair value of subsidiary investment properties increased in 2H 20 with ramping up of Sri Lanka and Ulaanbaatar IPs, as well as commenced development of Fuzhou mixed used project
• Fair value gains of associate investment properties due to resilient retail sales in key cities in China

Corporate Finance and Treasury Update
Cash, Debt and Gearing Summary (as at 31 Dec 2020)
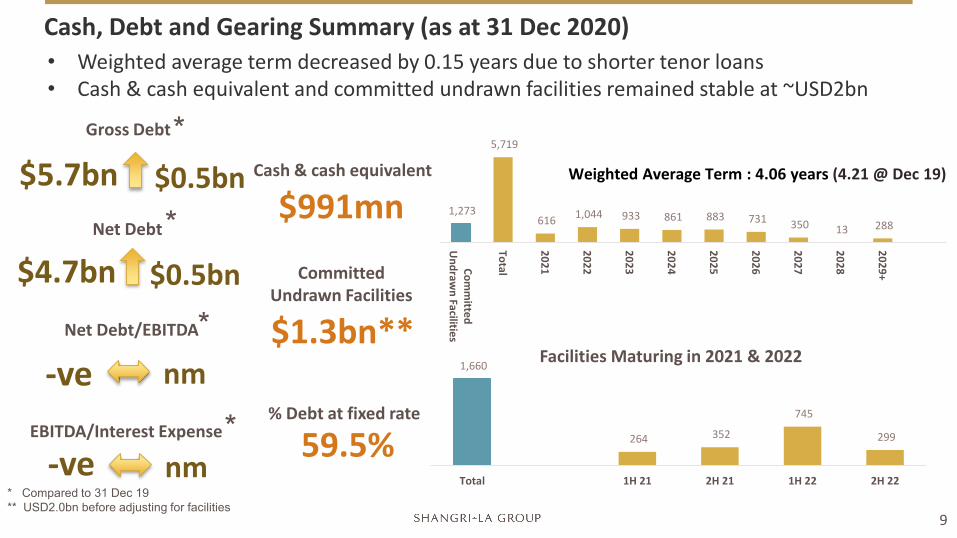
1,273
5,719
616 1,044 933 861 883 731 350 13 288
Comm
itted U
ndrawn Facilities
Total
2021
2022
2023
2024
2025
2026
2027
2028
2029+
Weighted Average Term : 4.06 years (4.21 @ Dec 19)
1,660
264 352
745
299
Total 1H 21 2H 21 1H 22 2H 22
Facilities Maturing in 2021 & 2022
9
Gross Debt
Net Debt/EBITDA
-ve nm
EBITDA/Interest Expense
nm
$5.7bn $0.5bn
$4.7bn $0.5bnNet Debt
*
*
*
* Compared to 31 Dec 19** USD2.0bn before adjusting for facilities
* $991mnCash & cash equivalent
$1.3bn**
Committed Undrawn Facilities
59.5%% Debt at fixed rate
-ve
• Weighted average term decreased by 0.15 years due to shorter tenor loans• Cash & cash equivalent and committed undrawn facilities remained stable at ~USD2bn
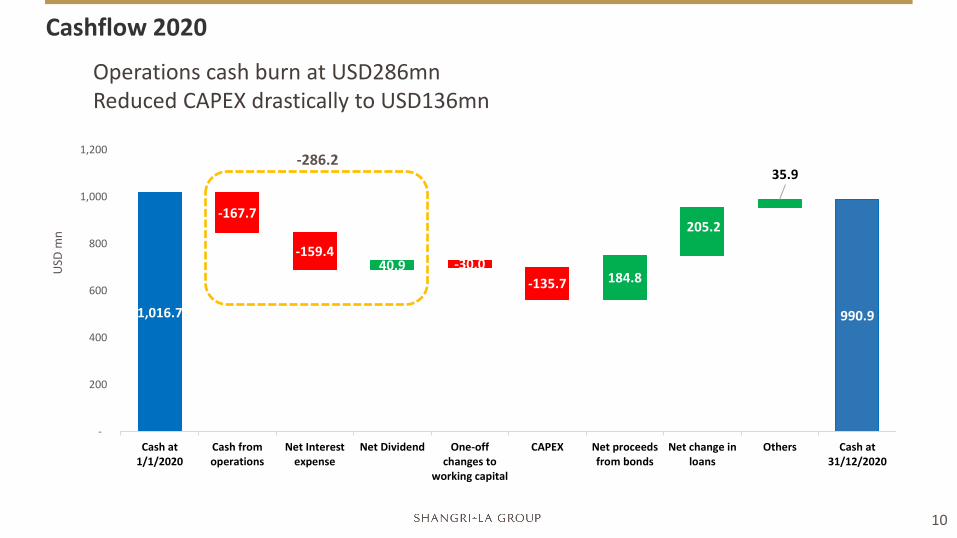
Cashflow 2020
10
USD
mn
1,016.7
-167.7
-159.440.9 -30.0
-135.7 184.8
205.2
35.9
990.9
-
200
400
600
800
1,000
1,200
Cash at1/1/2020
Cash fromoperations
Net Interestexpense
Net Dividend One-offchanges to
working capital
CAPEX Net proceedsfrom bonds
Net change inloans
Others Cash at31/12/2020
Operations cash burn at USD286mnReduced CAPEX drastically to USD136mn
-286.2
COVID-19 Update
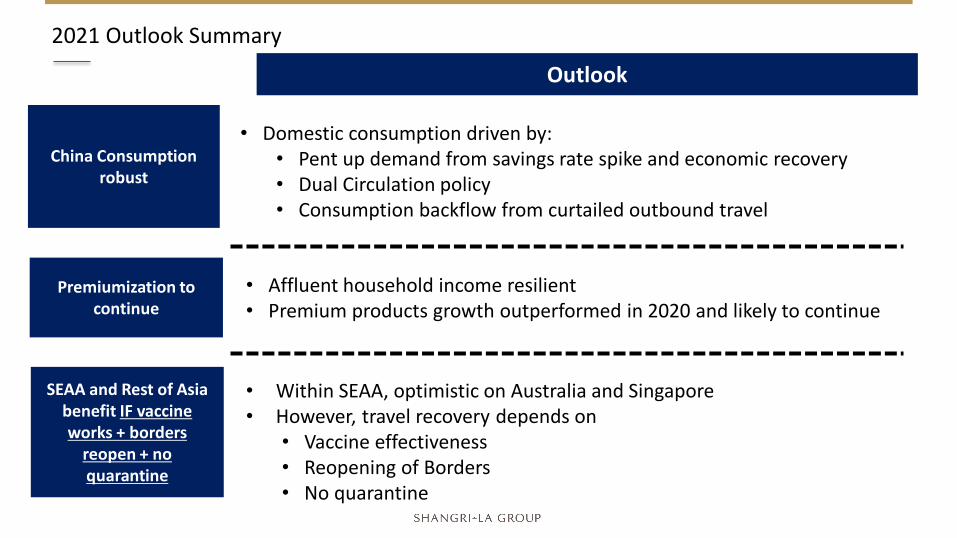
2021 Outlook Summary
• Domestic consumption driven by:• Pent up demand from savings rate spike and economic recovery• Dual Circulation policy • Consumption backflow from curtailed outbound travel
Premiumization to continue
• Affluent household income resilient• Premium products growth outperformed in 2020 and likely to continue
China Consumption robust
Outlook
SEAA and Rest of Asia benefit IF vaccine works + borders
reopen + no quarantine
• Within SEAA, optimistic on Australia and Singapore• However, travel recovery depends on
• Vaccine effectiveness• Reopening of Borders • No quarantine
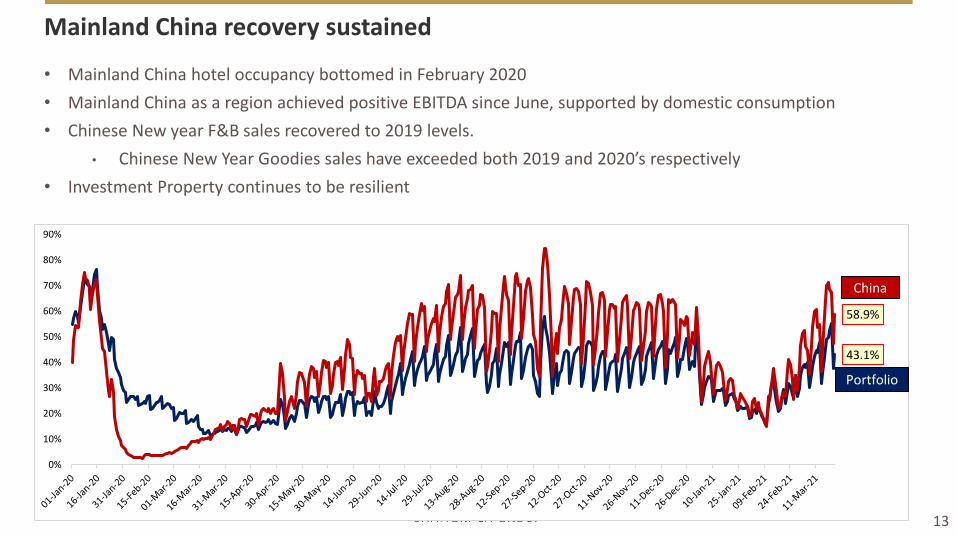
• Mainland China hotel occupancy bottomed in February 2020 • Mainland China as a region achieved positive EBITDA since June, supported by domestic consumption• Chinese New year F&B sales recovered to 2019 levels.
• Chinese New Year Goodies sales have exceeded both 2019 and 2020’s respectively • Investment Property continues to be resilient
Mainland China recovery sustained
13
43.1%
58.9%
0%
10%
20%
30%
40%
50%
60%
70%
80%
90%
China
Portfolio
Two broad strategies:
1) Drive topline (China) • continue to drive topline leveraging on China consumption growth
2) Cost and cash management (Non-China) • Extended voluntary wage reduction of senior staff and directors by up to 30%• Apply voluntary no-pay leave for others, hiring freeze• 2021 to see full year impact on restructuring and streamlining of operational and headcount costs
At Group level: • Proposed no final dividend for 2020• Discipline approach towards 2021 CAPEX
Strategy looking ahead
14

Appendix15
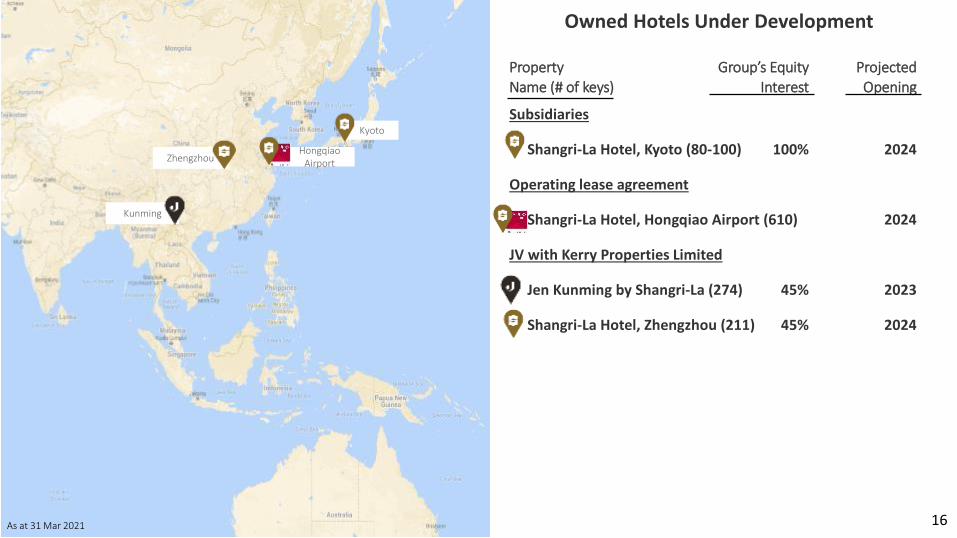
Owned Hotels Under Development
Property Group’s Equity Projected Name (# of keys) Interest Opening
Subsidiaries
• Shangri-La Hotel, Kyoto (80-100) 100% 2024
Operating lease agreement
• Shangri-La Hotel, Hongqiao Airport (610) 2024
JV with Kerry Properties Limited
• Jen Kunming by Shangri-La (274) 45% 2023
• Shangri-La Hotel, Zhengzhou (211) 45% 2024
HongqiaoAirportZhengzhou
Kunming
16
Kyoto
As at 31 Mar 2021
Shanghai
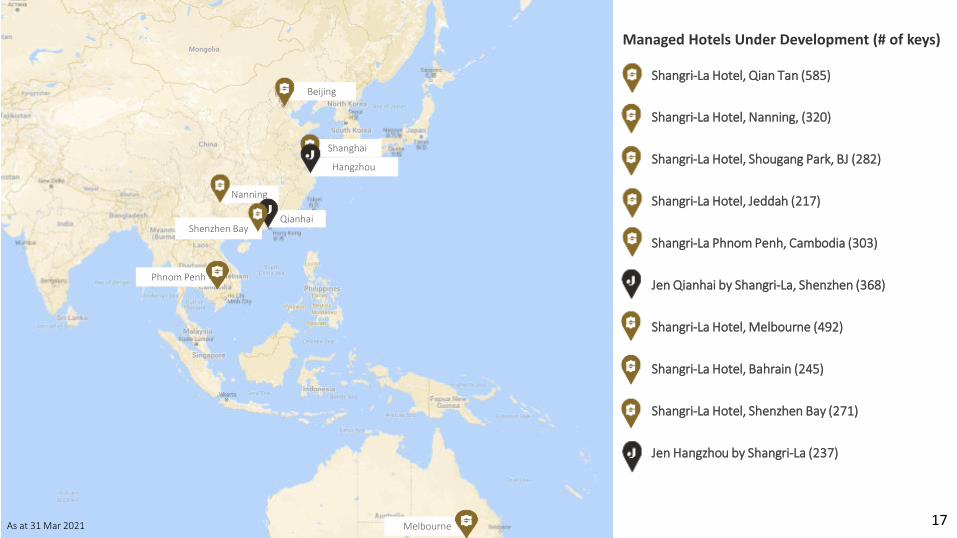
• Shangri-La Hotel, Qian Tan (585)
• Shangri-La Hotel, Nanning, (320)
• Shangri-La Hotel, Shougang Park, BJ (282)
• Shangri-La Hotel, Jeddah (217)
• Shangri-La Phnom Penh, Cambodia (303)
• Jen Qianhai by Shangri-La, Shenzhen (368)
• Shangri-La Hotel, Melbourne (492)
• Shangri-La Hotel, Bahrain (245)
• Shangri-La Hotel, Shenzhen Bay (271)
• Jen Hangzhou by Shangri-La (237)
Nanning
Phnom Penh
Managed Hotels Under Development (# of keys)
Melbourne 17
Beijing
Qianhai
Hangzhou
As at 31 Mar 2021
Shenzhen Bay
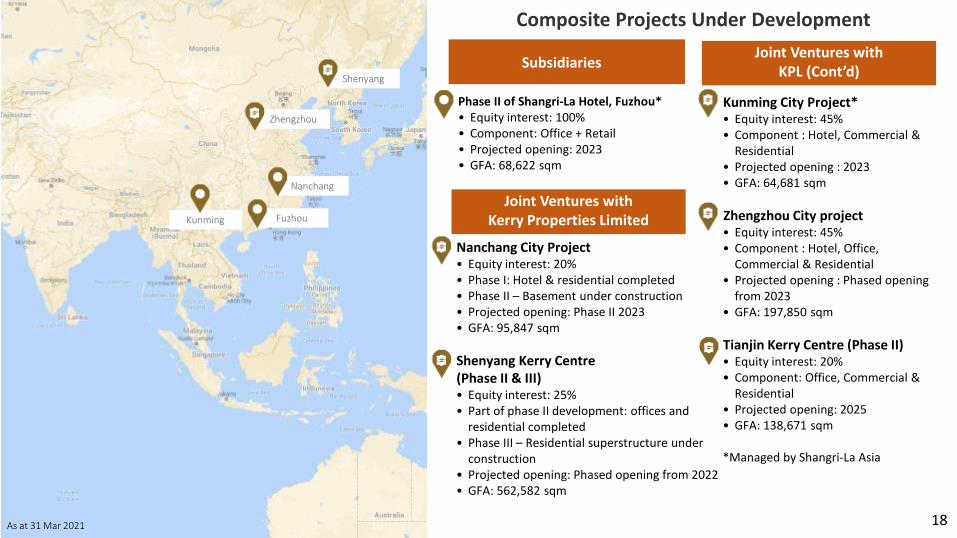
• Nanchang City Project • Equity interest: 20%• Phase I: Hotel & residential completed• Phase II – Basement under construction• Projected opening: Phase II 2023• GFA: 95,847 sqm
• Shenyang Kerry Centre (Phase II & III)• Equity interest: 25%• Part of phase II development: offices and
residential completed • Phase III – Residential superstructure under
construction• Projected opening: Phased opening from 2022• GFA: 562,582 sqm
• Kunming City Project*• Equity interest: 45%• Component : Hotel, Commercial &
Residential• Projected opening : 2023• GFA: 64,681 sqm
• Zhengzhou City project • Equity interest: 45%• Component : Hotel, Office,
Commercial & Residential • Projected opening : Phased opening
from 2023• GFA: 197,850 sqm
• Tianjin Kerry Centre (Phase II)• Equity interest: 20%• Component: Office, Commercial &
Residential• Projected opening: 2025• GFA: 138,671 sqm
*Managed by Shangri-La Asia
• Phase II of Shangri-La Hotel, Fuzhou*• Equity interest: 100%• Component: Office + Retail• Projected opening: 2023• GFA: 68,622 sqm
Composite Projects Under Development
Zhengzhou
Nanchang
Shenyang
As at 31 Mar 2021
FuzhouKunming
Joint Ventures with KPL (Cont’d)Subsidiaries
18
Joint Ventures with Kerry Properties Limited
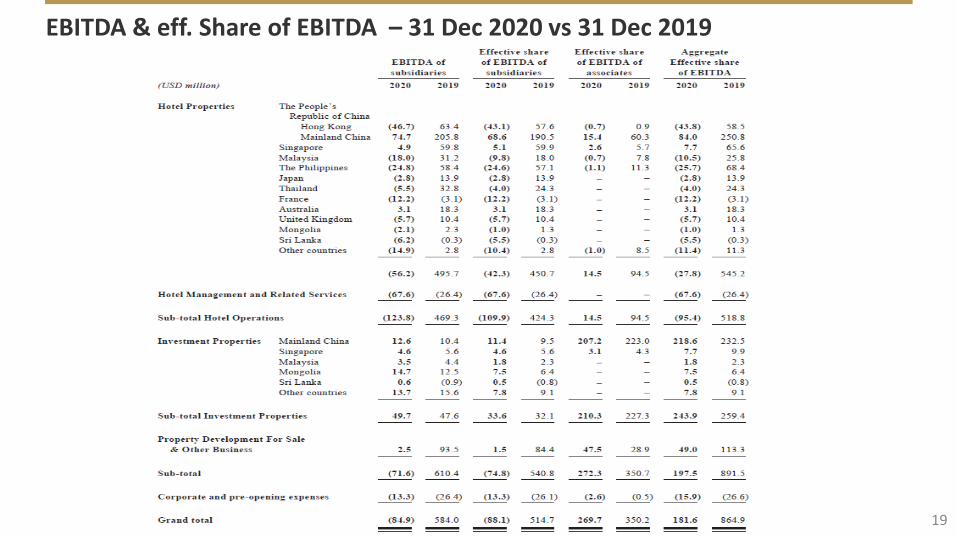
EBITDA & eff. Share of EBITDA – 31 Dec 2020 vs 31 Dec 2019
19


