www.pwc.de/share-economy Share Economy 2017 The New Business Model This report analyzes the size and the acceptance of the Share Economy in the six European countries Austria, Belgium, Germany, the Netherlands, Switzerland and Turkey. It explores current status, growth, success factors for further breakthrough and mass acceptance.
Transcript
www.pwc.de/share-economy
Share Economy 2017The New Business Model
This report analyzes the size and the acceptance of the Share Economy in the six European countries Austria, Belgium, Germany, the Netherlands, Switzerland and Turkey. It explores current status, growth, success factors for further breakthrough and mass acceptance.
This report analyzes the size and the acceptance of the Share Economy in the six European countries Austria, Belgium, Germany, the Netherlands, Switzerland and Turkey. It explores current status, growth, success factors for further breakthrough and mass acceptance.
Published by PricewaterhouseCoopers GmbH Wirtschaftsprüfungsgesellschaft
By Prof Dr Nikolas Beutin
February 2018, 58 Pages, 7 Figures, Soft cover
All rights reserved. This material may not be reproduced in any form, copied onto microfilm or saved and edited in any digital medium without the explicit permission of the editor.
This publication is intended to be a resource for our clients, and the information therein was correct to the best of the authors’ knowledge at the time of publication. Before making any decision or taking any action, you should consult the sources or contacts listed here. The opinions reflected are those of the authors. The graphics may contain rounding differences.
Share Economy 2017 5
Preface
Preface
Sharing of files, music, cars, accommodation, machines and other things has become an indispensable and virtually irreplaceable part of many people’s increasingly digital lifestyles. In fact, most of us cannot imagine living and especially traveling without shared products and services.
Just as smartphones disrupted photography and displaced private film and photo cameras, the Share Economy has a disruptive potential of displacing people’s ownership with temporary use of products and services.
In theory the Share Economy is supposed to:• Save resources,• Strengthen regional and local
communities,• Save costs,• Enable consumption for lower income
groups,• Increase investments,• Provide new jobs,• Ensure access and • Ultimately generate more freedom.
But how does the reality look like? The reality assumes different forms in different countries: Share Economy is mainly attributable to selected population segments and cannot live up to its ecological original philosophy. Also, it is moving more and more from its peer-to-peer (P2P) beginning and original idea to professional providers (B2C) – a similar development has been seen at auction platforms.
Also, the different industry segments within the Share Economy are at very different maturity levels. Moreover, regulations and technological possibilities as well as the so often looked at start-ups and platforms for the Share Economy differ greatly per country.
In the final analysis, there is to our knowledge no currently valid and reliable market study to really estimate current and future market size of the Share Economy in the different industry segments.
The present report aims to analyze what really matters to customers and providers with regard to the Share Economy. It seeks to explore factors that are highly relevant for its further growth.
In this report, we look at the Share Economy in the following industry segments:• Media and Entertainment,• Hotels and Accommodation,• Automotive and Transport,• Retail and Consumer Goods, • Services,• Finance, and • Machinery.
The report is based on a representative survey of over 4,500 consumers in the six countries Austria, Belgium, Germany, the Netherlands, Switzerland and Turkey carried out by the market research institute Faktenkontor GmbH between June and August 2017.
All in all, we believe that the future looks extremely promising for future Share Economy growth and acceptance in the six countries.
Please reach out to us for a discussion on the results of this report.
Prof Dr Nikolas BeutinCustomer Practice Leader PwC Europe
6 Share Economy 2017
Table of contents
Table of contents
Table of figures.........................................................................................................7
A Share Economy widely accepted and used ..........................................................8
B Share Economy 2017 – Country Deep Dive ....................................................... 171 Germany ..........................................................................................................182 Austria .............................................................................................................213 Switzerland ......................................................................................................244 The Netherlands ..............................................................................................275 Belgium ...........................................................................................................306 Turkey ..............................................................................................................33
C Share Economy 2017 – Industry Deep Dive ......................................................361 Hotels and Accommodation .............................................................................372 Automotive and Transportation .......................................................................393 Retail and Consumer Goods .............................................................................424 Services ...........................................................................................................455 Finance ............................................................................................................486 Media and Entertainment ................................................................................517 Machinery ........................................................................................................53
Fig. 1 Share Economy usage within the different industry segments .....................9
Fig. 2 Average frequency of Share Economy usage within the different industry segments per user ........................................................................10
Fig. 3 Current and planned average Share Economy spending per user by country ..........................................................................................11
Fig. 4 Differences in Share Economy spending per gender by industry ................12
Fig. 5 Percentage of overall Share Economy usage and spending of user segment <40 years .........................................................................13
Fig. 6 Percentage of overall Share Economy usage and spending of user segment with higher education ...................................................... 14
Fig. 7 Perceived benefits from Share Economy usage ..........................................15
Share Economy widely accepted and used
A Share Economy widely accepted and used
8 Share Economy 2017
Share Economy 2017 9
Share Economy widely accepted and used
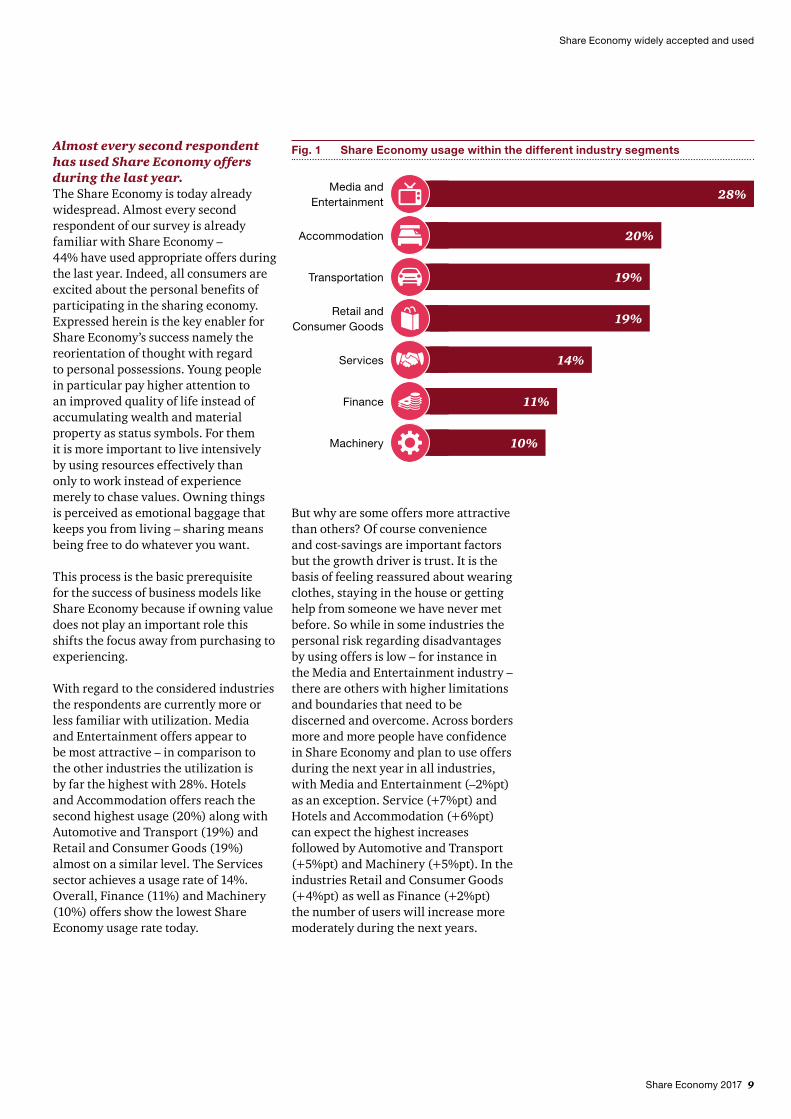
Almost every second respondent has used Share Economy offers during the last year.The Share Economy is today already widespread. Almost every second respondent of our survey is already familiar with Share Economy – 44% have used appropriate offers during the last year. Indeed, all consumers are excited about the personal benefits of participating in the sharing economy. Expressed herein is the key enabler for Share Economy’s success namely the reorientation of thought with regard to personal possessions. Young people in particular pay higher attention to an improved quality of life instead of accumulating wealth and material property as status symbols. For them it is more important to live intensively by using resources effectively than only to work instead of experience merely to chase values. Owning things is perceived as emotional baggage that keeps you from living – sharing means being free to do whatever you want.
This process is the basic prerequisite for the success of business models like Share Economy because if owning value does not play an important role this shifts the focus away from purchasing to experiencing.
With regard to the considered industries the respondents are currently more or less familiar with utilization. Media and Entertainment offers appear to be most attractive – in comparison to the other industries the utilization is by far the highest with 28%. Hotels and Accommodation offers reach the second highest usage (20%) along with Automotive and Transport (19%) and Retail and Consumer Goods (19%) almost on a similar level. The Services sector achieves a usage rate of 14%. Overall, Finance (11%) and Machinery (10%) offers show the lowest Share Economy usage rate today.
Fig. 1 Share Economy usage within the different industry segments
28%
20%
19%
19%
14%
11%
10%
Media and Entertainment
Transportation
Finance
Accommodation
Services
Retail and Consumer Goods
Machinery
But why are some offers more attractive than others? Of course convenience and cost-savings are important factors but the growth driver is trust. It is the basis of feeling reassured about wearing clothes, staying in the house or getting help from someone we have never met before. So while in some industries the personal risk regarding disadvantages by using offers is low – for instance in the Media and Entertainment industry – there are others with higher limitations and boundaries that need to be discerned and overcome. Across borders more and more people have confidence in Share Economy and plan to use offers during the next year in all industries, with Media and Entertainment (–2%pt) as an exception. Service (+7%pt) and Hotels and Accommodation (+6%pt) can expect the highest increases followed by Automotive and Transport (+5%pt) and Machinery (+5%pt). In the industries Retail and Consumer Goods (+4%pt) as well as Finance (+2%pt) the number of users will increase more moderately during the next years.
10 Share Economy 2017
Share Economy widely accepted and used
The increasing number of Share Economy users during the next years is mainly driven by a high expected rise in Turkey (+7%pt) and Switzerland (+4%pt) which already represent the highest usage within the examined countries. Austria is expected to see usage increase by +2%pt, Germany along with Belgium will remain almost stable (+1%pt). In the Netherlands significantly fewer people plan to use Share Economy offers during the next years. There, usage is expected to decrease by –8%pt bringing the Netherlands to the lowest level regarding usage together with Belgium (37%).
Fig. 2 Average frequency of Share Economy usage within the different industry segments per user
Transportation
9.5%
Retail and Consumer Goods
8.6%33.3%
Media and Entertainment
5.6% 5.4% 5.0% 4.9%
Machinery Finance Accommodation Services
Media and Entertainment consistently shows the highest frequency across all examined countries, followed by the industries Automotive and Transport and Retail and Consumer each containing one exception, namely Switzerland, where Retail and Consumer is on a par with Hotels and Accommodation, Service and Finance.
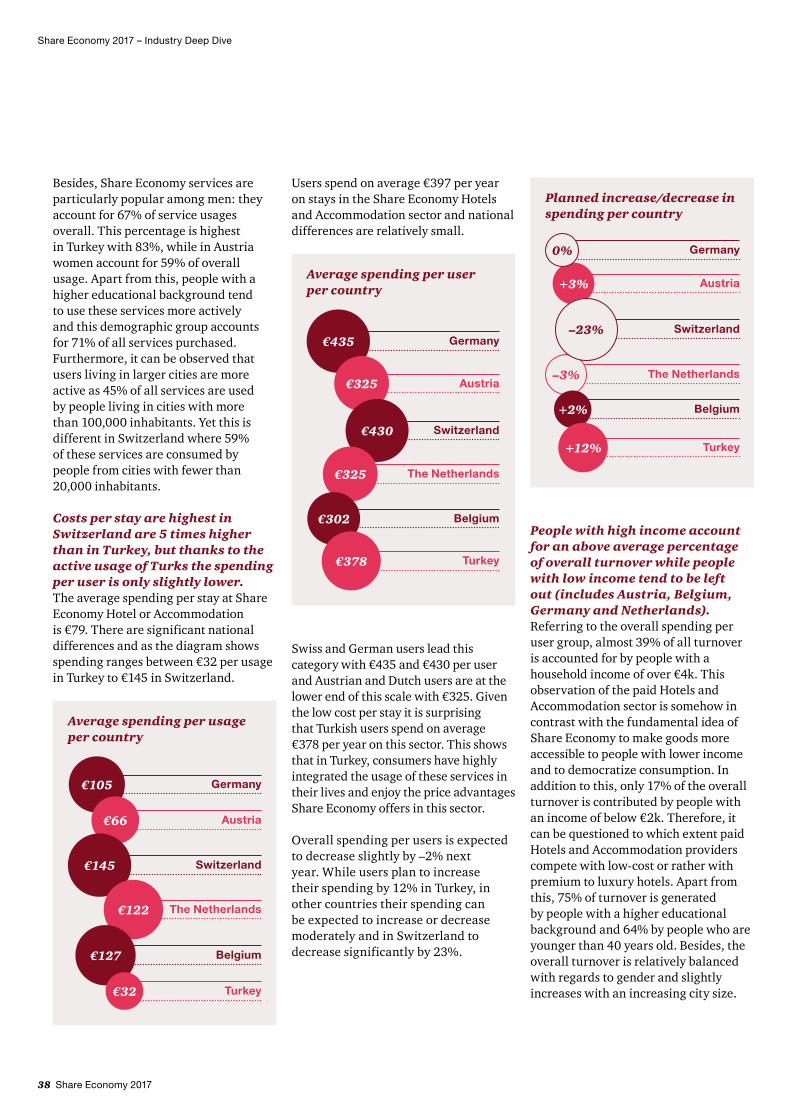
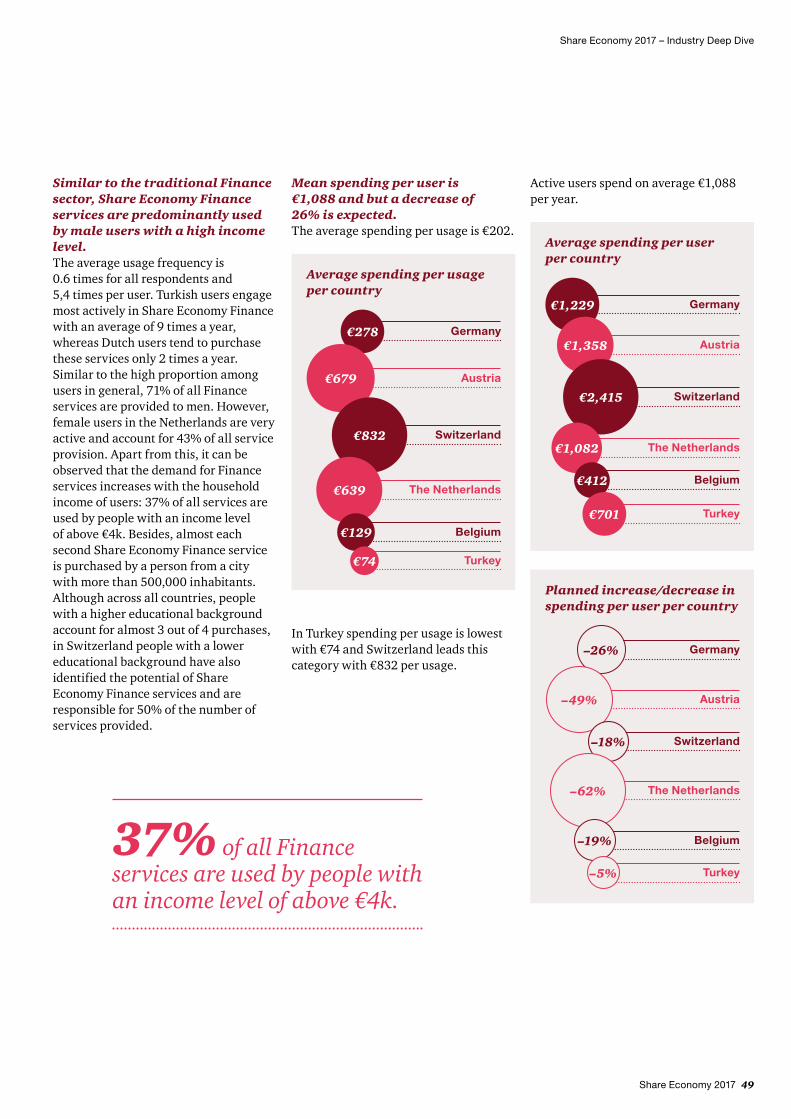
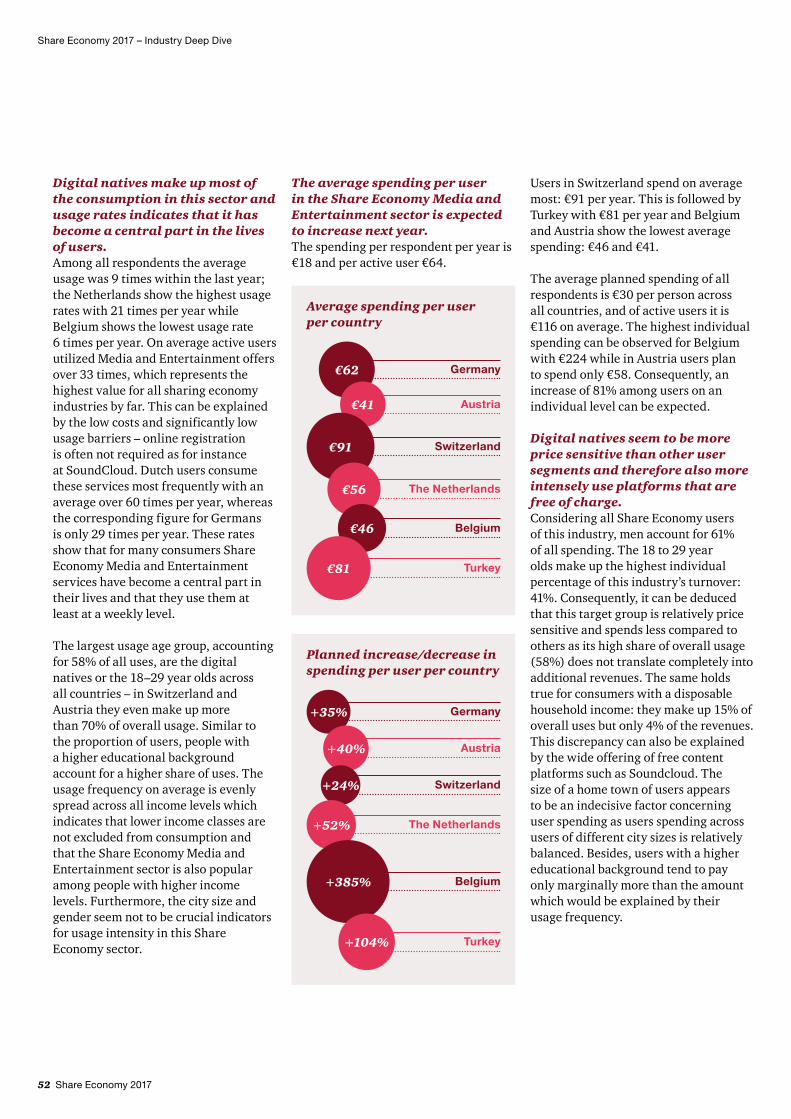
In the past year Share Economy users spent on average €816 on Share Economy offers. In comparison to the usage of 35 times on average this indicates €23 per usage. The industry Finance shows above-average spending (€1,088 per year) while the other industries (except Media and Entertainment) ranged between €200 and €400. Media and Entertainment shows average expenses of less than €100 per year.
Across all countries, users of Share Economy plan lower expenses for Finance (–26%) and Hotels and Accommodation (–2%) for the upcoming year. However all other industries expect a strong increase in spending of at least 10%. For Machinery users plan to raise spending by +5%.
Based on a cross-border average users utilized Share Economy offers 35 times per user during the past year which is predominantly driven by the industry sector Media and Entertainment (33 times per user per year). Automotive and Transport and Retail and Consumer are ranked as the second highest with a usage frequency of 9 times per user per year, followed by Machinery with 6 times. Hotels and Accommodation, Services and Finance reach a usage frequency of 5 times per user per year.
Share Economy 2017 11
Share Economy widely accepted and used
Current spending per user Planned spending per user Percentage increase/decrease
Fig. 3 Current and planned average Share Economy spending per user by country
Within all countries Turkey shows the highest average spending on Share Economy offers during the past year (€1,031 per user) followed by Switzerland with €939. German users spent on average €884, Belgians €615, Austrian €599 and Dutch users €506. For the upcoming year Turkish, Belgian, Swiss and German users plan to increase spending whereas Austrian and Dutch users plan to spend less on Share Economy.
Men show a higher usage and higher spending on Share Economy than women.But who are the users of Share Economy? Overall, the gender breakdown regarding Share Economy utilization is rather balanced – 51% of the overall Share Economy users are men. Relative to women men show a significantly higher usage rate across all industries except Retail and Consumer Goods
(women 57%). Within the industries Finance (64%), Machinery (62%) and Automotive (58%) men are overrepresented – the same distribution applies to Germany and Austria. Switzerland and the Netherlands are very similar. Belgium shows the most significant disparity between genders with a very dominant male usage share across all industries. However, Turkey, in contrast to all other countries, shows a slightly higher share of female users across all industries except for Service, Finance and Machinery.
In general men also spend significantly more on Share Economy than women. Although men use Share Economy offers for Hotels and Accommodation as well as Automotive and Transport much more often, women show on average slightly higher spending on these respective industries.
12 Share Economy 2017
Share Economy widely accepted and used
Fig. 4 Differences in Share Economy spending per gender by industry
Share of Share Economy users Average spending per user
Men Women
Accommodation
Automotive
Finance
Machinery
Retail and Consumer Goods
Services
Media and Entertainment
46%€446
42%€326
36%€1,116
38%€245
46%€54
57%€177
45%€295
54%€356
58%€226
64%€1,072
62%€206
54%€73
43%€270
55%€203
Share Economy attracts younger adults – every second user is under 40 years.Not quite surprisingly, across all countries and considered industries Share Economy attracts especially younger adults – almost every second user is under 40 years (53%). Across all industries the usage decreases with increasing age. Within the considered industries Finance shows the highest share of young adults under 40 years (66%) – the number of users older than 40 is greater in Services (especially for households) than is the case in the other industries.
Turkish users show the lowest average age with 37.8 years. In Belgium, the Netherlands, Austria and Germany the average age of Share Economy users is around 41. On average Swiss users are the oldest within the countries (43.2 years). Thus, young adult users (<40 years) account for more than 50% of all Share Economy spending across all countries and industries with very few exceptions. In Austria and Switzerland young adults spend less on Service offers, thus reaching only a share of <40% in this respective industry. In the Netherlands as well as in Belgium young adults show an expenditure share of only 33% and 22% within the Finance industry.
Young adults are the engine for Share Economy’s current triumphal march. But that does not mean that older people are decoupled from this trend as the group of people >60 years attains an average usage rate of 15% across all considered countries. However, with a 9% share of spending on Share Economy, there is room for improvement regarding their profitability. Particularly in view of the gathering pace of demographic change it is important for Share Economy providers not to miss responding to older peoples’ needs to exploit full sales potential in the near future.
Share Economy 2017 13
Share Economy widely accepted and used
Fig. 5 Percentage of overall Share Economy usage and spending of user segment <40 years
Share of Share Economy users <40 years
Share of spending by Share Economy users <40 years
53%64%
OverallUsers younger than
40 years (53% of Share Economy users)
contribute 64% to overall Share
Economy spending
53%56%
56%69%
53%62%
52%59%
45%68%
58%67%
Germany
Switzerland
Belgium
Netherlands
Turkey
Austria
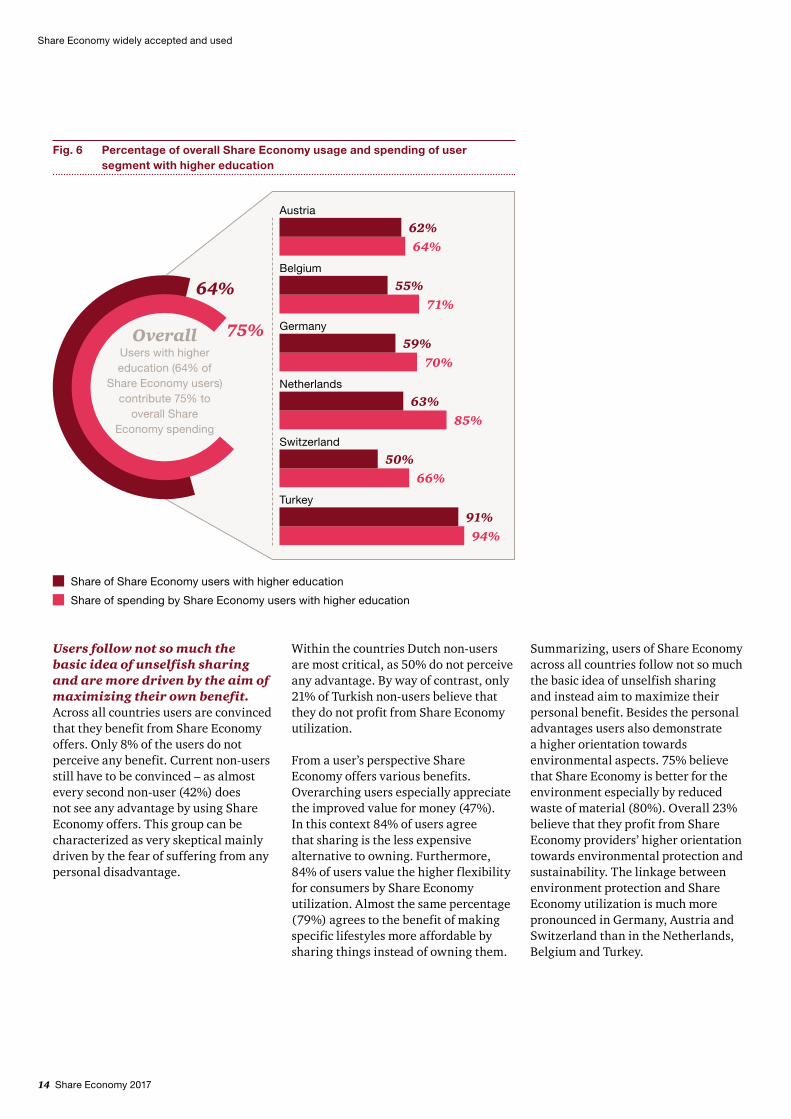
Users of Share Economy offers possess a higher education level.Originally, one of the main philosophies of the Share Economy has been to be “socially oriented” and enable consumption (e.g. vacation at private accommodation cheaper than hotels) for everybody. However, our figures of today’s situation tell a slightly different story.
Regarding education background across all countries and industries the majority of Share Economy users possesses a higher education level – on average 64% have achieved high school graduation or higher. Automotive and Transport (73%) along with Hotels and Accommodation (70%) reach an above-average share of highly educated users.
With respect to the specific countries of Austria and Turkey the share of users with a higher education level is equal to
their expenditure share. For example, 62% of Austrian Share Economy users have high school graduation or higher and this group represents 64% of overall spending on Share Economy in Austria.
In all other countries the expenditure share of highly educated people exceeds their user share significantly with strongest characteristics in the Netherlands where 63% of users are educated more highly but represent 85% of total spending on Share Economy.
This means that, especially for Share Economy providers in Germany, Switzerland, the Netherlands and Belgium, it is important to attract more consumers with high school graduation or higher as they show an even higher willingness to pay for Share Economy offers compared to lower educated users.
14 Share Economy 2017
Share Economy widely accepted and used
Fig. 6 Percentage of overall Share Economy usage and spending of user segment with higher education
Share of Share Economy users with higher education
Share of spending by Share Economy users with higher education
64%
75%OverallUsers with higher education (64% of
Share Economy users) contribute 75% to
overall Share Economy spending
62%64%
55%71%
59%70%
63%85%
50%66%
91%94%
Germany
Switzerland
Belgium
Netherlands
Turkey
Austria
Users follow not so much the basic idea of unselfish sharing and are more driven by the aim of maximizing their own benefit.Across all countries users are convinced that they benefit from Share Economy offers. Only 8% of the users do not perceive any benefit. Current non-users still have to be convinced – as almost every second non-user (42%) does not see any advantage by using Share Economy offers. This group can be characterized as very skeptical mainly driven by the fear of suffering from any personal disadvantage.
Within the countries Dutch non-users are most critical, as 50% do not perceive any advantage. By way of contrast, only 21% of Turkish non-users believe that they do not profit from Share Economy utilization.
From a user’s perspective Share Economy offers various benefits. Overarching users especially appreciate the improved value for money (47%). In this context 84% of users agree that sharing is the less expensive alternative to owning. Furthermore, 84% of users value the higher flexibility for consumers by Share Economy utilization. Almost the same percentage (79%) agrees to the benefit of making specific lifestyles more affordable by sharing things instead of owning them.
Summarizing, users of Share Economy across all countries follow not so much the basic idea of unselfish sharing and instead aim to maximize their personal benefit. Besides the personal advantages users also demonstrate a higher orientation towards environmental aspects. 75% believe that Share Economy is better for the environment especially by reduced waste of material (80%). Overall 23% believe that they profit from Share Economy providers’ higher orientation towards environmental protection and sustainability. The linkage between environment protection and Share Economy utilization is much more pronounced in Germany, Austria and Switzerland than in the Netherlands, Belgium and Turkey.
Share Economy 2017 15
Share Economy widely accepted and used
Lack of clarity about liability in case of problems and damage is a major obstacle to further market penetration.Regarding disadvantages of Share Economy utilization users across all countries commonly criticize the unclear liability situation in case of problems and damage (44%). Furthermore, downsides include the lack of quality standards (30%) and security (29%). Countries such as Germany, Austria and Switzerland seem to be particularly critical regarding these topics. Especially Turkish users also show a high sensitivity towards non-transparent prices and costs.
The guarantee of being an expert to ensure sufficient insurance protection has highest impact on attractiveness of Share Economy in addition to pricing transparency.To increase attractiveness, for users as well as current non-users, ensuring that providers have sufficient insurance protection (36%) is the most important lever. Additionally, reassuring users that real professionals are taking care of them (e.g. electrician) would also have a significant effect on attractiveness (36%). This is mainly driven by users’ concern that anyone could easily become a self-proclaimed
expert offering Share Economy services (65%). Personal security is an important factor to increase acceptance of Share Economy on the one hand. On the other hand higher transparency is an important criterion as well: 36% of Share Economy users agree that higher transparency relating to prices would increase attractiveness.
Especially the Austrian and Swiss users would also appreciate higher transparency regarding compliance with legal regulations. Furthermore, in particular Turkish and Dutch users would also be attracted by improved data protection.
Fig. 7 Perceived benefits from Share Economy usage
User Non-users
47%27%
25%16%
24%9%
23%19%
22%14%
21%9%
19%15%
Easier and more convenient access and availability of providers
Higher customer value
More direct and personal interaction
Higher attention to environmental protection and sustainability
Greater product/service portfolio
Better price for the same service
Being part of a “community”
8%42%
I don’t see any advantages
16 Share Economy 2017
Share Economy widely accepted and used
Personal recommendations increase trust in Share Economy offersConsumers of Share Economy offers seek to maximize personal benefit. Therefore, they have to distinguish “good” from “bad” offers. For better orientation, across all countries, the majority trusts in personal referral. 79% of users agree to be willing to test a Share Economy offer if a trusted person gives a recommendation. In addition, 66% of users value “technologies” such as Social Media which offer the possibility of adding a face to an offer, thus increasing users’ trust.
Overall Share Economy companies are already positioned in the consumer’s mindset as a serious competitor of traditional providers (74%). But with regard to the considered industries Media and Entertainment is the only sector with higher trust towards Share Economy providers compared to conventional providers. In all other industries traditional providers enjoy higher confidence. Turkey is the only exception in this respect as not only Media and Entertainment users but also users in the Automotive industry show higher trust towards Share Economy providers.
Share Economy is here to stay – the majority of respondents expects Share Economy not only to be a short-term trend but an important, sustainable future market.In conclusion the principle of Share Economy is nothing new as it is the basic idea of a cooperative society model. What distinguishes current Share Economy from that is the higher attention to a cooperative economy, which makes this trend appear more as a new version of capitalist growth. And the new idea of sharing is the future.
On average 63% of respondents expect that Share Economy is not only a short-term trend. Across all countries there is also a consensus that Share Economy is closely linked to societal and economic changes. In this context 72% support the idea that these changes will have an impact on the job market and will lead to a shift from traditional 40-hour jobs to having multiple sources of income becoming the norm in 2030. Regarding this, more than every second respondent (52%) believes that Share Economy will destroy jobs in traditional companies. Beside this negative impact on traditional jobs, 60% of respondents perceive Share Economy as creating a strong community since society benefits from the basic idea of sharing (72%). However 48% of respondents expect that the character of Share Economy will change in the future as the basic idea of sharing will be entirely replaced by making profit by 2030.Share Economy is here to stay –
the majority of respondents expects Share Economy to be a sustainable future market.
Share Economy 2017 – Country Deep Dive
B Share Economy 2017 – Country Deep Dive
Share Economy 2017 17
18 Share Economy 2017
Share Economy 2017 – Country Deep Dive
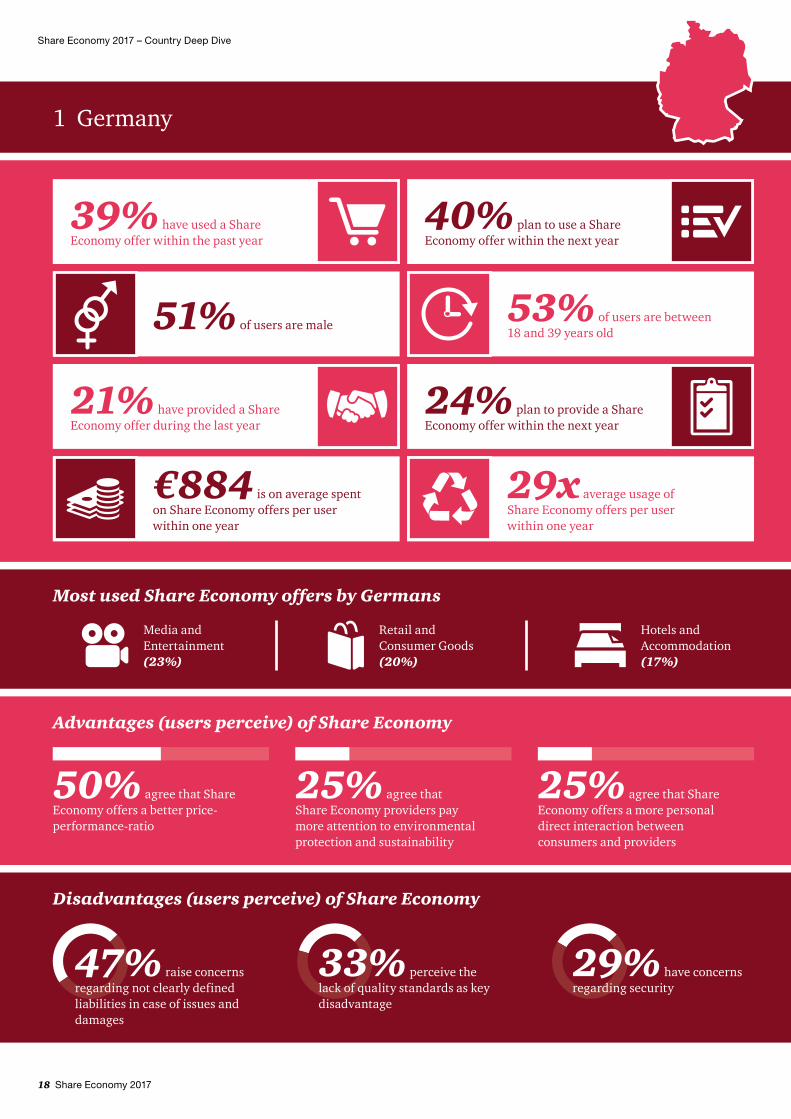
1 Germany
40% plan to use a Share Economy offer within the next year
53% of users are between 18 and 39 years old
24% plan to provide a Share Economy offer within the next year
39% have used a Share Economy offer within the past year
51% of users are male
21% have provided a ShareEconomy offer during the last year
€884 is on average spent on Share Economy offers per user within one year
29x average usage of Share Economy offers per user within one year
47% raise concerns regarding not clearly defined liabilities in case of issues and damages
33% perceive the lack of quality standards as key disadvantage
29% have concerns regarding security
Disadvantages (users perceive) of Share Economy
Most used Share Economy offers by Germans
Media and Entertainment (23%)
Retail and Consumer Goods (20%)
Hotels and Accommodation (17%)
Advantages (users perceive) of Share Economy
50% agree that Share Economy offers a better price-performance-ratio
25% agree that Share Economy providers pay more attention to environmental protection and sustainability
25% agree that Share Economy offers a more personal direct interaction between consumers and providers
Share Economy 2017 19
Share Economy 2017 – Country Deep Dive
Germany has the second largest Share Economy market of the six countries subject to the survey with an overall market size of €22.9bn.Germany belongs to the leading economies in terms of GDP, which is why the country’s Share Economy potential requires a closer look. Based on the answers of the 2,000 respondents in Germany, PwC estimates the Share Economy size in Germany to be €22.9bn. The sector with the highest turnover in Germany is Finance with €7.7bn turnover, followed by Hotels and Accommodation (€5bn) and Automotive and Transportation (€3.5bn). The sector Retail and Consumer Goods is worth €2.6bn while Services generate €2.2bn and Media and Entertainment €1.0bn; Machinery is estimated at €0.8bn.
The overall Share Economy market is expected to increase by 5.3% next year to a market size of €24.1bn. This is based on the planned spending of users. Other sectors are expected to increase with the highest growth rates in Machinery (+43%), Media and Entertainment (+26%) and Services (+25%).
39% of Germans use Share Economy services. While Media and Entertainment has the highest user rate, average spending of users is highest for finance services.It was revealed that 39% of Germans have used a Share Economy service within the past year which represents the second lowest adoption rate of all six examined countries. Only the acceptance of sharing services of Belgians is lower. Within the considered industries Media and Entertainment shows the highest usage rate (23%), followed by Retail and Consumer Goods (20%) and Hotels and Accommodation (17%).
Regarding next year overall only slightly more respondents plan to participate in sharing economy as consumers (+1%pt) but with regard to the specific industries some show a significant increase.
Especially Germans plan to intensify usage of Service offers (+5%pt) along with Hotels and Accommodation (+4%pt), Automotive (+4%pt) and Machinery (+4%pt).
On average German users utilize Share Economy services 29.2 times per year mainly driven by Media and Entertainment (29.1 times per user per year) and Retail and Consumer Goods (8 times per user per year).
During the last year every German user spent on average €884 on Share Economy offers. In terms of industry turnover, users spend most on Finance services with an average spending of €1,229 per user, whereas the mean spending in the Media and Entertainment sector is the lowest (€62).
Overall, 2% more Germans plan to make use of Share Economy services in the course of next year. Industries such as Machinery and Services can expect a higher relative increase while Media and Entertainment might face a decrease in users (–8%). In addition, potential spending is expected to increase by 5% in comparison to this year’s individual spending. This trend is mostly driven by an increase in the planned spending in Media and Entertainment (+35%).
Slightly more men than women use Share Economy services. Usage and spending decrease significantly with increasing age.Taking a closer look into user characteristics, it can be seen that there is almost an even split of female and male users in Germany. Despite the slightly higher amount of male users (51%), women spend a bit more on Share Economy services while men have a higher usage frequency. Women also account more for Hotels and Accommodation services (60%), Retail and Consumer Goods as well as Services (62% each); however, more of the turnover of Machinery (65%), Media and Entertainment (61%) and Finance (57%) services and products is ascribed to male users.
Furthermore, the results indicate that females use sharing services in Machinery as well as Retail and Consumer Goods more often, but men have a higher usage in all remaining industries, especially Finance, Automotive and Transportation and Services. After all, demand for 86% of Finance services is attributable to men. Therefore, although male users have a higher affinity to make more frequent use of Share Economy offers in industries such as Hotels and Accommodation, Automotive and Transportation and Services, their willingness to pay is lower than that of females.
The German Share Economy market also reveals that user rate as well as usage rate decreases with increasing age. 53% of current users are between 18–40 years old, they account for a greater percentage of sharing services (68%) and contribute more than half of total spending (62%). Industry-wise, this age group generates more than 70% of turnover in Retail and Consumer Goods, Services and Hotels and Accommodation and in addition account for the majority of the usages of Finance (85%) and Machinery (83%). On the other hand, almost half of the spending in Automotive and Transportation can be attributed to users above 50 years.
People with a higher educational level tend to use Share Economy more often and spend more money. Share Economy spending increases with disposable income.The majority of Share Economy users have a higher education level (above A-level) and they contribute 70% of total market spending and also generate more than 70% of revenues in the Services, Automotive and Transportation and Transportation as well as Hotels and Accommodation sector. Although people with a lower educational level account for only 39% of all finance spending, they purchased more than half of the number of finance services provided.
20 Share Economy 2017
Share Economy 2017 – Country Deep Dive
Furthermore, it has been identified that the income level is a significant indicator of overall spending, showing a relation between user rate and income level. While only 16% of German users had a monthly disposable household income above €4k, they accounted for 38% of overall Share Economy turnover in Germany. Their contribution to the revenues of the following sectors was particularly high: Retail and Consumer Goods (49%), Services (46%) and Hotels and Accommodation (43%). Although 37% of the sample indicated a disposable household income of less than €2k, their contribution to the overall Share Economy spending made up only 18%.
While the decision whether to use a specific Share Economy service does not seem to be influenced by the city size, overall spending seems to increase with increasing size. We observed that 28% of total turnover is generated in cities with more than 500.000 inhabitants. Users in these cities contribute most to industry spending in Retail and Consumer Goods and Services (42% of each turnover). In smaller cities with less than 50.000 inhabitants, users spend more on Machinery and Media and Entertainment.
Users consider the personal benefit of Share Economy with a better price performance ratio to be more important than its benefits for society.German users as well as current non-users criticize most the absence of liability in case of problems and damages (45%), quality standards and security, providers worry most about the uncertainty of income (23% of providers) and the not clearly defined legal situation in terms of income tax and related topics (22% of providers).
The majority of German respondents also criticize Share Economy for enabling everyone to easily become a professional provider and be a competitive threat for traditional organizations.
To improve the attractiveness of Share Economy, users would like to be reassured that providers have sufficient insurance protection (41% of users, 36% of all respondents) and that professionals take care of them (38% of users, 32% of all respondents). The transparency of prices is another important aspect for 28% of Germans (35% of users).
83% of Germans perceive that Share Economy is based on trust between provider and user, however, 63% have lower trust in people nowadays than in the past. Even current users would trust a traditional provider more than a Share Economy provider, whereas Media and Entertainment services are the only exception.
Nevertheless, Germans still believe that Share Economy will not simply be a short-term phenomenon but expect the future job market in 2030 to change from having one main occupation to having multiple sources of income which holds additional potential for the future of the German Share Economy market.
Every fifth German has already provided a Share Economy service.Within the last year, 21% of Germans have at least offered one Share Economy service and on average provided 40 services each. Despite the marginal increase in users, the number of Share Economy providers is expected to increase in all industries by 13%.
More Germans plan to offer a service to others, especially in the Hotels and Accommodation sector (+25%).
Every second current user perceives an improved price-performance ratio for the same service as the main benefit of Share Economy services. Additionally, one fourth of users emphasizes the increased attention of Share Economy providers to environmental protection and sustainability as well as the improved personal interaction between users and providers and the feeling of being part of a community. On the other hand, 46% of current non-users do not see any advantage Share Economy providers could offer.
Providers on the other hand perceive the monetary benefit of an additional source of income as the strongest motivation. This is backed by 29% of providers. In addition, having the possibility to pass on one’s spare time or spare items to others is perceived as another advantage. Although the majority of Germans agrees that Share Economy reduces the waste of material and that it is cheaper to share items instead of owning them, more than 30% of non-providers cannot imagine any benefit of Share Economy for providers.
Share Economy 2017 21
Share Economy 2017 – Country Deep Dive
2 Austria
49% plan to use a Share Economy offer within the next year
53% of users are between 18 and 39 years old
28% plan to provide a Share Economy offer within the next year
47% have used a Share Economy offer within the past year
52% of users are male
23% have provided a ShareEconomy offer during the last year
€574 is on average spent on Share Economy offers per user within one year
31x average usage of Share Economy offers per user within one year
33% have concernsregarding security
30% perceive the lack of quality standards as key disadvantage
Disadvantages (users perceive) of Share Economy
Most used Share Economy offers by Austrians
Media and Entertainment (28%)
Hotels and Accommodation (20%)
Advantages (users perceive) of Share Economy
54% agree that Share Economy offers a better price-performance-ratio
31% agree that Share Economy offers pay more attention to environmental protection and sustainability
30% agree that Share Economy offers a more personal direct interaction between consumers and providers
Automotive and Transportation (20%)
54% raise concerns regarding not clearly defined liabilities in case of issues and damages
22 Share Economy 2017
Share Economy 2017 – Country Deep Dive
Austria ranks last in terms of overall market size together with Belgium and is not expected to grow in the next year.The estimated market size of the Share Economy in Austria is €2.0bn. As in most other countries, Finance is revenue-wise the largest market in Austria with €0.9bn. This is followed by Hotels and Accommodation with a market size of €0.4bn and Machinery and Retail and Consumer Goods, which both have a market share of €0.2bn. The remaining sectors each have an approximate market size of €0.1bn.
In contrast to most countries in the survey, the overall Share Economy market in Austria is expected to decrease by 6.1% in the next year. This is primarily driven by a decrease of planned spending on Finance services of 41%. The Services sector is expected to increase by 70% and the Automotive and Transportation sector by 49%. In addition, the Media and Entertainment and the Hotels and Accommodation sector are anticipated to increase by a double-digit rate. The Machinery sector is expected to decrease by 10%, whereas Retail and Consumer Goods is expected to stay constant.
Almost every second Austrian uses sharing services and the user rate is expected to increase by 3%. Highest usage identified for Media and Entertainment services though lowest average spending per user.In Austria, 47% of respondents have used at least one Share Economy service within the past year. The results of the examined 500 respondents show that Austrians prefer sharing services mostly in the sector Media and Entertainment, with a usage rate of 28%, followed by Hotels and Accommodation, Automotive and Retail and Consumer Goods (20% in each case).
For the next year +2%pt of Austrians plan to use Share Economy offers. With regard to the specific industries especially Service will show a significant increase of usage rate (+6%pt). The second strongest increase can be expected for Automotive and Transport (+4%pt), followed by Hotels and Accommodation (+3%pt.) and Finance (+2%pt). Retail and Consumer Goods will remain static at the same level, Media and Entertainment usage will face a decline of –3%pt.
On average, each Austrian respondent uses Share Economy services 14.9 times while spending €284. Identified users utilize sharing services on 31.5 occasions, spending about €600 each. Media and Entertainment services are used most frequently, followed by Automotive and Transportation offers, whereas Austrians rarely use Finance services. In terms of industry spending, the mean contribution of each respondent is highest in Finance (€112) and Hotels and Accommodation (€64), while the mostly used sector, Media and Entertainment only generates an average of €12 per Austrian.
For next year, 3% more Austrians plan to use sharing services, with the highest relative increase of users in Services (+43%) and Automotive and Transportation (+21%). However, fewer people are planning to use Media and Entertainment services (–11%). Although the user rate is expected to increase, Austrians plan to spend less on Share Economy next year (–4%). Machinery services have to expect a decrease of 9% of Austrians, or 11% of current users.
52% of Share Economy users are male and are more willing to spend more on services used. Spending and usage increases with decreasing age.In terms of identified user characteristics, men represent 52% of all Austrian users and have a higher dominance in all examined industries except for Retail and Consumer Goods which is not only used to a greater extent by females, but also generates slightly more turnover by women. However, overall and in all remaining industries, men spend more on sharing services, contributing a share of 60%. One further trend, examined also in other countries: More than half of the users, namely 53%, are between 18 and 39 years old. The same applies for Share Economy spending of which 56% were contributed by the same target group. In terms of age, the user’s willingness to pay decreases with increasing age.
Furthermore, the majority of Austrian users (62%) has a higher education above A-level and only a minority of 5% has an income below €1k. Share Economy services appeal to a greater extent to Austrians with a higher income. 61% of total spending was generated by users with an income above €3k, in Finance this respective category contributes 75%.
Although user rates are similar across city size, 54% of total Share Economy turnover was generated by users from cities with more than 100k inhabitants. However, neither spending nor usage seems to be influenced by city size.
Share Economy 2017 23
Share Economy 2017 – Country Deep Dive
The main motivation for Austrians to use Share Economy services is the monetary benefit. The trust in traditional providers is stronger than the trust in Share Economy providers.From a user perspective, the superior value for money for the same service (54%) as well as the attention to environmental protection and sustainability (31%) and the more personal interaction between users and providers (30%) are the main advantages Share Economy providers offer. However, 34% of current non-users still do not perceive any advantages. By way of contrast, users mainly criticize the uncertainty regarding clearly defined liabilities in the event of issues or damages (54%) and have concerns regarding the lack of security and quality standards.
To increase the attractiveness of Share Economy services and providers, Austrians want to be reassured that providers have sufficient insurance protection (e.g. in case of damages) (54% of users, 47% of all respondents) and that professionals take care of them (46% of users, 41% of all respondents).
Some also wish for more transparency regarding compliance with legal provisions. A majority of 82% of Austrians furthermore agrees that users benefit most from Share Economy. Additionally, the reduced waste of material and the thought of sharing is also perceived as a positive impact on society.
86% agree that Share Economy is based on the trust between provider and user and it is more cost-efficient to share instead of owning items (81%). The survey revealed that 70% of Austrians do not trust brands nowadays more than in the past and perceive Share Economy providers as a competitive threat for traditional organizations. In all sectors except Media and Entertainment, the traditional provider is the more trusted partner while non-users tend to trust traditional providers to a greater extent across all industries.
With respect to the future, almost two third of Austrians expect the job situation in 2030 to be changed from the traditional 40-hour job to having several sources of income and therefore Share Economy to be a long-term topic.
In Austria, almost every fourth person provides a sharing service.Currently, 23% of Austrians have provided a Share Economy service within the last year, while 28% plan to offer one next year. So far, the highest provider presence was identified in Retail and Consumer Goods (15% of Austrians) as well as Services (9% of Austrians) with a service provided on average on 30 occasions; this is expected to increase.
From a provider’s perspective, the monetary aspect of an additional income (39%) is perceived as the main benefit of providing Share Economy services. Having the possibility to pass spare items and time on to others is regarded as a further advantage for 16% of providers while one in every five currently non-providing Austrians does not see any advantage for providing a sharing service. Nevertheless, providers also have concerns regarding their role in the Share Economy market. One third of providers emphasize the uncertain legal situation, for example in terms of income tax, while further respondents perceive the uncertain source of income and lack of privacy as pain points worth mentioning.
To increase the attractiveness of Share Economy services and providers, Austrians want to be reassured that providers have sufficient insurance protection.
24 Share Economy 2017
Share Economy 2017 – Country Deep Dive
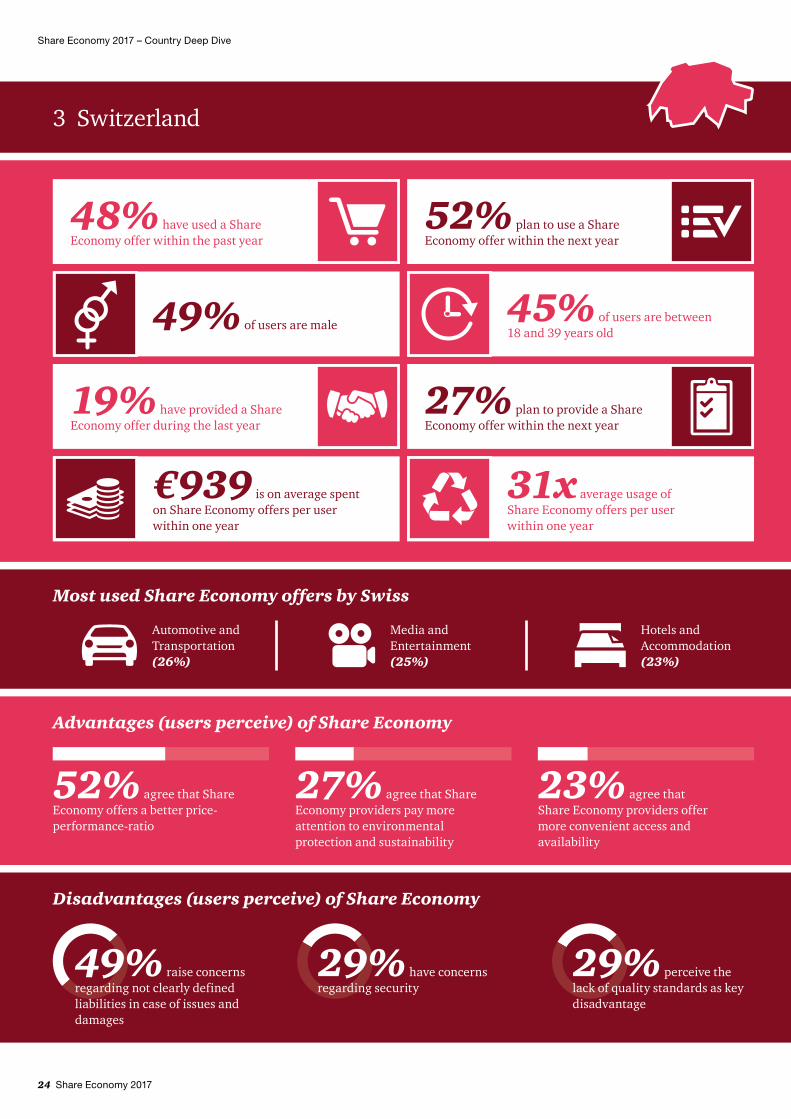
3 Switzerland
52% plan to use a Share Economy offer within the next year
45% of users are between 18 and 39 years old
27% plan to provide a Share Economy offer within the next year
48% have used a Share Economy offer within the past year
49% of users are male
19% have provided a ShareEconomy offer during the last year
€939 is on average spent on Share Economy offers per user within one year
31x average usage of Share Economy offers per user within one year
49% raise concerns regarding not clearly defined liabilities in case of issues and damages
29% perceive the lack of quality standards as key disadvantage
29% have concerns regarding security
Disadvantages (users perceive) of Share Economy
Most used Share Economy offers by Swiss
Media and Entertainment (25%)
Hotels and Accommodation (23%)
Advantages (users perceive) of Share Economy
52% agree that Share Economy offers a better price-performance-ratio
27% agree that Share Economy providers pay more attention to environmental protection and sustainability
23% agree that Share Economy providers offer more convenient access and availability
Automotive and Transportation (26%)
Share Economy 2017 25
Share Economy 2017 – Country Deep Dive
Switzerland exhibits the third largest Share Economy market size of all countries in scope with an overall market size of €3.3bn and an expected growth rate of 20%.According to the data, with a sample size of 500 the market size of Share Economy services in Switzerland is estimated at €3.3bn. Based on these results, it ranks third after Germany and Turkey. The leading sectors Finance and Hotels and Accommodation account for more than 62% of the overall market and have individual market sizes of €1.1bn and €0.9bn. Automotive and Transportation and Retail and Consumer Goods make up a medium market size with €0.5bn and €0.3bn, while Media, Services and Machinery have each less than €0.2bn.
The Swiss Share Economy market is expected to increase by 20% to €3.9bn in the next year. The leading Finance sector is expected to grow by 16% while the Hotels and Accommodation sector is likely to decrease by 1%; Automotive and Transportation is expected to decline by 15%. Apart from Machinery, all remaining sectors are expected to increase and the highest growth might occur in the Services sector, which is expected to increase to an overall revenue of €0.7bn.
48% of Swiss respondents use Share Economy services and users plan to increase their spending on Finance and Media and Entertainment next year.Switzerland shows a strong utilization of Share Economy services. During the past year almost every second Swiss respondent (48%) used relevant offers. Regarding the specific industries Automotive and Transportation (26%), Media and Entertainment (25%) and Hotels and Accommodation (23%) are the most attractive gaining the highest user rates. Retail and Consumer Goods offers are used by 13%, Services by 11%
of the Swiss. Machinery as well as Finance show the lowest acceptance as they achieve a user rate of 6% each. Regarding next year even more Swiss plan to take advantage of Share Economy offers, which will raise user share by +4%pt across all industries. The strongest increase in user rate can be expected for Retail and Consumer Goods (+8%pt.) followed by Hotels and Accommodation and Services with +6%pt. Machinery will raise user share by +4%pt., Finance and Automotive by 3%pt. Media and Entertainment is the only industry that is planned to be used by fewer Swiss consumers (–3%pt.) in the upcoming year.
An average Swiss user utilized Share Economy services 31 times within the last year. Media and Entertainment offers show the highest usage frequency within the industries (41 times per user per year). Automotive, with the second highest frequency, is used 10 times per user per year. The remaining industries show a frequency ranged between 2 and 4 times per user per year. On average, each user spent €939 on Share Economy during the past year, mainly driven by Finance (€2,415) and Hotels (€555). Automotive, Retail and Consumer Goods and Machinery and Service attained spending ranging between €150 and €350 per user per year. For Media and Entertainment offers users spent on average only €91.
For next year Swiss users plan to increase expenditures for Share Economy by +20%; this is exclusively driven by Services (+219%) and Media and Entertainment (+24%). Regarding industries Finance, Hotels and Accommodation, Automotive and Transportation and Retail and Consumer Goods Swiss users plan to reduce expenditures by almost a quarter – for Machinery a reduction of –64% for the upcoming year is planned.
Slightly more women adopted the use of Share Economy services but men tend to spend more, younger and better educated people tend to spend more.With a user share of 51% slightly more women utilize Share Economy in Switzerland which is primarily driven by the industry Retail and Consumer Goods (60%). The Services sector shows a balanced gender breakdown, however the remaining industries show higher male user rates. Especially in the industries Finance and Machinery user share of Swiss men exceeds 60%. Despite the balanced gender distribution among users, men are on top regarding expenditures across all industries. 65% of overall spending on Share Economy is generated by men. In specific industries such as Retail and Consumer Goods, Finance, Media and Entertainment, and Machinery the expenditure share of male users exceeds 70%.
45% of Swiss users are young adults under 40 years. With regard to different sectors, young adults are most strongly represented at Finance (71%) ahead of Media and Entertainment (61%). Compared to the other countries examined, in Switzerland older users are represented to an above-average extent. Across the industries Hotels and Accommodation, Automotive, Retail and Consumer Goods and Services almost every fourth person is older than 60.
With regard to the education background in Switzerland, there is a balanced relation between users with A-level education or higher and users with a lower education level. For Retail and Consumer Goods, Finance, Media and Entertainment and Machinery the expenditure share of high-education users exceeds 70%. In contrast to that Services shows not only a higher usage rate (70%) but also a higher expenditure share (54%) for users with a lower education level.
26 Share Economy 2017
Share Economy 2017 – Country Deep Dive
Swiss consumers highly value higher sustainability and better environmental impact of Share Economy offers.In Switzerland people are convinced that they benefit from Share Economy – only one in five does not perceive any advantage related to relevant offers. From a user’s perspective Share Economy provides numerous benefits. The Swiss users as well as current non-users especially appreciate the improved value for money (42% price-performance ratio). In that context 88% of users are convinced that sharing is the less expensive alternative to owning. Therefore, users trust that using Share Economy makes specific lifestyles more affordable (76%). Furthermore users feel they benefit from Share Economy utilization because relevant offers provide them with higher flexibility (84%). Besides the personal advantage the Swiss show a strong orientation towards environmental protection and sustainability. 70% of Swiss value the reduced waste of material – therefore 66% believe that using Share Economy offers is better for the environment. 27% of Swiss appreciate that Share Economy providers pay more attention to environment protection and sustainability which is perceived as the second highest benefit.
Unclear liability is seen as a major disadvantage which is why sufficient insurance protection could be a major enabler for Share Economy usage.With respect to disadvantages of Share Economy every second Swiss criticizes the unclear liability situation in case of issues and damage (50%) followed by a lack of quality (28%) and security (26%). In addition, 22% also consider that worse data protection is a downside aspect of Share Economy. 16% of Swiss miss transparency regarding prices or rather costs.
Reassuring users that providers have sufficient insurance protection would increase attractiveness of Share Economy for almost every second (44%) Swiss. As 57% of Swiss feel concerned about the fact that everyone could easily become a self-proclaimed expert it could also have a lasting effect on attractiveness to guarantee users that real professionals are taking care of them (36%). The attractiveness of Share Economy offers would increase by a higher level of transparency regarding prices (33%) as well as regarding compliance with legal requirements (30%).
Personal referral is a key success factor to promote trust.Personal referral is an important factor for Swiss users building trust in Share Economy offers. Therefore, 80% of users agree to be willing to test an offer if a trusted person gives a recommendation. In this context it makes technologies such as social media important as 62% of users claim it creates trust to see the people behind the offers.
Overall Share Economy companies are already positioned in a majority’s mindset as serious competitors to traditional providers (70%). But of all industries Media and Entertainment is the only one with higher user trust towards Share Economy providers. In all other considered industries traditional providers enjoy higher confidence. Non-users show limited trust to Share Economy providers across all industries.
71% of the Swiss are convinced of the long-term success of Share Economy.The Swiss, users as well as current non-users, mainly expect that Share Economy is not merely a short-term trend but will still be present in the distant future (71%). In Switzerland there is also a broad consensus that Share Economy is closely linked to societal and economic changes. In this context 76% of users and 67% of current non-users support the idea that a change on the job market will lead to the shift
from the traditional 40-hour job to employees relying on several sources of income becoming the norm in 2030. Regarding this every second Swiss (49%) believes that Share Economy will destroy jobs in traditional companies.
Despite the negative impact on traditional jobs 71% of current users believe that Share Economy creates a strong community as society benefits from the basic idea of sharing (78%). However 43% of Swiss expect that the character of Share Economy will change in the future as the basic idea of sharing will be totally replaced by making profit by the year 2030.
In Switzerland, currently one in every five persons provides a sharing service.19% of the Swiss have provided a Share Economy service within the last year. For next year the provider rate will show a strong increase of +8%pt.
To date, the highest provider presence is identified in the industry Hotels and Accommodation (11% of Swiss), followed by Retail and Consumer Goods (10%) and Automotive and Transport along with Services (both 9%). Across all industries a rising number of providers can be expected for the next year.
From a provider’s perspective, the monetary aspect of an additional income (24%) is perceived as the main benefit of providing Share Economy services. But also having the possibility to pass spare items and time on to others is regarded as a further advantage for 18% of providers. Only one in every seven currently non-providing Swiss does not see any advantage for providing a sharing service. Nevertheless, providers as well as users have concerns regarding their role in the Share Economy market. 24% of providers criticize the uncertain legal situation, for example in terms of income tax. Almost one in every five persons perceives the uncertain source of income and lack of social benefits as disadvantages with regard to providing offers.
Share Economy 2017 27
Share Economy 2017 – Country Deep Dive
4 The Netherlands
37% plan to use a Share Economy offer within the next year
52% of users are between 18 and 39 years old
19% plan to provide a Share Economy offer within the next year
44% have used a Share Economy offer within the past year
51% of users are male
16% have provided a ShareEconomy offer during the last year
€506 is on average spent on Share Economy offers per user within one year
53x average usage of Share Economy offers per user within one year
39% raise concerns regarding not clearly defined liabilities in case of issues and damages
33% perceive the lack of quality standards as key disadvantage
26% have concerns regarding security
Disadvantages (users perceive) of Share Economy
Most used Share Economy offers by Dutch
Media and Entertainment (35%)
Hotels and Accommodation (18%)
Advantages (users perceive) of Share Economy
42% agree that Share Economy offers a better price-performance-ratio
30% agree that Share Economy providers offer a higher consumer benefit
27% agree that Share Economy providers offer more direct interaction between user and provider
Automotive and Transportation (10%)
28 Share Economy 2017
Share Economy 2017 – Country Deep Dive
The Netherlands has an overall Share Economy market size of €3.0bn and is expected to decline by 9.4%.According to our data with a sample size of 500, we estimated the market size of Share Economy services in Netherlands at €3.0bn. The leading sectors Finance and Hotels and Accommodation account for more than 61% of the overall market and have individual market sizes of €1.1bn and €0.8bn; Retail and Consumer Goods and Media and Entertainment account for €0.3bn.
The Dutch Share Economy market is expected to decline to €2.8bn next year. This is driven by the fact that respondents plan to spend significantly less on Finance and Retail and Consumer Goods while the remaining markets are expected to develop positively. Growth rates of above 30% are expected for the Automotive and Transportation and the Machinery sector.
44% of the Dutch use Share Economy, and planned usage as well as spending behavior is very volatile across most sectors.In the Netherlands Share Economy is already relatively widespread – almost every second person has utilized Share Economy offers within the past year (44%). But, in contrast to the other examined countries, the planned usage for the upcoming year shows a decrease of –8%pt driven by the Media and Entertainment industry. Despite strong losses in the amount of users (–11%pt) Media and Entertainment remains, with a planned user share of 24%, the most preferred Share Economy industry. The Hotels and Accommodation industry shows the second highest user share (18%), and plans to experience an increase of +3%pt for the upcoming year. Currently 10% of the Dutch use
offers from Automotive and 9% from Machinery. While Automotive is planned to be used by more clients in the next year (+3%pt) the user rate of Machinery will remain almost stable (+1%pt). With +4%pt Service shows the highest increase within the considered industries (current user share 9%). During the past year at least 7% of the Dutch used offers from Retail and Consumer Goods these are planned to be used by more clients next year (+2%pt). Finance shows a user share of 7% as well and is expected to remain almost stable (+1%pt).
On average the Dutch utilize Share Economy offers 53 times per user per year; this is mainly driven by the Media and Entertainment industry (60times). Within the remaining industries Retail and Consumer shows with 6 times the second highest usage per consumer followed by Automotive (5.6times), Machinery (5.2times), Service (3.2 times) and Hotels and Accommodation (2.8times). With 1.7 times Finance has the lowest utilization per consumer. During the past year Dutch users spent €506 per person on Share Economy mainly driven by high spending on Finance offers (€1,082 per user/year). Hotels and Accommodation is ranked the second highest with €335 along with Retail and Consumer Goods with €326. In the industries Automotive, Machinery and Services Dutch users spend between €125 and €175 on Share Economy offers; Media expenses are €56 per user/year.
For the upcoming year Dutch users plan to spend –9% less on Share Economy driven by Finance (–62%), Retail and Consumer Goods (–38%), Services (–21%) and Hotels and Accommodation (–3%). In Contrast Automotive (+17%), Machinery (+24%) and Media and Entertainment (+52%) can expect an increase in spending.
Young users tend to engage more with Share Economy and differences between usage of women and men depend on different industries.There are no significant differences in gender breakdown observable – 51% of Share Economy offer usage can be assigned to men. Regarding the industries Retail and Consumer Goods and also Services are balanced as well. Whereas Automotive, Finance and Machinery show strong differences regarding usage intensity between Dutch men and women. Automotive offers achieve a male market share of 63%, Finance 67% the figure for Machinery is 74%. Hotels and Accommodation (55%) as well as Media and Entertainment (53%) show a slightly higher share of men.
In the Netherlands Share Economy offers attract younger adults. On average 52% of the users are under 40 years. With regard to the industries younger adults are most strongly represented at Media and Entertainment (65%) and Finance (64%). Overall the usage decreases with increasing age. There are different patterns with regard to the individual industries. For example, in the industries Automotive (14%) and also Retail and Consumer Goods (15%), people at the age of 60+ demonstrate a higher intensity of usage than the age groups 40–49 and 50–59 years.
Users with higher education and high disposable household income generate the majority of all Share Economy turnover.63% of the users in the Netherlands possess a higher education. For Share Economy this group of people plays an important role as 85% of overall spending can be assigned to these users with an A-level or higher. Concerning the specific industries Automotive (87%),
Share Economy 2017 29
Share Economy 2017 – Country Deep Dive
Retail and Consumer Goods (93%) and Finance (96%) show an above-average share of high-education users. Users with a lower education level (below A-level) show the strongest preference towards Media and Entertainment and reach the highest share for this group (36%).
38% of Dutch users have an income of more than €3.000 per month and represent 67% of spending on Share Economy. This is primarily driven by a high preference for Finance offers, as 91% of spending on this industry can be assigned to this demographic group. In all remaining industries – except Machinery – high income users just achieve a below-average expenditure share with the lowest significance for Retail and Consumer Goods (28%). Across all industries medium/high income levels spend most on Share Economy.
Personal benefits and higher utility is a key success factor for sharing economy in the Netherlands.From a user’s perspective Share Economy offers various benefits. 79% of the Dutch users agree that sharing is the less expensive alternative to owning. Accordingly the users especially appreciate the improved value for money (42% same service lower price). 30% value the higher consumer benefit compared to traditional offers. 24% of the current non-users agree to the improved value for money but every second current non-user (50%) does not see any advantage regarding Share Economy offers.
For the Dutch the most essential success factor of Share Economy is the maximization of personal utility. 73% agree that Share Economy increases consumer flexibility. 71% are convinced that specific lifestyles become more affordable by sharing things instead of owning them. Dutch users also emphasize more convenient access and availability of providers (27%) and the more personal interaction with them (27%).
However, from a user’s perspective Share Economy also entails disadvantages. For 39% the most significant downside is the lack of clarity about liability in case of problems and damage. Non-users also agree that this is the case (35%). Furthermore, the lack of quality standards (33% of users/24% of non-users) and the lack of security (26% of users/13% of non-users) are also perceived as disadvantages.
In the Netherlands Share Economy could increase attractiveness by more price transparency (35% of users/23% of non-users) on the one hand. On the other hand reassuring users that professionals take care of them would also have a lasting effect on attractiveness as 75% of the users are concerned about the fact that anyone could easily become a self-proclaimed expert.
Personal referral is a key success factor to promote trust.Personal referral is very important for Dutch users – 71% would be willing to test an offer if a trusted person makes a recommendation. 67% of the users also agree that technologies, such as social media, allow the people behind an offer to be seen; this also leads to higher confidence.
Overall providers of Share Economy offers are perceived as a competitive threat for traditional providers (81%). Despite this perception, current users and non-users would still trust traditional providers more than Share Economy providers with one exception Media and Entertainment industry – 67% of users have more trust in Share Economy providers. Current non-users have very limited trust in Share Economy providers across all industries.
The majority of the Dutch are convinced of the long-term success of Share Economy.The Dutch are convinced that Share Economy will still be present in the distant future. 65% of the users and 54% of current non-users perceive Share Economy not only as a short-term trend.
62% of the Dutch believe that Share Economy will destroy jobs in traditional companies. 76% of the current users and 64% of non-users assume that a changed job market will lead to the shift from traditional 40-hour jobs to employees relying on several sources of income.
72% of the Dutch think that society benefits from the basic idea of sharing. With regard to this 56% believe that Share Economy creates a strong community. Nonetheless, this view is expected to change in future: Almost every second Dutch person (46%) expects that the basic idea of Share Economy will be entirely replaced by making profit by the year 2030.
In the Netherlands, currently one in every six persons provides Share Economy services.16% of the Dutch have provided a Share Economy service within the last year. For next year the provider rate will increase by +3%pt.
So far, the highest provider share is identified in the industry Media and Entertainment (9% of the Dutch), followed by Hotels and Accommodation and Services along with Services (both 8%).
From a provider perspective, the most important benefit mentioned is the monetary aspect of an additional income (20%) along with more flexibility e.g. regarding flexible time management (20%). In contrast, one in every three currently non-providing Dutch person does not see any advantage for providing a sharing service. Nevertheless, providers, as well as users, have several concerns regarding the Share Economy market. 27% of providers perceives the uncertain source of income as the main disadvantage. Almost one in every five persons criticizes the uncertain legal situation, for example in terms of income tax.
30 Share Economy 2017
Share Economy 2017 – Country Deep Dive
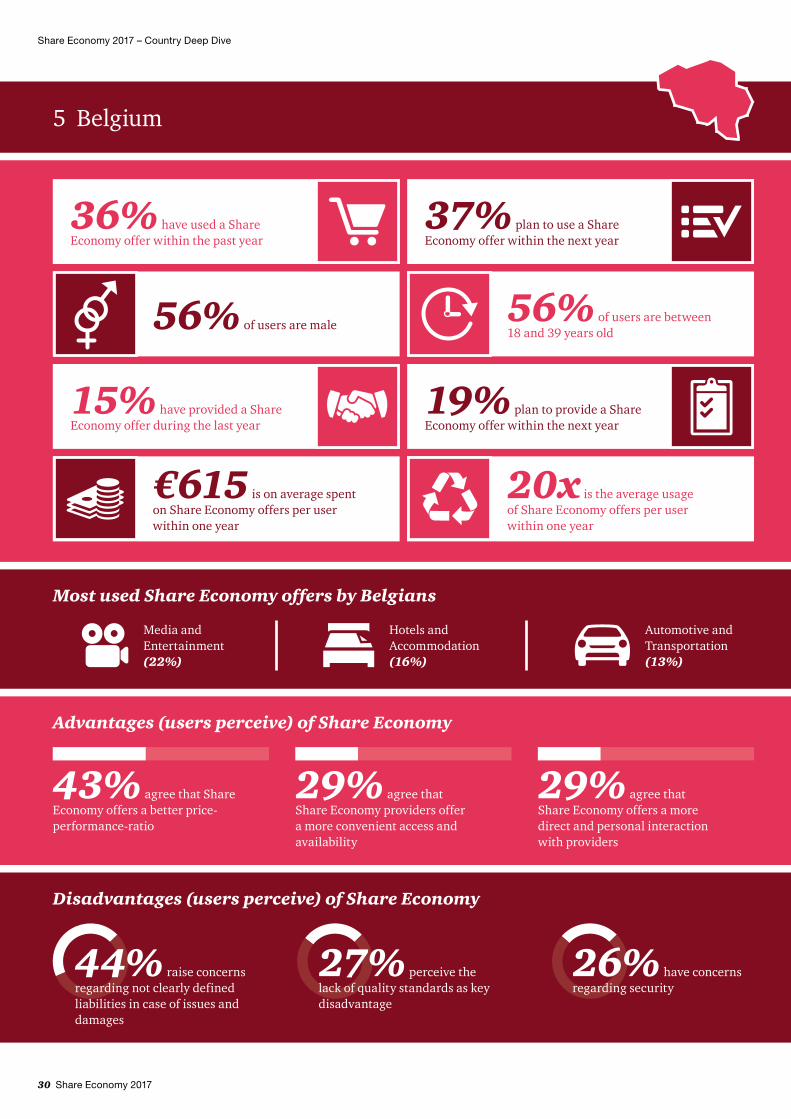
5 Belgium
37% plan to use a Share Economy offer within the next year
56% of users are between 18 and 39 years old
19% plan to provide a Share Economy offer within the next year
36% have used a Share Economy offer within the past year
56% of users are male
15% have provided a ShareEconomy offer during the last year
€615 is on average spent on Share Economy offers per user within one year
20x is the average usage of Share Economy offers per user within one year
44% raise concerns regarding not clearly defined liabilities in case of issues and damages
27% perceive the lack of quality standards as key disadvantage
26% have concerns regarding security
Disadvantages (users perceive) of Share Economy
Most used Share Economy offers by Belgians
Media and Entertainment (22%)
Hotels and Accommodation (16%)
Advantages (users perceive) of Share Economy
43% agree that Share Economy offers a better price-performance-ratio
29% agree that Share Economy providers offer a more convenient access and availability
29% agree that Share Economy offers a more direct and personal interaction with providers
Automotive and Transportation (13%)
Share Economy 2017 31
Share Economy 2017 – Country Deep Dive
Belgium ranks last in terms of overall market size of €2.0bn together with Austria but is expected to increase by 71.5%.The estimated market size of the Share Economy in Belgium is €2.0bn. The Service Share Economy sector is first in Belgium with an overall turnover of €0.5bn. Hotels and Accommodation as well as Automotive and Transportation sectors rank second and third with a market size of €0.4bn. The Machinery sector is worth €0.3bn. Media and Entertainment makes up €94m and Retail and Consumer Goods only €21m.
Based on the planned spending of respondents, the Belgian Share Economy market is expected to increase by 71.5%. All sectors are expected to grow by at least a double-digit rate and Machinery, Services and Hotels and Accommodation will grow by more than 40%. The Retail and Consumer Goods sector is anticipated to increase to €0.3bn.
Belgians show the lowest adoption rate as only 36% are current users of Share Economy and the user rate is expected to be almost stable for the upcoming year.In the past year 36% of Belgians have made use of Share Economy products or services which represents the lowest adoption rate of all examined countries. However, for the upcoming year 37% of the Belgians plan to utilize Share Economy (+1%pt) indicating significant improvement and potential for Share Economy offers in Belgium.
Considering all industries the Belgian usage rates vary, with Media and Entertainment offers being the most attractive. The utilization is by far the highest (22%), followed by Hotels and Accommodation (16%), Automotive (13%) and Services (8%). The remaining industries Retail and Consumer Goods, Finance and Machinery show the lowest acceptance with a usage rate of 6% each.
For next year Belgians plan to intensify usage across all industries except for Media and Entertainment which is planned to decrease at –4%pt. Service expects to see the strongest increase (+8%pt). Hotels and Accommodation will intensify usage and become the second highest (+6%pt.) and will therefore take the lead within the industries regarding attractiveness.
In the past year, Share Economy offers were used on average 20 times per user, mainly driven by Media and Entertainment (25 times). The remaining industries show a significantly lower usage frequency of 3 times or less per user per year.
On average, Belgian users spend €615 per year on Share Economy. In this regard the industries Service and Machinery show above-average spending, whereas Retail and Consumer Goods as well as Media expenses are less than €50 per year. Hotels and Accommodation, Automotive and Finance are ranged between 250 and €450 per year.
For the upcoming year Belgians plan lower expenses for Machinery (–2%.), Finance (–19%) and Service (–20%).
Belgian men show a slightly higher usage of Share Economy services than women, young adults with a high education level account for most spending.54% of the Belgian Share Economy usage can currently be assigned to men. Relative to women they show a higher preference towards Finance offers (74%) followed by Automotive (69%), Service (63%) and Hotels and Accommodation offers (59%). There are no gender related differences observed regarding usage within the industries Media and Entertainment, Retail and Consumer Goods and Machinery.
In Belgium, as well as in the other examined countries, Share Economy offers attract young adults. 56% of users are under 40 years and in all considered industries usage decreases with increasing age. Nevertheless the intensity of young adults’ usage varies across the industries. Above all Retail and Consumer Goods as well as Machinery reach the strongest utilization by young adults exceeding a share of 75%.
Belgians at the age of 40 and older show the strongest orientation towards Service offers, reaching a share of 49% representing the highest for this age category across all industries. 69% of spending on Share Economy in Belgium can be assigned to young adults under 40 years. 71% of overall spending on Share Economy is represented by people with a higher education background. Overall the majority of users possess an A-level or higher (55%).
Compared with this general trend, the industries Finance and Service show a slightly higher share of spending represented by users with a lower education level.
In Belgium almost every third Share Economy user has a high income of more than €3,000 per month. In the industries Service and Media and Entertainment high income Belgians are most strongly represented regarding Share Economy usage. However, only 18% can be assigned to high income users. With an expenditure share of 80%, users with an income of between 1,000 and €3,000 per month are most important for Share Economy providers.
32 Share Economy 2017
Share Economy 2017 – Country Deep Dive
Belgian users appreciate the improved value for money, current non-users still have to be convinced as 46% do not perceive any advantage in using Share Economy. From a user’s perspective Share Economy incorporates various personal benefits. Belgian users especially appreciate the improved value for money (43% same service lower price) – 76% of them agree that sharing is the less expensive alternative to owning. Additionally 29% of the users value the intensified personal interaction between customer and provider as well as the easier access to products and services (29%). 33% of the Belgians do not see any advantage of Share Economy offers; this is mainly driven by the current non-users (46%).
The most essential success factor driving usage of Share Economy is the possibility for users to maximize personal benefit. 70% of Belgians consider increased flexibility for consumers as a main advantage; this underlines the self-interest as well as the conviction that specific lifestyles become more affordable by sharing things instead of owning them (70%).
Beside the benefit on a personal level, economic as well as environmental factors have a lower impact on usage. 52% of the users agree to an economic advantage of Share Economy by creating new but only 13% see that as a personal advantage. Furthermore, although 73% believe that Share Economy reduces waste of material, only 14% see an advantage for users in the higher environmental friendliness of Share Economy offers.
In conclusion, the Belgians, users as well as current non-users, are interested in Share Economy driven by a maximized personal advantage. However, especially due to the importance of personal advantage, there are still certain obstacles to overcome to enhance consumer confidence and enable Share Economy to penetrate the Belgian market.
The lack of clarity about liability in case of problems and damage is perceived as the most significant downside of Share Economy.For users the most significant downside of Share Economy services is the lack of clarity about liability in case of problems and damage – 43% of the Belgians, users as well as non-users, agree to this aspect. Furthermore the lack of quality standards (23%) and security (23%) are also perceived as disadvantages.
Reassuring users that providers have sufficient insurance protection would increase attractiveness of Share Economy for Belgian users the most (37%). This is mainly driven by the concern of users that anyone could easily become a self-proclaimed expert offering services (69%) – For 27% the certainty that real professionals are taking care of them (e.g. electrician) would also have a lasting effect on attractiveness.
Personal security is an important factor for increasing acceptance of Share Economy in Belgium. Additionally, 35% of users agree that a higher level of transparency regarding pricing as well as regarding compliance with legal regulations (27%) would also increase attractiveness of Share Economy offers.
Personal referral increases trust in Share Economy offers.Belgian users trust in personal referral regarding Share Economy utilization. 72% of users as well as 55% of current non-users agree to be willing to test an offer if a trusted person makes a recommendation. But overall Share Economy companies are already positioned in the mindset of Belgians as serious competitors to traditional providers (72%).
Within the industries users for Media and Entertainment show even higher trust in offers from Share Economy providers than from traditional providers. In all other considered industries traditional providers still enjoy higher user confidence.
Belgians expect Share Economy to be the norm in future but the basic idea of sharing will be replaced by making profit.In conclusion Share Economy shows good prospects in Belgium. 64% of the Belgians expect Share Economy not to be only a short-term trend. There is also a consensus that Share Economy is closely linked to societal and economic changes. In this context 65% of the respondents support the idea that Share Economy will also have an impact on the job market and will lead to a shift from one main source of income to employees relying on several sources. Belgians also believe that Share Economy by itself is subject to change as 43% of respondents expect that in 2030 the basic idea of sharing will be totally replaced by making profit.
In Belgium, currently one in every six persons provides Share Economy services.15% of the Belgians have provided a Share Economy service within the last year. For next year the provider rate will increase by +4%pt.
So far, the highest provider share is identified in the Hotels and Accommodation industry (10% of the Belgians), followed by Automotive and Transport as well as Services (both 8%).
From a provider’s perspective, the most important identified benefit is the monetary aspect of an additional income (27%) along with more flexibility e.g. regarding flexible time management (22%). In contrast, almost one in every three currently non-providing Belgian does not see any advantage for providing a sharing service.
Nevertheless, providers, as well as users, have several concerns regarding the Share Economy market. 22% of providers criticize the uncertain legal situation, for example in terms of income tax as the main disadvantage followed by a lack of privacy (18%).
Share Economy 2017 33
Share Economy 2017 – Country Deep Dive
6 Turkey
76% plan to use a Share Economy offer within the next year
58% of users are between 18 and 39 years old
66% plan to provide a Share Economy offer within the next year
68% have used a Share Economy offer within the past year
49% of users are male
61% have provided a ShareEconomy offer during the last year
€1,031 is on average spent on Share Economy offers per user within one year
51x is the average usage of Share Economy offers per user within one year
31% have concerns regarding security
28% raise concerns regarding not clearly defined liabilities in case of issues and damages
28% raise concerns regarding prices that are not transparent
Disadvantages (users perceive) of Share Economy
Most used Share Economy offers by Turks
Media and Entertainment (49%)
Retail and Consumer Goods (44%)
Advantages (users perceive) of Share Economy
35% agree that Share Economy offers a better price-performance-ratio
30% agree that Share Economy provides a higher customer value
29% agree that Share Economy providers offer greater choice
Automotive and Transportation (40%)
34 Share Economy 2017
Share Economy 2017 – Country Deep Dive
Turkey ranks first in terms of overall market size with an annual turnover of €38.3bn and is expected to increase by 86.5%.The estimated market size of the Share Economy in Turkey is €38.3bn. This high market size can be explained by the high overall adoption rate in Turkey and a well-developed Share Economy Finance sector within the country. This sector makes up €11.2bn and is followed by strong Retail and Consumer Goods and Hotels and Accommodation sectors with €6.5bn and €6.3bn turnover. Overall revenues for Automotive and Transportation are €4.6bn, for Services €4.2bn, for Machinery €3.3bn and for Media and Entertainment €2.2bn.
The Share Economy market in Turkey is expected to increase by 86.5% next year. The growth rates across all industries are above 40% and Automotive and Transportation, Media and Entertainment, and Machinery are expected to grow by more than 100%. The resulting future Share Economy market size in Turkey is €71.5bn.
68% of Turks use Share Economy and 72% of these users engage in Media and Entertainment.In Turkey Share Economy is widely accepted – two out of three have utilized Share Economy offers within the past year (68%). With a user rate of 49% Media and Entertainment offers are most attractive for current users followed by Retail and Consumer Goods (44%), Automotive (40%), Services and Hotels and Accommodation (33%) and Finance (30%). Machinery offers show the lowest consumer acceptance but still reach a user rate of 27%. For the next year even more Turks plan a Share Economy utilization – the number of users is expected to increase by +8%pt across all industries. Within the industries Hotels and Accommodation will gain the highest increase of users.
On average, Turks took advantage of Share Economy offers 51 times per user during the past year. Media offers show the highest utilization with 20 times per user per year followed by Automotive with 18 times and Retail and Consumer Goods with 13 times per user per year. The remaining industries show an average usage frequency ranged between 8 and 10 times per user per year.
During the past year Turkish users spent on average €1,031 on Share Economy mainly driven by high spending on Finance offers (€701 per user per year). With the exception of Media the other industries are ranged between 200 and €350 per user per year. An average user spent €81 on Media and Entertainment offers during the last year. For the upcoming year Turkish users plan to leverage spending across all industries apart from Finance (–5%).
Young users and users with higher education generate the majority of all Share Economy turnover.51% of the Turkish Share Economy users are women. Relative to men they show a higher share across all industries apart from Service, Finance and Machinery. But concerning usage frequency of Share Economy offers Turkish men are more active than women (54% of all services). The disparity in usage between men and women is most significant within the industries Hotels and Accommodation, Automotive and Finance. For Retail and Consumer Goods the gender breakdown is balanced. Media and Machinery offers show a higher usage for women. Overall Turkish men are on top not only regarding usage frequency but also regarding expenditure share (59%).
In Turkey, as well as in the other examined countries, Share Economy offers mainly attract young adults. 58% of users are younger than 40 years.
The user share is almost at the same level for each industry and the usage decreases with increasing age; this means that the group of people at the age of 60+ shows the smallest share ranged between 4% (Finance) and 8% (Machinery).
Regarding education background Turkish users with an A-level or higher account for the majority (91% of users). 94% of spending on Share Economy offers during the last year can be assigned to this category. Users with a lower education background (below A-level) show an almost consistent user share within the industries ranged between 5% and 9%. But with regard to spending this group shows a high preference towards Media and Entertainment as well as Automotive offers. Therefore, they reach an above-average expenditure share of 16% regarding the industry Media and Entertainment and 14% concerning Automotive.
A higher price and service quality transparency as well as referrals are key success factors for higher attractiveness and usage of Share Economy in Turkey.For a third (34%) higher transparency in pricing would increase attractiveness of Share Economy offers the most. As 66% of Turks are concerned about the fact that anyone could easily become a self-proclaimed expert offering services, reassurance that real professionals take care of them would also have a lasting effect on attractiveness for 30%. Current users would also appreciate higher data security – 21% of the non-users also agree with this aspect. Furthermore, for one in every three persons it is important that providers have insurance protection and there is much more transparency regarding compliance with legal requirements.
Share Economy 2017 35
Share Economy 2017 – Country Deep Dive
Beside personal advantages 72% believe that Share Economy is better for the environment especially regarding a reduced waste of material (82%). One in every five Turks specifically utilizes Share Economy to gain social recognition but only 14% generally pay higher attention to environmental protection and sustainability. Regarding economic reasons 84% of current users, but also non-users, see Share Economy as creating new jobs;this is also perceived as a personal advantage by one in four persons. The most significant downside of Share Economy for Turks is the lack of security (34%) followed by the lack of clarity about liability in case of problems and damage (26%) and the lack of transparency regarding prices or rather costs (24%).
For Turkish users personal referral is an important factor with respect to trust towards Share Economy offers – 85% agree to be willing to test an offer if a trusted person gives a recommendation. In this context technologies such as social media play an important role because they enable users to see the people behind the offers; this also results in a higher level of trust.
Share Economy Media and Entertainment as well as Automotive and Transportation companies are well trusted among Turkish consumers.78% of current Turkish users as well as non-users perceive Share Economy companies as serious competitors to traditional providers. Within the industries Media and Entertainment (71%) as well as Automotive (56%), current users would trust a Share Economy provider even more than a traditional one. In all other considered industries traditional providers enjoy higher confidence.
Non-users have limited trust in Share Economy providers from all considered industries apart from Media and Entertainment – the majority of respondents would choose a Share Economy provider instead of a traditional one. But with regard to the industries Media and Entertainment (40%) and Automotive (29%) Share Economy providers have already achieved a high level of trust.
Despite the high adoption level of Share Economy in Turkey only 57% of respondents believe that it will be present in the distant future.The Turks mainly believe that Share Economy will still be present in the distant future. 57% of users perceive Share Economy not only as a short-term trend and there is a consensus that Share Economy will bring societal and economic changes. Therefore 82% of the current users and 75% of the non-users assume that the changed job market will lead to the shift from the traditional 40-hour job to employees relying on several sources of income.
In this context almost every second user (54%) believes that Share Economy will have a negative impact on traditional companies by destroying jobs.
80% of Turks think that society benefits from the basic idea of sharing. With regard to this 76% believe that Share Economy creates a strong community. But that will change in future. Almost every second Turk (53%) expects that the basic idea of sharing will be totally replaced by making profit by the year 2030.
For Turkish users personal referral is an important factor with respect to trust towards Share Economy offers.
Share Economy 2017 – Industry Deep Dive
C Share Economy 2017 – Industry Deep Dive
36 Share Economy 2017
Share Economy 2017 37
Share Economy 2017 – Industry Deep Dive
1 Hotels and AccommodationThe Hotels and Accommodation sector is the second largest Share Economy sector with a market size of €14.0bn.The shared economy sector for Hotels and Accommodation includes platforms such as CouchSurfing, AirBnB, WIMDU, 9flats, Homeaway, Gloveler, Nightswapping. While some of these platforms – e.g. Couchsurfing – connect travelers and hosts without charging any fee to promote the idea of a global traveler community, most companies are commission-based digital market places in which people can offer and search for accommodation of any kind. Based on our calculation, the market size for the paid Hotels and Accommodation Share Economy sector was €14.0bn in 2016/17 and it is anticipated to increase overall by over 40% in the next 12 months. All countries subject to the study are expected to experience significant market growth.
Share Economy provides better price for same service 49%
Share Economy provides more convenient customer access 26%
Share Economy provides direct communication and exchange with providers 25%
Each fifth respondent has used Share Economy Hotels and Accommodation services and the high trust traditional hotels enjoy is no barrier to growth.Hotels and Accommodation services were used by 20% of all respondents within the past 12 months and therefore it is the sector with the second highest adoption rate behind Media and Entertainment. Yet, only 14% of all respondent trust a Share Economy provider in this sector, e.g. AirBnB, more than traditional hotels. Despite this low percentage of people who would trust such a provider more, only 15% of all respondents are concerned about a lack of hygiene associated with Share Economy services. This highlights that there is no fundamental mistrust against new providers but rather a strong consumer trust to traditional hotels and accommodation companies. Nonetheless, this trust does not seem to be a barrier to the growth of the Share Economy in this sector as the number of active users is expected to increase by 31% for next year.
The biggest perceived advantage for users is a better price for the same service quality.The average Share Economy Hotels and Accommodation user is 38 years old, has a higher educational background and comes from a city with more than 50,000 inhabitants. Concerning gender and income, user demographics are fairly balanced. According to our data, the largest advantage for users is a better price for the same service, followed by a comfortable access to services and a direct communication and exchange with the providers:
Share Economy adoption rate per country
Germany
Switzerland
Austria
17%
20%
23%
The Netherlands18%
Belgium16%
Turkey33%
User growth rate per country
Germany
Switzerland
Austria
+21%
+16%
+28%
The Netherlands+16%
Belgium+39%
Turkey+65%
Millennials are convinced by new ways of travelling the Share Economy offers as almost each second service in this sector is used by 18 to 29 years olds.On average each user purchases these services 5 times per year ranging between 2 and 3 times in Belgium and the Netherlands and 5 and 10 times in Austria and Turkey. Concerning usage frequency, the most striking consumer behavior differences are among age groups: the 18 to 29 year olds account for almost each second service that is provided. Particularly in Austria and Turkey, this age group is most active and makes up 62% and 65% of uses. This highlights that this sector is especially driven by the Millennials. Similar to this, the 30 to 39 year olds are also very active and make up the second highest group in terms of usage frequency, accounting for 20% of all services.
38 Share Economy 2017
Share Economy 2017 – Industry Deep Dive
Besides, Share Economy services are particularly popular among men: they account for 67% of service usages overall. This percentage is highest in Turkey with 83%, while in Austria women account for 59% of overall usage. Apart from this, people with a higher educational background tend to use these services more actively and this demographic group accounts for 71% of all services purchased. Furthermore, it can be observed that users living in larger cities are more active as 45% of all services are used by people living in cities with more than 100,000 inhabitants. Yet this is different in Switzerland where 59% of these services are consumed by people from cities with fewer than 20,000 inhabitants.
Costs per stay are highest in Switzerland are 5 times higher than in Turkey, but thanks to the active usage of Turks the spending per user is only slightly lower.The average spending per stay at Share Economy Hotel or Accommodation is €79. There are significant national differences and as the diagram shows spending ranges between €32 per usage in Turkey to €145 in Switzerland.
Average spending per user per country
Germany€435
Austria€325
Switzerland€430
The Netherlands€325
Belgium€302
Turkey€378
Planned increase/decrease in spending per country
Users spend on average €397 per year on stays in the Share Economy Hotels and Accommodation sector and national differences are relatively small.
Swiss and German users lead this category with €435 and €430 per user and Austrian and Dutch users are at the lower end of this scale with €325. Given the low cost per stay it is surprising that Turkish users spend on average €378 per year on this sector. This shows that in Turkey, consumers have highly integrated the usage of these services in their lives and enjoy the price advantages Share Economy offers in this sector.
Overall spending per users is expected to decrease slightly by –2% next year. While users plan to increase their spending by 12% in Turkey, in other countries their spending can be expected to increase or decrease moderately and in Switzerland to decrease significantly by 23%.
Average spending per usage per country
Germany
Switzerland
Belgium
Austria
The Netherlands
Turkey
€105
€66
€145
€122
€127
€32
People with high income account for an above average percentage of overall turnover while people with low income tend to be left out (includes Austria, Belgium, Germany and Netherlands).Referring to the overall spending per user group, almost 39% of all turnover is accounted for by people with a household income of over €4k. This observation of the paid Hotels and Accommodation sector is somehow in contrast with the fundamental idea of Share Economy to make goods more accessible to people with lower income and to democratize consumption. In addition to this, only 17% of the overall turnover is contributed by people with an income of below €2k. Therefore, it can be questioned to which extent paid Hotels and Accommodation providers compete with low-cost or rather with premium to luxury hotels. Apart from this, 75% of turnover is generated by people with a higher educational background and 64% by people who are younger than 40 years old. Besides, the overall turnover is relatively balanced with regards to gender and slightly increases with an increasing city size.
Austria+3%
The Netherlands
Switzerland
Germany0%
–3%
–23%
Belgium+2%
Turkey+12%
Share Economy 2017 39
Share Economy 2017 – Industry Deep Dive
1 Annual reports of BMW Group and Daimler.
Providers host on average people on 16 different occasions and people younger than 40 years old and men are particularly active providers.Of the total survey sample 12% of respondents provided Hotels and Accommodation Sharing Economy services within the last 12 months. Each active provider hosted people on average on 16 different occasions, which is similar in frequency with other Sharing Economy sectors. The number of active providers is expected to increase by 3%pt by next year and users plan to offer on average 18 services over the next 12 months which equals an increase of 9%. On average providers are 37 years old, are male, have a higher educational background and a household income of below €3k.
Overall 64% of services are provided by men. The largest provision frequency age group are the 18 to 29 years old and account for 34% all provided stays. In total, 61% of stays are hosted by people younger than 40 years. Interestingly, in most countries the higher the level of education, the more often providers have offered services and in Austria, Germany and Turkey more than 80% of stays are hosted by people with a higher educational background. Yet, in Belgium, the Netherlands and Switzerland more than 60% of services are provided by people with a lower educational background. In contrast to Share Economy consumers in this sector, two out of three services are provided by people with a household income of below €3k and merely 6% by people with a household income above €4k. Concerning the city, it is not very surprising that the majority of services are provided in cities with more than 100,000 inhabitants.
2 Automotive and Transportation
Share Economy adoption rate per country
Germany16%
Austria20%
Switzerland26%
The Netherlands10%
Belgium13%
Turkey40%
Urban mobility environment is changing rapidly – even in smaller cities.
The Automotive and Transportation sector is shaping urban mobility with car-, ride- and bike-sharing offers.The Share Economy Automotive and Transportation sector includes services such as car-, ride- and bike-sharing. Companies like Uber, MyTaxi, Car2Go and DriveNow are transforming urban mobility. Car-sharing fleet operators offer flexible mobility solutions and Car2Go and DriveNow had customer bases of 2.2m and 0.75m people respectively by the end of 2016.1 Additionally, there are peer-to-peer car- and ride-sharing solutions such as Zipcar or Blablacar. The e-hailing sector is also growing rapidly in Europe and both Mytaxi and Taxi.eu have more than 100,000 drivers in Europe. Therefore, the urban mobility environment is changing rapidly – even in smaller cities, in which big players such as Deutsche Bahn, LIDL and particularly regional energy providers develop bike-sharing networks. Based on our data, we estimated the market at €9.5bn; this is expected to grow by 90% within the next 12 months.
The joint efforts of current and new players to mobilize new customers as well as the high trust among users towards providers will help develop this market quickly.According to our data, 19% of all respondents used these services during the last 12 months and this sector therefore ranks third in terms of customer adoption together with the Customer and Consumer Goods sector.
40 Share Economy 2017
Share Economy 2017 – Industry Deep Dive
Significant national differences in the adoption of this sector can be observed: only 10% of respondents in the Netherlands and 13% in Belgium are users in contrast to 40% in Turkey. The overall anticipated growth rate for next year is 27% and all countries show a double digit growth rate; in Turkey it is even 44%. In addition to the growth in the number of consumers who plan to use these services, current players are reinforcing their efforts for quick expansion and new players are emerging, e.g. Free2Move or Coup. Companies have managed to convince users of the reliability and trustworthiness of their offering. Asked if they trust more a Share Economy e-hailing provider such as Uber, 47% Share Economy Automotive and Transportation users agreed to do so, while only 43% trust local taxi companies more (10% of users did not know any e-hailing company). This is particularly relevant for the growth of this sector as 60% of non-users consider trying Share Economy Automotive and Transportation services if a trusted person recommends a certain Share Economy company.
Share Economy provides better price for same service 47%
Share Economy provides more convenient customer access 27%
Share Economy provides higher utilitarian value 26%
Users perceive a better price of Share Economy offers as a major advantage over traditional providers in the Automotive and Transportation sector.The average Automotive and Transportation user is male (58%), is below 40 years old (58%), has a higher educational level (73%) and comes from a city with more than 50,000 inhabitants (57%). More women than men tend to use these services only in Turkey (53%) and the vast majority of users there comes from cities with more than 500,000 inhabitants (70%). According to our data, the most perceived advantage is the better price for the same service, followed by more convenient customer access and a higher customer benefit. This seems very intuitive as the transportation sector is very price- and convenience-driven. Therefore, superior customer value can be provided to customers with a user-friendly, easily-available and convenient service network that considers high price sensitivity of consumers.
Concerning usage frequency, the 18 to 29 year olds (the digital natives who have grown up with mobiles and smartphones) are responsible for more than 60% of overall usage. This customer segment has a high technological affinity and thus particularly appreciates the mobile solutions which Share Economy Automotive and Transportation providers developed to enable on-demand mobility. The fact that only 12% of usage is contributed by people above 50 year olds highlights the almost untapped potential that lies in this customer group. Apart from this, men tend to use these services more frequently than women. It is not very surprising that usage frequency increases with the number of citizens in a city. This is driven by the fact that in these cities Share Economy Automotive and Transportation services are well developed whereas providers are only gradually entering small to medium-sized cities.
Similar to the positive trend in adoption, users are expected to increase their spending in this sector.The average spending per trip is €28. There are considerable national differences:
Average spending per usage per country
Germany€53
Austria€12
Switzerland€28
The Netherlands€31
Belgium€116
Turkey€12
User growth rate per country
Germany
Switzerland
Austria
+23%
+21%
+13%
The Netherlands+33%
Belgium+19%
Turkey+44%
Digital natives account for the majority of usage in this sector while the age group 50+ provides the highest potential for customer mobilizationOn average each user consumes these Share Economy services 10 times per year, which equals the average consumption of two times per year across the whole of society in the countries subject to the study. The range of average usage per year across all countries is very large: in Belgium it is only 3 times per year while in Turkey it is 18 times per year.
Share Economy 2017 41
Share Economy 2017 – Industry Deep Dive
Average spending per user per country
Germany€345
Austria€96
Switzerland€270
The Netherlands€172
Belgium€349
Turkey€226
The range of average is between €12 in Austria or Turkey up to €116 in Belgium. This high range may be explained by the heterogeneity in service offerings and prices between e-hailing and car-sharing as well as urban or long distance usage. Given the average spending per trip and usage frequency it becomes clear that Share Economy Automotive and Transport providers still compete with traditional taxi, car rental and potentially long-distance transport providers. Given the high price difference and only moderate usage frequency, one can deduce that Share Economy providers have not yet developed scale and price efficiencies to offer a real alternative to public transport.
The mean spending per user is €268.
It is highest in Belgium and Germany with €349 and €345 per user and lowest in Austria with only €96 on average. The outlook for next year is predominantly positive as users plan to increase their spending by 15%. In particular, Turkish and Austrian users are intending to spend more in this sector (82% and 23%) while Swiss and German users plan to decrease their spending (–22% and –4%).
Users above 50 years old are a very valuable customer segment while other demographic factors have no decisive influence on spending behavior.In comparison to usage frequency, women in Germany and Turkey spend more than men per trip and thus account for 62% of the overall turnover in these countries. In the remaining markets, men generate 71% of the overall turnover in total. Interestingly, the age group 50+ generates 34% of overall turnover. Given their low usage frequency this highlights again how valuable this customer segment could become to companies if only mobilized by providers. Although people with more than €4k household income account for almost a quarter of overall
turnover, people from all income classes also engage actively in this sector. Similar to this, the size of city of residence does not seem to be a decisive factor for spending per user.
One in every eight respondents provided Share Economy transportation services within the last year.In the sample, 12% provided Share Economy transportation services within the last 12 months. The average number of services per provider is 15. A total of 14% of the respondents plan to provide these services in the next year, resulting in an increase of 22%. Additionally, providers plan to provide more services: 18 times on average. Overall, these findings result in an increase of 40% in the Share Economy Automotive and Transportation supply. However, according to our data the number of services provided in Belgium and Austria is expected to decrease by 22% and 17% respectively.
Most providers are male and younger than 40 years and have a monthly disposable household income of less than €3k.Providers are predominantly male, younger than 40 years and have an educational level of A-level or higher. In Switzerland 58% of all providers have an education level of below A-level. In Austria, Belgium, Germany and the Netherlands 60% of providers have a household income of less than €3k per month and most providers come from cities with more than 100,000 inhabitants. In terms of provision frequency, 65% of all Share Economy transport services are provided by male providers and 60% by people younger than 40 years. Besides, 75% of all services are provided by people living in cities with more than 50,000 inhabitants. Furthermore, providers with low income levels tend to be more active: in Austria, Belgium, Germany and the Netherlands 70% of all services were provided by people with a disposable household income of less than €3k.
Planned increase/decrease in spending per country
Switzerland
Austria
Germany–4%
+23%
–22%
The Netherlands+17%
Belgium+5%
Turkey+82%
42 Share Economy 2017
Share Economy 2017 – Industry Deep Dive
3 Retail and Consumer GoodsThe last decade has seen the arrival of a high number of platforms focusing on the second-hand market.The Share Economy Retail and Consumer Goods facilitates peer-to-peer sharing and reselling of consumer goods via digital market places. eBay was one of the first companies to create a digital marketplace in this sector and over the last decade a wide range of start-ups has appeared that cover for instance flea markets, second hand retail and sharing of clothing etc. For example Rent the Runway, Le Toe and Chic by Choice focus on female premium and luxury fashion. These companies try on the one hand to democratize luxury fashion and on the other hand reduce waste associated with fashion production by enabling their consumers to rent fashion over a digital platform. Other platforms such as Vinted position themselves as a peer-to-peer sales platform for second-hand fashion. Furthermore, a significant niche market that focuses on baby clothing and toys has also arisen. This market is difficult to isolate as also many corporate providers interact on these market players and according to our data, we estimate it at €9.9bn across all countries subject to the study.
This sector has been observed to be used by only few consumers in Belgium (6%) and the Netherlands (7%), while it is well developed in Turkey (44%). Little surprisingly most non-users of this sector trust traditional fashion outlets more than online second-hand platforms, such as Vinted, and 40% of these do not know any Share Economy provider in this sector. Although Share Economy users also trust traditional outlets more (56%), they have a very positive attitude towards Share Economy in general: 77% of them agree that Share Economy is better for the environment and 82% agree that it helps reduce waste. Interestingly, 55% of users and only 35% of non-users in this sector trust brands less nowadays. This sector is developing rapidly and a total of 23% of all respondents plan to use these services within the next year which equals an overall growth of 23%. Particularly the Belgian and Swiss sectors are developing rapidly with user growth rates of above 50%. In Austria the number of users is expected not to increase in the next year.
User growth rate per country
Germany+14%
Austria0%
Switzerland+58%
The Netherlands+35%
Turkey+29%
Belgium+63%
Share Economy adoption rate per country
Germany20%
Austria20%
Switzerland13%
The Netherlands7%
Turkey44%
Belgium6%
Although users in this sector still trust traditional outlets more, they are convinced of the positive effects on society of share economy. On average 19% of all respondents used these services within the last 12 months and therefore it ranks third with Automotive and Transportation in terms of adoption level behind Media and Entertainment and Hotels and Accommodation.
Share Economy 2017 43
Share Economy 2017 – Industry Deep Dive
The majority of users are female, on average 37.5 years old and have a monthly disposable household income of below €3k.The average Share Economy Retail and Consumer Goods consumer is 37.5 years old, is female and has a higher educational background. Concerning income and size of city of residence user demographics are fairly balanced. Users of this sector highly appreciate that Share Economy offers a lower price for the same performance, a wide range of choices as well as more convenient customer access:
Share Economy provides better price for same service 46%
Share Economy provides a wide range of choices 26%
Share Economy provides more convenient customer access 25%
Users purchase or share on average 9 times per year in this sector and people with a household income below €3k tend to be more active.Each user purchases Share Economy Retail and Consumer Goods services on average 9 times per year. Belgian users are least active with an average usage of 3 times per year whereas Turkish users have an average usage of 13 times. Concerning usage frequency, the majority (54%) of services are purchased by women and 68% of all services by people younger than 40 years old. Furthermore, 71% of the overall number of services are
purchased by people with a household income of below €3k. Additionally, people from cities with more than 100,000 inhabitants use these services more frequently than people from smaller cities (52% of the total number of usage) and 70% of services are accounted for by people with a higher educational background.
The average spending per usage in the Share Economy Retail and Consumer Goods sector is relatively low with €25 and users plan to increase their spending.The average expense per usage – sharing or purchasing second-hand fashion – is €25.
Average spending per usage per country
Germany€25
Austria€17
Switzerland€88
The Netherlands€55
Belgium€14
Turkey€20
Switzerland leads the field in this category and has considerably higher cost per usage with €88 while this cost is only €14 and €17 in Belgium and Germany.
Average spending per user per country
Germany€198
Austria€125
Switzerland€336
The Netherlands€326
Belgium€40
Turkey€268
Planned increase/decrease in spending per country
Germany–6%
Austria+1%
Switzerland–28%
The Netherlands–38%
Belgium+862%
Turkey+36%
Users spend on average €218 per year in this sector.
44 Share Economy 2017
Share Economy 2017 – Industry Deep Dive
National differences are considerably high, as Swiss users tend to spend €336 whereas Belgian users spend only €40 per year. Swiss and Dutch users plan to decrease their spending by over 25% in contrast to Belgian and Turkish users who are expected to increase their spending. The overall spending per user is expected to increase by a double-digit rate.
The Share Economy Retail and Consumer Goods sector has developed a strong premium segment, in which particularly high income groups participate.Concerning the overall spending behavior, it has been revealed that people with a household income above €4k generate 41% of the overall turnover in this sector. This is particularly significant since they account for only 10% of the overall usage frequency. Consequently, it becomes clear that there is a strong premium and probably even luxury sector within the Share Economy Consumer Goods and Retail sphere, in which predominantly people with income participate.
The age group of users below 29 years old accounts for 51% of the overall turnover in this sector. Therefore, this group drives the demand in the Share Economy Retail and Consumer Goods sector and is a very important target group. Furthermore, it can be observed that spending in this sector decreases with increasing age and people above 60 years old account only for 7% of the overall turnover. Besides, 79% of all turnover is generated by people with a higher educational level and 52% by people living in cities with more than 100,000 inhabitants.
16% of all respondents provided Share Economy retail services within the last year and most providers are female and younger than 40 years old.Our survey data shows that the provision of Share Economy retail services is relatively common and providers offer services on a frequent basis: 19 times per year on average. 19% of respondents plan to provide Share Economy Retail and Consumer Goods services next year, resulting in an increase of 20% in comparison to the current status. Overall, 53% of all service providers are women. However, in Belgium and the Netherlands 72% and 60% of all providers are male. Besides, 62% of provider are younger than 40 years and the average age of providers is 37.3 years. Except for Switzerland, the majority of providers in the other countries has a higher educational level: 70% of all providers. In Switzerland only 47% of providers have a higher educational background. Besides, 65% of all respondents in Austria, Belgium, Germany and the Netherlands have a monthly disposable household income below €3k and 49% of all providers come from cities with more than 100,000 inhabitants. In Belgium, the Netherlands and Turkey, the figures are 12%, 20% and 85% of all providers respectively.
Most active providers are male, are younger than 40 years and have a monthly disposable household income of less than €3k.Relative to the provision frequency, more services are provided by people above 40 years: 53% of the total number of services. There are significant national differences: While in the Netherlands only 31% of all services are provided by people older than 40 years, in Austria 69% of all services and in Turkey 57% of all services are provided by people in this age group. Apart from this, 69% of all services in Austria, Belgium, the Netherlands and Germany are provided by people with a disposable household income of less than €3k.
Share Economy providers offer services 19 times per year on average.
Share Economy 2017 45
Share Economy 2017 – Industry Deep Dive
4 ServicesThe sharing economy industry for services includes providers that offer household services or platforms such as Appjobber, streetspotr, FragNebenan and many more. This sector features not only platforms and providers with a free usage principle but also platforms with a pay-per-use policy. In 2016/17 the market for services Share Economy was €7.4bn. Shared economy services in this industry show an increasing trend with a planned growth rate of 61% for next year across all countries.
65% of users in this sector are still concerned that anyone could easily become a professional provider regardless of qualifications.Only 14% of all consumers participated in the Share Economy Service sector within the past 12 months (2016/17), which represents one of the lowest adoption rates among all Share Economy sectors.
Demographic factors seem to be fairly unrelated to adoption level and as in other Share Economy sectors, a better price is seen as a main advantage.Users of the Share Economy Service sector are on average 40 years old and the adoption rate only slightly decreases with increasing age. Furthermore, it has been observed that consumers tend to participate in this sector regardless of gender, income and size of home town. Users perceive a better price for the same service as the largest advantage, followed by comfortable access to services and higher consumer benefits:
Share Economy adoption rate per country
Germany13%
Austria13%
Switzerland11%
The Netherlands9%
Belgium8%
Turkey33%
User growth rate per country
Germany+37%
Austria+43%
Switzerland+57%
The Netherlands+40%
Belgium+100%
Turkey+59% Share Economy provides better price for same service 41%
Share Economy provides more convenient customer access 24%
Except for Turkey, countries are fairly homogeneous within this sector and adoption rates range between 8% and 13%. Even though 39% of users trust some Share Economy providers that connect consumers with private craftsmen more than local craft business (in contrast to 48% who do not), 65% of them are concerned that everyone regardless of prior education could become a professional. This means that companies clearly need to certify and check the professional qualifications of people who would like to provide services to their peers. Given a certain security standards for consumers, this sector can be expected to grow in the next year by over 35% in the markets subject to the study.
46 Share Economy 2017
Share Economy 2017 – Industry Deep Dive
The usage frequency is fairly independent of socio-demographic factors, indicating that anyone can use these services.It has been observed that the average usage per respondent is 0.7 times and per active user 5 times within the last 12 months. Per respondent, Turkey (3 times) and Germany (1 time) show the highest usage frequency, Belgium (0.2 times) and Austria (0.3 times) depict the lowest. Active users consume these services most often in Turkey – 9 times a year and least in Belgium – 3 times a year. On average, men tend to make more frequent use of the Share Economy Service sector: 61% of all services are used by them and this percentage is particularly high in Belgium with 78% and in Germany with 70%. The Netherlands represent the only exception with 57% of female users for services. The largest user group in all countries are people aged 18–29 and account for 49% of overall uses in general and little national differences exist in their consumption behavior. On average for all countries, the extent to which users engage in the Share Economy Service sector reflects the level of education of the consumer: 71% of services are used by people with a higher educational background. In Austria and Germany this group is less active with 60% and 53% of all services used. Besides, users consume these services actively across all income groups and almost regardless of their home town size.
Planned increase/decrease in spending per country
Germany–9%
Austria+21%
Switzerland+219%
The Netherlands–21%
Belgium–20%
Turkey+7%
Average spending per usage per country
Germany€59
Austria€68
Switzerland€50
The Netherlands€39
Belgium€253
Turkey€28
Average spending per user per country
Germany€252
Austria€138
Switzerland€155
The Netherlands€127
Belgium€681
Turkey€236
The highest spending per usage is found in Belgium (€253) and Austria (€68), the lowest values are in Turkey (€28) and the Netherlands (€39). Across all respondents the average spending per respondent is €35, the average spending per active user of Share Economy services is €244 on average.
Average planned spending per active user is €244 and overall there is a positive trend in the spending behavior of users.The average spending per usage is €50 for all countries.
Share Economy 2017 47
Share Economy 2017 – Industry Deep Dive
Belgium (€681) and Germany (€252) represent the highest average spending per user; the Netherlands (€127) and Austria (€138) depict the lowest average spending per active user in the last 12 months.
Users plan to increase their spending on average by 11% to €271 and Belgium leads this category with €548 per user in contrast to the Netherlands where spending per user is expected to drop to €100.
Millennials as well as people with a higher educational background are driving the turnover of the Sharing Economy service sector.Although the age group younger than 29 years old accounts for only 31% of overall services used, it generates 49% of overall turnover in the Share Economy Service sector. Other age groups tend to spend less on the services they use. Spending between women and men is relatively balanced, though women tend to spend a bit more. 81% of spending is from users with an A-level or higher, indicating a strong relationship between education level and spending. 47% of overall spending in Austria, Belgium, Germany and Netherlands is from people with a monthly household income of less than €3,000; 31% of total spending is from users with an income of more than €4,000. This finding emphasizes that users do not make use of sharing economy services solely for money saving reasons. Lastly, 34% of total spending is from users living in cities with a population of above 500,000 inhabitants, in Turkey this user city category represents 63% of spending and in Germany 42%.
12% of respondents provide on average 16 services per year and the overall number of services provided is expected to increase by 37%.Across all countries, 12% of respondents have provided services in the SE Service sector over the last year and 15% plan to do so next year, representing an increase of 24% in the number of providers. On average respondents provided 2 services and providers provided 16 Sharing Economy services over the last year and 3 and 18 services respectively are planned for next year. Consequently, the overall number of services provided is expected to grow by approx. 37%. Overall, 70% of services are provided by men and the highest proportion of male provision can be observed in Austria and Germany: 85% and 79% of all services. The age
71% of all providers have an education level of A-level or higher.
group with the highest provision for services on average are 18–29 years old representing 28% of total services provided and the average provider is 38.7 years old. 71% of all providers have an education level of A-level or higher. On average 35% of providers in AT, BE, DE and NL have a monthly disposable income of €2,000–3,000; in Belgium this income class represents 65% of total provision. Concerning the city size of providers the highest ratios are from cities with a population size of more than 500,000 (34%). 60 % of service provisions are from people living in cities with fewer than 100,000 inhabitants; in Switzerland the majority of service providers are from cities between 5,000 and 20,000 inhabitants (57%). The corresponding figures for Belgium and Austria are 27% and 26% respectively.
48 Share Economy 2017
Share Economy 2017 – Industry Deep Dive
5 FinanceThe Share Economy Finance sector includes peer-to-peer lending and borrowing, crowd-funding and social payments. By relying on innovative risk assessment systems, Fintech start-ups such as auxmoney enable consumers whose credit applications might be falsely declined by banks to receive a correct risk assessment and apply for loans via their platforms. These are often free market places that enable organizational and private investors to finance these loans. A significant share of the turnover at these platforms is based on peer-to-peer lending which can be seen as a form of sharing economy. Furthermore, companies such as Kickstarter or Startnext have specialized into crowdfunding.
According to our data, we estimated the Share Economy Finance market for all countries subject to the study at €22.2bn and expect relatively moderate growth of 9% for next year.
The Finance sector has the second lowest number of active users and uncertainty in case of liability issues and a lack of awareness are highest growth barriers.The Share Economy Finance sector is the second least used sector of industries examined in this study. 11% of all respondents actively use it.
Share Economy adoption rate per country
Germany9%
Austria9%
Switzerland6%
The Netherlands7%
Belgium6%
Turkey30%
User growth rate per country
Germany+2%
Austria+20%
Switzerland+45%
The Netherlands+17%
Belgium+45%
Turkey+46%
One barrier to customer mobilization for Share Economy providers is that 37% of all non-users currently do not know any Share Economy financial platform. Furthermore, providers should address consumer concerns related to liability questions and lack of security of Share Economy Services. Currently, 45% of non-users consider unclear liability in case of issues as a major disadvantage of Share Economy. If these concerns can be addressed and consumer awareness can be further increased, the number of active users might grow more strongly next year than the expected increase of 2%pt based on our data.
Better price, more convenient customer access and wider range of choices are considered as major advantages of Share Economy by a predominantly male Finance clientele.Users are predominantly male (65%) and have a higher educational background (76%) and an average age of 36.5 years, but users exist across all age groups. Although 47% of users come from cities with more than 100,000 inhabitants, users can be found in cities regardless of their size. The same holds true for income as people with different income levels participate in the Share Economy Finance sector. Although financial parameters can be expected to be the main driver of the Share Economy Finance sector, only 38% of Finance users agree that Share Economy offers a better price for the same services in contrast to 36% of non-users. Other perceived advantages are the more convenient access to services and a wider range of choices for Share Economy services.
Share Economy provides better price for same service 38%
Share Economy provides more convenient customer access 25%
Share Economy provides a wider range of choices 24%
Definition crowdfunding
The practice of funding a project or venture by raising money from a large number of people who each contribute a relatively small amount, typically via the Internet.
Particularly, in Turkey the sector is widely adopted as 30% of respondents already use it there. Switzerland and Belgium rank last in terms of consumer adoption with only 6% active users among the respondents. More than 50% of both Finance users and non-users trust traditional financial service providers more than Share Economy providers in this sector. On the other hand, at least 30% of users consider the latter providers more trustworthy in contrast to only 8% among non-users.
Share Economy 2017 49
Share Economy 2017 – Industry Deep Dive
Similar to the traditional Finance sector, Share Economy Finance services are predominantly used by male users with a high income level.The average usage frequency is 0.6 times for all respondents and 5,4 times per user. Turkish users engage most actively in Share Economy Finance with an average of 9 times a year, whereas Dutch users tend to purchase these services only 2 times a year. Similar to the high proportion among users in general, 71% of all Finance services are provided to men. However, female users in the Netherlands are very active and account for 43% of all service provision. Apart from this, it can be observed that the demand for Finance services increases with the household income of users: 37% of all services are used by people with an income level of above €4k. Besides, almost each second Share Economy Finance service is purchased by a person from a city with more than 500,000 inhabitants. Although across all countries, people with a higher educational background account for almost 3 out of 4 purchases, in Switzerland people with a lower educational background have also identified the potential of Share Economy Finance services and are responsible for 50% of the number of services provided.
Mean spending per user is €1,088 and but a decrease of 26% is expected.The average spending per usage is €202.
Average spending per usage per country
Germany€278
Austria€679
Switzerland€832
The Netherlands€639
Belgium€129
Turkey€74
Planned increase/decrease in spending per user per country
Germany–26%
Austria–49%
Switzerland–18%
The Netherlands–62%
Belgium–19%
Turkey–5%
In Turkey spending per usage is lowest with €74 and Switzerland leads this category with €832 per usage.
Average spending per user per country
Germany€1,229
Austria€1,358
Switzerland€2,415
The Netherlands€1,082
Belgium€412
Turkey€701
Active users spend on average €1,088 per year.
37% of all Finance services are used by people with an income level of above €4k.
50 Share Economy 2017
Share Economy 2017 – Industry Deep Dive
Swiss users tend to spend €2,415 per year while Belgian users spend only €412. Consequently, the Share Economy Finance sector has been clearly identified as the sector with the highest spending per user. Nonetheless, respondents plan to spend 9% less on Share Economy Finance services next year and active users plan to spend 26% less. This spending is expected to decrease most in the Netherlands and Austria: by 62% and 49% respectively.
Approximately 9% of all respondents provide Share Economy Finance services and most of them are male and younger than 40 years.According to our data, only 9% of respondents provide Share Economy services in the finance sector but on a frequent basis: on average 16 times per year. In Austria the mean provision per provider is 6 per year; in Germany and Netherlands this average is 11 times per year and in the remaining countries it is 17 times or above. The number of providers and the average of service provisions per provider are expected to increase by 18% and 15% next year. Overall, 63% of all finance providers are men. In Belgium and Germany this percentage is 77% and 72% while in
Turkey it is only 54%. Besides, the mean age of providers is 36.5 years and the youngest average is in Austria where 57% of all providers are younger than 29 years. In addition to this, 64% of all providers are younger than 40 years old. The majority of providers in all countries have a higher educational background and the average of providers with a higher educational background is 75%. Besides, people across all income levels provide financial Share Economy services and the majority of financial shared economy services come from cities with more than 100,000 inhabitants.
Male providers and providers from cities with more than 500,000 inhabitants are most active.Overall male providers tend to be more active since 68% of all services are provided by men. 52% of all services were provided by people younger than 40 years and particularly providers between 50 and 59 years were very active accounting for 25% of all service provisions. Furthermore, 42% of all services were provided by people with a household income between €2k and €3k. Besides, 52% of all services were provided by people living in cities with more than 500,000 inhabitants.
The Share Economy Finance sector is the one with the highest spending per user.
Share Economy 2017 51
Share Economy 2017 – Industry Deep Dive
Share Economy adoption rate per country
Germany23%
Austria28%
Switzerland25%
The Netherlands35%
Belgium22%
Turkey49%
6 Media and EntertainmentMedia and Entertainment sector with highest growth rate (107%)The sharing economy industry for Media and Entertainment includes platforms such as Spotify, SoundCloud, Hitflip, Bookelo and many more. This sector features not only platforms with a free usage principle but also platforms with a pay-per-use or a monthly fee policy. In 2016/17 the market for Media and Entertainment Share Economy was €3.7bn. Shared economy services in this industry show an increasing trend with a planned growth rate of 107% for the upcoming year.
The Share Economy Media and Entertainment providers managed to create a high level of trust among consumers reaching a high adoption level.Taking all respondents into consideration services within this sector were used by 28% of all respondents within the past 12 months (2016/17) which represents the highest adoption among all respondents. Translated to the entire population this means that almost every third person has used some type of sharing economy service for media or entertainment in the last year.
Drivers for the Share Economy Media and Entertainment sectors are predominantly price and convenience.Average users of the Share Economy Media and Entertainment sector are younger than 40 years old. Although 37% of users are older than 40 years old, adoption rate decreases with increasing age. Besides, the user profiles are very heterogeneous and people use these services regardless of their gender, income level, city size and educational background (although people with higher education have a slightly higher adoption rate). Users perceive that the most significant advantages of the Share Economy are that it offers a better price for the same performance, followed by more comfortable access to services and direct communication and exchange with the providers:
Share Economy provides better price for same service 46%
Share Economy provides more convenient customer access 25%
Share Economy provides direct communication and exchange with providers 25%
User growth rate per country
Germany
Austria
Switzerland
–8%
–11%
–11%
The Netherlands–33%
Belgium–19%
Turkey+24%
The Belgian sample showed the lowest adoption rate with 22% in contrast to the Turkish sample with an adoption rate of 49%. Share Economy providers in this sector managed to create a very good reputation and trust among its consumers: 67% of users trust Share Economy providers such as Spotify more than traditional providers whereas only 27% of users trust traditional providers more. Additionally, 42% of non-users trust Share Economy providers more, which means that trust is no barrier for growth in this sector.
52 Share Economy 2017
Share Economy 2017 – Industry Deep Dive
Digital natives make up most of the consumption in this sector and usage rates indicates that it has become a central part in the lives of users.Among all respondents the average usage was 9 times within the last year; the Netherlands show the highest usage rates with 21 times per year while Belgium shows the lowest usage rate 6 times per year. On average active users utilized Media and Entertainment offers over 33 times, which represents the highest value for all sharing economy industries by far. This can be explained by the low costs and significantly low usage barriers – online registration is often not required as for instance at SoundCloud. Dutch users consume these services most frequently with an average over 60 times per year, whereas the corresponding figure for Germans is only 29 times per year. These rates show that for many consumers Share Economy Media and Entertainment services have become a central part in their lives and that they use them at least at a weekly level.
The largest usage age group, accounting for 58% of all uses, are the digital natives or the 18–29 year olds across all countries – in Switzerland and Austria they even make up more than 70% of overall usage. Similar to the proportion of users, people with a higher educational background account for a higher share of uses. The usage frequency on average is evenly spread across all income levels which indicates that lower income classes are not excluded from consumption and that the Share Economy Media and Entertainment sector is also popular among people with higher income levels. Furthermore, the city size and gender seem not to be crucial indicators for usage intensity in this Share Economy sector.
The average spending per user in the Share Economy Media and Entertainment sector is expected to increase next year.The spending per respondent per year is €18 and per active user €64.
Average spending per user per country
Germany€62
Austria€41
Switzerland€91
The Netherlands€56
Belgium€46
Turkey€81
Planned increase/decrease in spending per user per country
Germany+35%
Austria+40%
Switzerland+24%
The Netherlands+52%
Belgium+385%
Turkey+104%
Users in Switzerland spend on average most: €91 per year. This is followed by Turkey with €81 per year and Belgium and Austria show the lowest average spending: €46 and €41.
The average planned spending of all respondents is €30 per person across all countries, and of active users it is €116 on average. The highest individual spending can be observed for Belgium with €224 while in Austria users plan to spend only €58. Consequently, an increase of 81% among users on an individual level can be expected.
Digital natives seem to be more price sensitive than other user segments and therefore also more intensely use platforms that are free of charge.Considering all Share Economy users of this industry, men account for 61% of all spending. The 18 to 29 year olds make up the highest individual percentage of this industry’s turnover: 41%. Consequently, it can be deduced that this target group is relatively price sensitive and spends less compared to others as its high share of overall usage (58%) does not translate completely into additional revenues. The same holds true for consumers with a disposable household income: they make up 15% of overall uses but only 4% of the revenues. This discrepancy can also be explained by the wide offering of free content platforms such as Soundcloud. The size of a home town of users appears to be an indecisive factor concerning user spending as users spending across users of different city sizes is relatively balanced. Besides, users with a higher educational background tend to pay only marginally more than the amount which would be explained by their usage frequency.
Share Economy 2017 53
Share Economy 2017 – Industry Deep Dive
Share Economy adoption rate per country
Germany8%
Austria13%
Switzerland6%
The Netherlands9%
Belgium6%
Turkey27%
User growth rate per country
Germany+51%
Austria+3%
Switzerland+76%
The Netherlands+15%
Belgium+69%
Turkey+73%
Number of offerings per provider expected to increase by 4% next year.Of all respondents 12% have provided Media or Entertainment Share Economy services during the past 12 months. Of all respondents the provision was 2 times in the last year and 18 times for active providers of Media and Entertainment sharing economy services. Providers of services plan to offer on average 19 services next year; consequently the number of Media and Entertainment services per provider are expected to grow by 4%; Austrians plan the highest provision increase with 42%. Of all the Media and Entertainment services 63% are provided by men. The age group with the highest provision are 18–39 year olds accounting for 38% of all services provided; in Austria this age group represents 89%, in Switzerland 49%. 64% of all providers are under 40 years and 77% of all providers have an education level of A-levels or higher, in Austria the ratio between above A-level and below is 50%. Concerning household income, 32% of all service provisions in Austria, Belgium, Germany and Netherlands are accounted for by people with an income of €2,000–3,000 per month; in Austria this income range accounts for 72% of all provisions, in Belgium 41%, however in the Netherlands only 14%. 41% of provisions are from people living in cities with a population of more than 500,000 inhabitants; in Germany 57% of all provided services are generated in cities with 50,000–100,000 inhabitants, in Austria and Belgium the majority of services provided are from cities with 5,000–20,000 inhabitants (67% and 56% respectively).
7 MachineryThe Machinery Share Economy sector leverages the efficiencies and cost savings associated with sharing assets that are fairly underutilized. Particularly specialized equipment that requires high upfront investment and is seldom used offers the greatest potential, since users are more likely to face the inconvenience of sharing these tangible assets. An example for successful organizations which have addressed this problem are national machinery ring associations. Furthermore, in Germany there are also companies addressing the B2C or peer-to-peer segment such as Mietbox24. Based on our data, we estimated this market at €5.0bn for the countries in scope of the study.
Machinery sharing in the B2C and peer-to peer segment is in an early maturity stage and therefore has particularly high growth potential in this sector.Machinery sharing is the least used Share Economy sector with an average of 10% of users among the respondents.
While in Turkey 27% of all respondents are users, this proportion is only 6% in Switzerland and Belgium. The average user is male, younger than 40 years old and comes from a city with fewer than 50,000 inhabitants. The percentage of people from such cities is particularly high in Austria, Belgium, the Netherlands and Switzerland with 69% on average which indicates a more rural usage of Machinery Sharing in these countries. Concerning income level, 60% of users have a monthly disposable income of less than €3k.
54 Share Economy 2017
Share Economy 2017 – Industry Deep Dive
While in Belgium and Switzerland rural markets are particularly strong, most revenues in Turkey are generated in big cities.The average spending per usage is €39. Usage costs are high in Belgium and Switzerland with €203 and €150 on average. In contrast to this, in Turkey, the Netherlands and Germany spending per usage is on average considerably lower with only €21, €32 and €36 respectively. This usage cost difference can be explained due to a higher proportion of uses in Belgium and Switzerland in a rural area, which can be expected to be more cost intensive.
The mean spending per user ranges on a country level from €155 in Germany to €645 in Belgium and is overall €221 per user.
Average spending per user per country
Germany€155
Austria€188
Switzerland€341
The Netherlands€167
Belgium€645
Turkey€213
Average spending per usage per country
Germany€36
Austria€91
Switzerland€150
The Netherlands€32
Belgium€203
Turkey€21
Share Economy provides better price for same service 38%
Share Economy provides more convenient customer access 24%
In total, 15% of all respondents plan to use these services next year, which would imply a 49% increase of the number of users. Particularly in Belgium, Germany, Switzerland and Turkey growth rates are above 50% whereas in Austria the number of users is not expected to grow strongly. Users perceive price, more convenient access and a higher customer benefits as main advantages:
Frequent Machinery Sharing users are predominantly male and they are to be found mostly in a rural area.The average usage frequency among all consumers is 0.6 times and across users it is 6 times. Turkish user in particular purchase sharing machinery services frequently: 10 times per year on average. In contrast to this Austrian and Swiss users buy these services only 2 times on average.
Similar to their proportion among active users, men consume 58% of all machinery sharing services. Further-more, usage frequency decreases with age and the 18 to 39 year olds make up 65% of the overall machinery sharing demand. Furthermore, in general 47% of overall services are accounted for by people from cities with fewer than 20,000 inhabitants and rural usage of machinery sharing can be observed especially in Switzerland: 82% of all services were provided to people living in cities with fewer than 5,000 inhabitants. Apart from this, it can be observed that people with a higher educational background accounted for the majority of service provisions in both urban and rural areas. This is connected with the high industrialization and thus technological know-how required in the agricultural sector.
Share Economy 2017 55
Share Economy 2017 – Industry Deep Dive
Approximately 9% of all respondents provide machinery sharing services and providers are predominantly from cities with fewer than 20,000 inhabitants.According to our data, 9% of all respondents provided machinery sharing services within the last 12 months. While in Turkey the average of all respondents providing these services is 35%, in the remaining countries this respective value is approx. 5%. 10% of all respondents plan to provide these services next year, resulting in an overall increase of 18%. Particularly more people plan to provide services in Austria (growth rate of 47%).
On average 62% of providers are male and 64% of them are younger than 40 years. Furthermore except for Switzerland and Belgium the majority of these has a higher educational background, more than 60% on average. Above a household income of €3,000 the number of providers tends to decrease for Austria, Belgium, Germany and the Netherlands. Besides, it can be observed that 58% of providers in Germany and Turkey come from cities with more than 100,000 inhabitants, while in the remaining countries on average 56% of providers live in cities with fewer than 20,000 people.
The majority of active providers are male, younger than 40 years of age and in most countries from cities with fewer than 20,000 inhabitants.Men and people younger than 40 years were most active providers, accounting on average for 77% and 70% of all services provided. Except for Switzerland, providers with an A-level or higher educational background tended to be more active and 74% of all services were provided by people with such a background. Besides, it can be observed that except for people with a disposable household income of below €1k, people engage actively in machinery sharing regardless of their wage levels. Additionally, 73% of all services in Germany and Turkey are provided by people from cities with more than 100,000 inhabitants in contrast to the other countries in which 74% of all services are provided by people from cities with fewer than 20,000 inhabitants.
On average 62% of machinery sharing providers are male and 64% of them are younger than 40 years.
Users indicate that they plan to increase their individual spending by 5% on average to €233. According to our data, Swiss users are expected to decrease their spending on share machinery services significantly. Austrian, German and Belgian users plan to also decrease their spending slightly, whereas Dutch and Turkish users are expected to increase spending by more than 20%.
Similar to their usage frequency men spend significantly more than women on Machinery Sharing services. The same holds true for the educational background of people as well age groups where 64% of overall revenues are generated by people younger than 40 years old. Apart from this, it can be observed that in Austria, Belgium, the Netherlands and Switzerland 90% of all spending is attributable to people living in cities with fewer than 50,000 inhabitants. In contrast to this in Germany and Turkey where 60% of all spending is generated by consumers from cities with more than 100,000 inhabitants.
Planned increase/decrease in spending per user per country
About usAt PwC, our purpose is to build trust in society and solve important problems. We’re a network of firms in 158 countries with more than 236,000 people who are committed to delivering quality in assurance, advisory and tax services.
PwC refers to the PwC network and/or one or more of its member firms, each of which is a separate legal entity. Please see www.pwc.com/structure for further details.
Contacts
Switzerland
Alexander Schultz-WirthTel: +41 58 792-4400Mobile: +41 79 250-24 [email protected]