+ All Categories
Home > Documents > SharePoint 2010 Technical Case Study: Microsoft SharePoint ... · SharePoint 2010 Technical Case...

SharePoint 2010 Technical Case Study: Microsoft SharePoint ... · SharePoint 2010 Technical Case...

Date post: 19-Sep-2018
Category:
Upload: dinhngoc
View: 228 times
Download: 0 times
Share this document with a friend
13
SharePoint 2010 Technical Case Study: Microsoft SharePoint Server 2010 Social Environment This document is provided “as-is”. Information and views expressed in this document, including URL and other Internet Web site references, may change without notice. You bear the risk of using it. Some examples depicted herein are provided for illustration only and are fictitious. No real association or connection is intended or should be inferred. This document does not provide you with any legal rights to any intellectual property in any Microsoft product. You may copy and use this document for your internal, reference purposes. © 2010 Microsoft Corporation. All rights reserved.
Transcript

SharePoint 2010 Technical Case Study: Microsoft SharePoint Server 2010 Social Environment This document is provided “as-is”. Information and views expressed in this document, including URL and

other Internet Web site references, may change without notice. You bear the risk of using it.

Some examples depicted herein are provided for illustration only and are fictitious. No real association or

connection is intended or should be inferred.

This document does not provide you with any legal rights to any intellectual property in any Microsoft

product. You may copy and use this document for your internal, reference purposes.

© 2010 Microsoft Corporation. All rights reserved.

SharePoint 2010 Technical Case Study: SharePoint Server 2010 Social Environment

Microsoft Corporation

September 19, 2010

Applies to: SharePoint Server 2010

Summary: This document describes a specific deployment of Microsoft® SharePoint® Server 2010, including:

Technical case study environment specifications, such as hardware, farm topology and configuration.

The workload, including the number, and types, of users or clients, and environment usage characteristics.

Technical case study farm dataset, including database contents and search indexes.

Health and performance data specific to the environment.

Contents Prerequisite information ...................................................................................................................................... 4 Introduction ...................................................................................................................................................... 5 Specifications .................................................................................................................................................... 6

Hardware .................................................................................................................................................... 6

Topology ..................................................................................................................................................... 9

Configuration............................................................................................................................................. 10 Workload ........................................................................................................................................................ 11 Dataset ........................................................................................................................................................... 11 Health and Performance Data ............................................................................................................................ 12

General Counters ....................................................................................................................................... 12

Database counters ..................................................................................................................................... 13

Prerequisite information Before reading this document, it is important that you understand the key concepts behind Microsoft® SharePoint®

Server 2010 capacity management. The following documentation will help you learn about the recommended approach

to capacity management and provide context for helping you understand how to make effective use of the information

in this document, as well as define the terms used throughout this document.

For more conceptual information about performance and capacity that that you might find valuable in understanding

the context of the data in this technical case study, see the following documents:

Capacity management and sizing for SharePoint Server 2010

SharePoint Server 2010 Capacity Management: Software Boundaries and Limits

Introduction This white paper describes an actual SharePoint Server 2010 environment at Microsoft. Use this document to compare

against your planned workload and usage characteristics. If your planned design is similar, you can use the deployment

described here as a starting point for your own installation.

This document includes:

Specifications, which include hardware, topology, and configuration.

Workload, which is the demand on the farm, including the number of users, and the usage characteristics.

Dataset, including database sizes.

Health and performance data specific to the environment.

This document is part of a series of technical case studies about SharePoint environments at Microsoft.

Published

Intranet

Intranet

Collaboration

Departmental

CollaborationSocial

SharePoint Environments at Microsoft

The SharePoint environment described in this document is a production environment at a large, geographically

distributed company. This environment hosts SharePoint My Sites that connect employees with each other and the

information they need. Employees use this environment to present personal information such as areas of expertise, past

projects, and colleagues to the wider organization. The environment also hosts personal sites and documents for

viewing, editing, and collaboration. My Sites are integrated with Active Directory® Domain Services (AD DS) to provide a

central location accessible from the browser and a variety of client applications.

As many as 72,000 unique users visit the environment on a busy day, generating up to 180 requests per second (RPS)

during peak hours. Because this is an intranet site, all users are authenticated.

The information provided in this document reflects the enterprise social environment on a typical day.

Specifications This section provides detailed information about the hardware, software, topology, and configuration of the case study

environment.

Hardware

Note

This environment is scaled to accommodate pre-release builds of SharePoint Server 2010 and

other products. Hence, the hardware deployed has greater capacity than necessary to serve

the demand typically experienced by this environment. This hardware is described only to

provide additional context for this environment and serve as a starting point for similar

environments.

It is important to conduct your own capacity management based on your planned workload

and usage characteristics. For more information on the capacity management process, see

Performance and capacity management.

Web Servers

There are three Web servers in the farm, each with identical hardware. Two serve content, and the third is a dedicated

search crawl target.

Web Server WFE1-3

Processor(s) 2 quad core @ 2.33 GHz

RAM 16 GB

OS Windows Server® 2008, 64 bit

Size of the SharePoint drive 400 GB

Number of NICs 2

NIC Speed 1 Gigabit

Authentication Windows NTLM

Load balancer type Hardware load balancing

Software version SharePoint Server 2010 (pre-release version)

Services running locally Central Administration

Microsoft SharePoint Foundation Incoming E-Mail

Microsoft SharePoint Foundation Web Application

Microsoft SharePoint Foundation Workflow Timer Service

Search Query and Site Settings Service

SharePoint Server Search

Services consumed from a

federated services farm

User Profile Service

Web Analytics Web Service

Business Data Connectivity Service

Managed Metadata Web Service

Application Server

There are two application servers in the farm, each with identical hardware.

Web Server APP1-2

Processor(s) 2 quad core @ 2.33 GHz

RAM 16 GB

OS Windows Server 2008, 64 bit

Size of the SharePoint drive 400 GB

Number of NICs 1

NIC Speed 1 Gigabit

Authentication Windows NTLM

Load balancer type Hardware load balancing

Software version SharePoint Server 2010 (pre-release version)

Services running locally Office Web Apps

Excel

PowerPoint

Secure Store

Usage and Health

State Service

Database Servers

There is a SQL cluster with 2 database servers, each with identical hardware, one of the servers is active and the other is

passive for redundancy.

Database Server DB1-2

Processor(s) 4 six core @ 2.4 GHz

RAM 64 GB

OS Windows Server 2008, 64-bit

Storage and geometry (1.2 TB * 6)

Disk 1-4: SQL Data

Disk 5: Logs

Disk 6: TempDB

Number of NICs 2

NIC Speed 1 @ 100MB, 1 @ 1GB

Authentication Windows NTLM

Software version SQL Server® 2008

Topology

Enterprise Social Environment

Farm Topology

Front end

Back end

Application Servers SharePoint Server 2010

pre-release version

SQL Cluster

Database Servers

SQL Server 2008

Web and Application Servers

Processor 2px4c@ 2.33 G Hz

R AM 16 G B

Storage 400 G B

NIC Speed 1 G B Full

Processor 4px6c G Hz

R AM 64 G B

Storage 1.2 TB * 6

Database Servers

Web Servers SharePoint Server 2010

pre-release version

Services hosted:

WAC, Excel, Secure Store, Usage and Health, PowerPoint,

State Service

Web plus

Central

Administration

Web plus

Central

Administration

Search Crawl

Configuration The following table enumerates settings that were changed that affect performance or capacity in the environment.

Setting Value Notes

Usage Service

Trace Log – days to store log files

(default: 14 days)

5 days The default is 14 days. Lowering this setting can

save disk space on the server where the log files

are stored.

QueryLoggingThreshold

Microsoft SharePoint Foundation

Database – change

QueryLoggingThreshold to 1 second

1 second The default is 5 seconds. Lowering this setting can

save bandwidth and CPU on the database server.

Database Server – Default Instance

Max degree of parallelism 1 The default is 0. To ensure optimal performance,

we strongly recommend that you set max degree

of parallelism to 1 for database servers that host

SharePoint Server 2010 databases. For more

information about how to set max degree of

parallelism, see max degree of parallelism Option.

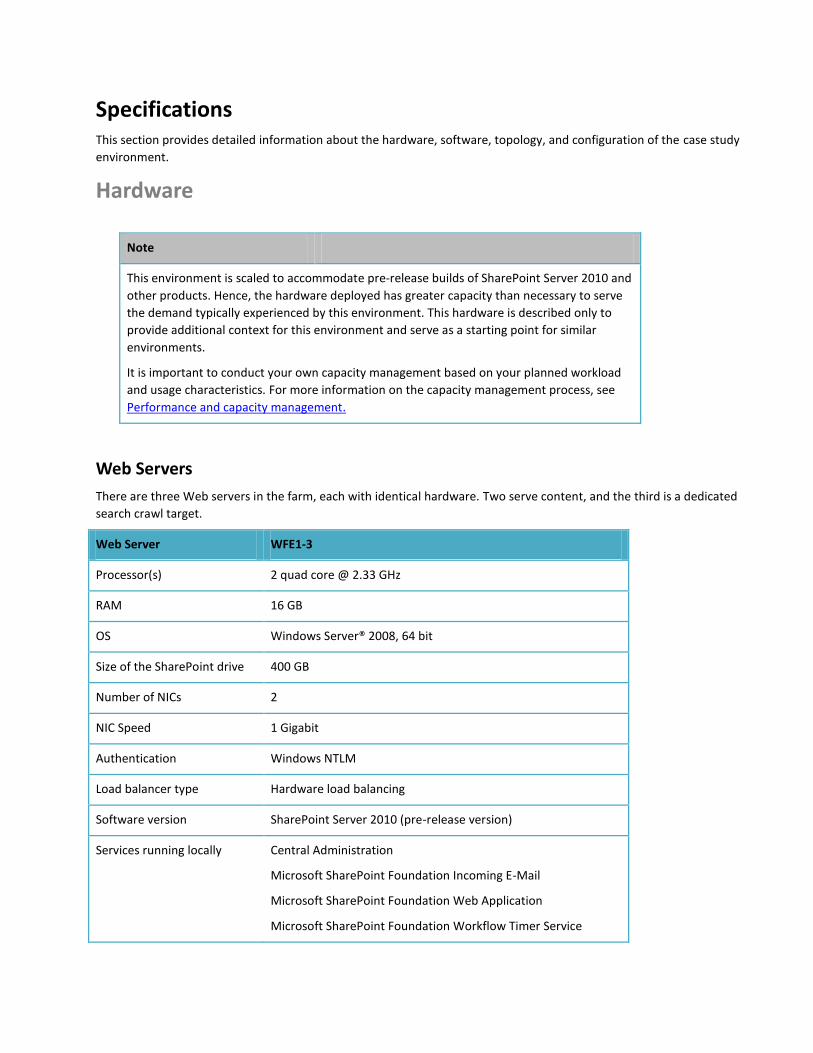
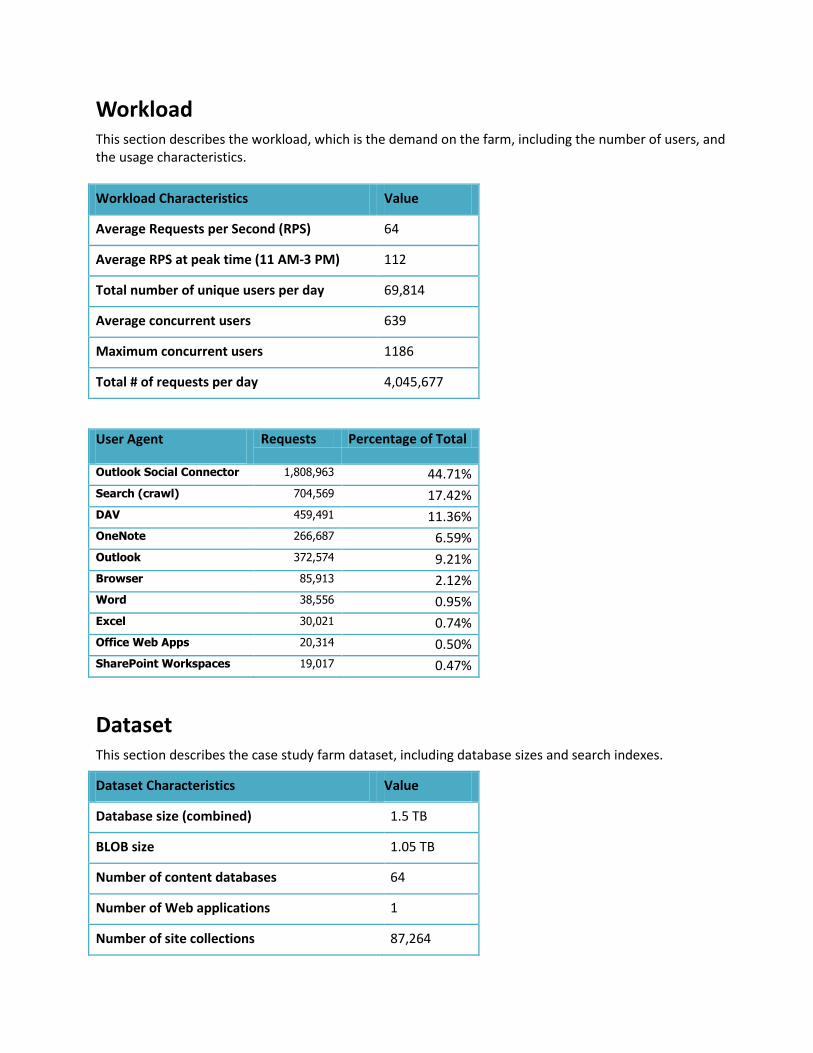
Workload This section describes the workload, which is the demand on the farm, including the number of users, and the usage characteristics.

Workload Characteristics Value

Average Requests per Second (RPS) 64

Average RPS at peak time (11 AM-3 PM) 112

Total number of unique users per day 69,814

Average concurrent users 639

Maximum concurrent users 1186

Total # of requests per day 4,045,677

User Agent Requests Percentage of Total

Outlook Social Connector 1,808,963 44.71%

Search (crawl) 704,569 17.42%

DAV 459,491 11.36%

OneNote 266,687 6.59%

Outlook 372,574 9.21%

Browser 85,913 2.12%

Word 38,556 0.95%

Excel 30,021 0.74%

Office Web Apps 20,314 0.50%

SharePoint Workspaces 19,017 0.47%

Dataset

This section describes the case study farm dataset, including database sizes and search indexes.

Dataset Characteristics Value

Database size (combined) 1.5 TB

BLOB size 1.05 TB

Number of content databases 64

Number of Web applications 1

Number of site collections 87,264

Number of sites 119,400

Search index size (number of items) 5.5 million

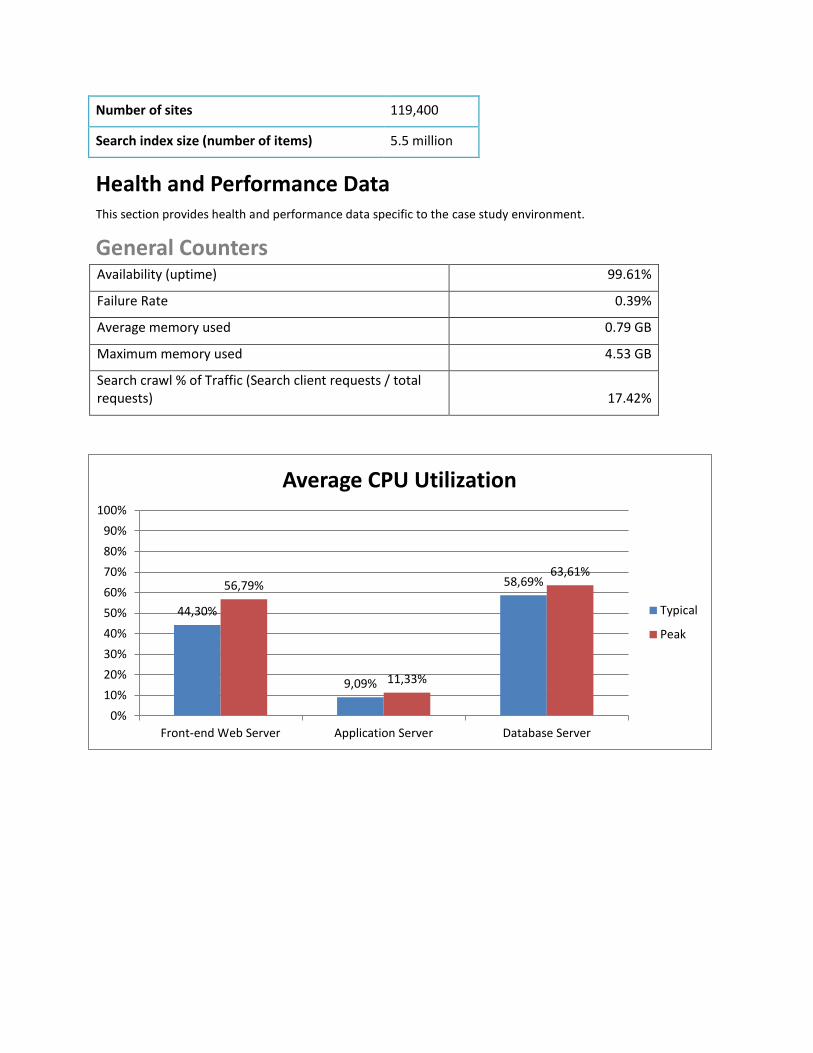
Health and Performance Data This section provides health and performance data specific to the case study environment.

General Counters Availability (uptime) 99.61%

Failure Rate 0.39%

Average memory used 0.79 GB

Maximum memory used 4.53 GB

Search crawl % of Traffic (Search client requests / total requests) 17.42%

44,30%

9,09%

58,69% 56,79%

11,33%

63,61%

0%

10%

20%

30%

40%

50%

60%

70%

80%

90%

100%

Front-end Web Server Application Server Database Server

Average CPU Utilization

Typical

Peak

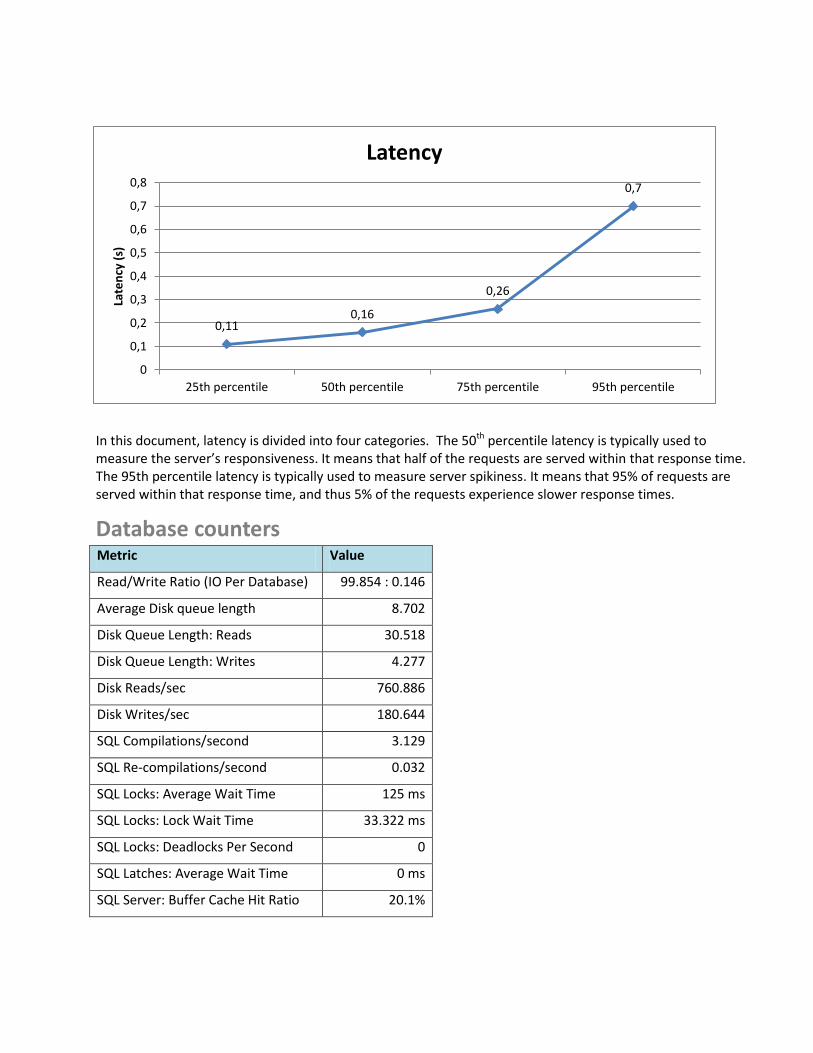
In this document, latency is divided into four categories. The 50th percentile latency is typically used to measure the server’s responsiveness. It means that half of the requests are served within that response time. The 95th percentile latency is typically used to measure server spikiness. It means that 95% of requests are served within that response time, and thus 5% of the requests experience slower response times.

Database counters Metric Value

Read/Write Ratio (IO Per Database) 99.854 : 0.146

Average Disk queue length 8.702

Disk Queue Length: Reads 30.518

Disk Queue Length: Writes 4.277

Disk Reads/sec 760.886

Disk Writes/sec 180.644

SQL Compilations/second 3.129

SQL Re-compilations/second 0.032

SQL Locks: Average Wait Time 125 ms

SQL Locks: Lock Wait Time 33.322 ms

SQL Locks: Deadlocks Per Second 0

SQL Latches: Average Wait Time 0 ms

SQL Server: Buffer Cache Hit Ratio 20.1%

0,11 0,16

0,26

0,7

0

0,1

0,2

0,3

0,4

0,5

0,6

0,7

0,8

25th percentile 50th percentile 75th percentile 95th percentile

Late

ncy

(s)

Latency


Recommended