Date post: | 21-Dec-2015 |
Category: |
Documents |
View: | 216 times |
Download: | 1 times |
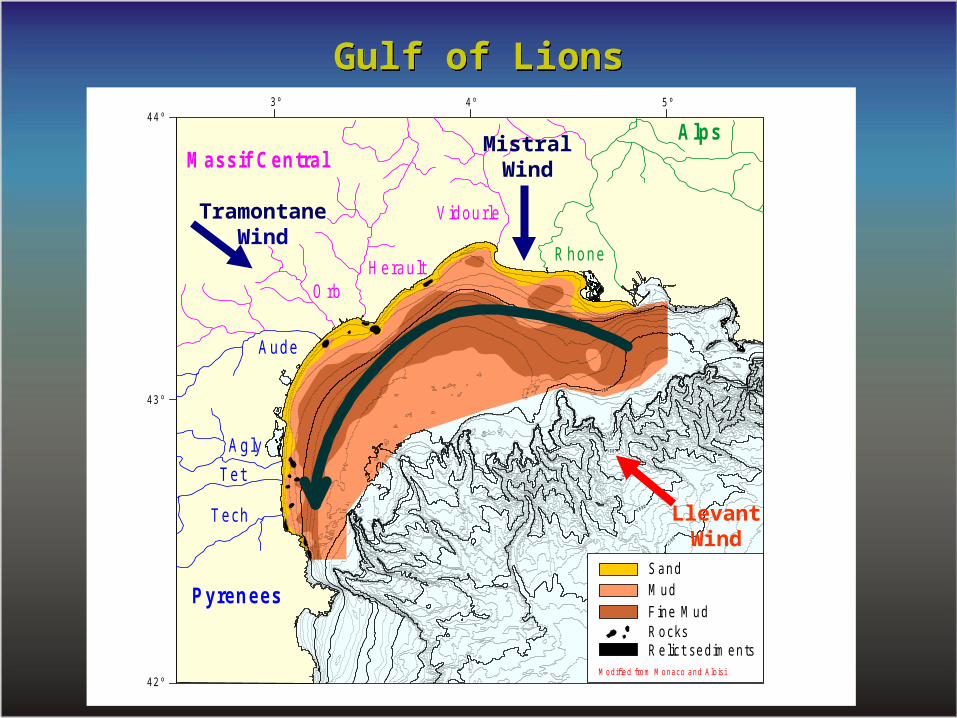
Shelf-to-canyon sediment supply Shelf-to-canyon sediment supply mechanisms in the Gulf of Lions and Eel mechanisms in the Gulf of Lions and Eel
marginsmarginsPere PuigPere Puig
Institut de Ciències del Mar, CSIC
With contributions from:
Institut de Ciències del Mar, CSIC
With contributions from:
ICM-CSIC: Albert Palanques, Jorge Guillén, Jacobo Martín, Marta Ribó
UB: Antoni Calafat, Joan Fabrés, Miquel Canals
CEFREM: Xavier Durrieu de Madron, Serge Heussner
UW: Andrea Ogston, Beth Mullenbach, Chuck Nittrouer, Dick Sternberg
ICM-CSIC: Albert Palanques, Jorge Guillén, Jacobo Martín, Marta Ribó
UB: Antoni Calafat, Joan Fabrés, Miquel Canals
CEFREM: Xavier Durrieu de Madron, Serge Heussner
UW: Andrea Ogston, Beth Mullenbach, Chuck Nittrouer, Dick Sternberg
3º 4º 5º
42º
43º
44º
50
500
Massif CentralAlps
Pyrenees
R hone
V idourle
HeraultO rb
Aude
Agly
Tet
Tech
SandM udFine M udR ocksR elict sed im ents
M odified from M onaco and A lo is i
Gulf of LionsGulf of Lions
Tramontane Wind
Mistral Wind
Llevant Wind
EuroSTRATAFORM monitoring EuroSTRATAFORM monitoring effortsefforts
•Along-marginAlong-margin •Shelf-to-canyonShelf-to-canyon
WinterWinter 2005 2005WinterWinter 2004 2004
3º 4º 5º
42º
43º 100
150200
500
1000
2000
2500
3º 4º 5º
42º
43º 100
150200
500
1000
2000
2500
Forcing Forcing conditionsconditions
Wave-stormsWave-storms & floods & floods Continuous northerly Continuous northerly windswinds
0
2
4
6
8
10
0
2000
4000
6000
8000
0
5
10
15
20
25
R hone R iver d ischarge (m 3/s)
S ign ificant w ave he ight (m )
W ind speed (m /s)
4 Dec 21 Feb
WinterWinter 2005 2005WinterWinter 2004 2004
Canyon heads (winter 2004)Canyon heads (winter 2004)
PL
G R
PR
H E
AU
LD
C C
0
20
40
60
80
0
20
40
60
0
20
40
0
20
40
60
0
20
40
60
0
20
40
60
0
20
40
60
C urrent ve locity (cm /s)
111213141516
111213141516
1112131415
12131415
12131415
12131415
12131415 PL
G R
PR
H E
AU
LD
C C
Tem perature (ºC )
4 Dec
21 Feb
PL
G R
PR
H E
AU
LD
C C
0
5
10
15
20
25
30
35
40
45
50
55
60
65
700
5
100
50
5
100
5
100
50
5S SC (m g/l)
P L
G R
P RH EA U
LD
C C
5/11/03
3/12/03
31/12/03
28/1/04
25/2/04
24/3/04
21/4/04
-5
-4
-3
-2
-1
0C um ulative flux (Tm /m 2)up-canyon
dow n-canyon
4 Dec
21 Feb
Canyon heads (winter 2004)Canyon heads (winter 2004)
> 68 mg/l
32129 7
1112
105
Net fluxes (mg/m2s)
Swath bathymetry conducted by Ifremer
Canyon heads (winter 2004)Canyon heads (winter 2004)
Cap de Creus Canyon (winter 2005)Cap de Creus Canyon (winter 2005)
Upper canyon Upper canyon monitoringmonitoring
145 m
200 m
500 m
750 m
150200
500
50
100
3º 00 ' 3º 10 ' 3º 20 ' 3º 30 '42º 30 '
42º 20 '
42º 10 '
Cap de Creus
Swath bathymetry conducted by AOA, Fugro and UB
145 m200 m500 m750 m
Current speed (cm/s)
Temperature (ºC)
27/9/04
25/10/04
22/11/04
20/12/04
17/1/05
14/2/05
14/3/05
11/4/05
8
10
12
14
16
8
10
12
14
16
8
10
12
14
16
8
10
12
14
16
145 m
200 m
500 m
750 m
27/9/04
25/10/04
22/11/04
20/12/04
17/1/05
14/2/05
14/3/05
11/4/05
0
20
40
60
80
100
0
20
40
60
80
100
0
20
40
60
80
100
0
20
40
60
80
100
145 m
200 m
500 m
750 m
Cap de Creus Canyon (winter 2005)Cap de Creus Canyon (winter 2005)
Cumulative flux (Tm/m2)SSC (mg/l)
27/9/04
25/10/04
22/11/04
20/12/0417/1/05
14/2/0514/3/05
11/4/05
-12
-11
-10
-9
-8
-7
-6
-5
-4
-3
-2
-1
0
1
145 m
200 m
500 m
750 m
up-canyon
down-canyon
27/9/04
25/10/04
22/11/04
20/12/04
17/1/05
14/2/05
14/3/05
11/4/05
0
10
20
30
40
0
10
20
30
40
0
10
20
30
40
0
10
20
30
40
145 m
200 m
500 m
750 m(1 mab)
Cap de Creus Canyon (winter 2005)Cap de Creus Canyon (winter 2005)
•Across-marginAcross-margin •Canyon head Canyon head monitoringmonitoring
Winter 2007- Winter 2007- PresentPresent
Winter 2006Winter 2006
3º 4º 5º
42º
43º 100
150200
500
1000
2000
2500
HERMES & HERMIONE monitoring effortsHERMES & HERMIONE monitoring efforts
3º 4º 5º
42º
43º 100
150200
500
1000
2000
2500
Rhone River
See Palanques et al. poster M-25
Time series (1)Time series (1)
2004 2005 2006 2007
0
2
4
6
Hs (
m)
0
4000
8000
12000
Dis
cha
rge
(m
3 /s)
10
12
14
16
Po
t. T
em
p. (
ºC)
0
20
40
60
80
100
Sp
ee
d (
cm/s
)
0
20
40
60
80
SS
C (
mg
/l)
W aves
R hone R iver
C ap de C reus C anyon
> 68 mg/l
140 mg/l 175 mg/l
Time series (2)Time series (2)
2004 2005 2006 2007
0
2
4
6
Hs
(m)
10
12
14
16
Po
t. T
em
p. (
ºC)
-25
-20
-15
-10
-5
0
5
Cu
mu
lativ
e f
lux
(Tm
/m2 )
0
20
40
60
80
SS
C (
mg
/l)
W aves
C ap de C reus C anyon
0.4
2.9
7.1
7.3
2.7
> 68 mg/l
140 mg/l 175 mg/l
Storm resuspension & cascading Storm resuspension & cascading advection (1) advection (1)
February 2007
2/15/072/16/07
2/17/072/18/07
2/19/072/20/07
2/21/07
S am pling days
0
40
80
120
160
2000
20
40
60
8012
12.4
12.8
13.2
13.6
140
1
2
3
4
5
S SC (m g/l)
C urrent speed (cm /s)
Tem perature (ºC )
S ignificant w ave height (m )
Storm resuspension & cascading Storm resuspension & cascading advection (2)advection (2)
January 2008
1/1/081/2/08
1/3/081/4/08
1/5/081/6/08
1/7/08
S am pling days
0
40
80
120
160
2000
20
40
60
8011.5
12
12.5
13
13.5
140
1
2
3
4
5
S SC (m g/l)
C urrent speed (cm /s)
Tem perature (ºC )
S ignificant w ave height (m )
41 º 00 '
40 º 50 '
40 º 40 '
40 º 30 '1 24 º 40 ' 1 24 º 30 ' 1 24 º 20 ' 1 24 º 10 '
700
50 20 1 0
S tudy area
Ee l C a ny on
H umb oldtB ay
Eel R iv er
M adR iv er
2
4
68
S 60
Eel marginEel margin
Shelf (S 60) time series Shelf (S 60) time series
10/22/9
910/2
9/99
11/5/9
911/1
2/99
11/19/9
911/2
6/99
12/3/9
912/1
0/99
12/17/9
912/2
4/99
12/31/9
91/7
/00
1/14/0
01/2
1/00
1/28/0
02/4
/00
2/11/0
02/1
8/00
2/25/0
03/3
/00
3/10/0
03/1
7/00
3/24/0
03/3
1/00
S am pling days
0
0.4
0.8
1.2
1.6
2
0
0.2
0.4
0.6
0.8
1
0
1000
2000
3000
4000
5000
0
20
40
60
80
100
E el R iver d ischarge (m 3/s)
S helf 30 cm ab SS C (g/l)
O rbita l ve locity at 60-m depth (cm /s)
S helf 100 cm ab SSC (g /l)
28 Oct
~ 8 g/l
Eel Canyon time series Eel Canyon time series
10/22/9
910/2
9/99
11/5/9
911/1
2/99
11/19/9
911/2
6/99
12/3/9
912/1
0/99
12/17/9
912/2
4/99
12/31/9
91/7
/00
1/14/0
01/2
1/00
1/28/0
02/4
/00
2/11/0
02/1
8/00
2/25/0
03/3
/00
3/10/0
03/1
7/00
3/24/0
03/3
1/00
S am pling days
0
20
40
60
0
10
20
30
0
1000
2000
3000
4000
5000
0
20
40
60
80
100
0255075
100
Eel R iver d ischarge (m 3/s)
C anyon near-bottom15 m ab SSC (m g/l)
O rbita l ve locity at 60-m depth (cm /s)
C anyon m id-w aters115 m ab S SC (m g/l)
Trip o d ca m e ra o p a city (1 2 0 -m d e p th )
28 Oct
108 mg/l
Storm resuspension at the canyon head Storm resuspension at the canyon head
10/26/9
9
10/27/9
9
10/28/9
9
10/29/9
9
10/30/9
9
10/31/9
9
11/1/9
9
S am pling days
0
20
40
60
80
100
0
200
400
600
0
20
40
60
80
100
0
20
40
60
80
100
C anyon near-bottom15 m ab SSC (m g/l)
C anyon m id-w aters115 m ab S SC (m g/l)
S helf (S60)1 m ab SSC (m g/l)
O rbita l ve locity at60-m depth (cm /s)
1/27/0
0
1/28/0
0
1/29/0
0
1/30/0
0
1/31/0
0
2/1/0
0
2/2/0
0
2/3/0
0
S am pling days
6 0
7 0
8 0
9 0
10 0
11 0
De
pth
(m
)
-4 0
-2 0
0
2 0
4 0
-2 0
-1 0
0
1 0
2 0
0
2 0
4 0
6 0
8 0
0
2 0
4 0
6 0
8 0
10 0
-2 0
-1 0
0
1 0
2 0
A D C P b a cksca tte r
A lo n g -ca n yo n (cm s -1)
C a m e ra o p a city
cu rre n t sp e e d (1 0 0 cm a b - 3 0 cm a b ) (cm s -1)
Orb ita l ve lo city (cm s -1)
u p -ca n yo n
d o wn -ca n yo n
1 0 0 cma b
3 0 cma b
6 0 -m d e p th
1 2 0 -m d e p th
W ind ve loc ity #46030 (m s -1)
Storm-induced sediment gravity flows (1) Storm-induced sediment gravity flows (1)
2/29/0
0
3/1/0
0
3/2/0
0
3/3/0
0
3/4/0
0
3/5/0
0
3/6/0
0
3/7/0
0S am pling days
6 0
7 0
8 0
9 0
10 0
11 0
De
pth
(m
)
-6 0
-4 0
-2 0
0
2 0
4 0
-2 0
-1 0
0
1 0
2 0
0
2 0
4 0
6 0
8 0
-2 0
-1 0
0
1 0
2 0
0
2 0
4 0
6 0
8 0
10 0
A D C P b a cksca tte r
A lo n g -ca n yo n (cm s -1)
C a m e ra o p a city
cu rre n t sp e e d (1 0 0 cm a b - 3 0 cm a b ) (cm s -1)
Orb ita l ve lo city (cm s -1)
W in d ve lo city (m s -1)
u p -ca n yo n
d o wn -ca n yo n
1 0 0 cma b
3 0 cma b
6 0 -m d e p th
1 2 0 -m d e p th
Storm-induced sediment gravity flows (2) Storm-induced sediment gravity flows (2)
0 60 120 180 240 300 360 420 480
T im e (s)
-60
-50
-40
-30
-20
-10
0
10
20
30
40
117.5
118
118.5
119
119.5
120
120.5
100 cmab30 cmab
A long-canyon (cm s -1)
u p -ca n yo n
d o w n -ca n yo n
P ressure (dbar)
Wave-supported sediment gravity flowsWave-supported sediment gravity flows
P0
Pressure
WAVEINFILTRATIONPRESSURES
SHEAR INDUCEDEXCESS PORE
WATER PRESSURE
ZONE A
Highly disturbed,liquefied, transportable
ZONE B
Non liquefiableAdded stress may induce failure
LIQUEFACTIO
N CRITERIA
ZONE C
Pore water pressures from wave infiltration
ZONE D
No pore pressure response
Pen
etra
tion
belo
w s
eaflo
or0
0
From: Clukey et al. 1985. Geo-Marine Letters, 5: 177-183
Liquefaction by excess pore water pressureLiquefaction by excess pore water pressure
ConclusionsConclusions
• Contemporary shelf-to-canyon sediment supply in the studied margin is controlled by event-driven transport processes.
• Wave-storm resuspension events concurrent with dense shelf water cascading are the major contemporary shelf-to-canyon sediment transport mechanisms in the Gulf of Lions margin, while deep cascading events contribute to redistribute the sediment deposited in canyon head regions down to deeper parts of the margin (see Palanques et al. poster M-25).
• Wave-storm events are also the main shelf-to-canyon sediment transport process in the Eel margin, but the supply mechanism is controlled by wave-load sediment liquefaction at the shelf edge and upper canyon head regions.