aPMMH, UMRS 7636 du CNRS, ESPCI, 750bLadHyX, UMR 7646 du CNRS, Ecole Polyte
† Present address: BMBI, UMR 7338 duCompiegne, 60200 Compiegne, France. E
Cite this: Soft Matter, 2014, 10, 6696
Received 27th February 2014Accepted 23rd June 2014
DOI: 10.1039/c4sm00457d
www.rsc.org/softmatter
6696 | Soft Matter, 2014, 10, 6696–670
m
Anne Le Goff,†*a David Querea and Christophe Clanetb
We study the motion of a solid sphere after its fast impact on a bath of liquid foam. We identify two regimes
of deceleration. At short times, the velocity is still large and the foam behaves similar to a Newtonian fluid of
constant viscosity. Then we measure a velocity threshold below which the sphere starts experiencing the
foam's elasticity. We interpret this behavior using a visco-elasto-plastic model for foam rheology. Finally
we discuss the possibility of stopping a projectile in the foam, and evaluate the capture efficiency.
Fig. 1 Phase diagram for foam-projectile interactions. On the verticalaxis, the typical size of the solid object R0 is compared to the radius rbof bubbles in the foam. On the horizontal axis, the time scale sr ofbubble rearrangements is compared to the characteristic time scalefor impact sc ¼ R0/V0. This study focuses on the impact of fastprojectiles larger than foam bubbles: our region of interest is the upperright corner of this phase diagram (region I).
1 Introduction
A liquid foam consists of a closely packed suspension of gasbubbles in a continuous liquid phase. Because of their remark-able mechanical properties (solid-like at rest and liquid-likeunder shear), foams have attracted the attention of physicistsfrom the early work of Plateau1 to modern debates on thejamming of so materials.2,3 Foams are also widely used indiverse industrial elds: catalysis and ltration,4 otation,5 andshock or noise absorption.6 The cellular structure of foamsgoverns many of their properties, such as shear modulus or yieldstress, that scale with the Laplace pressure inside the bubbles7
with an inuence of the topology of the bubble assembly.8
Solid cellular materials are known as mechanical dampersand sound absorbers. In nature, it has been shown recently thatwoodpeckers have porous cranial bones that prevent their brainfrom injury in spite of repeated head drumming against treetrunks,9 and that the thick skin that protects pomelos when theyfall off the tree has a foam-like structure.10 The use of solidfoams as mechanical dampers in technology is widespread,even under extreme conditions: for example, to capture inter-stellar particles without damage, which travel at high velocity,so solids called aerogels are used.11 In this spirit, we investi-gate the ability of liquid foams to absorb kinetic energy.
To do so, we measure the energy dissipation during theimpact of a solid sphere of radius R0 and initial velocity V0. Werestrict our study to projectiles much larger than the foambubbles, and to characteristic impact times sc ¼ R0/V0 muchshorter than the foam rearrangement time sr. This regimecorresponds to region I in the phase diagram represented inFig. 1, where the vertical axis compares the projectile size R0 tothe foam bubble radius rb and the horizontal axis compares therearrangement and impact times, sr and sc. Other regions of thisphase diagram have been explored in the literature: regions II
and III correspond to the case of foams whose bubbles aremuch larger than solid particles. When they are fast, smallprojectiles can cross the soap lms separating neighboringbubbles.12 Else, they stay trapped in the nodes where Plateauborders meet.13 In region IV, quasi-static foam ows around anobstacle, whose dimension is one order of magnitude higherthan bubble size, are studied in 2D14 and 3D.15 The experimentalsetup dedicated to the study of region I is described in Section 2,results are presented in Section 3, and a model is developed inSection 4.
2 Experimental setup
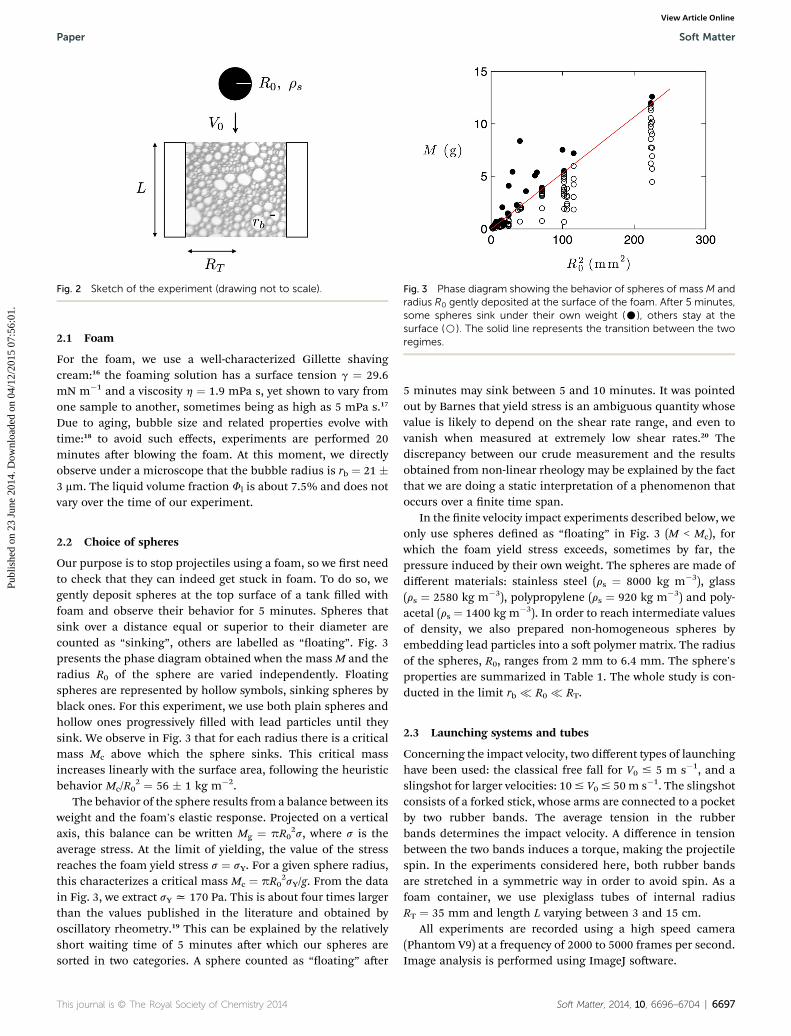
The experimental setup is presented in Fig. 2: spheres ofdifferent radius R0 and density rs are thrown at velocity V0 in afoam trapped in a tube of radius RT.
Fig. 2 Sketch of the experiment (drawing not to scale). Fig. 3 Phase diagram showing the behavior of spheres of massM andradius R0 gently deposited at the surface of the foam. After 5 minutes,some spheres sink under their own weight (C), others stay at thesurface (B). The solid line represents the transition between the tworegimes.
Paper Soft Matter
Publ
ishe
d on
23
June
201
4. D
ownl
oade
d on
04/
12/2
015
07:5
6:01
. View Article Online
2.1 Foam
For the foam, we use a well-characterized Gillette shavingcream:16 the foaming solution has a surface tension g ¼ 29.6mN m�1 and a viscosity h ¼ 1.9 mPa s, yet shown to vary fromone sample to another, sometimes being as high as 5 mPa s.17
Due to aging, bubble size and related properties evolve withtime:18 to avoid such effects, experiments are performed 20minutes aer blowing the foam. At this moment, we directlyobserve under a microscope that the bubble radius is rb ¼ 21 �3 mm. The liquid volume fraction Fl is about 7.5% and does notvary over the time of our experiment.
2.2 Choice of spheres
Our purpose is to stop projectiles using a foam, so we rst needto check that they can indeed get stuck in foam. To do so, wegently deposit spheres at the top surface of a tank lled withfoam and observe their behavior for 5 minutes. Spheres thatsink over a distance equal or superior to their diameter arecounted as “sinking”, others are labelled as “oating”. Fig. 3presents the phase diagram obtained when the mass M and theradius R0 of the sphere are varied independently. Floatingspheres are represented by hollow symbols, sinking spheres byblack ones. For this experiment, we use both plain spheres andhollow ones progressively lled with lead particles until theysink. We observe in Fig. 3 that for each radius there is a criticalmass Mc above which the sphere sinks. This critical massincreases linearly with the surface area, following the heuristicbehavior Mc/R0
2 ¼ 56 � 1 kg m�2.The behavior of the sphere results from a balance between its
weight and the foam's elastic response. Projected on a verticalaxis, this balance can be written Mg ¼ pR0
2s, where s is theaverage stress. At the limit of yielding, the value of the stressreaches the foam yield stress s ¼ sY. For a given sphere radius,this characterizes a critical mass Mc ¼ pR0
2sY/g. From the datain Fig. 3, we extract sY x 170 Pa. This is about four times largerthan the values published in the literature and obtained byoscillatory rheometry.19 This can be explained by the relativelyshort waiting time of 5 minutes aer which our spheres aresorted in two categories. A sphere counted as “oating” aer
5 minutes may sink between 5 and 10 minutes. It was pointedout by Barnes that yield stress is an ambiguous quantity whosevalue is likely to depend on the shear rate range, and even tovanish when measured at extremely low shear rates.20 Thediscrepancy between our crude measurement and the resultsobtained from non-linear rheology may be explained by the factthat we are doing a static interpretation of a phenomenon thatoccurs over a nite time span.
In the nite velocity impact experiments described below, weonly use spheres dened as “oating” in Fig. 3 (M < Mc), forwhich the foam yield stress exceeds, sometimes by far, thepressure induced by their own weight. The spheres are made ofdifferent materials: stainless steel (rs ¼ 8000 kg m�3), glass(rs ¼ 2580 kg m�3), polypropylene (rs ¼ 920 kg m�3) and poly-acetal (rs ¼ 1400 kg m�3). In order to reach intermediate valuesof density, we also prepared non-homogeneous spheres byembedding lead particles into a so polymer matrix. The radiusof the spheres, R0, ranges from 2 mm to 6.4 mm. The sphere'sproperties are summarized in Table 1. The whole study is con-ducted in the limit rb � R0 � RT.
2.3 Launching systems and tubes
Concerning the impact velocity, two different types of launchinghave been used: the classical free fall for V0 # 5 m s�1, and aslingshot for larger velocities: 10# V0# 50 m s�1. The slingshotconsists of a forked stick, whose arms are connected to a pocketby two rubber bands. The average tension in the rubberbands determines the impact velocity. A difference in tensionbetween the two bands induces a torque, making the projectilespin. In the experiments considered here, both rubber bandsare stretched in a symmetric way in order to avoid spin. As afoam container, we use plexiglass tubes of internal radiusRT ¼ 35 mm and length L varying between 3 and 15 cm.
All experiments are recorded using a high speed camera(Phantom V9) at a frequency of 2000 to 5000 frames per second.Image analysis is performed using ImageJ soware.
Table 1 Properties of the spheres used in the experiments. Spheresare made either of raw materials (plastic or glass) or of lead particlesdispersed in a soft polymer matrix (composite 1 to 4). Only three of thesmallest spheres were used for high-speed experiments. In the lastcolumn, we compute the characteristic impact time sc ¼ R0/V0. scalways stays smaller than the typical relaxation time after a plasticevent in a Gillette foam (sr x 200 ms)
Material rs (kg m�3) R0 (mm) Free fall Slingshot sc (ms)
Fig. 4 shows the impact of a sphere released above the tank andfreely falling on the foam surface. The whole process is recordedby the high speed camera: as can be observed in (a), the sphereentirely penetrates the foam and is captured below the surface.To measure its position, we equipped the sphere with a agattached to a rigid elongated tail, made out of a pulled glasscapillary. Because this rod is very thin and hollow, its mass isnegligible compared to that of the sphere. During the impact,the ag remains above the foam and we extract the trajectoryfrom the evolution of its position zf. Such a trajectory is pre-sented in Fig. 4(b), which reveals both an oscillation and astrong damping. These features are discussed in Section 4.
3.2 High velocity impact
At high impact velocity, the sphere can cross the whole sampleand escape from the foam cylinder. We throw spheres with an
Fig. 4 (a) Chronophotography of a low velocity impact. The projectile, coit, is released about 30 centimeters above the foam surface, hitting it at 1.7zf of the flag is recorded during the free fall. (b) Spatiotemporal diagram
6698 | Soft Matter, 2014, 10, 6696–6704
initial velocity V0 on foam samples of various thicknesses L.Aer crossing a tube of length L1 full of opaque foam in the timeinterval t1, a sphere has decelerated from V0 to V1. This providesus with a new way to get a deceleration curve V(t) by gatheringseveral high speed experiments. The method is presented inFig. 5(a), and an example of a deceleration curve is shown inFig. 5(b) and (c). We assume that if the same sphere is crossinga longer tube L2 > L1, a process that will require a longer timet2 > t1, its velocity at the time t1 is again V1. We iterate thisexperiment using tubes of increasing length, until one of themis long enough to make the nal velocity below 5 m s�1. Thisallows us to connect data acquired through open tube experi-ments to those obtained from a free fall experiment by match-ing impact and exit velocities of different experiments. Thisconnection is visible on the typical curve presented in Fig. 5(b):data points are more regularly spaced at low velocity than thoseat the beginning of the curve. This is due to the measurementsat high velocity being a reconstructed curve, while data at lowvelocity come from a single experiment, where the time intervalis xed by camera settings.
3.2.1 Results on the initial deceleration. Qualitative state-ments about deceleration in foam can be drawn from a curve suchas the one presented in Fig. 5(b). It takes 20ms and less than 20 cmfor a polypropylene sphere (R0 ¼ 2.4 mm) arriving at 34 m s�1 toslow down to 1 m s�1. In a viscous oil (hoil ¼ 1 Pa s ¼ 1000hwater),the same process takes about 5 ms and 3 cm.21 In comparison,given its small liquid fraction, foam proves to be an efficientkinetic energy absorber. The energy dissipated during these initial20 ms is about 35 mJ, corresponding to a power of almost 2 W,similar to that of a night light.
As can be seen in Fig. 5(c), the same data plotted on a semi-logarithmic graph reveal that velocity decreases exponentiallywith time during the rst 15 ms of motion, over more than oneorder of magnitude. This is consistent with a Newtoniandescription of the foam, with an apparent viscosity he that canbe deduced from the time scale of the exponential decay. Theequation of motion for an object decelerating due to viscous
friction is MdVdt
¼ �6pR0heV and its integration leads to
nsisting of a glass sphere (R0¼ 3.1 mm)with a rod and a flag attached tom s�1. The time interval between two images isDt¼ 6ms. The positionshowing the position zf of the flag as a function of time.
Fig. 5 (a) Principle of construction of the deceleration curves. At highvelocity, each data point represents an independent experiment, oneof which having a final velocity of 4 m s�1. These points are thenconnected with measurements made on a single low velocity exper-iment, in which a sphere with a flag was released above the foam,reaching 4 m s�1 at the time of impact. (b) Example of a reconstructeddeceleration curve obtained with polypropylene spheres (R0 ¼ 2.4mm). (c) Semi-logarithmic representation of the data shown in (b). Athigh velocity, data collapse around a straight line, indicating thatvelocity decreases exponentially at short times. The solid line corre-sponds to a fit V ¼ V0e
�t/s, with s ¼ 5.1 � 0.4 ms.
Fig. 6 Position of a polypropylene sphere (R0¼ 2.4mm, V0¼ 2.5m s�1),as a function of time. Impact is followed by quickly damped oscillations ofpseudo-period T.
Paper Soft Matter
Publ
ishe
d on
23
June
201
4. D
ownl
oade
d on
04/
12/2
015
07:5
6:01
. View Article Online
V ¼ V0e�t/s with s ¼ 2rsR0
2
9he. The slope measured in Fig. 5(c)
yields a value he ¼ 230 � 15 mPa s. This is much larger thanboth the viscosity of air and that of the foaming solution, aspredicted by Schwartz and Princen.22 This behavior is surpris-ingly simple, considering the large velocity of the impactingsphere and the complex rheological behavior of foams.
3.2.2 Final stage of deceleration. We now investigate theregime corresponding to the far right region of graph Fig. 5(c).Experimental points strongly deviate from a Newtonianbehavior when V becomes smaller than 2 m s�1, indicatingthat velocity in this region decreases faster than exponentially.To study this regime, we focus on our low velocity experiments(V0 < 5 m s�1), where we measure the position Z of the sphere,dened in Fig. 5(a) as the distance between the top of the sphereand the foam surface: at the moment of impact, Z ¼ 2R0.
In Fig. 6, we plot Z as a function of time and we observe thatthe sphere rst sinks into the foam, reaches its maximal depthand then, instead of stopping at this point, “bounces” upwards.Aer a few oscillations, it stabilizes at a nal position that isshallower than the maximal depth. Such rebounds of a projec-tile in a liquid have been observed in polymer and micellarsolutions and interpreted as a signature of viscoelasticity.23,24
Foams are also known to exhibit viscoelastic behavior. Elasticityin foams is due to the bubble's surface tension, since bubbledeformations are equivalent to spring deformation, where thestiffness is given by surface tension.25
3.2.3 Foam deformation. To gain further insight at the wayfoam deforms around a projectile, we insert in a tank with attransparent walls a foam in which several horizontal planeshave been sprinkled with black particles. Seen from the side,the particle-seeded sheets appear as black lines. We image thedeformation of these lines when a heavy sphere falls into thefoam along the wall. As can be seen in Fig. 7, traces of theimpact are only visible in a region close to the impact site, with alateral extension of order R0, suggesting that the size d of thegradient region is about R0. Measurements of the velocity eldaround a moving plate in other yield stress uids lead to theobservation of a similar-sized boundary layer whose thicknessdoes not depend on the plate velocity.26
In high velocity experiments, we also observe that some foamis entrained out of the tube by the sphere. For a 5 mm diameterpolypropylene sphere and a velocity V0 � 20 m s�1, the amountof ejected foam is about 10 mg. Such a mass corresponds to thatof a layer of thickness xR0 covering the bottom half of the
Fig. 7 To evaluate the extension of the region deformed by an impact,we prepare layer by layer a foam seeded with black particles, in a tankwith flat transparent walls. We compare the shape of the black linesformed by these layers, viewed through the side wall, before and afterthe impact of a lead sphere of radius R0 ¼ 3 mm. We observe that thetypical distance beyond which no deformation is visible, indicated bythe red dashed lines, is comparable to the sphere radius.
Soft Matter Paper
Publ
ishe
d on
23
June
201
4. D
ownl
oade
d on
04/
12/2
015
07:5
6:01
. View Article Online
sphere. This suggests that R0 remains as a relevant scale for theow around the sphere even at high velocity. It does not meanthat deformation is limited to a tube of thickness R0 around theprojectile: as the sphere reaches the end of the tube, it crossesthe foam surface, whose displacement is still visible more thanthree radii away from the axis of motion.
4 Interpretation and consequences
In this section, our purpose is to discuss the projectiledynamics. The equation of motion for a sphere decelerating in afoam is
MdV
dt¼ �apR0
2s (1)
where s represents the stress exerted by foam on the sphere anda a geometrical coefficient. The foam response is computedusing a visco-elasto-plastic model from the literature,27 pre-sented in Appendix 6. Briey, foam is characterized by threeparameters: its elastic modulus m, its macroscopic viscosity he,and an elasticity limit UY. The stress s is the sum of an elasticterm proportional to the deformation U and a viscous termproportional to the strain rate _3:
s ¼ mU + he_3 (2)
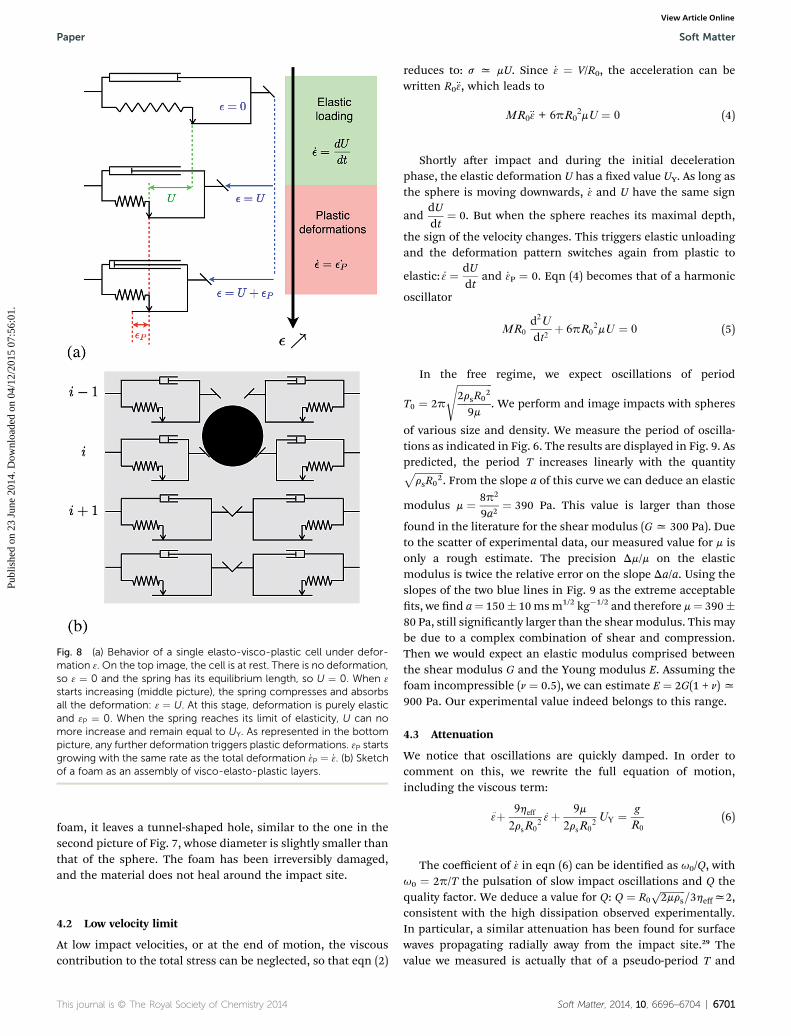
As sketched in Fig. 8, we describe the foam as a stack ofvisco-elasto-plastic layers of thickness R0, each of thembehaving according to the framework developed by Marmottantand Graner. The vertical motion of the sphere triggers theopening of a hole of radius R at the center of the viscoelasticlayer, at a rate _R ¼ V. We assume that the sphere only interactswith one layer at a time, and experiences a response given byeqn (2).
According to eqn (2), the stress s depends on elastic defor-mation and strain rate. The strain rate _3 is dened as the
6700 | Soft Matter, 2014, 10, 6696–6704
gradient of displacement in the foam and expressed as a ratiobetween the sphere's velocity and the typical size d of the
gradient region: c3 ¼cRd¼ V
d. Here we assume that the typical
length d observed of order R0 in Fig. 7 is the same in bothradial and vertical directions, and that it does not vary withthe sphere's velocity, as it is for Carbopol owing around aplate.26
The sphere's position Z is given by Z ¼ R0
ðt0
c3ðt0Þdt0. Togetherwith eqn (10), this provides a closed system of equations thatcan be integrated numerically:8>>>>>>>>>><
>>>>>>>>>>:
1
3rsR0
23:: ¼ �s
s ¼ mU þ he3:
dU
dt¼ 0 if |U |.UY and 3
:U . 0
dU
dt¼ 3
:else
(3)
4.1 High velocity limit
Since |U| is always smaller than UY, in the high velocity regime,the term in _3 dominates in the rheological law: s� he_3� heV/R0.The equation of motion can then be rewritten
MdVdt
¼ �pR02aheV=R0. The right-hand term can be identied
as a Stokes force on a sphere decelerating in a viscous uid,provided that we dene an apparent viscosity heff such thatahe ¼ 6heff. As mentioned in Section 3, this equation leads to an
exponential decay for the velocity V ¼ V0e�t/s with s ¼ 2rsR0
2
9heff,
that successfully adjusts the data in Fig. 5(c). By measurings ¼ 5.1 ms on experimental curves, we nd a foam viscosity
heff ¼2rsR0
2
9s¼ 230 mPa s. This value is much larger than the
viscosities of the uids comprising the foam, the gas(hg � 10�2 mPa s) and the foaming liquid (hl � 2 mPa s).Similar values were obtained by Krishan et al. by ttingrheometry data acquired at frequencies between 1 and 80 Hzwith a model assuming a viscous-like dissipation at highfrequency.28
At the time of impact, the foam is still intact, so U ¼ 0 < UY.According to eqn (3), U increases with the rate _3. Because thisstrain rate is maximal at the beginning of the experiment,
c30 ¼V0
R0, U shortly reaches its maximal value UY. While _3
progressively decreases, U sticks to the value UY, as predicted by
Marmottant and Graner. During this phase, we havedUdt
¼ 0
and _3 ¼ _3P. This implies that many plastic events are triggeredduring the deceleration and that, apart from the rst fewmilliseconds following impact, no energy is stored in elasticdeformation during this phase.
The fact that plasticity dominates the motion is conrmed byobservations. Aer the sphere has crossed a tube lled with
Fig. 8 (a) Behavior of a single elasto-visco-plastic cell under defor-mation 3. On the top image, the cell is at rest. There is no deformation,so 3 ¼ 0 and the spring has its equilibrium length, so U ¼ 0. When 3
starts increasing (middle picture), the spring compresses and absorbsall the deformation: 3 ¼ U. At this stage, deformation is purely elasticand 3P ¼ 0. When the spring reaches its limit of elasticity, U can nomore increase and remain equal to UY. As represented in the bottompicture, any further deformation triggers plastic deformations. 3P startsgrowing with the same rate as the total deformation _3P ¼ _3. (b) Sketchof a foam as an assembly of visco-elasto-plastic layers.
Paper Soft Matter
Publ
ishe
d on
23
June
201
4. D
ownl
oade
d on
04/
12/2
015
07:5
6:01
. View Article Online
foam, it leaves a tunnel-shaped hole, similar to the one in thesecond picture of Fig. 7, whose diameter is slightly smaller thanthat of the sphere. The foam has been irreversibly damaged,and the material does not heal around the impact site.
4.2 Low velocity limit
At low impact velocities, or at the end of motion, the viscouscontribution to the total stress can be neglected, so that eqn (2)
reduces to: s x mU. Since _3 ¼ V/R0, the acceleration can bewritten R0€3, which leads to
MR0€3 + 6pR02mU ¼ 0 (4)
Shortly aer impact and during the initial decelerationphase, the elastic deformation U has a xed value UY. As long asthe sphere is moving downwards, _3 and U have the same sign
anddUdt
¼ 0. But when the sphere reaches its maximal depth,
the sign of the velocity changes. This triggers elastic unloadingand the deformation pattern switches again from plastic to
elastic: c3 ¼ dUdt
and _3P ¼ 0. Eqn (4) becomes that of a harmonic
oscillator
MR0
d2U
dt2þ 6pR0
2mU ¼ 0 (5)
In the free regime, we expect oscillations of period
T0 ¼ 2p
ffiffiffiffiffiffiffiffiffiffiffiffiffiffi2rsR0
2
9m
s. We perform and image impacts with spheres
of various size and density. We measure the period of oscilla-tions as indicated in Fig. 6. The results are displayed in Fig. 9. Aspredicted, the period T increases linearly with the quantityffiffiffiffiffiffiffiffiffiffiffiffirsR0
2p
. From the slope a of this curve we can deduce an elastic
modulus m ¼ 8p2
9a2¼ 390 Pa. This value is larger than those
found in the literature for the shear modulus (Gx 300 Pa). Dueto the scatter of experimental data, our measured value for m isonly a rough estimate. The precision Dm/m on the elasticmodulus is twice the relative error on the slope Da/a. Using theslopes of the two blue lines in Fig. 9 as the extreme acceptablets, we nd a¼ 150� 10msm1/2 kg�1/2 and therefore m¼ 390�80 Pa, still signicantly larger than the shear modulus. This maybe due to a complex combination of shear and compression.Then we would expect an elastic modulus comprised betweenthe shear modulus G and the Young modulus E. Assuming thefoam incompressible (n ¼ 0.5), we can estimate E ¼ 2G(1 + n) x900 Pa. Our experimental value indeed belongs to this range.
4.3 Attenuation
We notice that oscillations are quickly damped. In order tocomment on this, we rewrite the full equation of motion,including the viscous term:
€3þ 9heff
2rsR02
c3þ 9m
2rsR02UY ¼ g
R0
(6)
The coefficient of _3 in eqn (6) can be identied as u0/Q, withu0 ¼ 2p/T the pulsation of slow impact oscillations and Q thequality factor. We deduce a value for Q: Q ¼ R0
ffiffiffiffiffiffiffiffiffiffi2mrs
p=3heffx2,
consistent with the high dissipation observed experimentally.In particular, a similar attenuation has been found for surfacewaves propagating radially away from the impact site.29 Thevalue we measured is actually that of a pseudo-period T and
Fig. 9 Period of elastic oscillations T for spheres made of poly-propylene (C), polyacetal (B), glass (r), and heterogeneous materials(>). The red line represents the best linear fit and yields a slope a¼ 150ms m1/2 kg�1/2. The dashed blue lines stress the highest and lowestacceptable linear fits. 4 or 5 experiments are performed for eachsphere type; vertical error bars represent mean period and standarddeviation. The mass of the flag induces an error on density, taken intoaccount by horizontal error bars.
Soft Matter Paper
Publ
ishe
d on
23
June
201
4. D
ownl
oade
d on
04/
12/2
015
07:5
6:01
. View Article Online
differs from the period of free oscillations T0 by a factorffiffiffiffiffiffiffiffiffiffiffiffiffiffiffiffiffiffi1� 1
4Q2
rx3%. Given the size of our error bars, we make a
reasonable assumption when considering that T x T0 to esti-mate m (Fig. 9).
4.4 Numerical results
Besides the asymptotic behaviors described above, we alsoperformed a numerical integration of the system (eqn (3)), usingMatlab and a least-square algorithm to numerically nd a set ofparameters minimizing the distance between an experimentaland simulated curve Z(t). We rst tried to run the code with thevalues of heff and m found experimentally in the previous para-graph, using UY as a free parameter. This led to solutions withexaggerated nal oscillations. When letting free all three
Fig. 10 Experimental (C) and numerical (red line) data showingthe position Z(t) of a polypropylene sphere (R0 ¼ 5 mm) penetrating at3.3 m s�1 in a foam. Integration of eqn (3) is performed with theparameters: heff ¼ 220 mPa s, m ¼ 164 Pa and UY ¼ 0.415.
6702 | Soft Matter, 2014, 10, 6696–6704
parameters, the most satisfying agreement was reached forheff ¼ 220 mPa s, m ¼ 164 Pa and UY ¼ 0.415 (Fig. 10).
The value for the viscosity coefficient is the same as the oneobtained by tting the high velocity experimental curves with aNewtonian model (heff ¼ 230 � 15 mPa s).
The elastic modulus, however, is two-fold smaller. Anexplanation for this may be that the elastic deformation doesnot take place in the immediate surrounding of the sphere: thesheared region around the projectile moves in a uid way. Thislayer might generate a larger effective radius for the movingobject.
In eqn (2), the viscous term dominates as long as _3 > mUY/heff.This allows us to compute a velocity V* below which an impactresults in a response that is only a balance between elasticityand plasticity. We nd that V* ¼ mUYR0/heff ¼ 0.7 m s�1. This isconsistent with experimental observations, since the value ofthe velocity of the rst outlier seen on the deceleration curve inFig. 5(c) is 0.5 m s�1.
4.5 Capture length
We now dene the capture length L as the distance needed tostop a projectile, that is, the distance between the initial foamlevel and the lowest altitude of the bottom of the sphere.Experimental capture lengths are found by connecting high-and low-speed experiments with the velocity matching methodpresented in Section 2. Fig. 11 shows a comparison between theexperimental capture length and the one predicted by themodel for 5 mm polypropylene spheres. It takes about 15 cm offoam to stop a polypropylene sphere of radius 2.4 mm arrivingat 40 m s�1, that is, about 150 km h�1.
Fig. 11 shows that L scales with the impact velocity V0 onboth experimental and numerical curves. Many data points arelocated to the right of the red curve. This can be seen as asignature of yield stress. Because the spheres used for thisexperiment are “oating”, a nite velocity (about 2.5 m s�1) isrequired for them to penetrate into the foam.
Fig. 11 Capture length L for a polypropylene sphere of radiusR0 ¼ 2.4 mm, as a function of impact velocity V0. Black dots representexperimental data and the solid line represents numerical predictionsobtained with the following set of parameters: heff ¼ 220 mPa s,m ¼ 164 Pa and UY ¼ 0.415.
The same sphere hitting an air–water interface woulddecelerate in an inertial way: MdV/dt x 0.5rCDpR0
2V2. Thisleads to an exponential decrease of velocity V ¼ V0e
�z/zi with the
inertial deceleration length zi ¼ 83CD
rs
rRx9:4 mm. In a more
viscous uid (5 < Re0 ¼ R0V0/n < 100), we have shown that thetypical deceleration scale is z*x1:3R0
ffiffiffiffiffiffiffiffiRe0
prs=rx32 mm.21 A
water layer of thickness zi, or an oil layer of thickness z*, istherefore sufficient to slow down the sphere. We can comparethe mass of material needed to arrest spheres in a liquid foamand in other liquids. The ratio between specic masses of foamand water is the liquid volume fraction of foam Fl. We have:
Mfoam
Mwater
¼ FlLzi
x1:2 (7)
Mfoam
Moil
¼ rwaterFlLroilz*
x0:35 (8)
This indicates that, regardless of the material used, the massrequired to stop a projectile is roughly constant. In a Newtonianuid, once the impact kinetic energy has been dissipated, theprojectile is still subjected to buoyancy forces. Depending on itsdensity, it will eventually stabilize either at the top or at thebottom of the uid sample. In a yield stress uid such as foamor Carbopol,23 it reaches a nite equilibrium depth. In order toprotect a surface from particle impacts with a Newtonian uid, atank of appropriate size is required, otherwise, whatever itsinitial thickness, the uid sample will spread and becomethinner. Yield stress uids like foam can, to a certain extent,sustain their own weight. Samples as thick as several centime-ters can stand as if they were solid.
For violent impacts, the energy dissipated in this phasecan be so high that the particle gets damaged. This happenswhen interstellar particles collide at 5 km s�1 with a 3 cmthick aerogel.30 To avoid destruction of fragile particles,materials with a density gradient can be used for inducing aprogressive deceleration, for example foams with a gradientof liquid fraction. This strategy is employed in nature: thedensity of the foam-like material that constitutes the thickskin of pomelos gradually changes between the outer skinand the fruit esh.10
4.6 Discussion
The most intriguing result of this study is the fact that a modelassuming a constant viscosity for the foam seems to be relevantfor a large part of our experiments, while classical foamrheology studies never report Newtonian behavior. Our experi-mental data can be t with a Newtonian model as long as _3 [
_3* ¼ V*/R0 x 300 s�1. This means that the Newtonian regimecan only be seen at values larger than 0.3 kHz, beyond the rangeclassically explored in rheology experiments. Gopal andDurian16 measured the apparent viscosity of Gillette foam in aCouette rheometer by imposing a constant shear rate. Theyfound that apparent viscosity decreases with shear rate, with heff
x 500 mPa s when _3 ¼ 300 s�1. Our experiments extend thesedata, and seem to suggest that viscosity at very high _3 reaches a
plateau (since we could understand our experiments at different_3 with a single value for viscosity).
The model of Marmottant and Graner was initially writtento describe quasi-static motion of foams. It is expected tobreak down when the strain rate _3 becomes as large as theinverse of the microscopic relaxation time of the foam srelax.The exact composition of Gillette foam is not known, butmeasurements of surface rheology have shown that itbehaves similar to surfactant solutions containing fatty acidsas cosurfactants. Such mixtures exhibit a high surfacemodulus, meaning that surface tension takes a long time togo back to its equilibrium value aer a change of interfaceshape or area. The relaxation time aer a plastic event inGillette foam is therefore quite long (about 0.2 s). This wouldlead to a limit _3c ¼ 5 s�1 much lower than the typical valuesthat we have at impact _30 x 10 000 s�1. However, the keyfeature of the model is the fact that the rate of plastic rear-rangements is xed by _3. Marmottant and Graner assumedthat this is true in the quasi-static case because _3�1 is the onlyavailable time scale in this regime. However, experiments onshear bubble clusters revealed that even beyond the quasi-static regime, the dynamics of a single plastic rearrangementis still governed by _3.31 This might explain why the modelseems to function well even so far from its initial validityrange.
5 Conclusions
Our rst motivation was to quantify liquid foam's efficiency as akinetic energy absorber. We show that a sphere can be stoppedby a liquid foam, whatever its initial velocity, provided its mass-to-surface ratio is small enough to avoid sinking under its ownweight. We proposed a simple model predicting the amount offoam needed to capture such a projectile, and showed that thisquantity, for the spheres used in this study, corresponds to afoam sample size of about 20 cm. The idea of using liquid foamsto slow down and conne solid particles seems to be promising.Particle capture takes advantage of the uid nature of foams(during the viscous deceleration phase), as well as its ability tosustain its own weight and that of light projectiles. Under-standing of the mechanical behavior of foams can helpdesigning smart materials with heterogeneous properties thatcould adapt to the specic needs of a given application.
From amore fundamental point of view, we also report that aliquid foam, despite its complex heterogeneous structure,might behave like a Newtonian uid at very high shear rates, ina range previously uncharted. Shooting in a foam gives access toits rheology, in a way that is not always possible in standardrheometers. We estimated the limits of this viscous-likebehavior and show that it is restricted to frequencies of theorder of, or above 0.2 kHz. A deep understanding of the value ofthis viscosity plateau would require further experiments, inwhich parameters such as the bubble size, volume fraction andsurfactant chemistry would be varied. In the context of kineticenergy absorption, this would allow to adjust the foam'sformulation to the specic needs of each application.
6 Appendix: visco-elasto-plasticmodel for foam flow
Foam is a complex uid, exhibiting viscous, elastic and plasticbehavior. Much work has been done and is still going on toproperly describe its rheology.7,32 When a foam is sheared, somebubbles are elastically stretched, but the structure can also beirreversibly modied by plastic events. Marmottant and Granerproposed to separate elastic and plastic contributions in thestrain rate:27
c3 ¼ dU
dtþ c3P (9)
where U is the elastic deformation, that is, a state variabledescribing the current deformation state of the foam, while _3 isthe total strain rate and _3P is the plastic deformation rate. Therheological model is sketched in Fig. 8(a). The image at the topcorresponds to a situation with zero deformation 3 ¼ 0. Thespring is at rest, and its length is the equilibrium length. Whenthe deformation 3 increases, the spring compresses in a purelyelastic way, resulting in a strain 3 ¼ U.
Plastic events occur when the amplitude of the elasticdeformation reaches a yield value �UY and when it tends toincrease, that is, when U and _3 have the same sign. If the secondcondition is not fullled, the deformation may be large, but thestrain rate leads to reversible elastic unloading. When plasticrearrangements occur, their rate is given by the only time scalein the problem, _3, so _3P ¼ _3. This results in the followingequations for the elastic deformation8>><
>>:if |U |.UY and c3U . 0 then
dU
dt¼ 0
otherwisedU
dt¼ c3
(10)
The link between stress and strain is given by writing thestress s as a sum of a viscous and an elastic component, with m
an elastic modulus, he a macroscopic viscosity and a a non-dimensional coefficient depending on the geometry of thesystem:
s ¼ mU + ahe_3 (11)
The material is therefore described by 3 parameters: its yielddeformation UY, its viscosity he and its elastic modulus m.
References
1 J. Plateau, Statique Experimentale et theorique des liquidessoumis aux seules forces moleculaires, Gauthier-Villars, 1873.
2 P. Sollich, F. Lequeux, P. Hebraud and M. Cates, Phys. Rev.Lett., 1997, 78, 2020–2023.
3 G. Katgert andM. van Hecke, Europhys. Lett., 2010, 92, 34002.4 J. Banhart, Prog. Mater. Sci., 2001, 46, 559–632.
6704 | Soft Matter, 2014, 10, 6696–6704
5 H. J. Schulze, Physicochemical Elementary Processes inFlotation, Elsevier Science Publishers, 1984.
6 C. J. Clark and E. M. Bennett, Method for explosive blastcontrol using expanded foam, US Pat., 4,589,341, 1986.
7 R. Hohler and S. Cohen-Addad, J. Phys.: Condens. Matter,2005, 17, R1041.
8 D. Weaire and S. Hutzler, The physics of foams, OxfordUniversity Press, 1999.
9 L. Wang, J. T.-M. Cheung, F. Pu, D. Li, M. Zhang and Y. Fan,PLoS One, 2012, 6, e26490.
10 M. Thielen, T. Speck and R. Seidel, J. Mater. Sci., 2013, 48,3469–3478.
11 P. Tsou, J. Non-Cryst. Solids, 1995, 186, 415–427.12 A. Le Goff, L. Courbin, H. A. Stone and D. Quere, Europhys.
Lett., 2008, 84, 36001.13 N. Louvet, R. Hohler and O. Pitois, Phys. Rev. E: Stat.,
Nonlinear, So Matter Phys., 2010, 82, 041405.14 B. Dollet and F. Graner, J. Fluid Mech., 2007, 585, 181–211.15 I. Cantat and O. Pitois, Phys. Fluids, 2006, 18, 083302.16 A. D. Gopal and D. J. Durian, J. Colloid Interface Sci., 1999,
213, 169–178.17 N. D. Denkov, S. Tcholakova, K. Golemanov,
K. P. Ananthpadmanabhanb and A. Lips, So Matter, 2009,5, 3389–3408.
18 H. Hoballah, R. Hohler and S. Cohen-Addad, J. Phys. II, 1997,7, 1215–1224.
19 F. Rouyer, S. Cohen-Addad and R. Hohler, Colloids Surf., A,2005, 263, 111–116.
20 H. Barnes and K. Walters, Rheol. Acta, 1985, 24, 323–326.21 A. Le Goff, D. Quere and C. Clanet, Phys. Fluids, 2013, 25,
043101.22 L. W. Schwartz and H. M. Princen, J. Colloid Interface Sci.,
1987, 118, 201–211.23 H. Tabuteau, P. Coussot and J. R. de Bruyn, J. Rheol., 2007,
51, 125–137.24 B. Akers and A. Belmonte, J. Non-Newtonian Fluid Mech.,
2006, 135, 97–108.25 H. M. Princen and A. D. Kiss, J. Colloid Interface Sci., 1986,
112, 427–437.26 J. Boujlel, M. Maillard, A. Lindner, G. Ovarlez, X. Chateau
and P. Coussot, J. Rheol., 2012, 56, 1083–1108.27 P. Marmottant and F. Graner, Eur. Phys. J. E: SoMatter Biol.
Phys., 2007, 23, 337–347.28 K. Krishan, A. Helal, R. Hohler and S. Cohen-Addad, Phys.
Rev. E: Stat., Nonlinear, So Matter Phys., 2010, 82, 011405.29 A. Le Goff, P. Cobelli and G. Lagubeau, Phys. Rev. Lett., 2013,
110, 236101.30 M. J. Burchell, N. J. Foster, J. Ormond-Prout, D. Dupin and
S. P. Armes, Meteorit. Planet. Sci., 2009, 44, 10.31 A.-L. Biance, S. Cohen-Addad and R. Hohler, So Matter,