33
1

1

2
Disclaimer
Certain statements in this release concerning our future growth prospects are forward-looking statements
within the meaning of applicable securities laws and regulations , and which involve a number of risks and
uncertainties,beyond the control of the Company, that could cause actual results to differ materially from those in such
forward-looking statements. The risks and uncertainties relating to these statements include, but are not limited to, risks
and uncertainties regarding fluctuations in earnings, our ability to manage growth, intense competition including those
factors which may affect our cost advantage, wage increases, our ability to attract and retain highly skilled professionals,
political instability, legal restrictions on raising capital or acquiring companies outside India, and unauthorized use of our
intellectual property and general economic conditions affecting our industry. Shopper’s Stop Ltd. may, from time to time,
make additional written and oral forward looking statements, including our reports to shareholders. The Company does
not undertake to update any forward-looking statement that may be made from time to time by or on behalf of the
company.The Company also expects the media to have access to all or parts of this release and the management’s
commentaries and opinions thereon, based on which the media may wish to comment and/or report on the same. Such
comments and/or reporting maybe made only after taking due clearance and approval from the Company’s authorized
personnel.The Company does not take any responsibility for any interpretations/ views/commentaries/reports which may
be published or expressed by any media agency,without the prior authorization of the Company’s authorized personnel.

3
New Stores
37th and 38th Shoppers Stop Store Opened at Durgapur and Siliguri during the quarter.
17th & 18th Mac Store opened at Bangalore Koramangala & Delhi Vasant Kunj in this Quarter.
Loyalty Programme
First Citizen members base crossed the 2 million mark and now has 20,17,707 members. Their contribution to sales was 73%
Our Facebook fan page continues to grow well. Current base is 6.9 lacs fans.
Awards Received
“Most Respected Retail Company of the Year” from Business World.
VMRD Retail Design Awards 2011 - Merit Certificate’, for Andheri Store in the category ‘Department Store > 20000 sq.ft.’ at the 6th In-Store Asia 2011 (1st – 3rd February).
“Customer and Brand Loyalty Award – Retailer Sector “ at the 4th Loyalty awards during the quarter
“ Most Admired Non-Store Fashion and Lifestyle Retailer of the Year “ at the Images Fashion Awards 2011.
Business Overview
3

4
Our Presenceand still expanding…
Kolkatta
Delhi
Jaipur
Mumbai
Hyderabad
Bangalore Chennai
Gurgaon Ghaziabad
Pune
Noida
Amritsar
As on 31stMar 2011
Bhopal
Aurangabad
Siliguri
Durgapur
Lucknow
Ludhiana
City SS Dept. CrosswordHome
Stop
Mother
Care
MAC/Estee/
CliniqueHypercity Total
Amritsar 1 1 1 1 4
Bangalore 5 7 1 1 4 1 19
Chennai 1 1 1 2 5
Delhi 4 2 1 1 7 15
Gurgaon 1 1
Hyderabad 4 5 1 2 1 13
Jaipur 2 1 3
Kolkatta 3 1 4
Lucknow 1 1
Mumbai 8 17 2 2 10 3 42
Noida 1 1 2
Pune 2 1 1 4
Ghaziabad 1 1
Siliguri 1 1
Durgapur 1 1
Bhopal 1 2 1 4
Ludhiana 1 1
Aurangabad 1 1 2
Total 38 36 4 7 29 9 123
More than 3.4 million sq. ft. area, across 18 cities

5
Store Area as on 31st March,11 Chargeable Area (Sq.ft.)
Shoppers Stop 2,142,846
Specialty Stores 144,509
--------------
Total Store Area 2,287,355
=========
Crossword 85,582
Hypercity 984,248------------------
Total Group 3,357,185===========
Shoppers Stop Store Space ramp-up (Sq. ft.)
Existing Stores
Sq
ft
.
1.6 mn 2.0 mn
1.2 mn
1.8 mn
2.3 mn
5
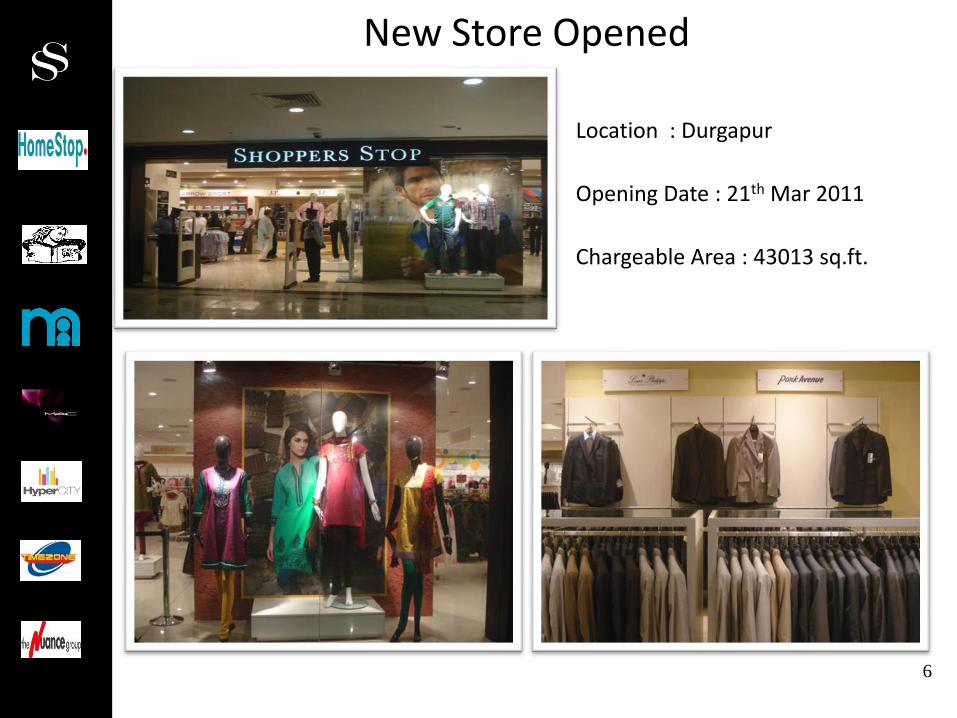
Location : Durgapur
Opening Date : 21th Mar 2011
Chargeable Area : 43013 sq.ft.
New Store Opened
6

Location : Siliguri
Opening Date : 25th Mar 2011
Chargeable Area : 33312 sq.ft.
New Store Opened
7

8
• Sales Growth:Shoppers Stop department stores : 29%All formats : 22%
• LTL Sales Growth:Shoppers Stop department stores : 14%stores > 5 years : 7%stores < 5 years : 28%
• Sales Per Sq.ft. on chargeable area (Built up sq.ft.) :Shoppers Stop department stores : Rs 2,141 (LY Rs. 2,119)
• Customer entry for Shoppers Stop Departmental stores Increasedby 31%
Key Financial Highlights – Q4-2010-11

9
Average Selling Price (“ASP”)Transaction Size (Rs.)
Conversion Ratio (%)Customer Entry (figures in lacs.)
Operational Indicators – Q4-2010-11
10%
10%
4%LTL Volume
31%
LTL storesGrown by
12%
LTL storesDegrew by
8%
LTL storesgrown by 10%
11%

10
GMROF (Rs. per unit of retail space)
GMROI (Rs. inventory) GMROL (Rs. per employee)
10% 2%
• Company has improved GMROF ,GMROL & GMROI.
Operational Efficiency Q4 2010-11
SS Dept. Stores
4%

11
Merchandise Mix – Q4 2010-11
• Private Label Mix decreased by 0.8%
Private Label Mix
Merchandise Buying Model
• Private Label Sales increased by 24%.
17.1%16.3%
10.0%
13.0%
16.0%
19.0%
22.0%
25.0%
Private Label
Q4-09-10
Q4-10-11
% Mix
10.0%
42.0%44.0% 48.0%
44.0%
12.0%
0.0%
10.0%
20.0%
30.0%
40.0%
50.0%
60.0%
70.0%
80.0%
90.0%
Q4-2009-10 Q4-2010-11
Bought Out Consignment/SOR Concession
12
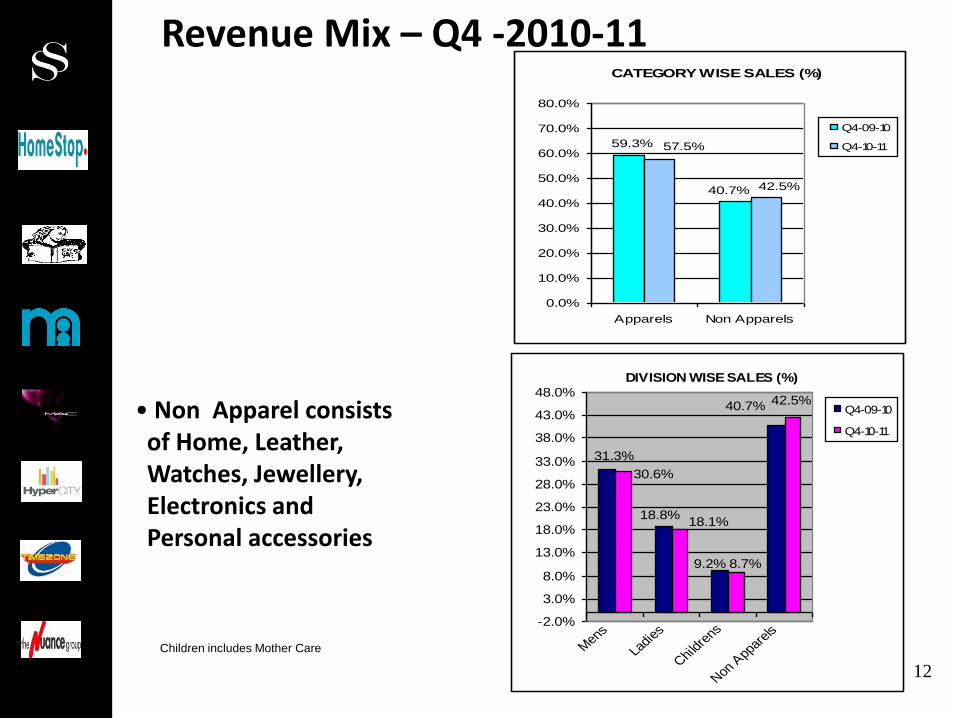
• Non Apparel consists of Home, Leather, Watches, Jewellery, Electronics and Personal accessories
Children includes Mother Care
Revenue Mix – Q4 -2010-11CATEGORY WISE SALES (%)
59.3%
40.7%
57.5%
42.5%
0.0%
10.0%
20.0%
30.0%
40.0%
50.0%
60.0%
70.0%
80.0%
Apparels Non Apparels
Q4-09-10
Q4-10-11
DIVISION WISE SALES (%)
31.3%
18.8%
9.2%
40.7%
30.6%
18.1%
8.7%
42.5%
-2.0%
3.0%
8.0%
13.0%
18.0%
23.0%
28.0%
33.0%
38.0%
43.0%
48.0%
Men
s
Ladi
es
Chi
ldre
ns
Non
App
arels
Q4-09-10
Q4-10-11

13
Operational Efficiency Q4 & 2010-11 :Shrinkage as % of Gross Retail Sales
Q4-2010-11
2010-11
(SS Dept. Stores)
14
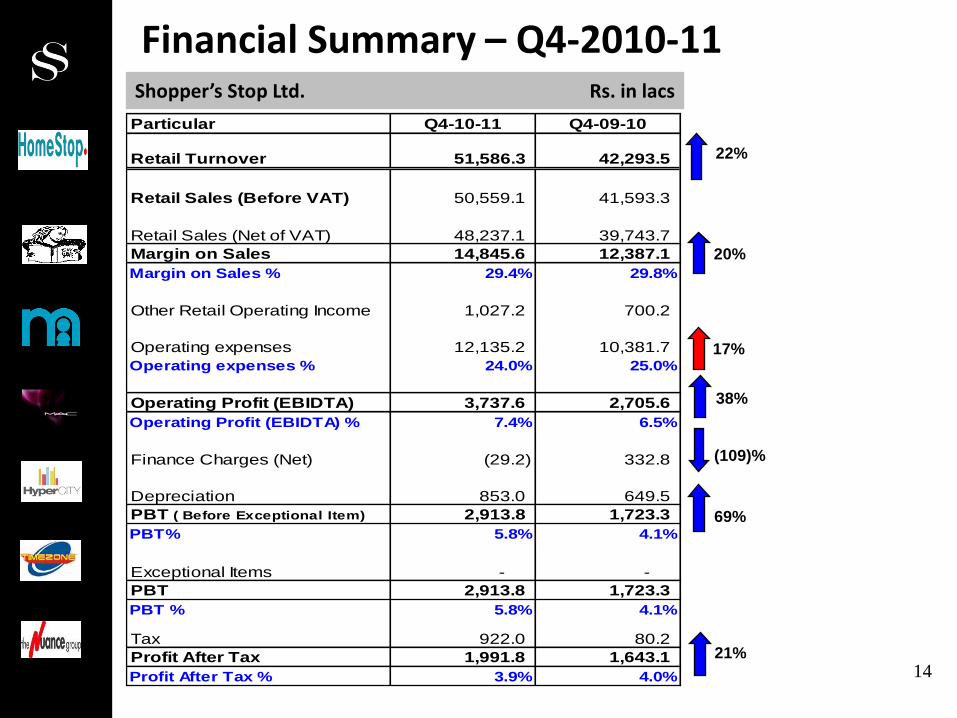
Financial Summary – Q4-2010-11Shopper’s Stop Ltd. Rs. in lacs
22%
20%
69%
21%
(109)%
17%
38%
Particular Q4-10-11 Q4-09-10
Retail Turnover 51,586.3 42,293.5
Retail Sales (Before VAT) 50,559.1 41,593.3
Retail Sales (Net of VAT) 48,237.1 39,743.7
Margin on Sales 14,845.6 12,387.1
Margin on Sales % 29.4% 29.8%
Other Retail Operating Income 1,027.2 700.2
Operating expenses 12,135.2 10,381.7
Operating expenses % 24.0% 25.0%
Operating Profit (EBIDTA) 3,737.6 2,705.6
Operating Profit (EBIDTA) % 7.4% 6.5%
Finance Charges (Net) (29.2) 332.8
Depreciation 853.0 649.5
PBT ( Before Exceptional Item) 2,913.8 1,723.3
PBT% 5.8% 4.1%
Exceptional Items - -
PBT 2,913.8 1,723.3
PBT % 5.8% 4.1%
Tax 922.0 80.2
Profit After Tax 1,991.8 1,643.1
Profit After Tax % 3.9% 4.0%

15
Financial Performance – Q4 2010-11
16
Retail Turnover Gross Cash Margin
EBIDTA PAT

16
Consolidated Financial – Q4 2010-11Rs. in lacs
44%
24%
(39)%
(44)%
60%
140%
Consolidation includes:
• Shoppers Stop Limited• Hypercity Retail (India) Ltd..• Crossword Bookstores Ltd.• Timezone Entertainment Pvt. Ltd.• Nuance Group (India) Pvt. Ltd.• Gateway Multichannel Ltd
53%
Note: LY figures do not include Hypercity Retail (India) Ltd.
Particular Q4-10-11 Q4-09-10
Retail Turnover 69,234.1 43,349.3
Retail Sales (Before VAT) 67,702.5 42,587.4
Retail Sales (Net of VAT) 64,286.8 40,737.8
Margin on Sales 18,691.7 12,940.8
Margin on Sales % 27.6% 30.4%
Other Retail Operating Income 1,531.6 761.9
Operating expenses 17,211.6 11,276.1
Operating expenses % 25.4% 26.5%
Operating Profit (EBIDTA) 3,011.8 2,426.6
Operating Profit (EBIDTA) % 4.4% 5.7%
Finance Charges (Net) 848.2 353.4
Depreciation 1,398.3 696.4
Profit Before Tax 765.3 1,376.8
Profit Before Tax % 1.1% 3.2%
Tax 881.5 117.4
Minority Interest 888.0 (1.8)
Profit After Tax 771.8 1,257.5
Profit After Tax % 1.1% 3.0%

17
2010-11

18
• Sales Growth:Shoppers Stop department stores : 28%All formats : 23%
• LTL Sales Growth:Shoppers Stop department stores : 17%stores > 5 years : 11%stores < 5 years : 32%
• Sales Per Sq.ft. on chargeable area (Built up sq.ft.) :Shoppers Stop department stores : Rs 8,518 (LY Rs. 7,955)
• Customer entry for Shoppers Stop Departmental stores increasedby 33%.
Key Financial Highlights –2010-11

19
Average Selling Price (“ASP”)Transaction Size (Rs.)
Conversion Ratio (%)Customer Entry (figures in lacs.)
Operational Indicators –2010-11
7%9%
10%• LTL Volume
33% 11%
LTL storesgrown by 8%
LTL stores
degrew by 2%
LTL storesgrown by 10%

20
GMROF (Rs. per unit of retail space)
GMROI (Rs. inventory) GMROL (Rs. per employee)
10% 4%
Operational Efficiency -2010-11SS Dept. Stores
• Company has improved GMROF,GMROL & GMROI.
6%

21
• Private Label Sales has increased by 21%
•Private Label Mix decreased 1.3%
Private Label Mix
Merchandise Buying Model
Merchandise Mix – 2010-11
18.8%
17.5%
15.0%
17.0%
19.0%
21.0%
23.0%
25.0%
Private Label
2009-10 2010-11
% Mix
10.0%
49.0%
45.0%39.0%
45.0%
12.0%
0.0%
10.0%
20.0%
30.0%
40.0%
50.0%
60.0%
70.0%
80.0%
90.0%
2009-10 2010-11
Bought Out Consignment/SOR Concession

22
• Non Apparel consists of Home, Leather, Watches, Jewellery, Electronics and Personal accessories
Children includes Mother Care
Revenue Mix – 2010-11CATEGORY WISE SALES (%)
59.5%
40.5%
58.8%
41.2%
0.0%
10.0%
20.0%
30.0%
40.0%
50.0%
60.0%
70.0%
Apparels Non Apparels
2009-10 2010-11
DIVISION WISE SALES (%)
31.8%
18.8%
8.9%
40.5%
31.1%
18.9%
8.7%
41.2%
0.0%
5.0%
10.0%
15.0%
20.0%
25.0%
30.0%
35.0%
40.0%
45.0%
Men
s
Ladi
es
Childr
ens
Non A
ppar
els
2009-10
2010-11

23
Financial Summary –2010-11Shopper’s Stop Ltd. Rs. in lacs
23%
21%
(61)%
50%
78%
16%
73%
34%
LY Operating Income includes
Rs.660 lacs for relinquishment of
Exclusive rights to open Mother
Care Stand alone Stores. The
Company retains the exclusive
development rights for Shop in
Shop Dept. Stores
Particular 2010-11 2009-10
Retail Turnover 193,125.6 157,092.5
Retail Sales (Before VAT) 190,713.4 154,657.8
Retail Sales (Net of VAT) 181,753.2 147,801.0
Margin on Sales 59,886.6 49,374.9
Margin on Sales % 31.4% 31.9%
Other Retail Operating Income 2,412.1 2,434.7
Operating expenses 47,087.8 40,458.8
Operating expenses % 24.7% 26.2%
Operating Profit (EBIDTA) 15,210.9 11,350.8
Operating Profit (EBIDTA) % 8.0% 7.3%
Finance Charges (Net) 733.6 1,869.0
Depreciation 3,099.9 3,102.5
PBT ( Before Exceptional Item) 11,377.5 6,379.3
PBT% 6.0% 4.1%
Exceptional Items (5.1) (187.7)
PBT 11,382.6 6,567.0
PBT % 6.0% 4.2%
Tax 3,865.0 1,544.0
Profit After Tax 7,517.6 5,023.1
Profit After Tax % 3.9% 3.2%

24
Consolidated Financial – 2010-11Rs. in lacs
38%
20%
20%
9%
54%
42%
42%
Particular 2010-11 2009-10
Retail Turnover 248,913.2 161,492.1
Retail Sales (Before VAT) 244,782.7 158,547.6
Retail Sales (Net of VAT) 232,325.6 151,690.8
Margin on Sales 71,680.8 52,040.8
Margin on Sales % 29.3% 32.8%
Other Retail Operating Income 4,130.5 2,944.5
Operating expenses 62,706.0 44,056.8
Operating expenses % 25.6% 27.8%
Operating Profit (EBIDTA) 13,105.3 10,928.5
Operating Profit (EBIDTA) % 5.4% 6.9%
Finance Charges (Net) 2,707.3 1,905.7
Depreciation 4,689.4 3,807.1
Profit Before Tax 5,708.6 5,215.7
Profit Before Tax % 2.3% 3.3%
Tax 3,887.6 1,635.5
Minority Interest 2,498.7 7.7
Profit After Tax 4,319.6 3,588.0
Profit After Tax % 1.8% 2.3%
Consolidation includes:
• Shoppers Stop Limited• Hypercity Retail (India) Ltd..• Crossword Bookstores Ltd.• Timezone Entertainment Pvt. Ltd.• Nuance Group (India) Pvt. Ltd.• Gateway Multichannel Ltd
Note: LY figures do not include Hypercity Retail (India) Ltd.

25
Rs.in Lacs
Balance Sheet – SSL Standalone
Audited Audited
March'11 March'10
Sources of Funds
Share Capital 4,108 3,491
Reserves & Surplus 55,702 27,398
NET WORTH 59,810 30,889
Loans Funds 14,872 19,935
TOTAL 74,682 50,824
APPLICATIONS OF FUNDS
FIXED ASSETS
Gross Block 55,029 48,534
Less : Depreciation 19,350 18,666
Net Block 35,678 29,867
Investments in Subsidiary / JV Companies 23,719 11,967
Deferred Tax Asset 325 455
CURRENT ASSETS, LOANS & ADVANCES
Stock in Trade 15,114 14,989
Sundry Debtors 1,601 1,091
Lease Deposits for Properties 10,675 10,334
Loans & Advances 17,305 8,779
Cash & Bank Balance 262 304
TOTAL CURRENT ASSETS 44,957 35,497
CURRENT LIABILITIES & PROVISIONS
Current Liabilities & Provisions 29,997 26,963
TOTAL CURRENT LIABILITIES 29,997 26,963
NET CURRENT ASSETS 14,960 8,534
TOTAL 74,682 50,824
PARTICULARS
Balance Sheet Ratios
Particulars 2010-11 2009-10
ROCE 19.3% 17.5%
ROCE (Without Investment in Group Co.) 33.3% 25.6%
RONW 26.7% 30.4%
Debt Equity Ratios 0.25 0.62
Asset Turnover Ratio 5.24 4.81
Current Ratio 0.64 0.66

26
Cash Flow – SSL StandaloneRs.in Lacs
Particulars
For the period
ended 31st March
2011
Operating Profit 12,211
Changes in Working Capital 1,712
Cash Generated from Operating Activities 13,923
Investment in SSL Fixed Assets (10,950)
Investment in JV/ Subsidiary Companies (17,615)
Net Cash Used for Investing Activities (28,566)
Proceeds from issuance of share capital 21,728
Interest & Finance Cost (Net off) (1,454)
Payment of Dividend and Dividend Tax (611)
Increase / (Decrease) in Loans (5,063)
Cash generated from Financing Activities 14,601
Net Increase/(decrease) in Bank Balance (42)

Investor Presentation – Q4 FY11
27

28
• Sales Growth:Chain level : 50%LTL Sales Growth : 11%
• Sales Per Sq.ft. on chargeable area :Chain Level Sales per Sq. ft. (in Rs.) : 1,465LTL Sales per Sq. ft. (in Rs.) : 1,615
• Customer entry Increased by 37%
HyperCITY - Key Financials Highlights – Q4-2010-11

29
• Sales Growth:Chain level : 84%LTL Sales Growth : 19%
• Sales Per Sq.ft. on chargeable area :Chain Level Sales per Sq. ft. (in Rs.) : 6,377LTL Sales per Sq. ft. (in Rs.) : 7,138
• Customer entry Increased by 94%
HyperCITY - Key Financials Highlights – 2010-11

Footfalls, ASP , Conversion and Average Ticket size
Footfalls (In Lacs) Average Selling Price (Rs)
Average Transaction size (Rs)Conversion rate (%)
2534
73
141
-
20
40
60
80
100
120
140
160
Q4 FY10 Q4 FY11 YTD FY10 YTD FY11
44.9%
41.8%
43.5%
41.2%
39.0%
40.0%
41.0%
42.0%
43.0%
44.0%
45.0%
46.0%
Q4 FY10 Q4 FY11 YTD FY10 YTD FY11
849
1,003 1,029 1,029
-
200
400
600
800
1,000
1,200
Q4 FY10 Q4 FY11 YTD FY10 YTD FY11
6867
74
70
62
64
66
68
70
72
74
76
Q4 FY10 Q4 FY11 YTD FY10 YTD FY11
30

Discovery club members and their contribution
Discovery Club Members [Since Inception] (In ‘000)
Discovery Club contribution to Total Sales (%)
78
98
115
138
163
0
40
80
120
160
200
Mar-10 Q1 FY11 Q2 FY11 Q3 FY11 Q4 FY11
33.8%
35.1%
37.3%
39.0%
43.9%
33.0%
35.0%
37.0%
39.0%
41.0%
43.0%
45.0%
Mar-10 Q1 FY11 Q2 FY11 Q3 FY11 Q4 FY11
31

HyperCity Financials - 2010-11
Rs.in lacs
Rs.in lacs
• Numbers have been regrouped for analytical representation
Particular Q4- FY11 % Sales YTD FY11 % Sales
Retail Sales (Including VAT) 14,151 59,719
Retail Sales (Net of VAT) 13,056 100.0% 55,164 100.0%
Margin on Sales 2,639 20.2% 11,064 20.1%
% to Sales 20.2% 20.1%
DC Cost 194 1.5% 862 1.6%
Shrinkage 81 0.6% 353 0.6%
Damages / Others 58 0.4% 219 0.4%
Gross Margin 2,306 17.7% 9,630 17.5%
% to Sales 17.7% 17.5%
Store Operating Expenses 2,567 19.7% 10,718 19.4%
Other Operating Income 351 2.7% 1,071 1.9%
Store EBIDTA 89 0.7% (18) 0.0%
Store EBIDTA % to Sales 0.7% 0.0%
Service Office Expenses 760 5.8% 3,016 5.5%
COMPANY EBIDTA (670) -5.1% (3,033) -5.5%
Depreciation 352 2.7% 1,266 2.3%
Finance Charges 818 6.3% 2,565 4.6%
Tax (0) 0.0% (3) 0.0%
PAT (1,840) -14.1% (6,861) -12.4%
PAT % to Sales -14.1% -12.4%
Sources of Funds 31st March 2011
Net worth 456
Loans from Shareholders / Group Co's 12,478
Loans 10,383
Total 23,317
Application of Funds
Fixed Assets 15,307
Currents Assets , Loans and Advances 14,115
Less : Current Liabilities and Provisions 6,105
Net Current Assets 8,011
Total 23,317
32


