Page 1
1
Shoreline Monitoring in Tory Channel and Queen Charlotte Sound
FINAL REPORT
November 2009 – April (May) 2012
Report prepared for the Marlborough District Council
by
Dr Kevin E Parnell School of Earth and Environmental Sciences
James Cook University Townsville, Queensland 4811
Australia
August 2012
Page 3
3
1. Introduction
In an agreement between Marlborough District Council and Auckland UniServices
Limited, dated 25 January 1997, Auckland UniServices Ltd, was engaged to establish
and report on a shoreline monitoring programme in Tory Channel and Queen Charlotte
Sound. Initially, the programme was for three years, involving six sets of surveys.
Progress reports were provided every six months (following a survey of shoreline
profiles), concluding with a final report in December 1999. The programme was then
extended through to April 2002 with a further five surveys, concluding with a final report
following the April 2002 survey. A contract for a further two surveys (November 2002
and April 2003) was negotiated in late 2002. In November 2003 a new contract was
negotiated with James Cook University, Australia for the analysis of surveys in
November 2003, April 2004, November 2004, April 2005, November 2005 and April
2006, concluding with a summary report, following Dr Kevin Parnell’s move to that
University. In February 2007, an extension to the contract provided for the analysis of
surveys undertaken in November 2006, April 2007, November 2007, April 2008,
November 2008 and April 2009, followed by a summary report. A further extension for
the analysis of surveys in November 2009, April 2010, November 2010, April 2011,
November 2011 and April 2012 was agreed in November 2009. Marlborough District
Council decided not to undertake the survey in April 2010. This report therefore covers
five surveys.
Marlborough District Council entered into an agreement with Ayson and Partners,
Surveyors, of Blenheim, to maintain the shoreline profiles and to undertake the required
surveys, under the direction of Dr Kevin Parnell.
2. Profile locations and methods
Details of the selection of survey sites, establishment of profiles, benchmarks and
datums, and survey methodology are in the final report of the first contract period.
Profile descriptions are also in that report. The location of the 21 profiles is shown in
Figure 1, and their positions are detailed in Table 1. Positions are with respect to the
WGS84 ellipsoid. A list of currently used benchmarks and their levels is in Appendix 1.
A visual impression of the profiles can be obtained from the photographs in Section 4
and in Appendix 2.
Page 4
4
Table 1: Profile positions
Pr Name Lat ° Lat ' Lat " Long° Long ' Long "
1 Picton Foreshore 41 17 17.6 174 0 25.12 The Snout at Picton Point 41 15 46.5 174 2 10.93 Double Bay 41 13 10.3 174 11 36.74 Ngaionui Bay (C Thomas) 41 14 16.5 174 11 8.55 Blackmore's at Waikawa 41 15 50.0 174 2 58.26 Moioio Island 2 41 14 39.4 174 12 56.97 Moioio Island 1 41 14 39.6 174 12 56.38 Bob's Bay 41 16 31.3 174 1 1.09 Te Awaiti 41 12 28.8 174 17 16
10 Tipi Bay 41 13 40.2 174 17 12.811 Long Island 41 7 22.3 174 16 12.612 Clark Point 41 8 12.6 174 17 30.713 Slip Beach 41 15 0.0 174 9 8.314 Ngaionui Point 41 14 27.6 174 10 46.215 Te Weka Bay 41 14 58.3 174 11 34.016 McMillan's Bay 41 14 45.5 174 12 11.417 McMillan's Side 41 14 43.5 174 12 9.618 Dieffenbach West 41 14 13.4 174 8 9.419 Curious Monkey 41 14 28.8 174 6 14.420 Patten's Passage 41 10 56.9 174 15 47.421 Blumine Island 41 9 37.0 174 14 4.4
Page 5
5
Figure 1: Profile locations
Page 6
6
3. Vessel operations affecting the profile sites
Vessels carrying passengers and freight between Wellington and Picton, have operated
the Tory Channel/Queen Charlotte Sound route for many years. In late 1994, fast
vessel operations started using the route alongside the conventional ferries. Until 2000,
various fast ferries operated over the summer months, after which an almost continuous
service using fast vessels ran until April 2005. However, in December 2000 the
Marlborough District Council enacted a bylaw that had the effect of slowing fast ferries
to 18 knots while in the Sounds, so after that time the fast ferries operated at their
normal service speed only outside the Marlborough Sounds. The Bylaw did not apply to
conventional vessels. Fast ferries have not operated on the Wellington – Picton route
since early 2005. Figure 2 shows the time periods over which various vessels have
operated. Other vessels, both large and small, also use the route.
Figure 2: Vessels using the Tory Channel/Queen Charlotte Sound route on
regular inter-island services. Note: The ‘Straitsman’ that commenced operation in
December 2010 is a different vessel operating under the same name.
Page 7
7
4. Profile analyses
In this section, data are presented for each profile and along with an interpretation of
the changes that have occurred. Each profile analysis is accompanied by three pages
of figures. The first page has photographs of the profile site taken from about 20 meters
each side looking back towards the profile line at the top. At the bottom of the first page
is a diagram of profile lines at the start of the monitoring programme in April 1997, the
end of the first contract (November 1999), the end of the second contract period (April
2002), the end of the third contract (May 2006), the end of the fourth contract (April
2009) and at the end of the current contract (May 2012) . The second page comprises
a ‘spaghetti’ diagram showing the 25 surveys of the profiles (April 1997, November
1997, April 1998, November 1998, April 1999, November 1999, April/May 2000,
November 2000, June 2001, November 2001 and April 2002, November 2002, April
2003, November 2003, April 2004, November 2004, April 2005, November 2005, May
2006, November 2006, April 2007, November 2007, April 2008, November 2008, April
2009, November 2009, November 2010, April 2011, November 2011 and May 2012) in
the upper section, and in the lower section, a different view of the same data commonly
known as an ‘Excursion Distance Analysis’. The final page shows beach volume data
(m3 per linear meter of beach) presented as a graph and a table. The limits for the
calculations are determined as shown in Figure 3 and Table 2. The upper beach limit
was a point on the upper beach landward of any profile change (if possible) or at the
upper limit of the profile measurement. Because changes at the lower beach can
indicate erosion, a measurement based on elevation is appropriate. This was taken at
profile closure depth if this was evident, or at a point which was reached on most
surveys. Where a profile did not reach the chosen lower limit, a value was estimated
based on linear extrapolation or on values measured before and after a missing data
point.
Page 8
8
Table 2: Volume calculation limits
Prof. Name Upper beach
limit (m) Lower beach
limit (m) 1 Picton Foreshore 6.87 -0.50 2 The Snout at Picton Point 0.00 -1.00 3 Double Bay -1.50 -1.00 4 Ngaionui Bay (C Thomas) -2.00 -0.25 5 Blackmore's at Waikawa 2.30 -0.75 6 Moioio Island 2 -2.00 -1.50 7 Moioio Island 1 0.00 -1.50 8 Bob's Bay 0.00 -1.00 9 Te Awaiti 0.30 -1.50
10 Tipi Bay 0.00 -1.25 11 Long Island 0.00 -0.75 12 Clark Point 0.00 -0.25 13 Slip Beach -1.00 -1.25 14 Ngaionui Point -2.00 -0.75 15 Te Weka Bay 2.00 -1.50 16 McMillan's Bay 0.00 -0.75 17 McMillan's Side -2.00 -0.75 18 Dieffenbach West 0.00 -0.50 19 Curious Monkey 0.00 -0.50 20 Patten's Passage 0.00 -0.50 21 Blumine Island 0.00 -0.50
-2
-1
0
1
2
3
-5 0 5 10 15 20 25 30 35 40 45 50
Ele
vatio
n (m
)
Distance from BM (m)
Upper beach limit for volume calculation
Lower beach limit for volume calculation
Area (m2)
=
Volume (m3/m)
Figure 3: Volume calculation methodology
Page 9
9
The ‘spaghetti’ plots of profiles are useful for establishing envelopes of change of
the beach shape, but interpretations of changes that have occurred are difficult, due to
the clutter of lines that are present. As the data set grows, any useful interpretation
based on these plots becomes almost impossible. Excursion distance plots use exactly
the same data plotted as a time series, and makes interpretation of beach changes
easier. Excursion distance analysis is a method by which three dimensional data sets
(distance, height and time) can be illustrated as plots with time on the independent axis.
It can be undertaken with either distance or height on the vertical axis, although having
distance on the vertical axis is more useful for most purposes. Excursion distances are
calculated by determining a set of height values for which calculations will be made.
These values are normally equally spaced and in the following figures, are shown in the
box on the right hand side of the graph. These numbers are in units of metres above or
below the datum (in this case approximate MSL). Using linear interpolation, the
horizontal distance from the datum is calculated for each of the height values, and these
are plotted as a time series with time on the horizontal axis. For each survey this
provides a “point contour map” of the profile, and when plotted as a time series, an
indication of how levels change through time. The graphs provide a lot of information.
If two lines converge, the beach is getting steeper at those contour heights. If two lines
diverge, the beach is getting flatter. If the lines trend seaward (increasing values on the
distance axis), the beach is accreting. If the lines trend landward, the beach is eroding.
Figure 4 attempts to show the methodology of Excursion Distance Analysis.
Page 10
10
0
1
2
3
-5 0 5 10 15 20 25 30 35 40 45 50
Ele
vatio
n (m
)
Distance from BM (m)
Year 1
Year 2
Year 3
Demonstration Profile - Spagetti Plot
Beach is accretingYear 1 to Year 2
Beach is erodingYear 2 to Year 3
0
10
20
30
40
0 1 2 3 4
Dis
tanc
e fr
om D
atum
(m
)
Years
2.5
2
1.5
1
Demonstration Profile - Excursion Distances
Upper Beach
gets flatter.
Lower beach
gets steeper.
Lines trend
seaward which
shows accretion.
Beach erodes
and gets much
steeper
Levels
indicated
by Orange
lines in
above
diagram
Figure 4 : Excursion Distance Analysis Demonstration
Page 11
11
Profile 1 – Picton Foreshore
The Picton Foreshore underwent extensive modification with the improvement of the
landward side of the retaining wall in late 1997. Sediments on the beach comprise both
natural marine sediments and river sand deposited in a beach nourishment programme.
I do not know if further nourishment has taken place since late 1997 or early 1998. If
further nourishment has taken place, then the rate of nourishment is clearly appropriate.
If there has been no renourishment, then the beach has been very stable since that
time. Beach volume has maintained a relatively narrow range since April 1998, between
29.1m3/m and 32.9m3/m. There has been no apparent change in sediment
characteristics. There is no indication that the seawall has had an adverse effect on
beach stability. There is no indication that waves caused by vessel wash in the inner
harbour are having an adverse effect on the Picton foreshore beach.
Page 12
12
-2
-1
0
1
2
3
-5 0 5 10 15 20 25 30 35 40 45 50
Ele
vatio
n (m
)
Distance from BM (m)
2-May-2012
22-Apr-2009
15-May-2006
9-Apr-2002
19-Nov-1999
8-Apr-1997
Profile 1: Picton Foreshore
Page 13
13
-1
0
1
2
3
4
5 10 15 20 25 30 35 40 45 50
Ele
vatio
n (
m)
Distance from BM (m)
2-May-2012
8 Dec-2011
5-May-2011
3-Dec-2010
16-Nov-2009
22-Apr-2009
1-Dec-2008
4-Apr-2008
22-Nov-2007
14-May-2007
6-Dec-2006
15-May-2006
15-Nov-2005
26-Apr-2005
9-Nov-2004
20-Apr-2004
21-Nov-2003
14-Apr-2003
18-Nov-2002
9-Apr-2002
15-Nov-2001
5-Jun-2001
8-Nov-2000
1-May-2000
19-Nov-1999
19-Apr-1999
26-Nov-1998
27-Apr-1998
15-Sep-1997
8-Apr-1997
Profile 1 - Picton Foreshore
0
10
20
30
40
50
60
0 1 2 3 4 5 6 7 8 9 10 11 12 13 14 15 16 17 18
Dis
tan
ce fr
om
Da
tum
(m
)
Years after 1 January 1995
2.00
1.75
1.50
1.25
1.00
0.75
0.50
0.25
0.00
-0.25
-0.50
Profile 1: Picton Foreshore
Page 14
14
25
26
27
28
29
30
31
32
33
34
35
0 1 2 3 4 5 6 7 8 9 10 11 12 13 14 15 16 17 18
Vo
lum
e (
m3
/m)
Years after 1 January 1995
Date Years after 1/1/95 Volume (m3/m)
8-Apr-97 2.27 32.1
15-Sep-97 2.71 26.0
27-Apr-98 3.32 32.7
26-Nov-98 3.90 30.8
19-Apr-99 4.30 31.8
19-Nov-99 4.88 32.3
1-May-00 5.33 31.7
8-Nov-00 5.85 32.5
5-Jun-01 6.43 32.9
15-Nov-01 6.87 32.0
9-Apr-02 7.27 31.1
18-Nov-02 7.88 32.2
14-Apr-03 8.29 31.2
21-Nov-03 8.89 31.4
20-Apr-04 9.29 31.5
9-Nov-04 9.86 30.6
26-Apr-05 10.31 29.1
15-Nov-05 10.87 30.1
15-May-06 11.36 30.4
06-Dec-06 11.91 30.3
14-May-07 12.33 30.5
22-Nov-07 12.89 29.9
04-Apr-08 13.33 30.6
01-Dec-08 13.90 31.4
22-Apr-09 14.29 30.3
16-Nov-09 14.87 30.7
03-Dec-10 15.88 31.3
05-May-11 16.34 30.7
08-Dec-11 16.93 30.0
02-May-12 17.33 30.6
Profile 1: Picton Foreshore
Page 15
15
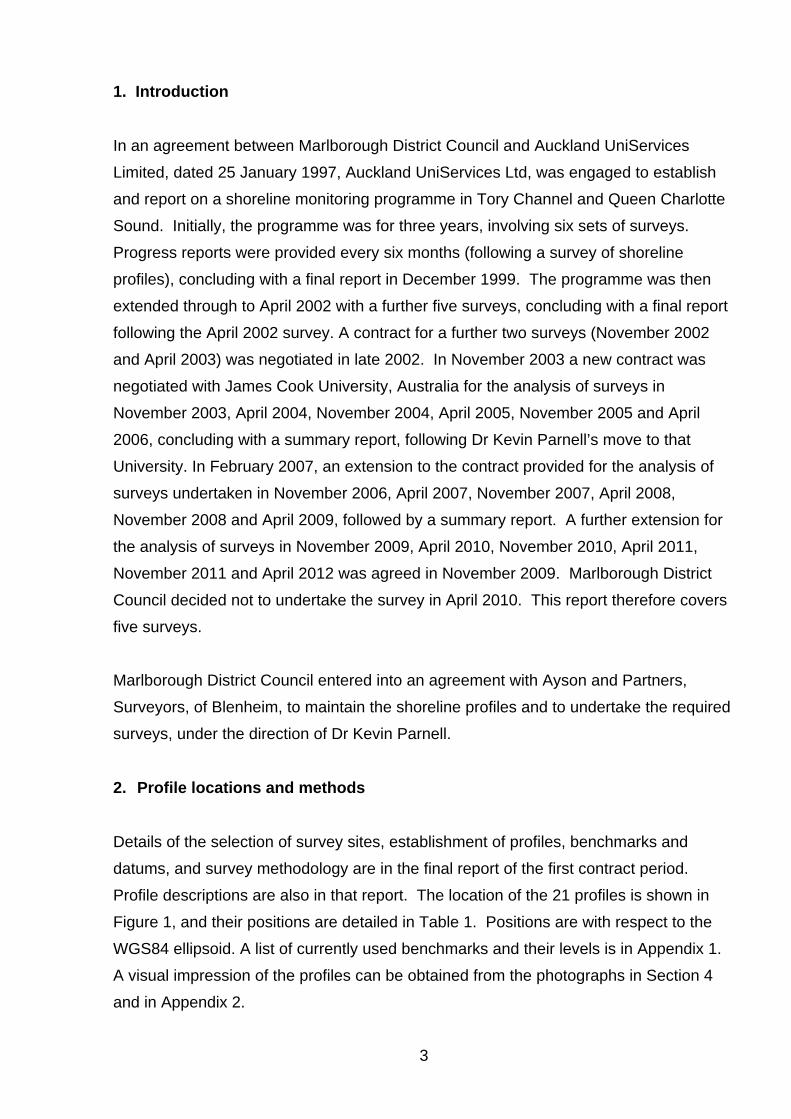
Profile 2 – The Snout at Picton Point
Since April 1997, the profile has retreated and significantly steeped, seen particularly by
the convergence of lines on the EDA plots. The major cause is probably the slow
migration of the deepwater channel in a shoreward direction. Beach volumes have
followed an almost linear trend of loss over the same period, with the loss of over
7m3/m. There have been no apparent changes to sediment composition. The reason
for the channel migration is not clear, although the site does receive considerable wake
energy.
Page 16
16
-2
-1
0
1
2
3
-5 0 5 10 15 20 25 30 35 40 45 50
Ele
vatio
n (m
)
Distance from BM (m)
2-May-2012
8-Apr-2009
10-May-2006
8-Apr-2002
22-Nov-1999
10-Apr-1997
Profile 2: The Snout at Picton Point
Page 17
17
-2
-1
0
1
2
3
-5 0 5 10 15 20 25 30 35 40 45 50
Ele
vatio
n (m
)
Distance from BM (m)
2-May-2012
8 Dec-2011
29-Apr-2011
3-Dec-2010
16-Nov-2009
8-Apr-2009
26-Nov-2008
6-May-2008
20-Nov-2007
14-May-2007
1-Dec-2006
10-May-2006
15-Nov-2005
26-Apr-2005
9-Nov-2004
20-Apr-2004
19-Nov-2003
14-Apr-2003
19-Nov-2002
8-Apr-2002
15-Nov-2001
5-Jun-2001
9-Nov-2000
1-May-2000
22-Nov-1999
19-Apr-1999
5-Nov-1998
27-Apr-1998
18-Nov-1997
10-Apr-1997
Profile 2 - The Snout at Picton Point
0
5
10
15
20
25
0 1 2 3 4 5 6 7 8 9 10 11 12 13 14 15 16 17 18
Dis
tan
ce fr
om
Da
tum
(m
)
Years after 1 January 1995
2.25
2.00
1.75
1.50
1.25
1.00
0.75
0.50
0.25
0.00
-0.25
-0.50
-0.75
-1.00
-1.25
Profile 2: The Snout at Picton Point
Page 18
18
28
29
30
31
32
33
34
35
36
37
38
0 1 2 3 4 5 6 7 8 9 10 11 12 13 14 15 16 17 18
Vo
lum
e (
m3
/m)
Years after 1 January 1995
Date Years after 1/1/95 Volume (m3/m)
10-Apr-97 2.28 36.4 18-Nov-97 2.88 36.6 27-Apr-98 3.32 33.7 5-Nov-98 3.84 34.5 19-Apr-99 4.30 34.1 1-May-00 5.33 33.7 1-May-00 5.33 33.7 9-Nov-00 5.86 31.8 5-Jun-01 6.43 33.7
15-Nov-01 6.87 33.5 8-Apr-02 7.27 33.6
19-Nov-02 7.88 33.0 14-Apr-03 8.29 33.2 19-Nov-03 8.89 31.3 20-Apr-04 9.29 32.5 9-Nov-04 9.86 31.8 26-Apr-05 10.31 31.2 15-Nov-05 10.87 31.9 01-Dec-06 11.91 30.9 14-May-07 12.33 30.3 20-Nov-07 12.89 30.3 06-May-08 13.33 30.3 26-Nov-08 13.90 29.8 08-Apr-09 14.29 29.9 16-Nov-09 14.87 29.7 03-Dec-10 15.88 29.6 29-Apr-11 16.34 29.2 08-Dec-11 16.93 28.2 02-May-12 17.33 29.3
Profile 2: The Snout at Picton Point
Page 19
19
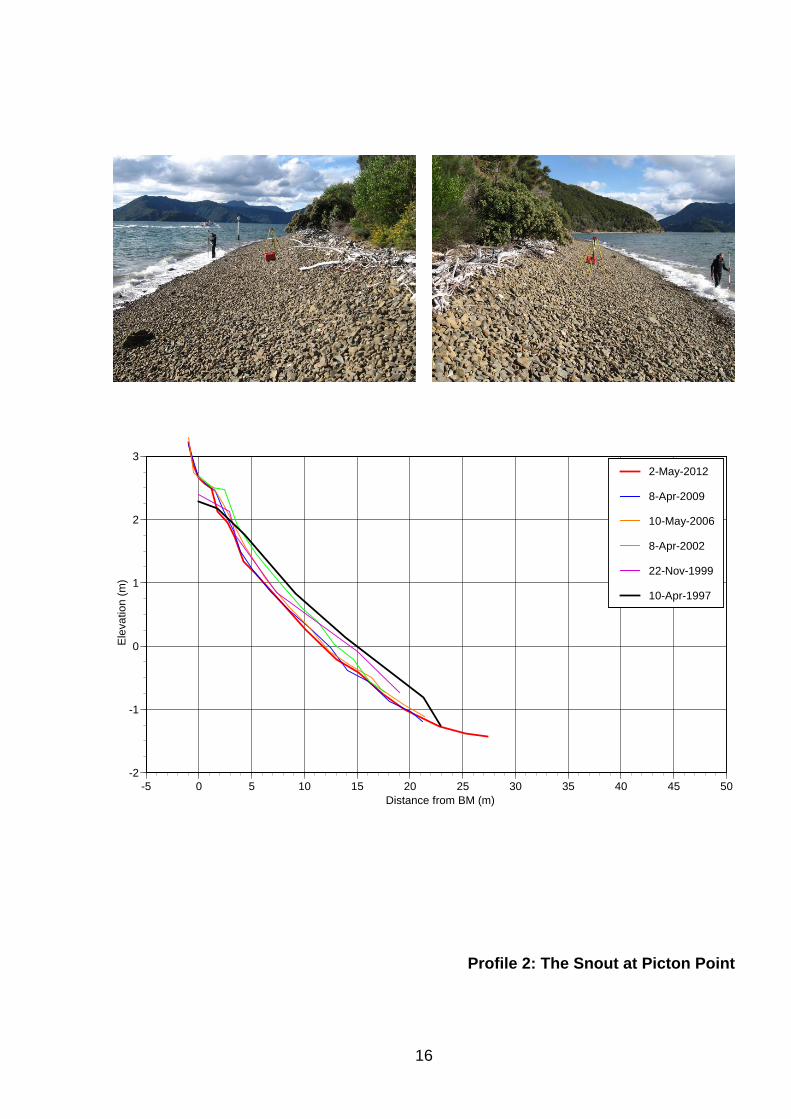
Profile 3 – Double Bay
The Double Bay beach profile has changed within a very narrow range over the period
April 1997 to April 2012. The most recent profile data sits close to the centre of the
long-term sweep, with beach volume in 2012 being only 0.2m3/m different to April 1997.
There has been a minor steeping of the beach with the construction of a berm over the
earlier years of the survey and a minor lowering of the mid-beach surface. The profiles
clearly reach closure depth at about -0.5m. Sediment characteristics have not changed
significantly.
Page 20
20
-2
-1
0
1
2
3
-5 0 5 10 15 20 25 30 35 40 45 50
Ele
vatio
n (m
)
Distance from BM (m)
2-May-2012
22-Apr-2009
9-May-2006
9-Apr-2002
22-Nov-1999
10-Apr-1997
Profile 3: Double Bay
Page 21
21
-2
-1
0
1
2
3
-5 0 5 10 15 20 25 30 35 40 45 50
Ele
vatio
n (
m)
Distance from BM (m)
2-May-2012
7-Dec-2011
29-Apr-2011
3-Dec-2010
16-Nov-2009
22-Apr-2009
12-Nov-2008
6-May-2008
20-Nov-2007
30-Apr-2007
20-Nov-2006
9-May-2006
14-Nov-2005
22-Apr-2005
7-Dec-2004
16-Apr-2004
19-Nov-2003
14-Apr-2003
18-Nov-2002
9-Apr-2002
26-Nov-2001
15-Jun-2001
9-Nov-2000
13-Apr-2000
22-Nov-1999
19-Apr-1999
2-Nov-1998
8-Apr-1998
26-Nov-1997
10-Apr-1997
Profile 3 - Double Bay
0
5
10
15
20
25
30
35
40
0 1 2 3 4 5 6 7 8 9 10 11 12 13 14 15 16 17 18
Dis
tanc
e fr
om D
atu
m (
m)
Years after 1 January 1995
2.00
1.75
1.50
1.25
1.00
0.75
0.50
0.25
0.00
-0.25
-0.50
-0.75
-1.00
Profile 3: Double Bay
Page 22
22
45
46
47
48
49
50
51
52
53
54
55
0 1 2 3 4 5 6 7 8 9 10 11 12 13 14 15 16 17 18
Vo
lum
e (
m3
/m)
Years after 1 January 1995
Date Years after 1/1/95 Volume (m3/m)
10-Apr-97 2.28 48.0 26-Nov-97 2.90 48.1 8-Apr-98 3.27 48.3 2-Nov-98 3.84 49.1 19-Apr-99 4.30 49.8 22-Nov-99 4.89 47.1 13-Apr-00 5.28 48.1 9-Nov-00 5.86 49.3 15-Jun-01 6.46 48.0 26-Nov-01 6.90 48.6 9-Apr-02 7.27 49.2
18-Nov-02 7.88 49.2 14-Apr-03 8.29 49.3 19-Nov-03 8.89 49.3 16-Apr-04 9.29 49.1 7-Dec-04 9.86 49.4 22-Apr-05 10.31 49.5 14-Nov-05 10.87 48.0 9-May-06 11.36 48.1 20-Nov-06 11.91 47.8 30-Apr-07 12.33 48.2 20-Nov-07 12.89 47.5 06-May-08 13.33 48.0 12-Nov-08 13.90 48.0 22-Apr-09 14.29 48.6 16-Nov-09 14.87 48.0 03-Dec-10 15.88 47.7 29-Apr-11 16.34 48.5 07-Dec-11 16.93 46.7 02-May-12 17.33 47.8
Profile 3: Double Bay
Page 23
23
Profile 4 – Ngaionui Bay
The long-term history of this site has been discussed in previous reports. The site is
complicated by relatively frequent human modifications (although the nature of any
works and their frequency in recent times is not known). It is also complicated by the
presence of a landslide at the western end of the beach, with sediment redistribution
within the compartment. It was very clear that fast ferry operation contributed to
significant beach accretion, and that all wakes and natural processes, coinciding with a
sediment supply from the slip, have all contributed to slow beach building. However,
since 2006, the beach has been relatively stable, with minor adjustments to the beach
berm. Since 2006, beach volume has varied little within a 1m3/m range.
Page 24
24
-2
-1
0
1
2
3
-5 0 5 10 15 20 25 30 35 40 45 50
Ele
vatio
n (m
)
Distance from BM (m)
1-May-2012
8-Apr-2009
10-May-2006
10-Apr-2002
18-Nov-1999
9-Apr-1997
Profile 4: Ngaionui Bay
Page 25
25
-2
-1
0
1
2
3
-5 0 5 10 15 20 25 30 35 40 45 50
Ele
vatio
n (m
)
Distance from BM (m)
1-May-2012
7-Dec-2011
2-May-2011
16-Nov-2010
13-Nov-2009
8-Apr-2009
26-Nov-2008
2-May-2008
21-Nov-2007
1-May-2007
1-Dec-2006
10-May-2006
11-Nov-2005
20-Apr-2005
8-Nov-2004
15-Apr-2004
20-Nov-2003
15-Apr-2003
15-Nov-2002
10-Apr-2002
12-Nov-2001
15-Jun-2001
9-Nov-2000
13-Apr-2000
18-Nov-1999
14-Apr-1999
4-Nov-1998
9-Apr-1998
14-Nov-1997
9-Apr-1997
Profile 4 - Ngaionui Bay
0
5
10
15
20
25
30
35
40
0 1 2 3 4 5 6 7 8 9 10 11 12 13 14 15 16 17 18
Dis
tan
ce fr
om
Da
tum
(m
)
Years after 1 January 1995
2.25
2.00
1.75
1.50
1.25
1.00
0.75
0.50
0.25
0.00
-0.25
-0.50
-0.75
-1.00
Profile 4: Ngaionui Bay
Page 26
26
23
24
25
26
27
28
29
30
31
32
33
0 1 2 3 4 5 6 7 8 9 10 11 12 13 14 15 16 17 18
Vo
lum
e (
m3
/m)
Years after 1 January 1995
Date Years after 1/1/95 Volume (m3/m)
9-Apr-97 2.27 25.8 14-Nov-97 2.87 25.7 9-Apr-98 3.27 24.6 4-Nov-98 3.84 25.9 14-Apr-99 4.29 24.9 18-Nov-99 4.88 26.3 13-Apr-00 5.28 28.4 9-Nov-00 5.86 28.6 15-Jun-01 6.46 24.2 12-Nov-01 6.86 24.7 10-Apr-02 7.28 26.0 15-Nov-02 7.88 26.3 15-Apr-03 8.29 26.5 20-Nov-03 8.89 26.5 15-Apr-04 9.29 28.0 8-Nov-04 9.86 27.8 20-Apr-05 10.31 29.8 11-Nov-05 10.87 29.5 10-May-06 11.36 29.1 01-Dec-06 11.91 29.8 01-May-07 12.33 29.1 21-Nov-07 12.89 28.3 02-May-08 13.33 29.9 26-Nov-08 13.90 29.3 08-Apr-09 14.29 29.0 13-Nov-09 14.87 28.9 16-Nov-10 15.88 28.1 02-May-11 16.34 29.7 07-Dec-11 16.93 29.2 01-May-12 17.33 29.3
Profile 4: Ngaionui Bay
Page 27
27
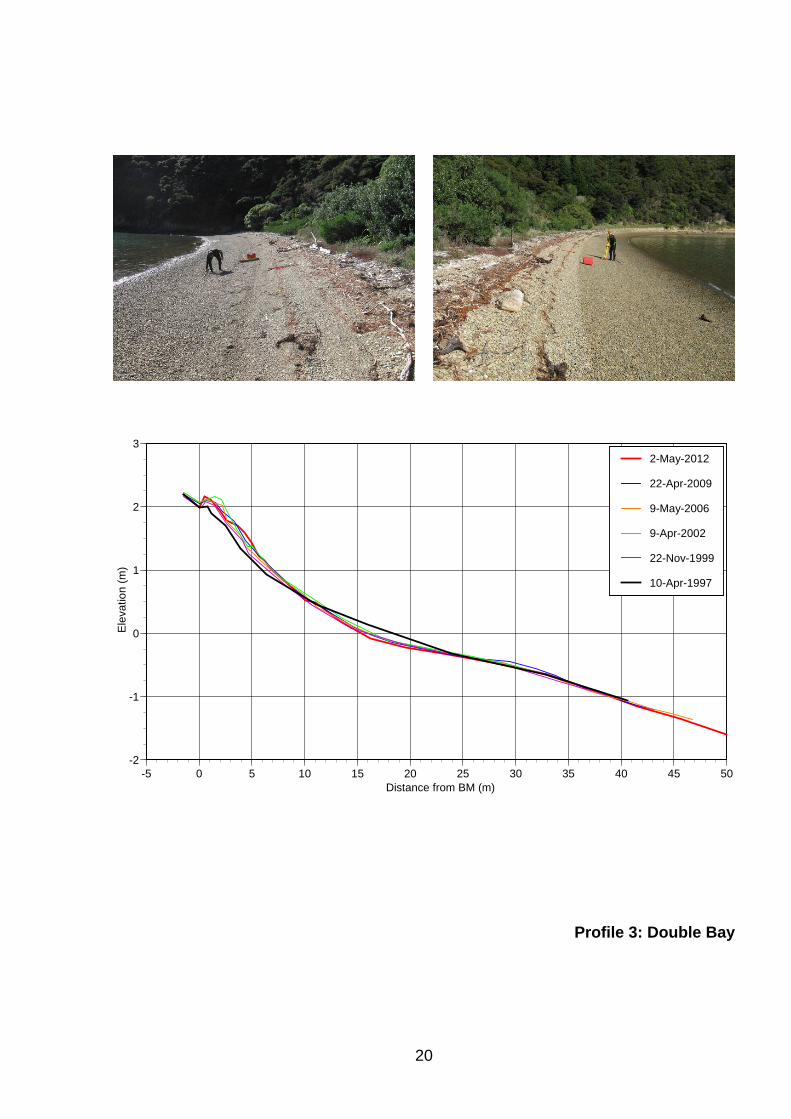
Profile 5 – Blackmore’s at Waikawa
Between April 1999 and November 1999, sand on the small beach started to disappear.
By November 2001, the beach had been stripped to bedrock, and it has remained
essentially devoid of sediment since that time. Further loss of sediment is therefore not
possible. There has been no recovery since the fast ferries slowed down in December
2000. Minor changes in profiles and volumes recorded since that time are likely to be
the result of slightly different survey alignments, and possibly minor changes in
sediments on the lower profile.
Page 28
28
-2
-1
0
1
2
3
-5 0 5 10 15 20 25 30 35 40 45 50
Ele
vatio
n (m
)
Distance from BM (m)
1-May-2012
8-Apr-2009
10-May-2006
10-Apr-2002
22-Nov-1999
8-Apr-1997
Profile 5: Blackmore’s at Waikawa
Page 29
29
-2
-1
0
1
2
3
-5 0 5 10 15 20 25 30 35 40 45 50
Ele
vatio
n (m
)
Distance from BM (m)
1-May-2012
7-Dec-2011
2-May-2011
3-Dec-2010
16-Nov-2009
8-Apr-2009
12-Nov-2008
4-Apr-2008
21-Nov-2007
14-May-2007
21-Nov-2006
10-May-2006
14-Nov-2005
20-Apr-2005
9-Nov-2004
20-Apr-2004
19-Nov-2003
16-Apr-2003
18-Nov-2002
10-Apr-2002
15-Nov-2001
5-Jun-2001
9-Nov-2000
1-May-2000
22-Nov-1999
19-Apr-1999
4-Nov-1998
29-Apr-1998
14-Nov-1997
8-Apr-1997
Profile 5 - Blackmore's at Waikawa
0
5
10
15
20
0 1 2 3 4 5 6 7 8 9 10 11 12 13 14 15 16 17 18
Dis
tan
ce fr
om
Da
tum
(m
)
Years after 1 January 1995
1.50
1.25
1.00
0.75
0.50
0.25
0.00
-0.25
-0.50
-0.75
-1.00
-1.25
Profile 5: Blackmore’s at Waikawa
Page 30
30
5
6
7
8
9
10
11
12
13
14
15
0 1 2 3 4 5 6 7 8 9 10 11 12 13 14 15 16 17 18
Vo
lum
e (
m3
/m)
Years after 1 January 1995
Date Years after 1/1/95 Volume (m3/m)
8-Apr-97 2.27 11.4 14-Nov-97 2.87 11.4 29-Apr-98 3.33 10.7 4-Nov-98 3.84 11.4 19-Apr-99 4.30 10.7 22-Nov-99 4.89 9.1 1-May-00 5.33 9.4 9-Nov-00 5.86 8.3 5-Jun-01 6.43 8.3
15-Nov-01 6.87 8.0 10-Apr-02 7.28 8.1 18-Nov-02 7.88 8.3 16-Apr-03 8.29 8.7 19-Nov-03 8.89 8.1 20-Apr-04 9.29 8.0 9-Nov-04 9.86 7.7 20-Apr-05 10.31 8.1 14-Nov-05 10.87 8.7 10-May-06 11.36 8.4 21-Nov-06 11.91 8.5 14-May-07 12.33 8.3 21-Nov-07 12.89 8.1 04-Apr-08 13.33 8.1 12-Nov-08 13.90 8.2 08-Apr-09 14.29 8.2 16-Nov-09 14.87 8.2 03-Dec-10 15.88 8.4 02-May-11 16.34 8.5 07-Dec-11 16.93 8.2 01-May-12 17.33 8.3
Profile 5: Blackmore’s at Waikawa
Page 31
31
Profile 6 – Moioio Island 2
Moioio Island 2 is at the eastern end of the beach on the island, near the slip that was of
considerable concern to Te Ati Awa at the time the fast ferries were operating. This
profile has a record going back to November 1995 and until 1999 the beach profile
demonstrated seasonality, with a build up of a berm on the upper beach over the winter
months, and its removal over the summer months, after which time, seasonal patterns
have not been evident. The beach experienced significant accretion up to 2005, with a
significant reversal for a period between November 2000 and April 2002 (coinciding with
the slowing of the fast ferries possible affecting sediment mobility from the slip source).
Between 2005 and 2009 the beach eroded, particularly on the upper and middle
sections. Over the last 3 years, the upper beach has again accreted, probably due to
an input of sediment from the slip. A significant berm remains at the top of the profile,
and the lower beach continues to extend slowly into the deep water channel.
The most significant effect on this profile has almost certainly been the adjacent slip.
Major fluctuations in beach shape and volume, and indeed the general accretion, are
almost certainly related to sediment supply from periods of activity and inactivity of the
slip.
Page 32
32
-2
-1
0
1
2
3
-5 0 5 10 15 20 25 30 35 40 45 50
Ele
vatio
n (m
)
Distance from BM (m)
1-May-2012
8-Apr-2009
9-May-2006
10-Apr-2002
18-Nov-1999
9-Apr-1997
Profile 6: Moioio Island 2
Page 33
33
-2
-1
0
1
2
3
-5 0 5 10 15 20 25 30 35 40 45 50
Ele
vatio
n (m
)
Distance from BM (m)
1-May-2012
7-Dec-2011
2-May-2011
16-Nov-2010
13-Nov-2009
8-Apr-2009
26-Nov-2008
2-May-2008
21-Nov-2007
1-May-2007
21-Nov-2006
9-May-2006
11-Nov-2005
20-Apr-2005
9-Nov-2004
15-Apr-2004
20-Nov-2003
15-Apr-2003
15-Nov-2002
10-Apr-2002
12-Nov-2001
15-Jun-2001
22-Nov-2000
1-May-2000
18-Nov-1999
13-Apr-1999
4-Nov-1998
9-Apr-1998
14-Nov-1997
9-Apr-1997
Profile 6 - Moioio Island 2
-5
0
5
10
15
20
25
0 1 2 3 4 5 6 7 8 9 10 11 12 13 14 15 16 17 18
Dis
tanc
e fr
om D
atu
m (
m)
Years after 1 January 1995
1.50
1.25
1.00
0.75
0.50
0.25
0.00
-0.25
-0.50
-0.75
-1.00
-1.25
-1.50
-1.75
Profile 6: Moioio Island 2
Page 34
34
40
41
42
43
44
45
46
47
48
49
50
0 1 2 3 4 5 6 7 8 9 10 11 12 13 14 15 16 17 18
Vo
lum
e (
m3
/m)
Years after 1 January 1995
Date Years after 1/1/95 Volume (m3/m)
8-Nov-95 0.85 42.17 21-Nov-95 0.89 41.92 6-Dec-95 0.93 42.11 20-Dec-95 0.97 41.40 19-Jan-96 1.05 41.75 29-Feb-96 1.16 41.52 9-Apr-97 2.27 43.65
14-Nov-97 2.87 43.79 9-Apr-98 3.27 43.27 4-Nov-98 3.84 44.12 13-Apr-99 4.28 42.83 18-Nov-99 4.88 44.12 1-May-00 5.33 43.69 22-Nov-00 5.89 46.26 15-Jun-01 6.46 45.01 12-Nov-01 6.86 44.29 10-Apr-02 7.28 43.06 15-Nov-02 7.88 44.6 15-Apr-03 8.29 44.9 20-Nov-03 8.89 47.0 15-Apr-04 9.29 48.5 9-Nov-04 9.86 46.0 20-Apr-05 10.31 47.5 11-Nov-05 10.87 47.6 9-May-06 11.36 45.5 21-Nov-06 11.91 46.2 01-May-07 12.33 44.8 21-Nov-07 12.89 43.8 02-May-08 13.33 44.1 26-Nov-08 13.90 44.0 08-Apr-09 14.29 43.5 13-Nov-09 14.87 43.0 16-Nov-10 15.88 43.3 02-May-11 16.34 44.9 07-Dec-11 16.93 42.9 01-May-12 17.33 45.7
Profile 6: Moioio Island 2
Page 35
35
Profile 7 – Moioio Island 1
The Moioio Island 1 profile is to the west of Profile 6. There was remarkable
seasonality up to the winter of 1999, with the growth of a berm over winter and its loss
over summer. Up until the end of 2000, the upper beach was generally stable, with
seasonality, and with the lower beach accreting into the channel. Up to 2006, like
Profile 6, the whole profile accreted rapidly with very substantial volume increases.
There was substantial accretion of the upper beach between May 2000 and May 2006,
with a major increase in volume, particularly between May 2000 and April 2001. Like
Profile 6, there was a reversal in 2006, with a year of significant erosion, although the
substantial berm remained. Since 2007 the profile has been relatively stable. This
profile is almost certainly reacting principally to sediment supply.
There is little doubt that the beach changes taking place on this profile are related in
part to ferry operation (evidenced by the very strong seasonal signal when fast ferries
were operating seasonally), but they are affected significantly by changes to sediment
supply. For example, the accretion event observed on Profile 6 between April 2003 and
April 2004 is reflected on Profile 7 between November 2004 and April 2005.
Page 36
36
-2
-1
0
1
2
3
-5 0 5 10 15 20 25 30 35 40 45 50
Ele
vatio
n (m
)
Distance from BM (m)
1-May-2012
8-Apr-2009
9-May-2006
10-Apr-2002
18-Nov-1999
9-Apr-1997
Profile 7: Moioio Island 1
Page 37
37
-2
-1
0
1
2
3
-5 0 5 10 15 20 25 30 35 40 45 50
Ele
vatio
n (
m)
Distance from BM (m)
1-May-2012
7-Dec-2011
2-May-2011
16-Nov-2010
13-Nov-2009
8-Apr-2009
26-Nov-2008
2-May-2008
21-Nov-2007
1-May-2007
21-Nov-2006
9-May-2006
11-Nov-2005
20-Apr-2005
9-Nov-2004
16-Apr-2004
20-Nov-2003
15-Apr-2003
15-Nov-2002
10-Apr-2002
12-Nov-2001
15-Jun-2001
22-Nov-00
1-May-2000
18-Nov-1999
13-Apr-1999
4-Nov-1998
9-Apr-1998
14-Nov-1997
9-Apr-1997
Profile 7 - Moioio Island 1
0
5
10
15
20
25
0 1 2 3 4 5 6 7 8 9 10 11 12 13 14 15 16 17 18
Dis
tan
ce fr
om
Da
tum
(m
)
Years after 1 January 1995
1.50
1.25
1.00
0.75
0.50
0.25
0.00
-0.25
-0.50
-0.75
-1.00
-1.25
-1.50
-1.75
-2.00
Profile 7: Moioio Island 1
Page 38
38
30
32
34
36
38
40
42
44
46
48
50
0 1 2 3 4 5 6 7 8 9 10 11 12 13 14 15 16 17 18
Vo
lum
e (
m3
/m)
Years after 1 January 1995
Date Years after 1/1/95 Volume (m3/m) 1977 38.3
8-Feb-95 0.10 31.6 17-Feb-95 0.13 31.6 22-Aug-95 0.64 32.4 22-Nov-95 0.89 33.6 8-Dec-95 0.94 34.0 20-Dec-95 0.97 34.1 7-Jan-96 1.02 34.1 8-Feb-96 1.10 33.7 9-Dec-96 1.94 34.5 9-Apr-97 2.27 34.9
14-Nov-97 2.87 35.4 9-Apr-98 3.27 34.0 4-Nov-98 3.84 35.3 13-Apr-99 4.28 34.7 18-Nov-99 4.88 35.8 1-May-00 5.33 35.2 22-Nov-00 5.89 38.1 15-Jun-01 6.46 40.3 12-Nov-01 6.86 41.5 10-Apr-02 7.28 41.0 15-Nov-02 7.88 40.7 15-Apr-03 8.29 42.4 20-Nov-03 8.89 44.2 16-Apr-04 9.29 44.6 9-Nov-04 9.86 43.9 20-Apr-05 10.31 46.8 11-Nov-05 10.87 46.0 9-May-06 11.36 46.4 21-Nov-06 11.91 46.0 01-May-07 12.33 44.5 21-Nov-07 12.89 44.3 02-May-08 13.33 43.9 26-Nov-08 13.90 44.5 08-Apr-09 14.29 43.9 13-Nov-09 14.87 44.8 16-Nov-10 15.88 43.9 02-May-11 16.34 44.3 07-Dec-11 16.93 45.5 01-May-12 17.33 44.7
Profile 7: Moioio Island 1
Page 39
39
Profile 8 – Bob’s Bay
Bob’s Bay has demonstrated an almost linear erosion trend since 1995 across the
whole beach profile down to the change in slope (and probable closure depth) at about
–1m. Most of the beach has lowered in level by about 1.2m. Volume data shows a
volume change of the monitored area from 38.2m3/m in 1995 to 16.9m3/m since 1995.
Because the profile line clearly encompasses the sweep zone, the 55% volume loss
accurately reflects the total loss of sand. This erosion is very significant within the
context of beaches in this study. The beach slope has stayed relatively constant.
The location of this profile is at the northern end of the beach, adjacent to a headland of
significance to Te Ati Awa. It may be that the erosion is accompanied by accretion
elsewhere in the embayment.
The cause of the erosion is not known. The site is well inside Mabel Island, and all
major shipping movements should be at low speed with small wakes. There is also
limited fetch, so natural waves should also be small. The mechanism of sediment
transport away from the profile line, and where the sediment goes could be investigated
if erosion at this particular point becomes more of concern.
Page 40
40
-2
-1
0
1
2
3
-5 0 5 10 15 20 25 30 35 40 45 50
Ele
vatio
n (m
)
Distance from BM (m)
2-May-2012
22-Apr-2009
15-May-2006
8-Apr-2002
19-Nov-1999
10-Apr-1997
Profile 8: Bobs Bay
Page 41
41
-2
-1
0
1
2
3
-5 0 5 10 15 20 25 30 35 40 45 50
Ele
vatio
n (m
)
Distance from BM (m)
2-May-2012
6-Dec-2011
29-Apr-2011
3-Dec-2010
16-Nov-2009
22-Apr-2009
26-Nov-2008
6-May-2008
22-Nov-2007
14-May-2007
1-Dec-2006
15-May-2006
15-Nov-2005
26-Apr-2005
9-Nov-2004
20-Apr-2004
19-Nov-2003
14-Apr-2003
19-Nov-2002
8-Apr-2002
15-Nov-2001
5-Jun-2001
29-Nov-2000
1-May-2000
19-Nov-1999
19-Apr-1999
5-Nov-1998
27-Apr-1998
18-Nov-1997
10-Apr-1997
Profile 8 - Bob'sBay
0
5
10
15
20
25
30
0 1 2 3 4 5 6 7 8 9 10 11 12 13 14 15 16 17 18
Dis
tan
ce fr
om
Da
tum
(m
)
Years after 1 January 1995
1.75
1.5
1.25
1
0.75
0.5
0.25
0
-0.25
-0.5
-0.75
-1
-1.25
-1.5
Profile 8: Bobs Bay
Page 42
42
15
20
25
30
35
40
0 1 2 3 4 5 6 7 8 9 10 11 12 13 14 15 16 17 18
Vo
lum
e (
m3
/m)
Years after 1 January 1995
Date Years after 1/1/95 Volume (m3/m) 17-Feb-95 0.13 38.2 22-Aug-95 0.64 38.6 21-Nov-95 0.89 37.1 7-Dec-95 0.93 37.1 20-Dec-95 0.97 36.7 7-Jan-96 1.02 37.0
10-Feb-96 1.11 37.4 10-Dec-96 1.94 35.9 10-Apr-97 2.28 36.4 18-Nov-97 2.88 35.4 27-Apr-98 3.32 34.7 5-Nov-98 3.84 34.0 19-Apr-99 4.30 33.5 19-Nov-99 4.88 33.0 1-May-00 5.33 32.8 29-Nov-00 5.91 31.7 5-Jun-01 6.43 32.0
15-Nov-01 6.87 31.1 8-Apr-02 7.27 31.1
19-Nov-02 7.88 29.8 14-Apr-03 8.29 29.1 19-Nov-03 8.89 26.4 20-Apr-04 9.29 28.0 9-Nov-04 9.86 27.1 26-Apr-05 10.31 25.9 15-Nov-05 10.87 25.5 15-May-06 11.36 24.2 01-Dec-06 11.91 23.5 14-May-07 12.33 23.2 22-Nov-07 12.89 22.1 06-May-08 13.33 21.9 26-Nov-08 13.90 20.7 22-Apr-09 14.29 21.1 16-Nov-09 14.87 20.5 03-Dec-10 15.88 18.3 29-Apr-11 16.34 18.5 06-Dec-11 16.93 17.3 02-May-12 17.33 16.9
Profile 8: Bobs Bay
Page 43
43
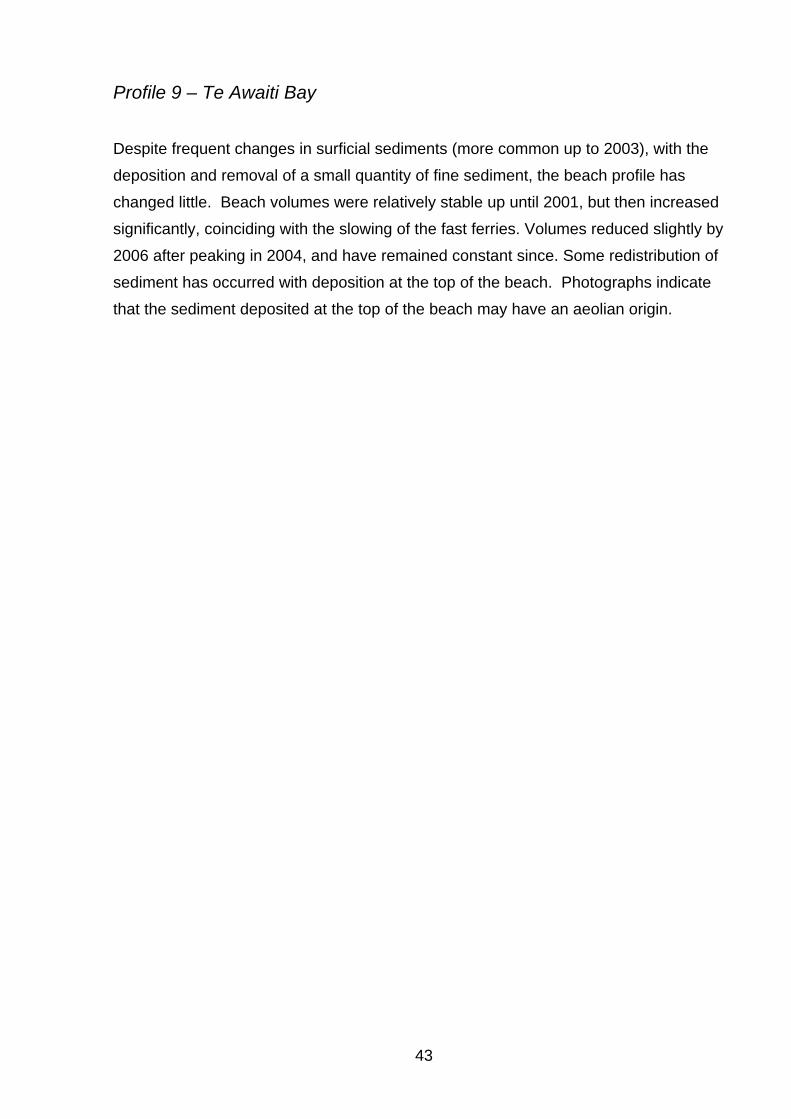
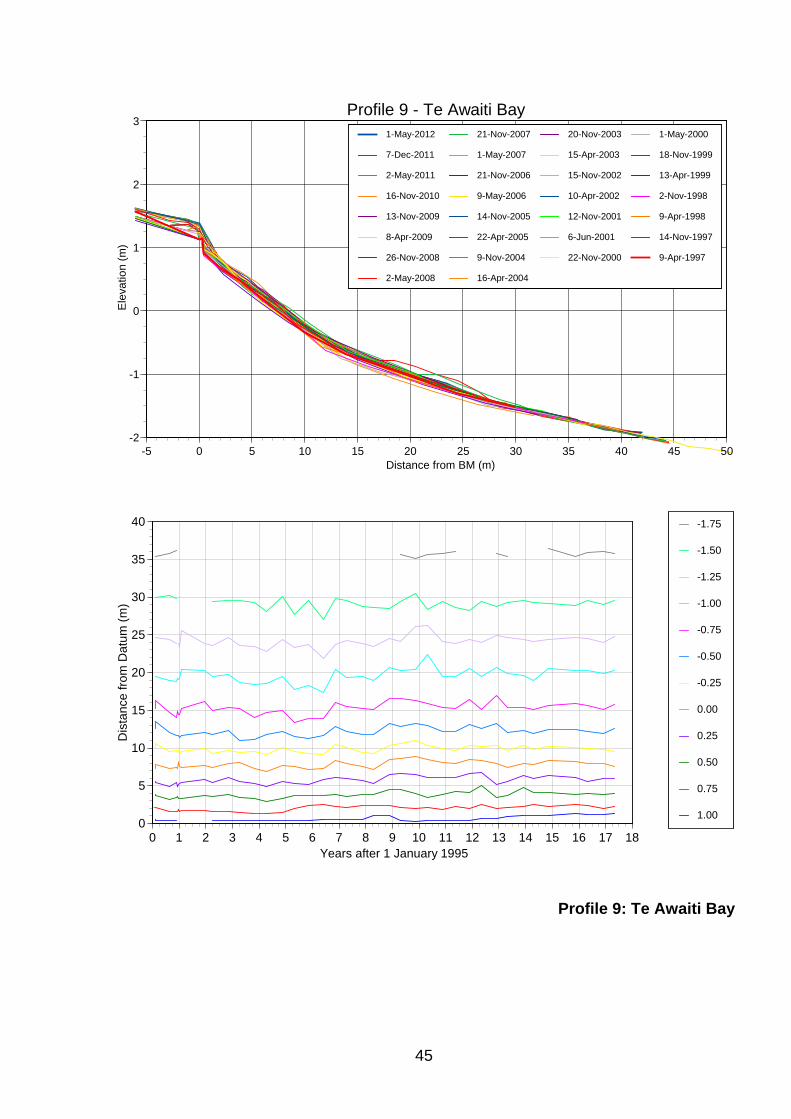
Profile 9 – Te Awaiti Bay
Despite frequent changes in surficial sediments (more common up to 2003), with the
deposition and removal of a small quantity of fine sediment, the beach profile has
changed little. Beach volumes were relatively stable up until 2001, but then increased
significantly, coinciding with the slowing of the fast ferries. Volumes reduced slightly by
2006 after peaking in 2004, and have remained constant since. Some redistribution of
sediment has occurred with deposition at the top of the beach. Photographs indicate
that the sediment deposited at the top of the beach may have an aeolian origin.
Page 44
44
-2
-1
0
1
2
3
-5 0 5 10 15 20 25 30 35 40 45 50
Ele
vatio
n (
m)
Distance from BM (m)
1-May-2012
8-Apr-2009
9-May-2006
10-Apr-2002
18-Nov-1999
9-Apr-1997
Profile 9: Te Awaiti Bay
Page 45
45
-2
-1
0
1
2
3
-5 0 5 10 15 20 25 30 35 40 45 50
Ele
vatio
n (m
)
Distance from BM (m)
1-May-2012
7-Dec-2011
2-May-2011
16-Nov-2010
13-Nov-2009
8-Apr-2009
26-Nov-2008
2-May-2008
21-Nov-2007
1-May-2007
21-Nov-2006
9-May-2006
14-Nov-2005
22-Apr-2005
9-Nov-2004
16-Apr-2004
20-Nov-2003
15-Apr-2003
15-Nov-2002
10-Apr-2002
12-Nov-2001
6-Jun-2001
22-Nov-2000
1-May-2000
18-Nov-1999
13-Apr-1999
2-Nov-1998
9-Apr-1998
14-Nov-1997
9-Apr-1997
Profile 9 - Te Awaiti Bay
0
5
10
15
20
25
30
35
40
0 1 2 3 4 5 6 7 8 9 10 11 12 13 14 15 16 17 18
Dis
tan
ce fr
om
Da
tum
(m
)
Years after 1 January 1995
1.00
0.75
0.50
0.25
0.00
-0.25
-0.50
-0.75
-1.00
-1.25
-1.50
-1.75
Profile 9: Te Awaiti Bay
Page 46
46
25
26
27
28
29
30
31
32
33
34
35
0 1 2 3 4 5 6 7 8 9 10 11 12 13 14 15 16 17 18
Vo
lum
e (
m3
/m)
Years after 1 January 1995
Date Years after 1/1/95 Volume (m3/m) 8-Feb-95 0.10 28.2 17-Feb-95 0.13 28.8 23-Aug-95 0.64 27.1 22-Nov-95 0.89 26.9 7-Dec-95 0.93 27.1 20-Dec-95 0.97 27.1 7-Jan-96 1.02 26.7 9-Feb-96 1.11 28.1 9-Dec-96 1.94 27.9 9-Apr-97 2.27 27.1
14-Nov-97 2.87 28.1 9-Apr-98 3.27 26.9 2-Nov-98 3.84 26.3 13-Apr-99 4.28 25.9 18-Nov-99 4.88 27.7 1-May-00 5.33 26.2 22-Nov-00 5.89 26.7 6-Jun-01 6.43 25.8
12-Nov-01 6.86 28.8 10-Apr-02 7.28 28.1 15-Nov-02 7.88 27.6 15-Apr-03 8.29 27.3 20-Nov-03 8.89 29.7 16-Apr-04 9.29 29.4 9-Nov-04 9.86 30.4 22-Apr-05 10.31 30.2 14-Nov-05 10.87 28.2 9-May-06 11.36 28.2 9-May-06 11.36 28.2 21-Nov-06 11.91 29.4 01-May-07 12.33 29.0 21-Nov-07 12.89 29.1 02-May-08 13.33 28.2 26-Nov-08 13.90 28.9 13-Nov-09 14.87 29.1 16-Nov-10 15.88 29.0 02-May-11 16.34 28.8 07-Dec-11 16.93 28.1 01-May-12 17.33 28.8
Profile 9: Te Awaiti Bay
Page 47
47
Profile 10 – Tipi Bay
There has been some retreat of the upper beach scarp (approximately 1m) and a
corresponding increase in the level of the middle to lower beach, but the changes have
generally been minor. Because of the relatively coarse nature of the sediments, the
placement of the survey staff can have significant impact on the apparent appearance
of the profile line. Overall, beach volumes have reduced only a little.
Page 48
48
-2
-1
0
1
2
3
-5 0 5 10 15 20 25 30 35 40 45 50
Ele
vatio
n (
m)
Distance from BM (m)
1-May-2012
8-Apr-2009
9-May-2006
10-Apr-2002
18-Nov-1999
9-Apr-1997
Profile 10: Tipi Bay
Page 49
49
-2
-1
0
1
2
3
-5 0 5 10 15 20 25 30 35 40 45 50
Ele
vatio
n (
m)
Distance from BM (m)
1-May-2012
7-Dec-2011
2-May-2011
16-Nov-2010
13-Nov-2009
8-Apr-2009
26-Nov-2008
2-May-2008
21-Nov-2007
1-May-2007
21-Nov-2006
9-May-2006
14-Nov-2005
22-Apr-2005
9-Nov-2004
16-Apr-2004
20-Nov-2003
15-Apr-2003
15-Nov-2002
10-Apr-2002
12-Nov-2001
15-Jun-2001
22-Nov-2000
1-May-2000
18-Nov-1999
13-Apr-1999
2-Nov-1998
9-Apr-1998
14-Nov-1997
9-Apr-1997
Profile 10 - Tipi Bay
0
5
10
15
20
25
30
0 1 2 3 4 5 6 7 8 9 10 11 12 13 14 15 16 17 18
Dis
tan
ce fr
om
Da
tum
(m
)
Years after 1 January 1995
1.25
1.00
0.75
0.50
0.25
0.00
-0.25
-0.50
-0.75
-1.00
-1.25
-1.50
Profile 10: Tipi Bay
Page 50
50
20
21
22
23
24
25
26
27
28
29
30
0 1 2 3 4 5 6 7 8 9 10 11 12 13 14 15 16 17 18
Vo
lum
e (
m3
/m)
Years after 1 January 1995
Date Years after 1/1/95 Volume (m3/m) 23-Aug-95 0.64 25.6 22-Nov-95 0.89 25.1 8-Dec-95 0.94 25.1 20-Dec-95 0.97 24.6 7-Jan-96 1.02 24.7 9-Feb-96 1.11 25.5 9-Dec-96 1.94 25.5 9-Apr-97 2.27 24.9
14-Nov-97 2.87 25.2 9-Apr-98 3.27 24.4 2-Nov-98 3.84 24.5 13-Apr-99 4.28 24.0 18-Nov-99 4.88 23.7 1-May-00 5.33 24.0 22-Nov-00 5.89 23.7 15-Jun-01 6.46 23.5 12-Nov-01 6.86 24.3 10-Apr-02 7.28 25.0 15-Nov-02 7.88 24.7 15-Apr-03 8.29 24.3 20-Nov-03 8.89 25.1 16-Apr-04 9.29 25.1 9-Nov-04 9.86 25.1 22-Apr-05 10.31 24.4 14-Nov-05 10.87 24.3 9-May-06 11.36 24.4 21-Nov-06 11.91 23.7 01-May-07 12.33 24.3 21-Nov-07 12.89 23.7 02-May-08 13.33 23.6 26-Nov-08 13.90 24.1 08-Apr-09 14.29 24.4 13-Nov-09 14.87 24.5 16-Nov-10 15.88 24.0 02-May-11 16.34 24.4 07-Dec-11 16.93 23.9 01-May-12 17.33 23.8
Profile 10: Tipi Bay
Page 51
51
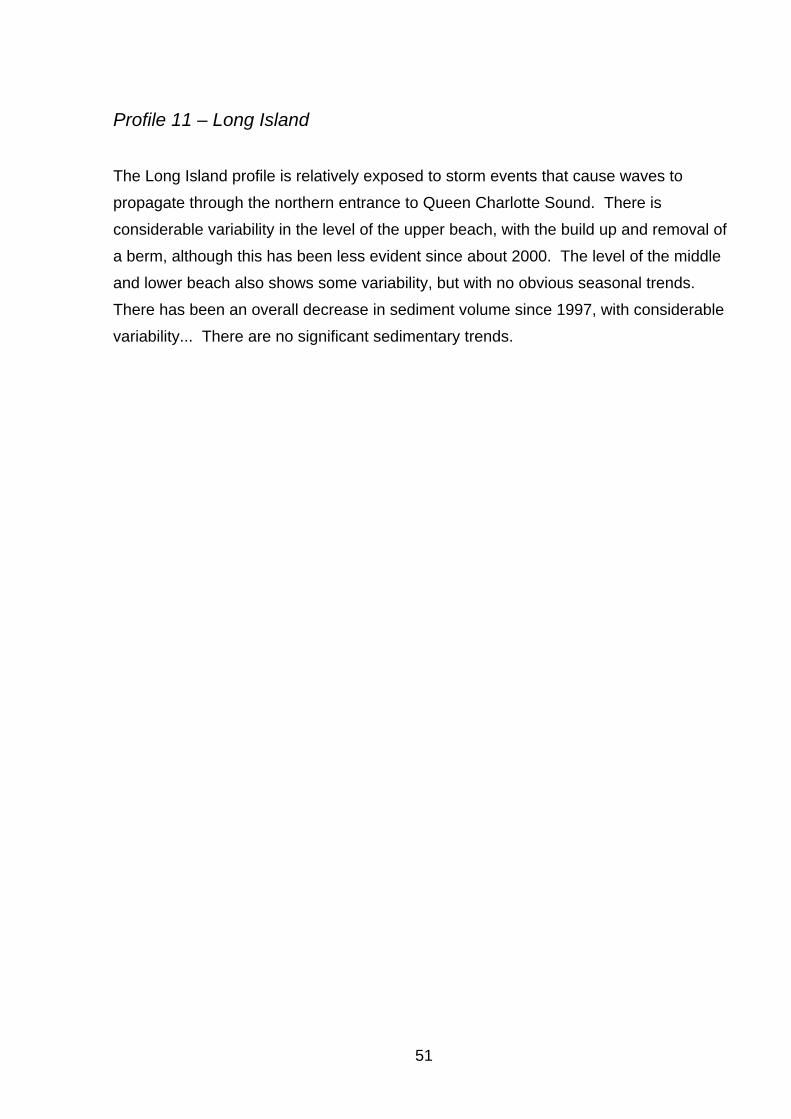
Profile 11 – Long Island
The Long Island profile is relatively exposed to storm events that cause waves to
propagate through the northern entrance to Queen Charlotte Sound. There is
considerable variability in the level of the upper beach, with the build up and removal of
a berm, although this has been less evident since about 2000. The level of the middle
and lower beach also shows some variability, but with no obvious seasonal trends.
There has been an overall decrease in sediment volume since 1997, with considerable
variability... There are no significant sedimentary trends.
Page 52
52
-2
-1
0
1
2
3
-5 0 5 10 15 20 25 30 35 40 45 50
Ele
vatio
n (m
)
Distance from BM (m)
2-May-2012
22-Apr-2009
9-May-2006
9-Apr-2002
19-Nov-1999
10-Apr-1997
Profile 11: Long Island
Page 53
53
-2
-1
0
1
2
3
0 5 10 15 20 25 30 35 40 45 50 55
Ele
vatio
n (m
)
Distance from BM (m)
2-May-2012
6-Dec-2011
29-Apr-2011
3-Dec-2010
26-Nov-2009
22-Apr-2009
12-Nov-2008
6-May-2008
20-Nov-2007
30-Apr-2007
21-Nov-2006
9-May-2006
14-Nov-2005
22-Apr-2005
7-Dec-2004
16-Apr-2004
19-Nov-2003
14-Apr-2003
18-Nov-2002
9-Apr-2002
26-Nov-2001
15-Jun-2001
9-Nov-2000
13-Apr-2000
19-Nov-1999
14-Apr-1999
2-Nov-1998
8-Apr-1998
26-Nov-1997
10-Apr-1997
Profile 11 - Long Island
0
5
10
15
20
25
30
35
0 1 2 3 4 5 6 7 8 9 10 11 12 13 14 15 16 17 18
Dis
tan
ce fr
om
Da
tum
(m
)
Years after 1 January 1995
2.25
2.00
1.75
1.50
1.25
1.00
0.75
0.50
0.25
0.00
-0.25
-0.50
-0.75
-1.00
Profile 11: Long Island
Page 54
54
35
36
37
38
39
40
41
42
43
44
45
0 1 2 3 4 5 6 7 8 9 10 11 12 13 14 15 16 17 18
Vo
lum
e (
m3
/m)
Years after 1 January 1995
Date Years after 1/1/95 Volume (m3/m)
10-Apr-97 2.28 40.8 26-Nov-97 2.90 41.0 8-Apr-98 3.27 39.7 2-Nov-98 3.84 40.6 14-Apr-99 4.29 40.0 19-Nov-99 4.88 39.1 13-Apr-00 5.28 39.5 9-Nov-00 5.86 38.7 15-Jun-01 6.46 38.8 26-Nov-01 6.90 39.9 9-Apr-02 7.27 39.5
18-Nov-02 7.88 38.3 14-Apr-03 8.29 38.6 19-Nov-03 8.89 38.3 16-Apr-04 9.29 38.3 7-Dec-04 9.86 39.1 22-Apr-05 10.31 38.5 14-Nov-05 10.87 38.2 9-May-06 11.36 38.6 21-Nov-06 11.91 38.9 30-Apr-07 12.33 39.5 20-Nov-07 12.89 37.5 06-May-08 13.33 38.3 12-Nov-08 13.90 37.7 22-Apr-09 14.29 37.3 26-Nov-09 14.87 37.5 03-Dec-10 15.88 37.5 29-Apr-11 16.34 38.1 06-Dec-11 16.93 37.5 02-May-12 17.33 37.7
Profile 11: Long Island
Page 55
55
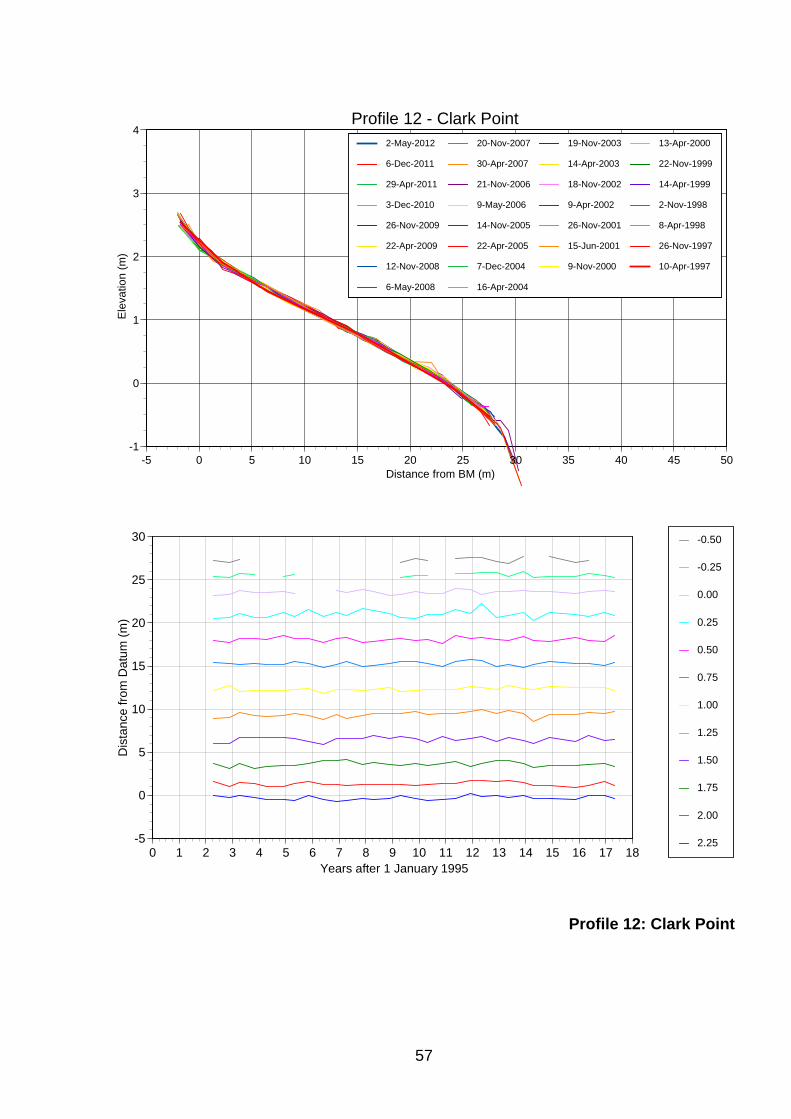
Profile 12 – Clark Point
This profile, with a similar aspect to Profile 11 (Long Island), has shown no significant
change in level, volume or sedimentary characteristics since 1997.
Page 56
56
-2
-1
0
1
2
3
-5 0 5 10 15 20 25 30 35 40 45 50
Ele
vatio
n (m
)
Distance from BM (m)
2-May-2012
22-Apr-2009
9-May-2006
9-Apr-2002
22-Nov-1999
10-Apr-1997
Profile 12: Clark Point
Page 57
57
-1
0
1
2
3
4
-5 0 5 10 15 20 25 30 35 40 45 50
Ele
vatio
n (m
)
Distance from BM (m)
2-May-2012
6-Dec-2011
29-Apr-2011
3-Dec-2010
26-Nov-2009
22-Apr-2009
12-Nov-2008
6-May-2008
20-Nov-2007
30-Apr-2007
21-Nov-2006
9-May-2006
14-Nov-2005
22-Apr-2005
7-Dec-2004
16-Apr-2004
19-Nov-2003
14-Apr-2003
18-Nov-2002
9-Apr-2002
26-Nov-2001
15-Jun-2001
9-Nov-2000
13-Apr-2000
22-Nov-1999
14-Apr-1999
2-Nov-1998
8-Apr-1998
26-Nov-1997
10-Apr-1997
Profile 12 - Clark Point
-5
0
5
10
15
20
25
30
0 1 2 3 4 5 6 7 8 9 10 11 12 13 14 15 16 17 18
Dis
tanc
e fr
om D
atu
m (
m)
Years after 1 January 1995
2.25
2.00
1.75
1.50
1.25
1.00
0.75
0.50
0.25
0.00
-0.25
-0.50
Profile 12: Clark Point
Page 58
58
25
26
27
28
29
30
31
32
33
34
35
0 1 2 3 4 5 6 7 8 9 10 11 12 13 14 15 16 17 18
Vo
lum
e (
m3
/m)
Years after 1 January 1995
Date Years after 1/1/95 Volume (m3/m)
10-Apr-97 2.28 30.5 26-Nov-97 2.90 30.4 8-Apr-98 3.27 31.1 2-Nov-98 3.84 30.7 14-Apr-99 4.29 30.5 22-Nov-99 4.89 30.9 13-Apr-00 5.28 30.9 9-Nov-00 5.86 31.2 15-Jun-01 6.46 30.2 26-Nov-01 6.90 31.1 9-Apr-02 7.27 31.0
18-Nov-02 7.88 30.9 14-Apr-03 8.29 31.0 19-Nov-03 8.89 30.9 16-Apr-04 9.29 30.8 7-Dec-04 9.86 30.5 22-Apr-05 10.31 30.6 14-Nov-05 10.87 30.8 9-May-06 11.36 31.5 21-Nov-06 11.91 31.5 30-Apr-07 12.33 31.7 20-Nov-07 12.89 30.9 06-May-08 13.33 31.4 12-Nov-08 13.90 31.0 22-Apr-09 14.29 30.2 26-Nov-09 14.87 31.0 03-Dec-10 15.88 30.8 29-Apr-11 16.34 30.8 06-Dec-11 16.93 31.1 02-May-12 17.33 31.0
Profile 12: Clark Point
Page 59
59
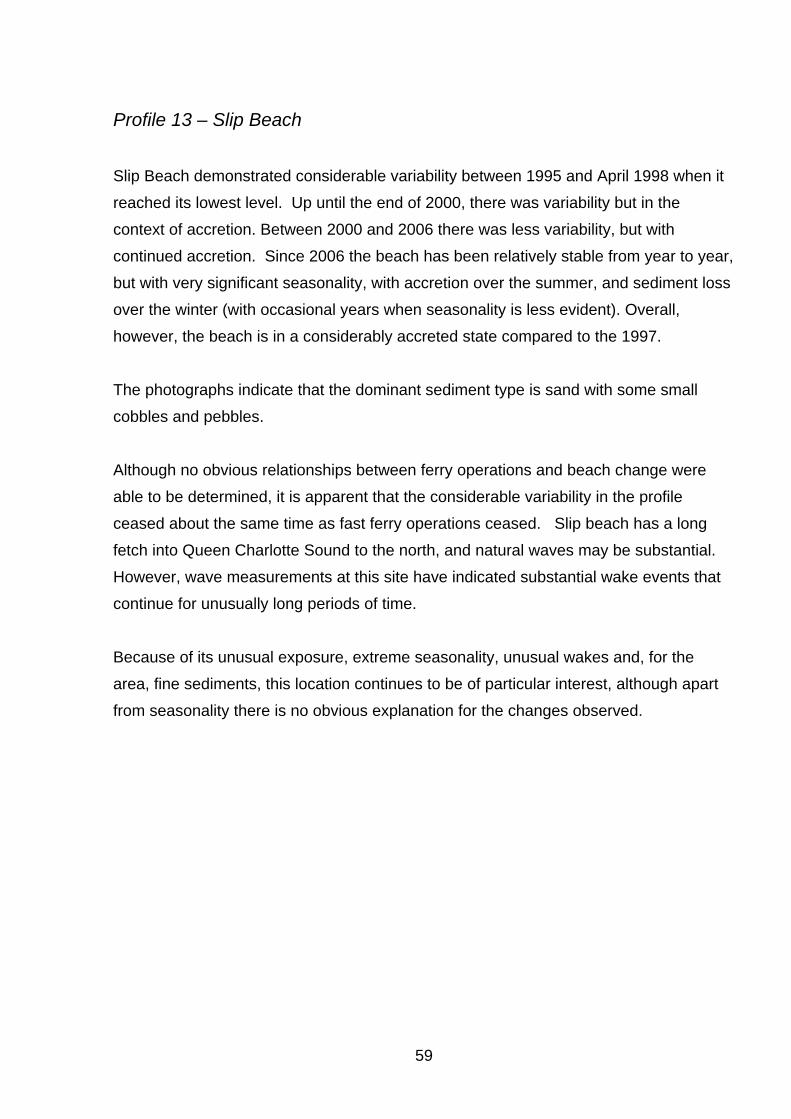
Profile 13 – Slip Beach
Slip Beach demonstrated considerable variability between 1995 and April 1998 when it
reached its lowest level. Up until the end of 2000, there was variability but in the
context of accretion. Between 2000 and 2006 there was less variability, but with
continued accretion. Since 2006 the beach has been relatively stable from year to year,
but with very significant seasonality, with accretion over the summer, and sediment loss
over the winter (with occasional years when seasonality is less evident). Overall,
however, the beach is in a considerably accreted state compared to the 1997.
The photographs indicate that the dominant sediment type is sand with some small
cobbles and pebbles.
Although no obvious relationships between ferry operations and beach change were
able to be determined, it is apparent that the considerable variability in the profile
ceased about the same time as fast ferry operations ceased. Slip beach has a long
fetch into Queen Charlotte Sound to the north, and natural waves may be substantial.
However, wave measurements at this site have indicated substantial wake events that
continue for unusually long periods of time.
Because of its unusual exposure, extreme seasonality, unusual wakes and, for the
area, fine sediments, this location continues to be of particular interest, although apart
from seasonality there is no obvious explanation for the changes observed.
Page 60
60
-2
-1
0
1
2
3
-5 0 5 10 15 20 25 30 35 40 45 50
Ele
vatio
n (
m)
Distance from BM (m)
1-May-2012
8-Apr-2009
10-May-2006
9-Apr-2002
8-Nov-1999
9-Apr-1997
Profile 13: Slip Beach
Page 61
61
-2
-1
0
1
2
3
-5 0 5 10 15 20 25 30 35 40 45 50
Ele
vatio
n (m
)
Distance from BM (m)
1-May-2012
7-Dec-2011
2-May-2011
16-Nov-2010
13-Nov-2009
8-Apr-2009
12-Nov-2008
2-May-2008
20-Nov-2007
1-May-2007
1-Dec-2006
10-May-2006
11-Nov-2005
20-Apr-2005
8-Nov-2004
15-Apr-2004
20-Nov-2003
15-Apr-2003
15-Nov-2002
9-Apr-2002
12-Nov-2001
6-Jun-2001
22-Nov-2000
13-Apr-2000
8-Nov-1999
14-Apr-1999
4-Nov-1998
8-Apr-1998
14-Nov-1997
9-Apr-1997
Profile 13 - Slip Beach
0
5
10
15
20
25
30
35
40
0 1 2 3 4 5 6 7 8 9 10 11 12 13 14 15 16 17 18
Dis
tan
ce fr
om
Da
tum
(m
)
Years after 1 January 1995
1.5
1.25
1.00
0.75
0.50
0.25
0.00
-0.25
-0.50
-0.75
-1.00
-1.25
-1.50
-1.75
-2.00
Profile 13: Slip Beach
Page 62
62
26
28
30
32
34
36
38
40
42
44
46
0 1 2 3 4 5 6 7 8 9 10 11 12 13 14 15 16 17 18
Vo
lum
e (
m3
/m)
Years after 1 January 1995
Date Years after 1/1/95 Volume (m3/m) 17-Feb-95 0.13 30.8 22-Aug-95 0.64 32.3 21-Nov-95 0.89 31.9 7-Dec-95 0.93 31.5 20-Dec-95 0.97 30.9 7-Jan-96 1.02 30.4 9-Feb-96 1.11 32.2 9-Dec-96 1.94 27.5 19-Dec-96 1.97 27.8 13-Jan-97 2.03 29.4 9-Apr-97 2.27 32.3
14-Nov-97 2.87 30.0 8-Apr-98 3.27 29.0 4-Nov-98 3.84 28.7 14-Apr-99 4.29 34.2 8-Nov-99 4.85 31.7 13-Apr-00 5.28 35.3 22-Nov-00 5.89 36.2 6-Jun-01 6.43 37.6
12-Nov-01 6.86 38.1 9-Apr-02 7.27 38.3
15-Nov-02 7.88 35.5 15-Apr-03 8.29 38.8 20-Nov-03 8.89 No data 15-Apr-04 9.29 40.4 8-Nov-04 9.86 36.8 20-Apr-05 10.31 42.0 11-Nov-05 10.87 40.5 10-May-06 11.36 41.0 01-Dec-06 11.91 37.5 01-May-07 12.33 41.6 20-Nov-07 12.89 38.7 02-May-08 13.33 40.1 12-Nov-08 13.90 36.0 08-Apr-09 14.29 40.0 13-Nov-09 14.87 40.9 16-Nov-10 15.88 39.0 02-May-11 16.34 42.2 07-Dec-11 16.93 39.1 01-May-12 17.33 39.9
Profile 13: Slip Beach
Page 63
63
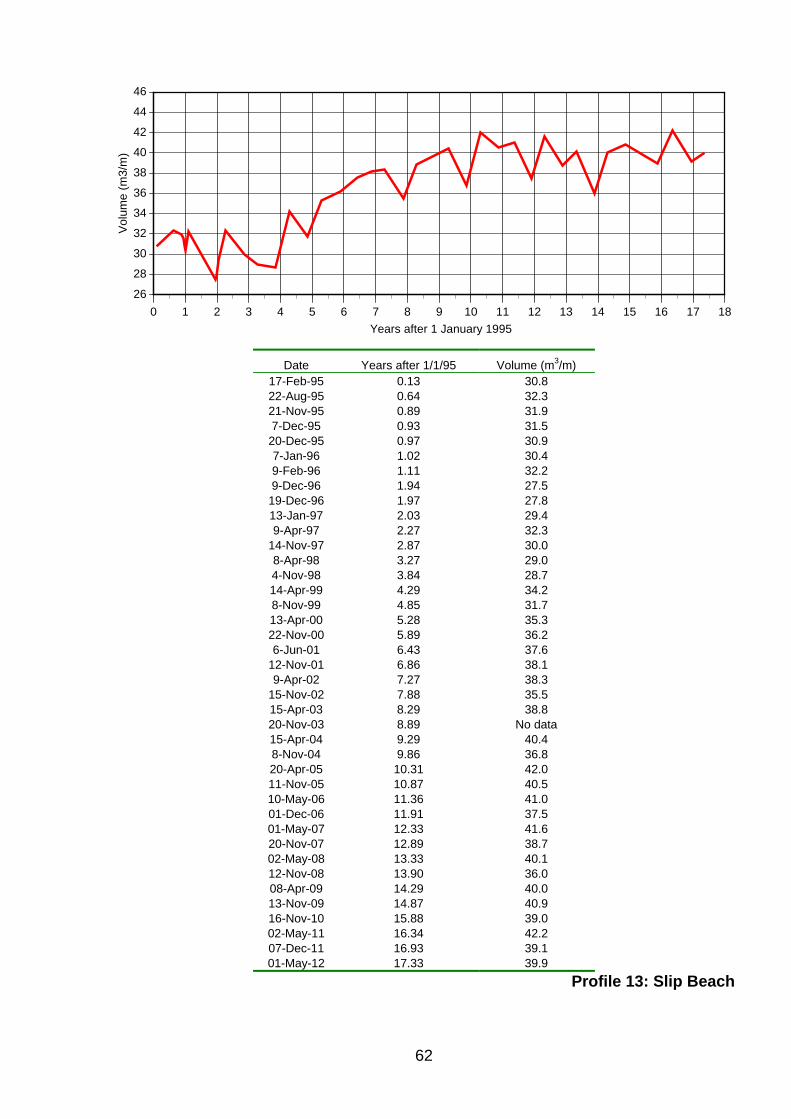
Profile 14 – Ngaionui Point
Given its proximity to the sailing line of vessels in Tory Channel, the beach at Ngaionui
Point probably changed significantly when the fast ferry first started operation, and that
the beach form has generally held since that time. There was a slow trend towards
accretion up until about April 2002, and a trend of erosion since that time (although this
has slowed in the last 3 years), reflecting the return to pre-fast ferry conditions. The
beach is now lower than at the start of surveys. However, it is unknown what its status
is compared to the situation prior to fast ferry operation.
Apparent changes at the very lower beach are probably the result of different survey
placement. There have been no significant changes in sediments.
Page 64
64
-2
-1
0
1
2
3
-5 0 5 10 15 20 25 30 35 40 45 50
Ele
vatio
n (m
)
Distance from BM (m)
1-May-2012
8-Apr-2009
10-May-2006
9-Apr-2002
8-Nov-1999
9-Apr-1997
Profile 14: Ngaionui Point
Page 65
65
-2
-1
0
1
2
3
-5 0 5 10 15 20 25 30 35 40 45 50
Ele
vatio
n (
m)
Distance from BM (m)
1-May-2012
7-Dec-2011
2-May-2011
16-Nov-2010
13-Nov-2009
8-Apr-2009
26-Nov-2008
2-May-2008
21-Nov-2007
1-May-2007
1-Dec-2006
10-May-2006
11-Nov-2005
20-Apr-2005
8-Nov-2004
15-Apr-2004
20-Nov-2003
15-Apr-2003
15-Nov-2002
9-Apr-2002
12-Nov-2001
15-Jun-2001
22-Nov-2000
1-May-2000
8-Nov-1999
14-Apr-1999
4-Nov-1998
9-Apr-1998
14-Nov-1997
9-Apr-1997
Profile 14 - Ngaionui Point
0
5
10
15
20
0 1 2 3 4 5 6 7 8 9 10 11 12 13 14 15 16 17 18
Dis
tan
ce fr
om
Da
tum
(m
)
Years after 1 January 1995
2.00
1.75
1.50
1.25
1.00
0.75
0.50
0.25
0.00
-0.25
-0.50
-0.75
-1.00
Profile 14: Ngaionui Point
Page 66
66
20
21
22
23
24
25
26
27
28
29
30
0 1 2 3 4 5 6 7 8 9 10 11 12 13 14 15 16 17 18
Vo
lum
e (
m3
/m)
Years after 1 January 1995
Date Years after 1/1/95 Volume (m3/m)
9-Apr-97 2.27 25.6 14-Nov-97 2.87 26.5 9-Apr-98 3.27 25.7 4-Nov-98 3.84 25.6 14-Apr-99 4.29 25.7 8-Nov-99 4.85 25.9 1-May-00 5.33 26.2 22-Nov-00 5.89 26.4 15-Jun-01 6.46 26.9 12-Nov-01 6.86 27.0 9-Apr-02 7.27 27.0
15-Nov-02 7.88 26.1 15-Apr-03 8.29 26.6 20-Nov-03 8.89 26.2 15-Apr-04 9.29 26.7 8-Nov-04 9.86 26.0 20-Apr-05 10.31 26.4 11-Nov-05 10.87 25.8 10-May-06 11.36 25.7
01-Dec-06 11.91 26.1 01-May-07 12.33 25.8 21-Nov-07 12.89 24.9 02-May-08 13.33 25.2 26-Nov-08 13.90 24.6 08-Apr-09 14.29 24.1 13-Nov-09 14.87 24.6 16-Nov-10 15.88 24.0 02-May-11 16.34 24.3 07-Dec-11 16.93 23.9 01-May-12 17.33 24.3
Profile 14: Ngaionui Point
Page 67
67
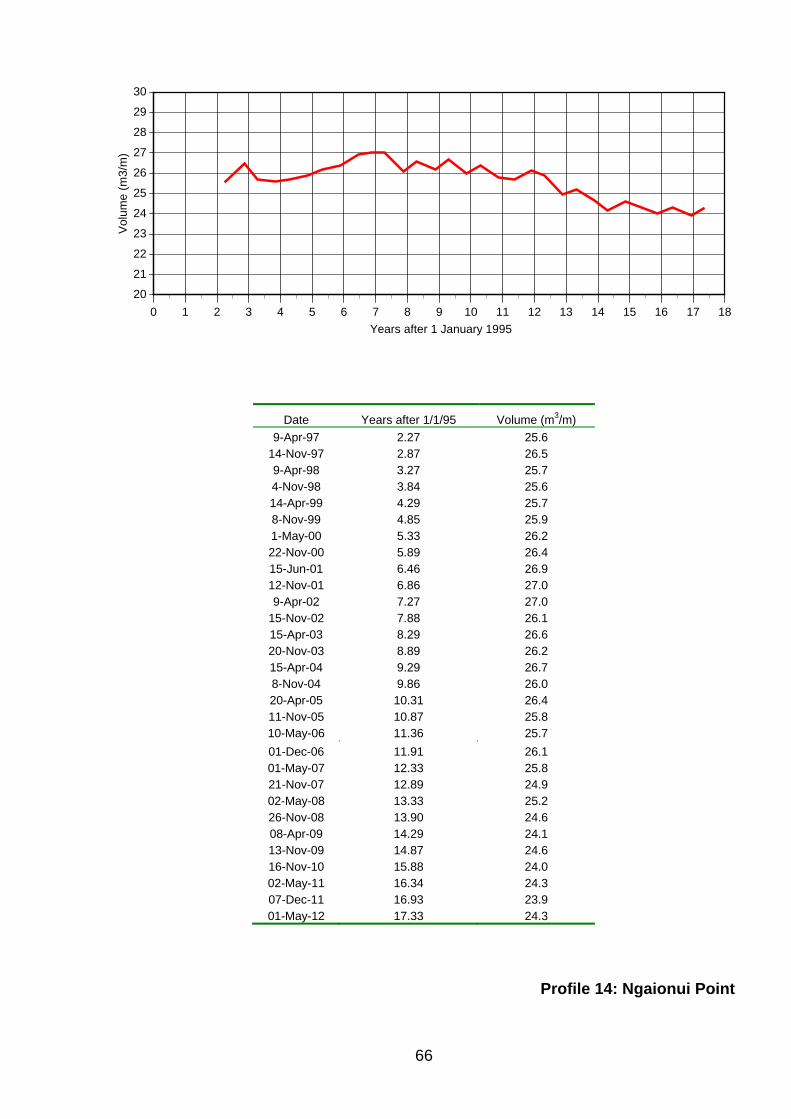
Profile 15 – Te Weka Bay
The Te Weka Bay profile has changed little since surveys began in 1995. The
development of an upper beach berm and the reduction in level of the middle beach
during the period of fast ferry operation is evident (reaching a peak in April 2000). The
berm has remained generally intact, even building a little, since that time. Beach
volumes now equal the 2000 peak.
There have been no significant changes in sediment characteristics.
Page 68
68
-2
-1
0
1
2
3
-5 0 5 10 15 20 25 30 35 40 45 50
Ele
vatio
n (m
)
Distance from BM (m)
1-May-2012
8-Apr-2009
10-May-2006
10-Apr-2002
22-Nov-1999
9-Apr-1997
Profile 15: Te Weka Bay
Page 69
69
-2
-1
0
1
2
3
-5 0 5 10 15 20 25 30 35 40 45 50
Ele
vatio
n (m
)
Distance from BM (m)
1-May-2012
7-Dec-2011
2-May-2011
16-Nov-2010
13-Nov-2009
8-Apr-2009
26-Nov-2008
2-May-2008
21-Nov-2007
1-May-2007
21-Nov-2006
10-May-2006
11-Nov-2005
20-Apr-2005
8-Nov-2004
15-Apr-2004
20-Nov-2003
15-Apr-2003
15-Nov-2002
10-Apr-2002
12-Nov-2001
15-Jun-2001
22-Nov-2000
13-Apr-2000
22-Nov-1999
14-Apr-1999
4-Nov-1998
9-Apr-1998
14-Nov-1997
9-Apr-1997
Profile 15 - Te Weka Bay
0
5
10
15
20
25
30
0 1 2 3 4 5 6 7 8 9 10 11 12 13 14 15 16 17 18
Dis
tan
ce fr
om
Da
tum
(m
)
Years after 1 January 1995
1.50
1.25
1.00
0.75
0.50
0.25
0.00
-0.25
-0.50
-0.75
-1.00
-1.25
-1.50
-1.75
-2.00
Profile 15: Te Weka Bay
Page 70
70
30
31
32
33
34
35
36
37
38
39
40
0 1 2 3 4 5 6 7 8 9 10 11 12 13 14 15 16 17 18
Vo
lum
e (
m3
/m)
Years after 1 January 1995
Date Years after 1/1/95 Volume (m3/m) 8-Feb-95 0.10 33.3 17-Feb-95 0.13 33.5 22-Aug-95 0.64 32.5 21-Nov-95 0.89 33.0 8-Dec-95 0.94 33.8 20-Dec-95 0.97 33.9 7-Jan-96 1.02 33.7 9-Feb-96 1.11 33.2 9-Dec-96 1.94 34.3 9-Apr-97 2.27 33.0
14-Nov-97 2.87 33.4 9-Apr-98 3.27 33.8 4-Nov-98 3.84 33.2 14-Apr-99 4.29 33.5 22-Nov-99 4.89 33.1 13-Apr-00 5.28 34.7 22-Nov-00 5.89 32.8 15-Jun-01 6.46 33.6 12-Nov-01 6.86 32.2 10-Apr-02 7.28 33.4 15-Nov-02 7.88 32.8 15-Apr-03 8.29 34.6 20-Nov-03 8.89 34.7 15-Apr-04 9.29 33.7 8-Nov-04 9.86 35.3 20-Apr-05 10.31 34.3 11-Nov-05 10.87 34.3 10-May-06 11.36 34.2 21-Nov-06 11.91 34.6 01-May-07 12.33 34.2 21-Nov-07 12.89 33.6 02-May-08 13.33 33.6 26-Nov-08 13.90 33.8 08-Apr-09 14.29 34.1 13-Nov-09 14.87 34.3 16-Nov-10 15.88 34.5 02-May-11 16.34 34.3 07-Dec-11 16.93 34.3 01-May-12 17.33 34.8
Profile 15: Te Weka Bay
Page 71
71
Profile 16 – McMillan’s Bay
Up until November 1999 there had been a gradual accretion of the upper McMillan’s
Bay profile. The accretion was mainly comprised of gravels that were moving along the
beach from the direction of Arrowsmith Point, although there had been some rise in the
middle beach level, due to deposition of sand. Between November 1999 and May 2000
a major increase in the height of the upper beach berm occurred, with a very large
deposit of gravel, again coming from the direction of Arrowsmith Point. This deposit has
remained almost unchanged since that time. The upper to middle beach has continued
to build with the deposition of sand. The lower beach has been relatively stable,
apparent changes probably being the result of minor differences in survey line. The
volume has been stable at the survey maximum over the period 2010-2012.
This profile line is clearly being influenced by longshore transport of gravels from west
to east. It may also be that there is transport of sand either onshore or alongshore. It is
most likely that the mechanism of accretion is the result of ferry generated wake waves.
The rate of accretion dropped markedly about the time the fast ferry operation ceased,
probably the result of a reduced ability of the waves to transport sediment.
McMillan’s Bay is quite unusual in the context of the Tory Channel, being wide and with
a relatively small slope. It has a wide ‘surf’ zone, unlike almost all other shorelines in
the area.
Page 72
72
-2
-1
0
1
2
3
-5 0 5 10 15 20 25 30 35 40 45 50
Ele
vatio
n (m
)
Distance from BM (m)
1-May-2012
8-Apr-2009
10-May-2006
10-Apr-2002
18-Nov-1999
9-Apr-1997
Profile 16: McMillan’s Bay
Page 73
73
-2
-1
0
1
2
3
-5 0 5 10 15 20 25 30 35 40 45 50
Ele
vatio
n (m
)
Distance from BM (m)
1-May-2012
7-Dec-2011
2-May-2011
16-Nov-2010
13-Nov-2009
8-Apr-2009
26-Nov-2008
2-May-2008
21-Nov-2007
1-May-2007
21-Nov-2006
10-May-2006
11-Nov-2005
20-Apr-2005
8-Nov-2004
15-Apr-2004
20-Nov-2003
15-Apr-2003
15-Nov-2002
10-Apr-2002
12-Nov-2001
15-Jun-2001
22-Nov-2000
1-May-2000
18-Nov-1999
14-Apr-1999
4-Nov-1998
9-Apr-1998
14-Nov-1997
9-Apr-1997
Profile 16 - McMillan's Bay
0
10
20
30
40
50
0 1 2 3 4 5 6 7 8 9 10 11 12 13 14 15 16 17 18
Dis
tanc
e fr
om D
atu
m (
m)
Years after 1 January 1995
1.5
1.25
1.00
0.75
0.50
0.25
0.00
-0.25
-0.50
-0.75
-1.00
Profile 16: McMillan’s Bay
Page 74
74
25
26
27
28
29
30
31
32
33
34
35
0 1 2 3 4 5 6 7 8 9 10 11 12 13 14 15 16 17 18
Vo
lum
e (
m3
/m)
Years after 1 January 1995
Date Years after 1/1/95 Volume (m3/m) 22-Aug-95 0.64 25.8 21-Nov-95 0.89 25.4 8-Dec-95 0.94 26.2 21-Dec-95 0.97 25.7 7-Jan-96 1.02 25.3 8-Feb-96 1.10 25.6 9-Dec-96 1.94 27.2 9-Apr-97 2.27 26.1
14-Nov-97 2.87 26.7 9-Apr-98 3.27 25.3 4-Nov-98 3.84 26.4 14-Apr-99 4.29 27.4 18-Nov-99 4.88 27.9 1-May-00 5.33 30.0 22-Nov-00 5.89 29.7 15-Jun-01 6.46 32.4 12-Nov-01 6.86 31.6 10-Apr-02 7.28 32.2 15-Nov-02 7.88 31.6 15-Apr-03 8.29 31.6 20-Nov-03 8.89 32.2 15-Apr-04 9.29 33.0 8-Nov-04 9.86 32.9 20-Apr-05 10.31 32.2 11-Nov-05 10.87 33.2 10-May-06 11.36 32.8 21-Nov-06 11.91 33.4 01-May-07 12.33 33.3 21-Nov-07 12.89 33.2 02-May-08 13.33 33.3 26-Nov-08 13.90 34.3 08-Apr-09 14.29 33.8 13-Nov-09 14.87 33.9 16-Nov-10 15.88 34.4 02-May-11 16.34 34.5 07-Dec-11 16.93 34.2 01-May-12 17.33 34.3
Profile 16: McMillan’s Bay
Page 75
75
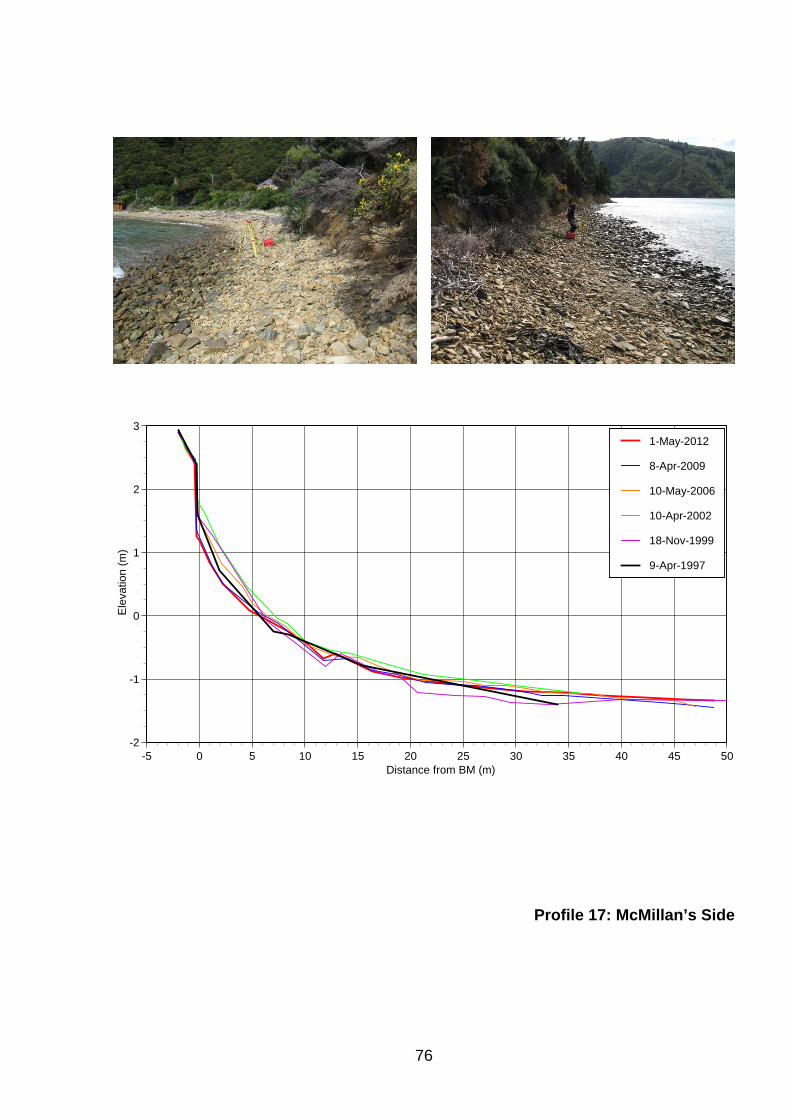
Profile 17 – McMillan’s Side
Between November 1999 and May 2000, at the same time as there was a major
increase in the volume of the berm on Profile 16, there was a very significant deposition
of sediment on the lower profile on Profile 17. Up until this time, the profile had been
generally stable, with some accumulation on the upper beach, and perhaps some minor
adjustments elsewhere on the profile line.
Beach volumes increased until 2001, with most of the accumulation on the lower profile.
Since that time volumes have decreased, with most loss coming from the mid to upper
beach. There is no indication of erosion at the upper beach scarp.
The reason for the major deposition between November 1999 and May 2000, reflected
also on Profile 16, is unknown. However, there must have been a significant increase
in sediment supply, perhaps a slip in the vicinity of Arrowsmith Point. After fast ferry
operation ceased in 2000, there was a change from sediment accumulation to sediment
loss, which continued through to 2009. This occurred at the same time as a change
from sediment accumulation to stability on Profile 16. Since 2009 the profile and
sediment volumes have changed little. Changes in this profile reflect changes in vessel
operations, but there also appears to be a sediment supply control.
Page 76
76
-2
-1
0
1
2
3
-5 0 5 10 15 20 25 30 35 40 45 50
Ele
vatio
n (m
)
Distance from BM (m)
1-May-2012
8-Apr-2009
10-May-2006
10-Apr-2002
18-Nov-1999
9-Apr-1997
Profile 17: McMillan’s Side
Page 77
77
-2
-1
0
1
2
3
-5 0 5 10 15 20 25 30 35 40 45 50
Ele
vatio
n (
m)
Distance from BM (m)
1-May-2012
7-Dec-2011
2-May-2011
16-Nov-2010
13-Nov-2009
8-Apr-2009
26-Nov-2008
2-May-2008
21-Nov-2007
1-May-2007
21-Nov-2006
10-May-2006
11-Nov-2005
20-Apr-2005
8-Nov-2004
15-Apr-2004
20-Nov-2003
15-Apr-2003
15-Nov-2002
10-Apr-2002
12-Nov-2001
15-Jun-2001
22-Nov-2000
1-May-2000
18-Nov-1999
14-Apr-1998
4-Nov-1998
9-Apr-1998
14-Nov-1997
9-Apr-1997
Profile 17 - McMillan's Side
-5
0
5
10
15
20
25
30
35
40
0 1 2 3 4 5 6 7 8 9 10 11 12 13 14 15 16 17 18
Dis
tan
ce fr
om
Da
tum
(m
)
Years after 1 January 1995 2.50
2.25
2.00
1.75
1.50
1.25
1.00
0.75
0.50
0.25
0.00
-0.25
-0.50
-0.75
-1.00
-1.25
Profile 17: McMillan’s Side
Page 78
78
15
16
17
18
19
20
21
22
23
24
25
0 1 2 3 4 5 6 7 8 9 10 11 12 13 14 15 16 17 18
Vo
lum
e (
m3
/m)
Years after 1 January 1995
Date Years after 1/1/95 Volume (m3/m)
9-Apr-97 2.27 17.3 14-Nov-97 2.87 17.8 9-Apr-98 3.27 17.5 4-Nov-98 3.84 18.4 14-Apr-99 4.29 18.7 18-Nov-99 4.88 18.6 1-May-00 5.33 20.0 22-Nov-00 5.89 19.6 15-Jun-01 6.46 21.0 12-Nov-01 6.86 19.6 10-Apr-02 7.28 20.3 15-Nov-02 7.88 18.3 15-Apr-03 8.29 18.8 20-Nov-03 8.89 17.5 15-Apr-04 9.29 18.6 8-Nov-04 9.86 17.5 20-Apr-05 10.31 17.6 11-Nov-05 10.87 17.9 10-May-06 11.36 18.4 21-Nov-06 11.91 17.8 01-May-07 12.33 17.3 21-Nov-07 12.89 16.7 02-May-08 13.33 16.3 26-Nov-08 13.90 16.5 08-Apr-09 14.29 16.2 13-Nov-09 14.87 15.9 16-Nov-10 15.88 15.9 02-May-11 16.34 16.3 07-Dec-11 16.93 16.6 01-May-12 17.33 16.1
Profile 17: McMillan’s Side
Page 79
79
Profile 18 – Dieffenbach West
There has been no significant change in the profile shape or in sediment volume since
1997. The upper beach scarp has retreated by about 50cm. Levels on the lower beach
have increased a little. A thin covering of sand is sometimes present over the coarser
beach sediment.
During 2000 a small cottage was built at the northern end of this beach, and in 2003 a
boatshed was built and a minimal wooden seawall constructed adjacent to the profile
line. The seawall (which has slowly been destroyed) does not appear to be affecting
beach processes, but it is also not providing any protection to the land. It has now
virtually gone.
Page 80
80
-2
-1
0
1
2
3
-5 0 5 10 15 20 25 30 35 40 45 50
Ele
vatio
n (
m)
Distance from BM (m)
1-May-2012
8-Apr-2009
10-May-2006
8-Apr-2002
8-Nov-1999
9-Apr-1997
Profile 18: Dieffenbach West
Page 81
81
-2
-1
0
1
2
3
-5 0 5 10 15 20 25 30 35 40 45 50
Ele
vatio
n (m
)
Distance from BM (m)
1-May-2012
6-Dec-2011
29-Apr-2011
16-Nov-2010
16-Nov-2009
8-Apr-2009
12-Nov-2008
2-May-2008
20-Nov-2007
14-May-2007
20-Nov-2006
10-May-2006
14-Nov-2005
22-Apr-2005
8-Nov-2004
15-Apr-2004
20-Nov-2003
14-Apr-2003
15-Nov-2002
8-Apr-2002
15-Nov-2001
5-Jun-2001
9-Nov-2000
13-Apr-2000
8-Nov-1999
19-Apr-1999
2-Nov-1998
27-Apr-1998
14-Nov-1997
9-Apr-1997
Profile 18 - Dieffenbach West
0
5
10
15
20
25
30
0 1 2 3 4 5 6 7 8 9 10 11 12 13 14 15 16 17 18
Dis
tan
ce fr
om
Da
tum
(m
)
Years after 1 January 1995
2.00
1.75
1.50
1.25
1.00
0.75
0.50
0.25
0.00
-0.25
-0.50
-0.75
-1.00
Profile 18: Dieffenbach West
Page 82
82
20
21
22
23
24
25
26
27
28
29
30
0 1 2 3 4 5 6 7 8 9 10 11 12 13 14 15 16 17 18
Vo
lum
e (
m3
/m)
Years after 1 January 1995
Date Years after 1/1/95 Volume (m3/m) 8-Nov-95 0.85 25.8 21-Nov-95 0.89 25.1 7-Dec-95 0.93 25.0 20-Dec-95 0.97 25.3 19-Jan-96 1.05 25.0 29-Feb-96 1.16 25.1 9-Apr-97 2.27 25.7
14-Nov-97 2.87 25.3 27-Apr-98 3.32 25.4 2-Nov-98 3.84 25.5 19-Apr-99 4.30 25.5 8-Nov-99 4.85 25.4 13-Apr-00 5.28 24.5 9-Nov-00 5.86 25.6 5-Jun-01 6.43 24.7
15-Nov-01 6.87 24.9 8-Apr-02 7.27 24.9
15-Nov-02 7.88 24.6 14-Apr-03 8.29 24.6 20-Nov-03 8.89 24.6 15-Apr-04 9.29 24.5 8-Nov-04 9.86 24.6 22-Apr-05 10.31 25.5 14-Nov-05 10.87 24.3 10-May-06 11.36 24.5 20-Nov-06 11.91 25.2 14-May-07 12.33 24.6 20-Nov-07 12.89 24.1 02-May-08 13.33 25.4 12-Nov-08 13.90 25.4 08-Apr-09 14.29 24.9 16-Nov-09 14.87 24.8 16-Nov-10 15.88 24.5 29-Apr-11 16.34 24.3 06-Dec-11 16.93 24.4 01-May-12 17.33 24.7
Profile 18: Dieffenbach West
Page 83
83
Profile 19 – Curious Monkey
There was slow accretion over the period of fast ferry operation through to the end of
2000, and slow erosion following the end of fast-ferry operations through to 2007.
Since 2007 the beach has been very stable. ,
There have been no notable changes in sediment characteristics.
Page 84
84
-2
-1
0
1
2
3
-5 0 5 10 15 20 25 30 35 40 45 50
Ele
vatio
n (m
)
Distance from BM (m)
1-May-2012
8-Apr-2009
10-May-2006
8-Apr-2002
8-Nov-1999
9-Apr-1997
Profile 19: Curious Monkey
Page 85
85
-2
-1
0
1
2
3
-5 0 5 10 15 20 25 30 35 40 45 50
Ele
vatio
n (
m)
Distance from BM (m)
1-May-2012
6-Dec-2011
29-Apr-2011
16-Nov-2010
16-Nov-2009
8-Apr-2009
12-Nov-2008
2-May-2008
20-Nov-2007
14-May-2007
1-Dec-2006
10-May-2006
14-Nov-2005
20-Apr-2005
8-Nov-2004
15-Apr-2004
20-Nov-2003
14-Apr-2003
15-Nov-2002
8-Apr-2002
15-Nov-2001
5-Jun-2001
9-Nov-2000
13-Apr-2000
8-Nov-1999
19-Apr-1999
2-Nov-1998
27-Apr-1998
26-Nov-1997
9-Apr-1997
Profile 19 - Curious Monkey
0
5
10
15
20
25
30
0 1 2 3 4 5 6 7 8 9 10 11 12 13 14 15 16 17 18
Dis
tan
ce fr
om
Da
tum
(m
)
Years after 1 January 1995
2.00
1.75
1.50
1.25
1.00
0.75
0.50
0.25
0.00
-0.25
-0.50
-0.75
-1.00
-1.25
-1.50
Profile 19: Curious Monkey
Page 86
86
20
21
22
23
24
25
26
27
28
29
30
0 1 2 3 4 5 6 7 8 9 10 11 12 13 14 15 16 17 18
Vo
lum
e (
m3
/m)
Years after 1 January 1995
Date Years after 1/1/95 Volume (m3/m)
8-Nov-95 0.85 23.1 7-Dec-95 0.93 22.8 20-Dec-95 0.97 22.4 19-Jan-96 1.05 23.2 29-Feb-96 1.16 23.0 9-Apr-97 2.27 22.7
26-Nov-97 2.90 23.8 27-Apr-98 3.32 23.7 2-Nov-98 3.84 24.4 19-Apr-99 4.30 24.7 8-Nov-99 4.85 24.8 13-Apr-00 5.28 25.5 9-Nov-00 5.86 25.2 5-Jun-01 6.43 25.0
15-Nov-01 6.87 24.7 8-Apr-02 7.27 24.9
15-Nov-02 7.88 24.0 14-Apr-03 8.29 24.1 20-Nov-03 8.89 24.1 15-Apr-04 9.29 24.1 8-Nov-04 9.86 23.8 20-Apr-05 10.31 23.5 14-Nov-05 10.87 23.4 10-May-06 11.36 23.7 01-Dec-06 11.91 24.1 14-May-07 12.33 23.1 20-Nov-07 12.89 22.6 02-May-08 13.33 23.1 12-Nov-08 13.90 23.1 08-Apr-09 14.29 22.9 16-Nov-09 14.87 22.9 16-Nov-10 15.88 22.6 29-Apr-11 16.34 23.2 06-Dec-11 16.93 22.9 01-May-12 17.33 23.1
Profile 19: Curious Monkey
Page 87
87
Profile 20 – Patten’s Passage
There is considerable variability on the upper and middle beach, but overall stability,
with perhaps an erosion trend in from 2003 to 2009 and an accretion trend since.. Small
berms build and are removed on the upper beach, with no particular seasonal pattern.
Sediments are gravels and sands, and there is frequent banding, but no significant
trends in sediment cover are obvious.
Page 88
88
-2
-1
0
1
2
3
-5 0 5 10 15 20 25 30 35 40 45 50
Ele
vatio
n (
m)
Distance from BM (m)
2-May-2012
22-Apr-2009
9-May-2006
20-May-2002
19-Nov-1999
10-Apr-1997
Profile 20: Patten’s Passage
Page 89
89
-2
-1
0
1
2
3
-5 0 5 10 15 20 25 30 35 40 45 50
Ele
vatio
n (m
)
Distance from BM (m)
2-May-2012
6-Dec-2011
29-Apr-2011
3-Dec-2010
26-Nov-2009
22-Apr-2009
12-Nov-2008
6-May-2008
20-Nov-2007
30-Apr-2007
20-Nov-2006
9-May-2006
14-Nov-2005
22-Apr-2005
7-Dec-2004
16-Apr-2004
19-Nov-2003
14-Apr-2003
18-Nov-2002
20-May-2002
26-Nov-2001
15-Jun-2001
9-Nov-2000
13-Apr-2000
19-Nov-1999
14-Apr-1999
2-Nov-1998
8-Apr-1998
26-Nov-1997
10-Apr-1997
Profile 20 - Patten's Passage
0
5
10
15
20
25
30
0 1 2 3 4 5 6 7 8 9 10 11 12 13 14 15 16 17 18
Dis
tanc
e fr
om D
atu
m (
m)
Years after 1 January 1995
2.25
2.00
1.75
1.50
1.25
1.00
0.75
0.50
0.25
0.00
-0.25
-0.50
-0.75
-1.00
-1.25
Profile 20: Patten’s Passage
Page 90
90
20
21
22
23
24
25
26
27
28
29
30
0 1 2 3 4 5 6 7 8 9 10 11 12 13 14 15 16 17 18
Vo
lum
e (
m3
/m)
Years after 1 January 1995
Date Years after 1/1/95 Volume (m3/m)
10-Apr-97 2.28 24.6 26-Nov-97 2.90 24.6 8-Apr-98 3.27 25.0 2-Nov-98 3.84 25.2 14-Apr-99 4.29 24.2 19-Nov-99 4.88 24.4 13-Apr-00 5.28 24.3 9-Nov-00 5.86 24.5 15-Jun-01 6.46 24.6 26-Nov-01 6.90 24.2 20-May-02 7.39 24.7 18-Nov-02 7.88 24.6 14-Apr-03 8.29 25.1 19-Nov-03 8.89 24.3 16-Apr-04 9.29 24.4 7-Dec-04 9.86 24.3 22-Apr-05 10.31 23.9 14-Nov-05 10.87 23.8 9-May-06 11.36 23.8 20-Nov-06 11.91 24.3 30-Apr-07 12.33 24.7 20-Nov-07 12.89 23.7 06-May-08 13.33 23.5 12-Nov-08 13.90 24.1 22-Apr-09 14.29 23.5 26-Nov-09 14.87 22.8 03-Dec-10 15.88 23.3 29-Apr-11 16.34 23.8 06-Dec-11 16.93 23.6 02-May-12 17.33 23.7
Profile 20: Patten’s Passage
Page 91
91
Profile 21 – Blumine Island
Blumine Island has a similar aspect to the Patten’s Passage profile. Up until 2003
changes were generally minor, with no seasonality shown. Since 2003, there has been
a slow erosion trend, with some seasonality (and perhaps reversing in the last year).
Significant erosion at the beach scarp at the top of the beach was reported by the
surveyors in 2009, and the profile line was extended landward to cope with this. There
does not appear top have been further significant change at the beach scarp.
Page 92
92
-2
-1
0
1
2
3
-5 0 5 10 15 20 25 30 35 40 45 50
Ele
vatio
n (m
)
Distance from BM (m)
2-May-2012
22-Apr-2009
9-May-2006
9-Apr-2002
19-Nov-1999
10-Apr-1997
Profile 21: Blumine Island
Page 93
93
-2
-1
0
1
2
3
4
-5 0 5 10 15 20 25 30 35 40 45 50
Ele
vatio
n (m
)
Distance from BM (m)
2-May-2012
6-Dec-2011
29-Apr-2011
3-Dec-2010
26-Nov-2009
22-Apr-2009
12-Nov-2008
6-May-2008
22-Nov-2007
30-Apr-2007
21-Nov-2006
9-May-2006
14-Nov-2005
22-Apr-2005
7-Dec-2004
16-Apr-2004
19-Nov-2003
14-Apr-2003
18-Nov-2002
9-Apr-2002
26-Nov-2001
5-Jun-2001
9-Nov-2000
13-Apr-2000
19-Nov-1999
14-Apr-1999
2-Nov-1998
8-Apr-1998
26-Nov-1997
10-Apr-1997
Profile 21- Blumine Island
-5
0
5
10
15
20
25
30
0 1 2 3 4 5 6 7 8 9 10 11 12 13 14 15 16 17 18
Dis
tan
ce fr
om
Da
tum
(m
)
Years after 1 January 1995
2.00
1.75
1.50
1.25
1.00
0.75
0.50
0.25
0.00
-0.25
-0.50
-0.75
-1.00
-1.25
-1.50
Profile 21: Blumine Island
Page 94
94
15
16
17
18
19
20
21
22
23
24
25
0 1 2 3 4 5 6 7 8 9 10 11 12 13 14 15 16 17 18
Vo
lum
e (
m3
/m)
Years after 1 January 1995
Date Years after 1/1/95 Volume (m3/m)
7-Dec-95 0.93 22.6 10-Apr-97 2.28 22.8 26-Nov-97 2.90 22.4 8-Apr-98 3.27 22.7 2-Nov-98 3.84 21.8 14-Apr-99 4.29 22.4 19-Nov-99 4.88 22.4 13-Apr-00 5.28 22.5 9-Nov-00 5.86 22.4 5-Jun-01 6.43 22.6
26-Nov-01 6.90 22.5 9-Apr-02 7.27 22.6
18-Nov-02 7.88 21.6 14-Apr-03 8.29 22.7 19-Nov-03 8.89 23.3 16-Apr-04 9.29 22.9 7-Dec-04 9.86 21.9 22-Apr-05 10.31 22.0 14-Nov-05 10.87 21.4 9-May-06 11.36 22.2 21-Nov-06 11.91 21.4 30-Apr-07 12.33 22.1 22-Nov-07 12.89 21.0 06-May-08 13.33 21.3 12-Nov-08 13.90 21.6 22-Apr-09 14.29 20.9 26-Nov-09 14.87 21.2 03-Dec-10 15.88 20.6 29-Apr-11 16.34 21.2 06-Dec-11 16.93 21.9 02-May-12 17.33 21.4
Profile 21: Blumine Island
Page 95
95
5. Summary of beach changes and the effects of vessel wakes
This summary is divided into three sections, comprising those sites that are conceivably
influenced by vessels travelling in Tory Channel and Inner Queen Charlotte Sound (on
the ferry sailing route), those sites in the outer Queen Charlotte Sound, and the Picton
foreshore site, which is possibly influenced by vessels moving within the port area.
a) Picton foreshore
There is no indication that this site is currently affected by vessel operation, with the
beach being relatively stable despite being highly modified. However, I do not have data
on the timing and extent of any renourishment programmes.
b) Sites in outer Queen Charlotte Sound
There are five profiles located at sites in the outer Queen Charlotte Sound: Double Bay,
Long Island, Clark Point, Patten’s Passage and Blumine Island. The sites in outer
Queen Charlotte Sound are not influenced by ferry traffic, although some are on the
sailing line of larger vessels using Shakespeare Bay. All five sites have remained
generally stable over the survey period since April 1997. Long Island has demonstrated
a trend of slow erosion since surveys began, but in recent years this has reduced.
Clark Point has been very stable. Double Bay has had periods of accretion and
erosion, but the current volume is nearly identical to 1997. There has been very minor
erosion at Blumine Island and at Patten’s Passage.
c) Sites in Tory Channel and inner Queen Charlotte Sound
Many of the sites on the ferry route have exhibited change. However, trends or
seasonality consistency between sites is not generally apparent. It is possible to make
tentative links between the changing beach shape and vessel operational regimes at
individual sites. Sites seem to be primarily influenced by local factors, particularly with
respect to sediment supply.
Two sites have demonstrated consistent erosion. Blackmore’s at Waikawa has been
stripped to bedrock, and therefore no further erosion is likely. Bob’s Bay is located on
Page 96
96
the ferry route, but at a position where ferries are likely to be operating relatively
slowly as they arrive in, or leave, Picton. There has been a consistent erosion trend
across the whole profile. The particular circumstances that lead to erosion at this site
are not understood, although the high number of boats of all types passing this point
may be a factor.
Four profiles exhibit no significant change or trend. These are Te Awaiti, Te Weka Bay
and Tipi Bay in Tory Channel, and Dieffenbach West on the inner Queen Charlotte
Sound.
The Curious Monkey site showed a change from minor accretion to minor erosion
coinciding with fast ferry operation ceasing, although overall changes are small, and
there has been very little change since 2007. Ngaionui Point, a site very close to the
vessel travel line, particularly on the Wellington to Picton journey, shows a change from
accretion to erosion in 2002. The erosion trend eased in 2009, perhaps indicating a
return to pre-fast ferry conditions.
The Snout at Picton Point, shows accretion at the top of the profile and significant
erosion at the bottom, and therefore a steepening of the beach profile. Overall, a
significant amount of sediment has been lost. The deep water channel is clearly cutting
into the shoreline at this point. The reason may be related to vessel traffic, or may be
entirely natural.
Ngaionui Bay and Slip Beach show a trend of beach building, although in both cases,
the rate of accumulation has slowed since about 2003 and perhaps reversed since
2009. In the case of Ngaionui Bay, issues of sediment supply and human interventions
complicate the interpretation. Slip Beach demonstrates the most variability of any of the
profiles where there appears to be a distinct seasonal pattern.
McMillan’s Bay and McMillan’s Side, were relatively stable with a small amount of
accretion until an event in 1999/2000 when a large amount of sediment accumulated on
both profiles. Significant rates of accretion continued until the beginning of 2001, after
which time the rate has reduced on the McMillan’s Bay profile and erosion has been
evident on the McMillan’s Side profile (with the rate reducing in recent years). It is
probable that the patterns relate to a mass movement event towards Arrowsmith Point,
Page 97
97
and significant sediment transport capability due primarily to fast ferry operation,
although I have no direct evidence for this.
Moioio Island is an unusual case, being a beach adjacent to a major landslide, and
being towards the back of the island, not directly facing the vessel track. Seasonality
was evident when the fast ferries were operating seasonally. Both profiles show that the
beach is extending into the deep water channel over time (a process that takes a lot of
sediment), and generally accreting. Both profiles reached their maximum accreted
extent in 2006, and have cut back a little since that time (although there has been
accretion on both profiles in the last year). These profiles are almost certainly influenced
by changes in ferry operations, being almost completely sheltered from natural wind
generated waves. However, the sediment supply from the landslide (which may be
affected by vessel wakes) is likely to dominate the beach behaviour.
At the time of the summary report in 2002 it was concluded that with the exception of
Bob’s Bay near Picton, the beaches on the ferry route were accreting (or are stable) as
opposed to eroding, although it was equally clear that local circumstances (particularly
sediment supply) play a very significant role. It is now clear that on some profiles a
change from accretion to relative stability (McMillan’s Bay, Slip Beach, Ngaionui Bay),
or accretion to erosion (Ngaionui Point, McMillan’s Side, Curious Monkey) occurred at
about, or soon after, the time fast ferry operation was restricted to 18 knots in
December 2000. Over the last three years, the erosion has slowed or ceased, perhaps
indicating a return to pre-fast ferry morphologies. Although a definitive conclusion may
never be possible, the results support the understanding that the fast ferry wakes
resulted in rapid sediment buildup at the top of the beach on most beaches along the
ferry route. However, it is now becoming clear that under the current vessel operational
regimes, either stability (with the newly inherited morphology remaining) or a return to
pre fast ferry morphology is occurring or has occurred.
Page 98
98
6. Recommendations
The beach monitoring programme has been underway for over 15 years, and has been
through a range of vessel operation changes, the most significant being the
commencement and subsequent abandonment of fast ferry services. Beach monitoring
requires a long term commitment to provide value. The value of the monitoring
programme comes in understanding how beaches of the region function, both in
response to vessel wakes and in response to natural events.
Although changes caused by the introduction of the fast ferries were never captured
(although it is assumed that they caused rapid accretion particularly on gravel beaches),
it is now possible to conclude that their removal has resulted in a slow reversal of this
trend, and possibly a return, in many cases, to pre-fast ferry conditions.
Profiles in the outer Queen Charlotte Sound, off the ferry route, were established to
provide an element of control, and in response to the possibility of significant boat traffic
using port facilities in Shakespeare Bay, using the northern entrance to Queen
Charlotte Sound. These profiles have been generally stable, and prior to 2009 it was
concluded that that they were likely to remain stable unless driving forces change (such
as a significant change is vessel traffic, or significant sea level change). However, at the
time of the last report in 2009 there was a suggestion that a slow erosion trend may
have been emerging. However, it is now difficult to support this tentative conclusion. If
the monitoring programme were to continue, I suggest continued monitoring but at a
reduced frequency.
Profile 5 (Blackmore’s at Waikawa) was established at the request of Council. This site
demonstrated erosion, but has now been stripped to bedrock for a number of years, but
it is unlikely that the reason for the loss of sand is ever going to be known. As
previously noted, I see no good reason for maintaining this site.
Profile 1 (Picton Foreshore) does not seem to be changing, and certainly not with
respect to vessel traffic. In terms of the purposes of this monitoring programme,
continued monitoring is probably unnecessary, although there may be other reasons to
continue. If this site is continued, provision of other data, such as the dates and
Page 99
99
amounts of maintenance nourishment or other construction or maintenance
activity, are required.
Other sites in Tory Channel and inner Queen Charlotte Sound continue to provide good
data. The possible return to pre fast ferry conditions on some profiles is of significant
interest. The Bob’s Bay profile has been continuously eroding. Erosion may be caused
by all vessel wakes in the high traffic area near Picton (including the many small boats
that pass quite close to the shore at this point), but may be entirely natural. Should
erosion at this site be of particular concern, another profile towards the southern end of
the bay should be established, to determine if the whole beach is eroding or if sediment
is being redistributed within the embayment. In the longer term, some process studies
could be considered.
In summary, the following changes to the monitoring programme could be considered:
1. Reduce the frequency of survey of the profiles in outer Queen Charlotte Sound, and
perhaps inner Queen Charlotte Sound and Tory Channel. The disadvantage of
reducing the frequency is that if profile markers are lost, they will be harder to reinstate
in the future.
2. Abandon the Blackmore’s at Waikawa site.
3. Reconsider the purpose and value of the Picton Foreshore site.
3. Establish a second profile towards the other end of the beach at Bob’s Bay, should
the continued erosion be of particular concern.
4. Establish quality vertical control for profile benchmarks. The survey lines have never
had very good vertical control. The zero datum level used has been established
independently for each profile, sometimes from water level measurements and
assumed tidal curves, and sometimes for consistency with data sets collected by other
groups (such as Kirk and Single). It would be very useful if the profiles were able to be
tied together. RTK-GPS technology is now available to enable this to be done, although
the topography of the area will make the task difficult. Undertaking such a survey would
have the additional benefit of enabling survey lines to be accurately reconstructed
should permanent marks be lost.
I am happy to discuss these recommendations with Council staff.
Page 101
101
Appendix 1
Survey Benchmarks as at April 2012
Levels used in this report are in BOLD
Page 103
103
Pr Name Peg Dist Ayso
n RLKP RL Kirk
RL SL RL Notes
1 Picton Foreshore Seawall 6.87 2.440 Top of wall 1 Picton Foreshore C 0.00 2.550 C" hole in grey stone
2 The Snout at
Picton Point IT -1.00 10.34 3.293
2 The Snout at Picton Point
W 0.00 10.00 2.950
3 Double Bay W -1.50 10.74 2.720 3 Double Bay IT 0.00 10.00 1.980
4 Ngaionui Bay (C
Thomas) W -2.00 10.31 2.680
4 Ngaionui Bay (C Thomas)
IT -2.5 10.02 2.39
5 Blackmore's at
Waikawa Nail 0.00 10.00 1.900 In round post
6 Moioio Island 2 W -2.00 0.33 1.740 Based on Kirk and SL
Difference 6 Moioio Island 2 0IS A 0.00 0.00 1.410 KP Peg
7 Moioio Island 1 W -2.00 10.36 1.70 1.700 7 Moioio Island 1 IT 0.00 10.00 1.34 1.340
8 Bob's Bay W -2.00 11.19 2.96 2.959 8 Bob's Bay IT 0.00 10.00 1.77 1.769
9 Te Awaiti W -6.00 10.87 2.01 2.006 9 Te Awaiti IT 0.00 10.00 1.13 1.133
10 Tipi Bay W -2.50 10.65 2.19 2.188 10 Tipi Bay IT -1.5 10.02 1.56 1.56
11 Long Island W 0.00 10.00 2.840 11 Long Island IT -2.50 9.30 2.140
12 Clark Point IT 0.00 10.00 1.620 12 Clark Point OISA 2.20 9.77 1.393 Biol peg 12 Clark Point W 6.50 Biol peg ???
13 Slip Beach IT -0.55 10.25 1.74 1.740 13 Slip Beach W -0.10 10.51 2.00 2.000
Page 104
104
Pr Name Peg Dist Ayson RL
KP RL
Kirk RL
SL RL Notes
14 Ngaionui Point W -2.00 10.52 2.386 14 Ngaionui Point IT 0.00 10.00 1.870
15 Te Weka Bay IT 0.00 10.00 1.50 1.498
16 McMillan's Bay W -2.00 11.49 2.91 2.908 16 McMillan's Bay IT 0.00 10.00 1.42 1.418
17 McMillan's Side IT -2.00 11.15 2.938 Based on Kirk and SL
Difference 17 McMillan's Side W -1.3 11.48 3.263
18 Dieffenbach West OIS A 0.00 -0.09 2.520 Reestablished after
disturbance 18 Dieffenbach West W -0.2 -0.04 2.570 Reestablished after
disturbance 19 Curious Monkey W -1.00 1.18 3.700 19 Curious Monkey OIS A 0.00 0.00 2.520 KP peg
20 Patten's Passage IT -1.10 10.85 3.488 KP peg 20 Patten's Passage W 0.00 10.00 2.640 KP peg
21 Blumine Island W -0.40 0.45 2.66 KP peg 21 Blumine Island Railway
iron 3.60 0.23 2.440 KP peg
21 Blumine Island IS(new) -5.5 2.60 4.81
Page 105
105
Appendix 2
Profile Photographs
Photographs are taken looking alongshore from
both sides of the profile line, looking back towards
the profile line. The profile line is approximately
20m from the camera, and appears in all
photographs.