Short term decisions and long-term responses of catchment systems Nicholas Howden University of Bristol, UK Tim Burt, Fred Worrall (Durham University, UK) Tim Burt Fred Worrall Thorsten Wagener Valentina Noacco Helen Jarvie
Transcript
Short term decisions and long-term responses of catchment systems
Nicholas Howden University of Bristol, UK
Tim Burt, Fred Worrall (Durham University, UK) Thorsten Wagener, Valentina Noacco (University of Bristol, UK) Helen Jarvie (Centre for Ecology and Hydrology, UK)
Tim Burt Fred Worrall Thorsten Wagener Valentina Noacco Helen Jarvie
Howden NJK, TP Burt, SA Mathias, F Worrall, MJ Whelan [2011] Nitrate pollution in intensively farmed regions: What are the prospects for sustaining high-quality groundwater?, Water Resources Research, 47, W00L02, 10.1029/2011WR010843.
Howden NJK, TP Burt, SA Mathias, F Worrall, MJ Whelan [2011] Modelling long-term diffuse nitrate pollution at the catchment-scale: Data, parameter and epistemic uncertainty, Journal of Hydrology, 403, 337-351, 10.1016/j.jhydrol.2011.04.012.
Howden NJK, TP Burt, F Worrall, SA Mathias, MJ Whelan [2013] Farming for Water Quality: Balancing Food Security and Nitrate Pollution in UK River Basins, Annals of the Association of American Geographers, 103(2), 397-407, http://dx.doi.org/10.1080/00045608.2013.754672.
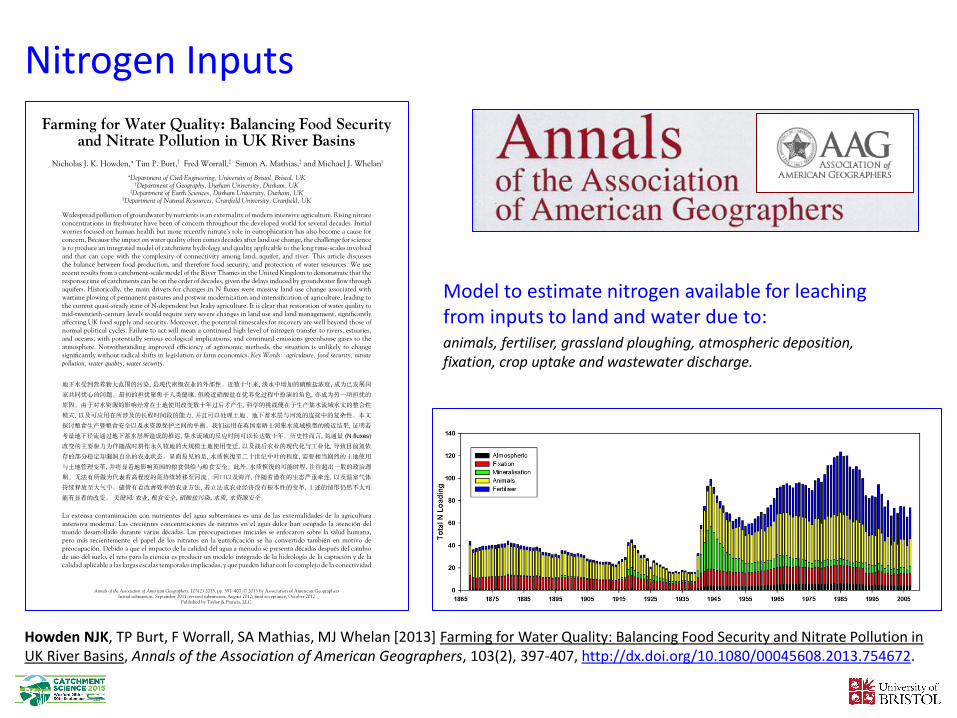
Nitrogen Inputs
Model to estimate nitrogen available for leaching from inputs to land and water due to: animals, fertiliser, grassland ploughing, atmospheric deposition, fixation, crop uptake and wastewater discharge.
Howden NJK, TP Burt, F Worrall, SA Mathias, MJ Whelan [2013] Farming for Water Quality: Balancing Food Security and Nitrate Pollution in UK River Basins, Annals of the Association of American Geographers, 103(2), 397-407, http://dx.doi.org/10.1080/00045608.2013.754672.
Howden NJK, TP Burt, F Worrall, SA Mathias, MJ Whelan [2011] Nitrate pollution in intensively farmed regions: What are the prospects for sustaining high-quality groundwater?, Water Resources Research, 47, W00L02, 10.1029/2011WR010843.
Howden NJK, TP Burt, F Worrall, HP Jarvie [in prep.] Phosphorus concentrations and fluxes in the River Thames catchment 1936 to 2014, Science of the Total Environment (Special Issue on Macronutrient Cycles), 2016.
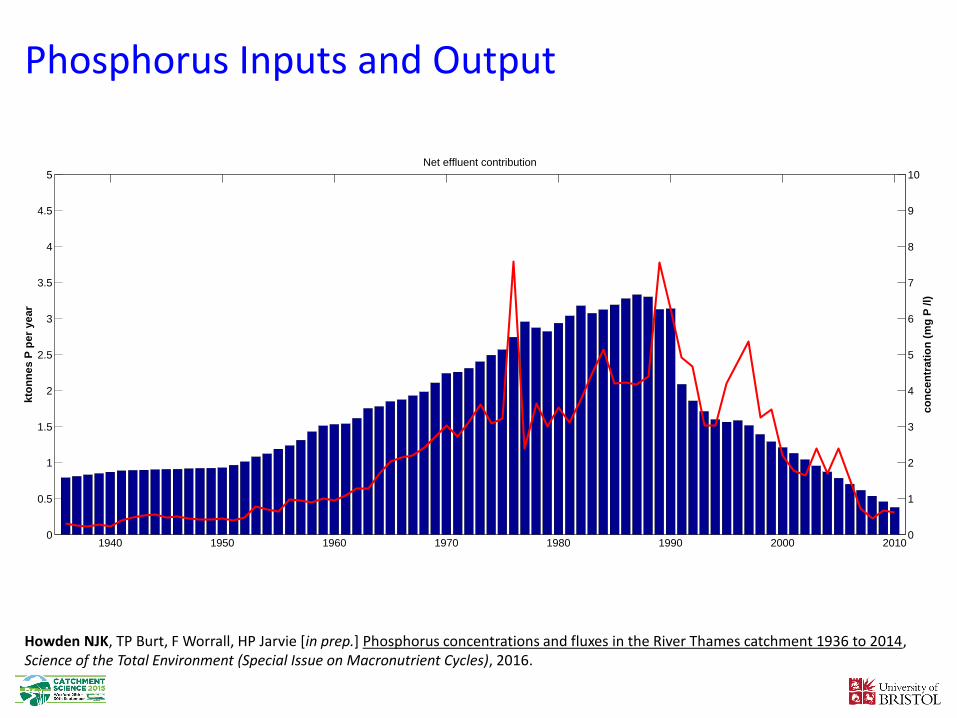
Phosphorus Inputs and Output
Howden NJK, TP Burt, F Worrall, HP Jarvie [in prep.] Phosphorus concentrations and fluxes in the River Thames catchment 1936 to 2014, Science of the Total Environment (Special Issue on Macronutrient Cycles), 2016.
1940 1950 1960 1970 1980 1990 2000 20100
0.5
1
1.5
2
2.5
3
3.5
4
4.5
5
kto
nn
es P
per
ye
ar
Net effluent contribution
0
1
2
3
4
5
6
7
8
9
10
co
nce
ntr
ati
on
(m
g P
/l)
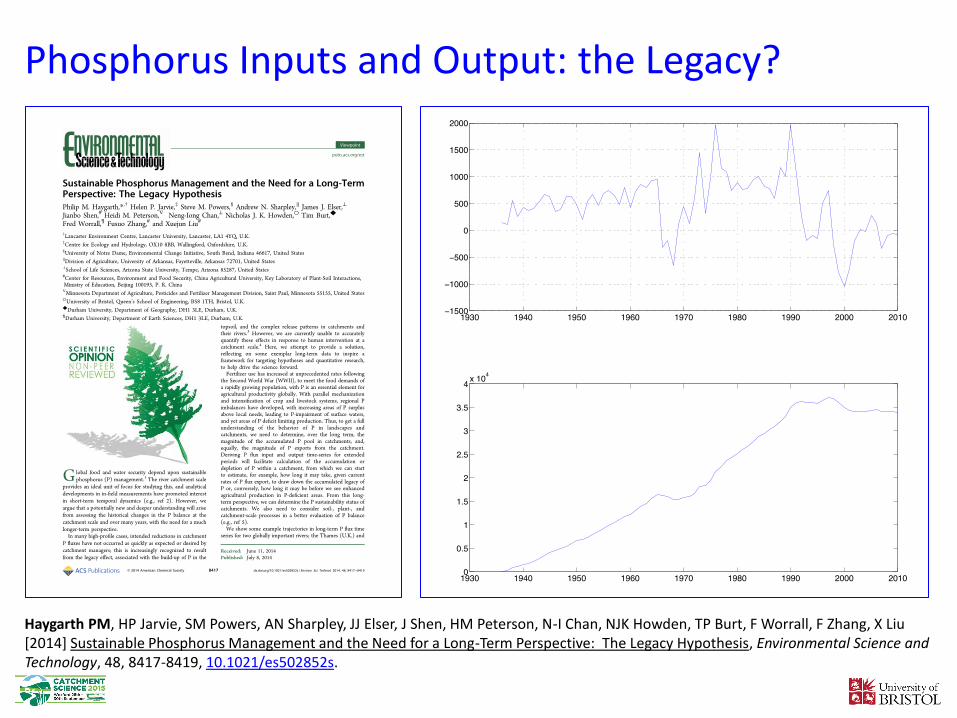
Phosphorus Inputs and Output: the Legacy?
Haygarth PM, HP Jarvie, SM Powers, AN Sharpley, JJ Elser, J Shen, HM Peterson, N-I Chan, NJK Howden, TP Burt, F Worrall, F Zhang, X Liu [2014] Sustainable Phosphorus Management and the Need for a Long-Term Perspective: The Legacy Hypothesis, Environmental Science and Technology, 48, 8417-8419, 10.1021/es502852s.
• Nitrate – animal, fertiliser and ploughing inputs important, and almost 60% of
response controlled by long-term groundwater processes with a lag time of >30 years
– if we reduce inputs by 50% now, the immediate effect would be a 20% reduction in outputs…
• Phosphorus – wastewater inputs have risen steadily and then declined after WWTD,
but there is a large legacy store of P; diffuse inputs to land do not appear to have a fluvial impact?
• Ongoing work: how do these results map to wider scales?
National-Scale Models of N, C and P Export (1 km2)
Worrall et al. [2012] - STOTEN Worrall et al. [2012] -JoH Worrall et al. [in prep]
Worrall F, H Davies, TP Burt, Howden NJK, MJ Whelan, A Bhogal, A Lilly [2012] The flux of dissolved nitrogen from the UK – Evaluating the role of soils and land-use, Science of the Total Environment, 434, 90-100, 10.1016/j.scitotenv.2012.01.035.
Howden NJK, TP Burt, F Worrall, SA Mathias, MJ Whelan [2011] Nitrate pollution in intensively farmed regions: What are the prospects for sustaining high-quality groundwater?, Water Resources Research, 47, W00L02, 10.1029/2011WR010843.


![Plant Perception and Short-Term Responses to Phytophagous ......Molecular Sciences Review Plant Perception and Short-Term Responses to ... plants of an imminent threat [8,9]. Subsequently,](https://static.documents.pub/doc/80x56/5f9d65dc8fe9bf14db3f2aa6/plant-perception-and-short-term-responses-to-phytophagous-molecular-sciences.jpg)
