Page 1
1
Short trips and central places: The home-school
distances in the Flemish primary education system
(Belgium)
Kobe Boussauw*,**, Michiel van Meeteren* and Frank Witlox*
* Geography Department, Ghent University, Krijgslaan 281/S8, B-9000 Gent,
Belgium
Tel.: +32 9 264 45 55 - Fax.: +32 9 264 49 85
E-mail: [email protected] , [email protected] ,
[email protected]
** Civil Engineering Department, Centre for Mobility and Spatial Planning, Ghent
University, Vrijdagmarkt 10/301, B-9000 Gent, Belgium
Tel.: +32 9 331 32 50 - Fax. +32 9 264 54 89
E-mail: [email protected]
Acknowledgements
This paper draws from research conducted within the Policy Research Centre on
Spatial Development, funded by the Flemish Government (Belgium).
Page 2
2
Abstract
This paper examines the extent to which home-school trip length in northern
Belgium is influenced by the spatial distribution of the school sites, and to what
extent this distribution contemporarily functions according to propositions of central
place theory. Furthermore, from a sustainable mobility perspective, it is evaluated if
the primary school network’s density supports a daily urban system based on short
distances. The results indicate that the overall system’s density meets the
requirements of a non-motorized system, while the distribution confirms central
place mechanisms. The majority of the pupils live within walking or cycling distance
from their school, while opportunities exist to further reduce this distance by
choosing an alternative school. However, depending on the structure of the
concerned settlement, school accessibility varies considerably. Finally, the results
suggest that recent increases in school trip length and motorization are mainly caused
by non-spatial factors.
Keywords
school travel
central place theory
spatial proximity
excess commuting
Flanders
Page 3
3
1. Introduction: short trips and central places
A considerable literature describes the relationship between the built environment
and mobility patterns, in which the working hypothesis invariably assumes that a
properly designed spatial structure can steer people’s travel behaviour in a more
sustainable direction (Banister et al., 1997; Stead and Marshall, 2001; Van Acker and
Witlox, 2010). High residential density and thorough spatial mix of housing,
amenities and jobs are usually considered spatial features that lead to less car use and
shorter daily trips. Therefore, a high degree of spatial proximity is associated with a
more sustainable form of daily mobility (Boussauw, 2011, p. 19).
However, the impact of spatial proximity on trips is highly dependent on the type of
destination. The more specialized the trip end is, the greater the distance one is
willing to cover and the less likely one wants to or will be able to exchange it for a
similar destination closer to home (Berry et al., 1988). In Flanders, in the north of
Belgium, for example, the average one-way commuting distance today amounts to 19
km (Janssens et al., 2011), while travel to less specialized destinations such as
schools (primary, secondary and higher education combined: 9.5 km) or shops (3.5
km) is associated with shorter trip lengths.
These findings suggest that local, more or less generically available, services
continue to play an important role in how daily urban systems are structured. The
proximity to daily amenities such as supermarkets, bakeries, nurseries, schools and
cultural and sports facilities, but also green space or transport network access points,
largely determines the attractiveness of a particular residential precinct (Reginster
and Goffette-Nagot, 2005). Additionally, the availability of proximate convenience
amenities such as childcare or primary schools becomes more important as dual
career households engage in ever more complex work-life balance puzzles (Karsten
2007; Van Diepen and Musterd, 2009).
The spatial influence of these daily amenities on travel behaviour is traditionally
gauged through Central Place Theory (CPT), as developed by Christaller
(1933[1966]). CPT provides a framework for an urban subsystem based on the
relation between the specialization of central functions and the spatial reach of these
functions. Central functions have a range consisting of a lower limit, which denotes
Page 4
4
the minimal size of the complementary area for the function to exist, and an upper
limit, which indicates the maximum average distance a consumer wants to travel to
procure a central function (Christaller 1933[1966], p. 22). Christaller (1933[1966], p.
20) took into account that what is considered a central function, as well as their
respective upper and lower limits differ according to spatial and temporal context.
Indeed, as individual transport became cheaper, people became more inclined to
travel to alternative central places, further from their home, in order to have access to
goods, services, or jobs better meeting their individual preferences (Lambooy, 1969).
This observation made Hall (2002) to argue that the three lowest levels in the
hierarchy of Christaller would no longer exist today altogether.
The work of Berry and Garrison (1958) made the applicability of CPT within
expanding conurbations in the form of sub-centres in growing or grown residential
areas around the traditional core city explicit. This approach was gradually
incorporated in transport geography, where the term "polycentricity" was introduced
to argue that sub-centres decrease aggregate car use (Cervero and Wu, 1997).
Subsequently, further cultivation of these sub-centres in terms of urban planning is
regarded a sprawl-curbing urban development strategy (Bontje, 2004). The principle
whereby spatial proximity is organized on the basis of an intra-urban polycentric
structure is illustrated by Bertaud (2004) in his so-called "urban village" model.
Bertaud acknowledges that this builds on the improbable hypothesis that people
prefer the nearest available location to procure their central functions. In practice
agglomerations often contain sub-centres, although consumers do not necessarily
visit these in order to minimize their travel, a vision supported by the research of
Krizek (2003), among others. Structures like the urban village model offer
opportunities to strengthen spatial proximity between a number of services and the
gravity centre of the residential area. For example, the presence of a range of schools
in a suburb of a larger city will increase the likelihood that residents will not send
their children to the city centre. When these facilities are clustered in sub-centres, it
is likely that trips will be organized more efficiently (Cervero and Duncan, 2006). In
the example, picking up the kids from school may be combined with a visit to the
nearby supermarket. In contrast, a strong spatial distribution of facilities, without
Page 5
5
clustering, will also indicate a highly dispersed spatial structure that is associated
with crisscross (car) traffic covering relatively large distances.
2. Research question: The primary school as a neighbourhood
level facility?
Unlike Hall (2002), our research departs from the hypothesis that the low levels of
the urban hierarchy still have relevance as a central place. We propose that the
availability of daily facilities at the neighbourhood level may offer opportunities for
a more sustainable urban and regional structure that facilitates short trips. From a
planning perspective, the presence of a dense network of relatively small amenities
may be considered a quality of place, through which accessibility can be maximized
while avoiding excess (auto) mobility (Müller, 2011). Rather than the concept of the
compact city, which is today perceived as overly naive (Neuman, 2005), the principle
of short distances (in German known as "Stadt der kurzen Wege", and in French as
"La ville des proximités") encompasses that also in suburban and rural areas facilities
should be present within walking or cycling distance.
We test this hypothesis within the Flemish primary school system (for ages 6-12).
Doing so, we consider the primary school as a generic amenity that is indicative of
the centrality of the place where these are located. We can justify this choice on the
basis of Christaller’s definition of a central place of level M, who viewed these as
centres in a catchment area of about 3000 inhabitants. While it would be naive to
believe that the exact specifications of the hierarchical levels observed by Christaller
still exist today, it is striking that an elementary school in Flanders serves on average
2820 inhabitants (Flemish Ministry of Education and Training, 2013), which is very
close to the catchment size of Christaller’s lowest level. Of course, a central place
does not consist of only one single school, and it is outside the empirical scope of
this paper to relate the geography of primary schools to other central functions.
However, in practice we observe that primary schools in Belgium are often part of a
cluster of local amenities, usually within the contours of a former or still existing
village centre or urban sub-centre. Moreover, primary schools are not entirely
generic facilities: in Belgium, parents often make a choice between a Catholic or a
Page 6
6
pluralistic (‘official’, which here means government organized) school where
catholic schools are the majority due to historical reasons (see section 4).
From the general hypothesis that the neighbourhood level still matters, we put
forward two research objectives:
1) To determine the extent to which home-school trip lengths are influenced by the
spatial distribution of the school sites, and to what extent this distribution confirms
the expectations of CPT.
2) To test whether the distribution of schools meets the requirements of a non-
motorized daily urban system based on short distances, across different urban
contexts in northern Belgium.
The composition of the paper is as follows. First, we provide a brief overview of the
spatial structure of the education system in Belgium and Flanders, relating this to the
existing literature on home-school trips and school networks. We continue by
describing the central place structure of northern Belgium with a particular focus on
the contrasting examples of the cities of Bruges and Genk. Then, an empirical
analysis is made of the home-school distances in the study area, both viewed from
the location of the school, and from the place of residence of the pupil. The data are
obtained from a recent centralized dataset that links the addresses of all pupils to the
schools where they are enrolled. Both observed and shortest home-school distances
are calculated using shortest-path analysis (Neutens et al., 2010). Subsequently we
compare observed home-school distances with the shortest possible home-school
distances, which determine the theoretical minimum catchment area when the school
is considered a central function. The ratio between these two statistics is mapped,
after which the hypothetical effect of urbanization on home-school distance is tested.
By comparing the cases of Bruges and Genk, we will gauge how divergent central
place structures of the cities influence the home-school commute of the individual
pupil.
Page 7
7
3. Schools, home-school distances and spatial structure: the
northern Belgian context
3.1. School consolidation and home-school distances
In many western countries, including Germany, the UK, the US, the Netherlands and
Belgium, we observe a period of expansion of the school system, roughly until
halfway the twentieth century, followed by a period of rationalization (De Boer,
2010, p. 1). Maximizing accessibility of education in an era when mobility was
limited was the core idea behind the expansion, which in practice meant the
construction of additional schools making the school net denser in a geographical
sense. Rationalization, which followed expansion, introduced business management
logics in the organization of the education system, combining public service
provision and economies of scale. This resulted in the closure of many smaller
branches. In the post-1945 United States, the number of schools was reduced by no
less than 70%, while the average size of a school quintupled (Ewing and Greene,
2003). In countries where this rationalization was accompanied with a demographic
surge of the school population, negative effects of school consolidation on spatial
proximity and accessibility were largest.
In Belgium, the expansion of the school system continued steadily until
rationalizations in 1957, when an absolute maximum of 9,029 primary schools was
recorded (Leemans, 1998). According to Van Damme (1999), the so-called
educational mini-rationalization in 1975 resulted in a reduction of the number of
primary schools to 5000 within a few years, after which the school stock continued to
shrink to about 4000 in the early nineties. When we link this evolution to
demographic data, and express the figure in number of schools per 1000 children, it
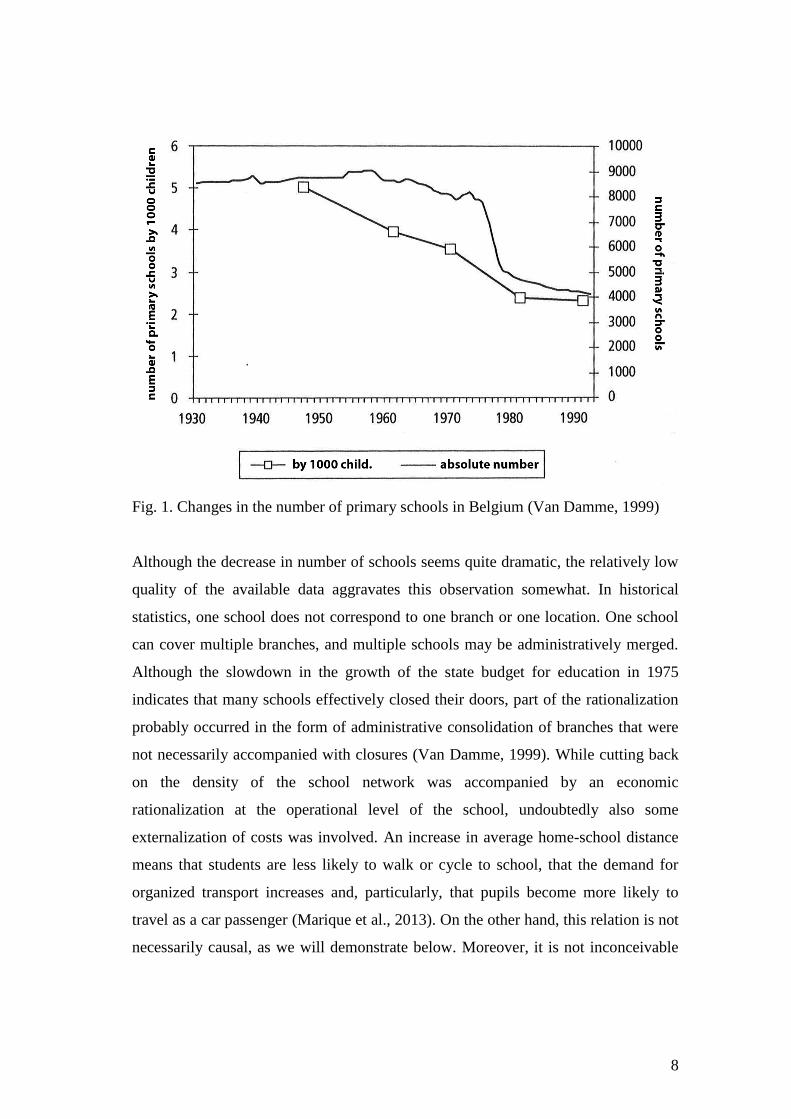
appears that the rationalization in fact started already two decades earlier (Fig. 1).
Page 8
8
Fig. 1. Changes in the number of primary schools in Belgium (Van Damme, 1999)
Although the decrease in number of schools seems quite dramatic, the relatively low
quality of the available data aggravates this observation somewhat. In historical
statistics, one school does not correspond to one branch or one location. One school
can cover multiple branches, and multiple schools may be administratively merged.
Although the slowdown in the growth of the state budget for education in 1975
indicates that many schools effectively closed their doors, part of the rationalization
probably occurred in the form of administrative consolidation of branches that were
not necessarily accompanied with closures (Van Damme, 1999). While cutting back
on the density of the school network was accompanied by an economic
rationalization at the operational level of the school, undoubtedly also some
externalization of costs was involved. An increase in average home-school distance
means that students are less likely to walk or cycle to school, that the demand for
organized transport increases and, particularly, that pupils become more likely to
travel as a car passenger (Marique et al., 2013). On the other hand, this relation is not
necessarily causal, as we will demonstrate below. Moreover, it is not inconceivable
Page 9
9
that school closure in small settlements has contributed to the disappearance of other
amenities, such as retail.
In Flanders, nearly two-thirds of the school sites belong to the Catholic education
network, while less than a third is part of the ‘official’ education system which is
organized by the government. The expansion of the official school network was
driven by the provision of the Belgian Constitution that school choice is free and that
the state is obliged to offer neutral education to everyone (Van Houtte and Stevens,
2009). Although the quality standards and admission terms are equal in both systems,
parents’ preference for one of these two systems often influences the school choice.
Finally, also some specialized education sites exist, including boarding schools.
Since these are very rare, we do not distinguish such schools in our analysis.
Although the choice of school is free, in many places schools face capacity
constraints, obliging them to use waiting lists and deny candidate pupils. This
phenomenon mainly occurs in the larger cities somewhat compromising our analysis.
3.2. The development of the home-school distances in Flanders and Brussels
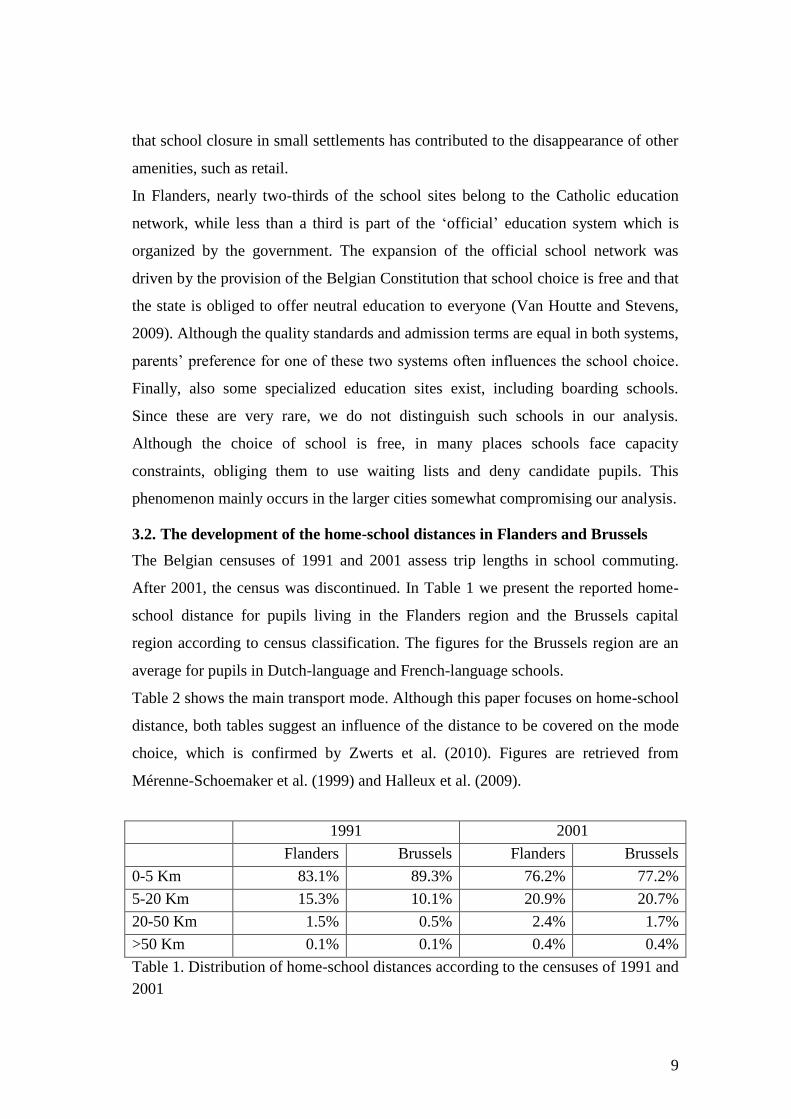
The Belgian censuses of 1991 and 2001 assess trip lengths in school commuting.
After 2001, the census was discontinued. In Table 1 we present the reported home-
school distance for pupils living in the Flanders region and the Brussels capital
region according to census classification. The figures for the Brussels region are an
average for pupils in Dutch-language and French-language schools.
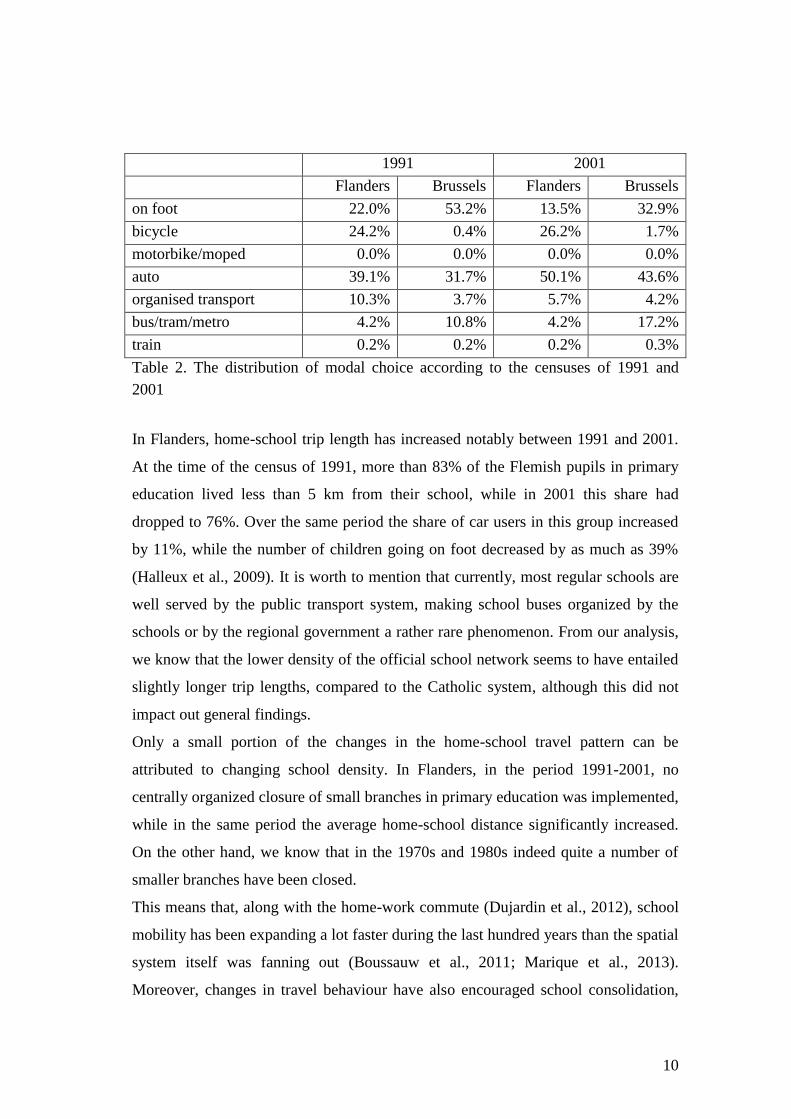
Table 2 shows the main transport mode. Although this paper focuses on home-school
distance, both tables suggest an influence of the distance to be covered on the mode
choice, which is confirmed by Zwerts et al. (2010). Figures are retrieved from
Mérenne-Schoemaker et al. (1999) and Halleux et al. (2009).
1991 2001
Flanders Brussels Flanders Brussels
0-5 Km 83.1% 89.3% 76.2% 77.2%
5-20 Km 15.3% 10.1% 20.9% 20.7%
20-50 Km 1.5% 0.5% 2.4% 1.7%
>50 Km 0.1% 0.1% 0.4% 0.4%
Table 1. Distribution of home-school distances according to the censuses of 1991 and
2001
Page 10
10
1991 2001
Flanders Brussels Flanders Brussels
on foot 22.0% 53.2% 13.5% 32.9%
bicycle 24.2% 0.4% 26.2% 1.7%
motorbike/moped 0.0% 0.0% 0.0% 0.0%
auto 39.1% 31.7% 50.1% 43.6%
organised transport 10.3% 3.7% 5.7% 4.2%
bus/tram/metro 4.2% 10.8% 4.2% 17.2%
train 0.2% 0.2% 0.2% 0.3%
Table 2. The distribution of modal choice according to the censuses of 1991 and
2001
In Flanders, home-school trip length has increased notably between 1991 and 2001.
At the time of the census of 1991, more than 83% of the Flemish pupils in primary
education lived less than 5 km from their school, while in 2001 this share had
dropped to 76%. Over the same period the share of car users in this group increased
by 11%, while the number of children going on foot decreased by as much as 39%
(Halleux et al., 2009). It is worth to mention that currently, most regular schools are
well served by the public transport system, making school buses organized by the
schools or by the regional government a rather rare phenomenon. From our analysis,
we know that the lower density of the official school network seems to have entailed
slightly longer trip lengths, compared to the Catholic system, although this did not
impact out general findings.
Only a small portion of the changes in the home-school travel pattern can be
attributed to changing school density. In Flanders, in the period 1991-2001, no
centrally organized closure of small branches in primary education was implemented,
while in the same period the average home-school distance significantly increased.
On the other hand, we know that in the 1970s and 1980s indeed quite a number of
smaller branches have been closed.
This means that, along with the home-work commute (Dujardin et al., 2012), school
mobility has been expanding a lot faster during the last hundred years than the spatial
system itself was fanning out (Boussauw et al., 2011; Marique et al., 2013).
Moreover, changes in travel behaviour have also encouraged school consolidation,
Page 11
11
and the residential structure too was slowly but surely fanning out in the course of
decades, ending up on average further from traditional town and village centres.
However, possible direct effects of school consolidation on home-school travel are
not documented in Belgium. In the US, Ewing and Greene (2003) suggest that school
consolidation and moving of schools outside urban centres certainly have played a
major role in changing travel behaviour of schoolchildren.
3.3. The central place system in northern Belgium
Optimizing pupil allocations and determining optimal school locations is a classic
subject in applied geography and planning (e.g. Stern and Michlis, 1986). However,
in some systems, in particular the US (Glenn, 1989), students are allocated to a
school rather than that free school choice dominates. When school choice is free, the
principles of lower and upper boundaries of CPT apply, making it a valid application
of CPT. Of course, the contemporary geography of central places is more complex
than Christallers’ stylized models tentatively suggest. There has been a tendency for
central functions to scale-up, creating an urban system with far more
complementarities and overlapping catchment areas than originally envisaged
(Lambooy, 1969; Burger et al., 2013). However, this added complexity is not
incongruent with the basic postulate of the theory. Christaller constructed his theory
around the upper limit of central functions (Saey, 1973), implying that the higher
population density of these overlaps logically entails a potentially higher degree of
specialization of central functions within the complementary area (Christaller,
1966[1933], p. 33). A clustered distribution of a specific central function will give
consumers a higher propensity to choose between different suppliers of a central
function. Despite this upscaling, we still do expect to find variation of the central
place system within Flanders. The historically evolved structure of central place
systems bears the path-dependent traces of urbanization phases (Van Nuffel and
Saey, 2005).
According to Van Nuffel and Saey (2005), the Flemish central place system shows
three distinct patterns. The western part resembles Christaller’s original hexagon
scheme as a result of early urbanization in the medieval era. The central part, the
economically dynamic area from Antwerp to Brussels, confirms broadly to
Page 12
12
Christaller’s traffic principle. The eastern part only started urbanizing in the 19th
century and shows a central place pattern much more strongly attenuated to car
travel. To highlight the relevance of these historical differences and because zooming
in on the municipality scale allows us to visually interpret individual home-school
trajectories, section 5.2 will present two medium-sized cities and their surroundings
as an illustration of the influence of the existing spatial structure on school choice.
The choice of the two cities is based on their different genesis and subsequent spatial
structure, making the two of them together rather representative of a variety of urban
areas in Flanders. The first example is the city of Bruges (in the west), with a strong
historical monocentric structure, which has become in the post-1945 period an
agglomeration of about 170,000 inhabitants. The second example is the eastern city
of Genk, which emerged only in the early twentieth century as the new centre of coal
mining in the province of Limburg, consisting of a dispersed, suburban-style spatial
structure that mainly developed in the post-1945 period. The Genk agglomeration
comprises over 100,000 residents. Southwest of Genk, there is a second medium-
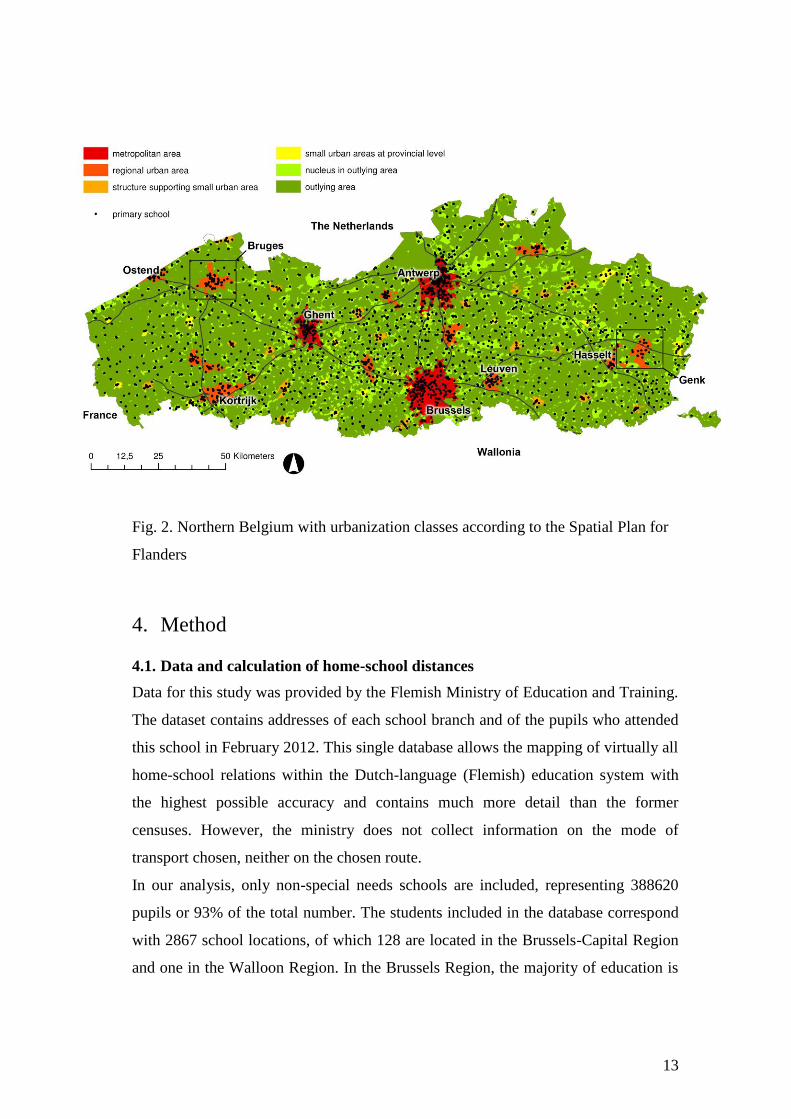
sized city, Hasselt. The region east of Genk is mainly a forest area. Fig. 2 shows the
northern Belgian urban system and highlights the two examples. The urbanization
classes proposed in the map stem from the Spatial Plan for Flanders (RSV,
1997/2004), and are ordered from most to least urbanized: metropolitan area (MA),
regional urban area (RUA), structure supporting small urban area (SSUA), small
urban area at the provincial level (PSUA), nucleus in the outlying area (NOA) and
outlying area (OA).
Page 13
13
Fig. 2. Northern Belgium with urbanization classes according to the Spatial Plan for
Flanders
4. Method
4.1. Data and calculation of home-school distances
Data for this study was provided by the Flemish Ministry of Education and Training.
The dataset contains addresses of each school branch and of the pupils who attended
this school in February 2012. This single database allows the mapping of virtually all
home-school relations within the Dutch-language (Flemish) education system with
the highest possible accuracy and contains much more detail than the former
censuses. However, the ministry does not collect information on the mode of
transport chosen, neither on the chosen route.
In our analysis, only non-special needs schools are included, representing 388620
pupils or 93% of the total number. The students included in the database correspond
with 2867 school locations, of which 128 are located in the Brussels-Capital Region
and one in the Walloon Region. In the Brussels Region, the majority of education is
Page 14
14
provided by French-language schools. Since we have only been able to include
Dutch-language schools, the analysis will be less relevant to the situation in Brussels.
In order to simulate the home-school trajectories and distances from the linked
addresses, the school addresses and the corresponding pupils were geocoded using an
automated search of the Google Maps directory. In this context, it is important to
mention that the home address registered in the database does not always match the
address from where the child leaves for school on regular weekdays. For example,
children of divorced parents may in reality live at different addresses, children can be
registered at the address of the family’s retreat residence, while some others are at
boarding school or live with their grandparents during the week. On the other hand,
there are also pupils who indeed travel large distances to school every day, especially
when they ride with one of their parents to a school in the vicinity of the parent’s
work location. Such details are not documented in the dataset used. We have limited
the impact of such biases as much as possible through the use of a judiciously chosen
threshold of 40 kilometres. Pupils with a home address located further from the
visited school are considered outliers and were omitted from the analysis. Moreover,
those results from the geocoding process that were qualified by the software as less
accurate, or where obvious errors were found, were omitted. This concerns 2.7% of
the pupils and 1.0% of the schools. The remaining analysis relates to 374061 pupils,
corresponding to 2837 school branches. Although past experiences teach us that even
after such a meticulous correction erroneous geocoding remains inevitable, the large
size of the dataset did not allow for manually correction of all suspected geocoding
errors.
In order to calculate distances, the coordinates of residential and school locations
were introduced in a GIS environment and linked to the road network (TeleAtlas'
Streetnet). The applied network data also included the lowest category of roads,
which are often local roads that are not suitable for through traffic but may be of
importance for pedestrians and cyclists.
Using Network Analyst software (within an ArcGIS environment), for each student
two home-school routes and corresponding distances were calculated. The first route
is the result of a shortest-path calculation (Dijkstra algorithm) between the address of
the pupil and the address of the school visited by this pupil, through the road
Page 15
15
network. In what follows, we denote the resulting figure as the "observed home-
school distance". The second route is a fictitious minimum home-school route, where
each student is assigned to the primary school closest to home. This minimum home-
school route stems from the excess commuting literature (Horner, 2002), in which a
comparison is made between the minimum distance that must be covered to reach a
facility, and the distance that is covered in reality in order to visit a similar but
alternative amenity (Boussauw et al., 2012). When calculating the resultant
"minimum home-school distance", actual school capacity is not accounted for since
in this theoretical exercise it is assumed that capacity follows demand.
4.2. Analysis of the home-school distances
The spatial analysis draws from the observed home-school distance and the
minimum home-school distance. These variables are considered both from the
perspective of the individual pupil and from the perspective of the school. From the
school’s point of view, apart from the average home-school distance also the median
is calculated, which is more representative given the skewed distribution of the
distances.
First, the exploration of the spatial distribution of the home-school distances is
conducted in a cartographic and a quantitative way. In addition to a regional mapping
approach by means of which the school sites are visualized, we zoom in to the
contexts of Bruges and Genk where we will compare the shape and size of the
school’s catchment areas. This second mapping approach is used to visualize the
home addresses of individual pupils in relation to the clustered central place context
of Bruges and the relatively dispersed one of Genk. Subsequently, the data are
grouped and compared according to the classes of urbanization as used in the Spatial
Plan for Flanders (RSV, 1997/2004), as illustrated in Fig. 2. Based on this,
conclusions are drawn regarding the two research objectives.
Page 16
16
5. Spatial distribution of home-school distances
5.1. The perspective of the schools' locations
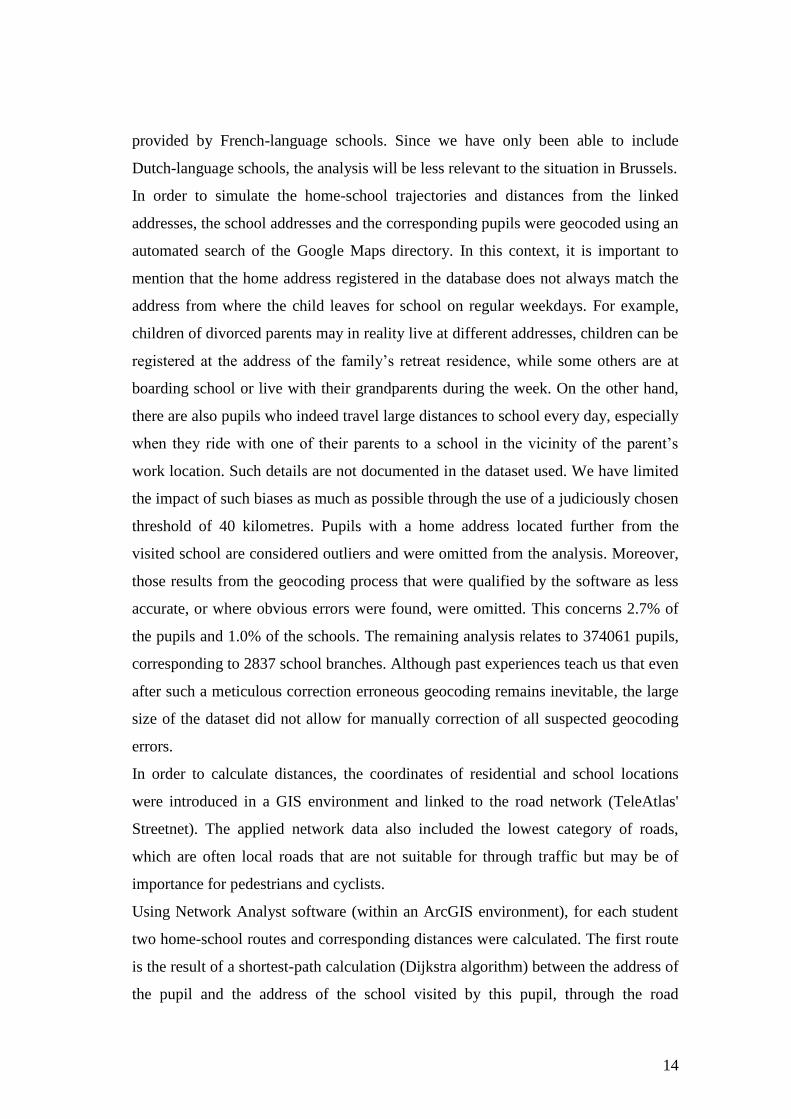
Fig. 3 gives an overview of the involved schools, classified according to the median
observed home-school distance. Fig. 4 shows the median minimum home-school
distance, while Fig. 5 displays the ratio between the first-mentioned and the second
variable, the so-called excess rate. Apart from the location of the schools, these maps
also contain the municipal boundaries and major motorways, as a reference. The
maps use quantile classification, reflecting the diversity of the data as well as
possible. It is important to note that the minimum home-school distance and the
excess rate are much more abstract concepts than the observed home-school distance,
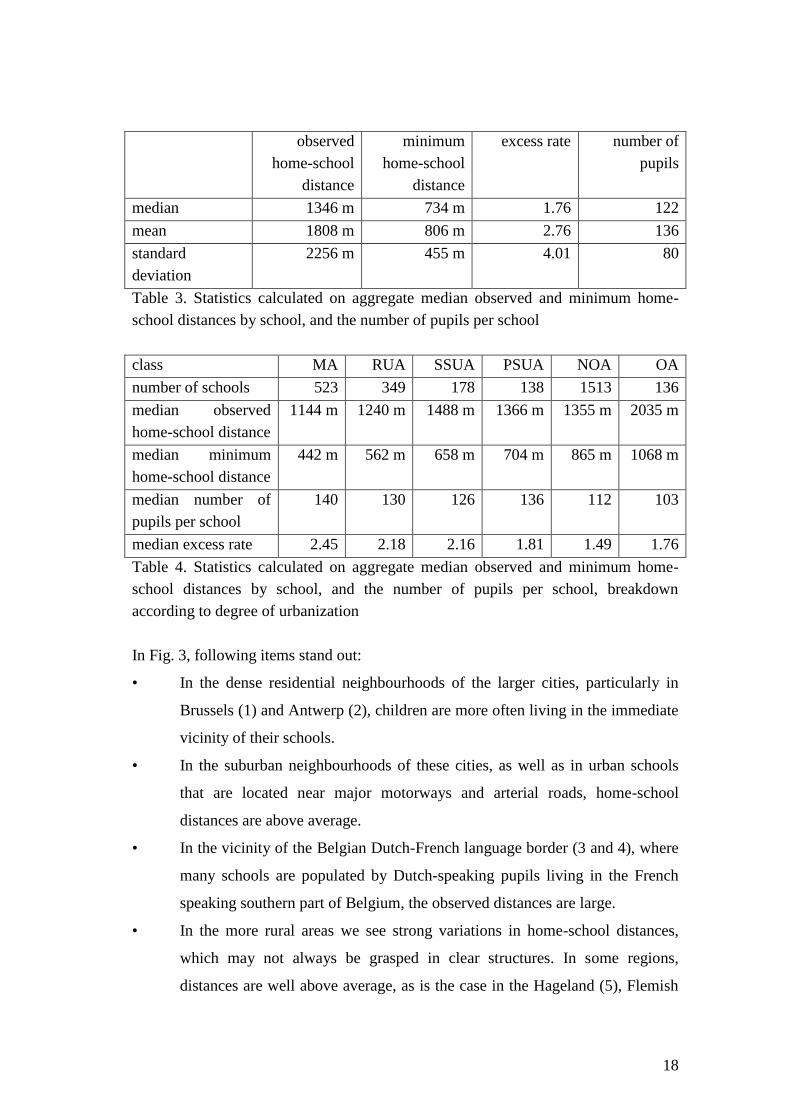
which justifies the use of different class thresholds. In Table 3, a number of key
figures are given for the three mapped variables. Table 4 provides a breakdown of
the same statistics according to degree of urbanization.
Fig. 3. Median observed home-school distance by school
Page 17
17
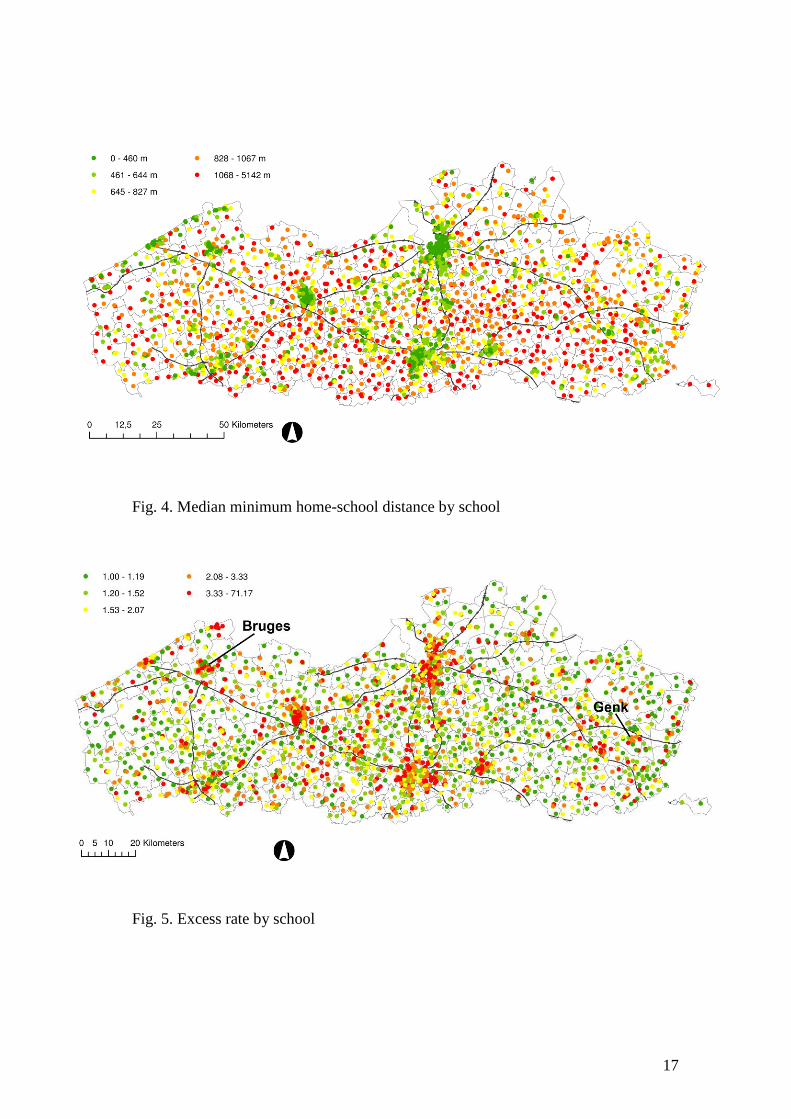
Fig. 4. Median minimum home-school distance by school
Fig. 5. Excess rate by school
Page 18
18
observed
home-school
distance
minimum
home-school
distance
excess rate number of
pupils
median 1346 m 734 m 1.76 122
mean 1808 m 806 m 2.76 136
standard
deviation
2256 m 455 m 4.01 80
Table 3. Statistics calculated on aggregate median observed and minimum home-
school distances by school, and the number of pupils per school
class MA RUA SSUA PSUA NOA OA
number of schools 523 349 178 138 1513 136
median observed
home-school distance
1144 m 1240 m 1488 m 1366 m 1355 m 2035 m
median minimum
home-school distance
442 m 562 m 658 m 704 m 865 m 1068 m
median number of
pupils per school
140 130 126 136 112 103
median excess rate 2.45 2.18 2.16 1.81 1.49 1.76
Table 4. Statistics calculated on aggregate median observed and minimum home-
school distances by school, and the number of pupils per school, breakdown
according to degree of urbanization
In Fig. 3, following items stand out:
• In the dense residential neighbourhoods of the larger cities, particularly in
Brussels (1) and Antwerp (2), children are more often living in the immediate
vicinity of their schools.
• In the suburban neighbourhoods of these cities, as well as in urban schools
that are located near major motorways and arterial roads, home-school
distances are above average.
• In the vicinity of the Belgian Dutch-French language border (3 and 4), where
many schools are populated by Dutch-speaking pupils living in the French
speaking southern part of Belgium, the observed distances are large.
• In the more rural areas we see strong variations in home-school distances,
which may not always be grasped in clear structures. In some regions,
distances are well above average, as is the case in the Hageland (5), Flemish
Page 19
19
Ardennes (6) and Meetjesland (7). In other regions, average distances are
below average, which is obvious in the Leie-region (8), Westhoek (9), the
southeastern part of the Limburg province (10) and parts of the Kempen (11).
Fig. 4 gives a clear picture of the morphological structure, making clear that the
school network’s density is closely related to the population’s distribution. The
following issues arrest attention:
• Both in larger cities and in smaller towns, the school network appears to be
sufficiently dense from the point of view of offering children the opportunity
to visit a school within walking distance.
• In the more rural areas, where both housing is more dispersed and the school
network is less dense, pupils have to make longer trips, even if they visit the
nearest school.
Fig. 5 combines both variables into the excess rate, which indicates the extent to
which a school recruits pupils living in the immediate vicinity.
• Mainly in the cities we observe that the schools are usually populated by
children who do not visit the nearest school. The presence of more
opportunities within a short distance, typical of urban areas, allows parents to
be more critical in choosing a particular school. This corroborates both the
excess commuting literature and CPT: more suppliers within the upper limit
of a central function allows for choice and potential specialization. In
addition, capacity constraints also play a role, excluding certain schools from
the choice range. A third reason is that urban schools are more often located
in a destination area for daily commuter flows, meaning that commuting
parents will be inclined to drive their children to a school near their work
place.
• In contrast, in outlying areas schools are more often populated by children
visiting the nearest or the second nearest school.
From Table 3, we infer that an average school recruits its students within less than
1800 m from the school, but that this distance would be reduced to about 800 m in a
geographically optimized system. Table 4 shows that schools in metropolitan and
regional urban areas recruit their students within relatively short distance. The
Page 20
20
minority of schools that are not located in an urban or village centre recruit their
pupils from much larger distances.
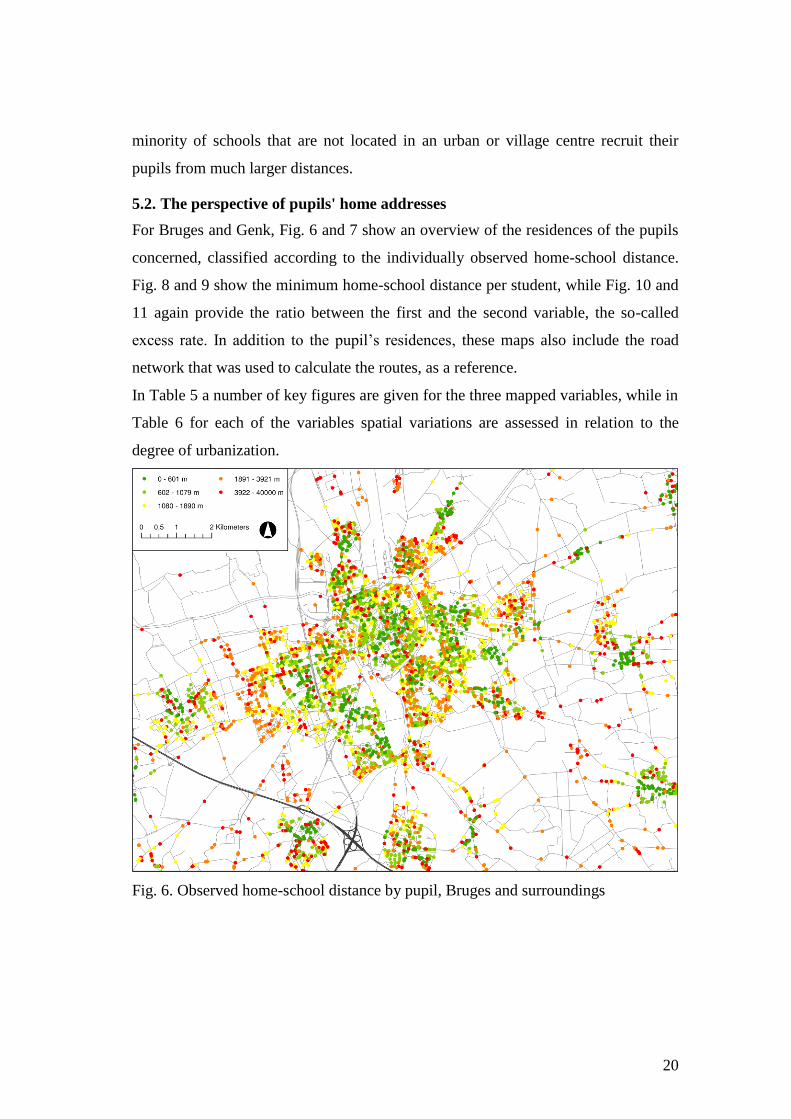
5.2. The perspective of pupils' home addresses
For Bruges and Genk, Fig. 6 and 7 show an overview of the residences of the pupils
concerned, classified according to the individually observed home-school distance.
Fig. 8 and 9 show the minimum home-school distance per student, while Fig. 10 and
11 again provide the ratio between the first and the second variable, the so-called
excess rate. In addition to the pupil’s residences, these maps also include the road
network that was used to calculate the routes, as a reference.
In Table 5 a number of key figures are given for the three mapped variables, while in
Table 6 for each of the variables spatial variations are assessed in relation to the
degree of urbanization.
Fig. 6. Observed home-school distance by pupil, Bruges and surroundings
Page 21
21
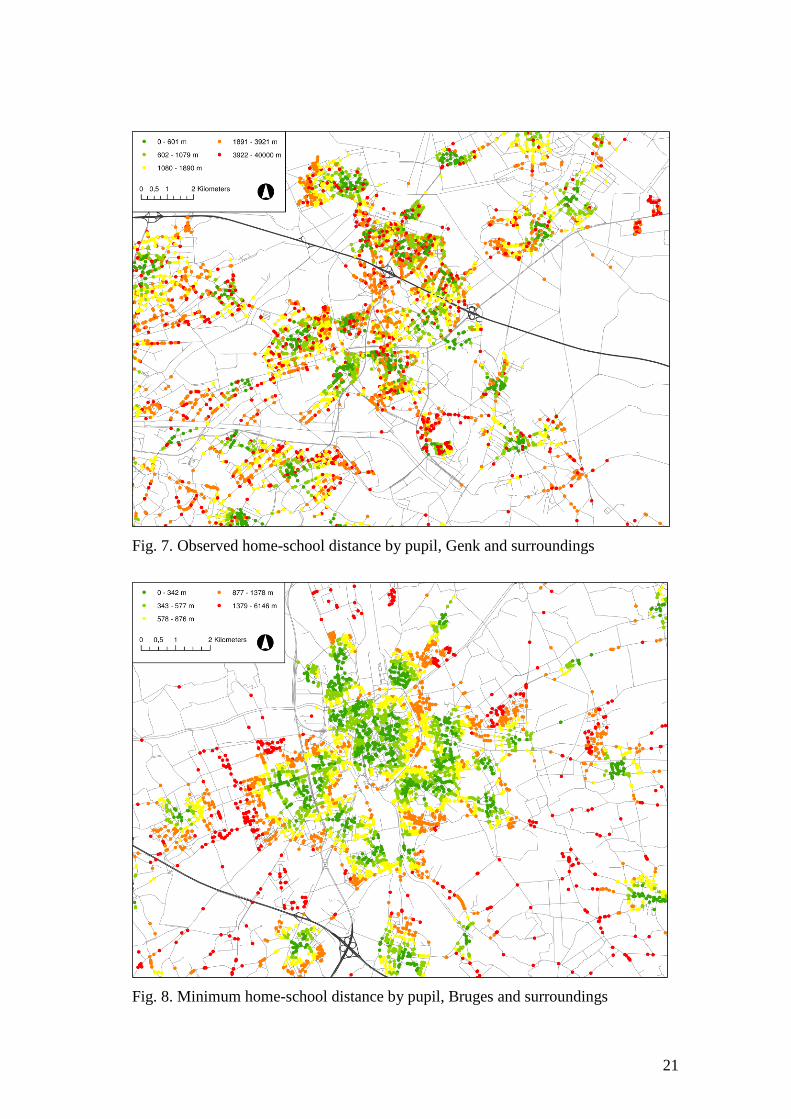
Fig. 7. Observed home-school distance by pupil, Genk and surroundings
Fig. 8. Minimum home-school distance by pupil, Bruges and surroundings
Page 22
22
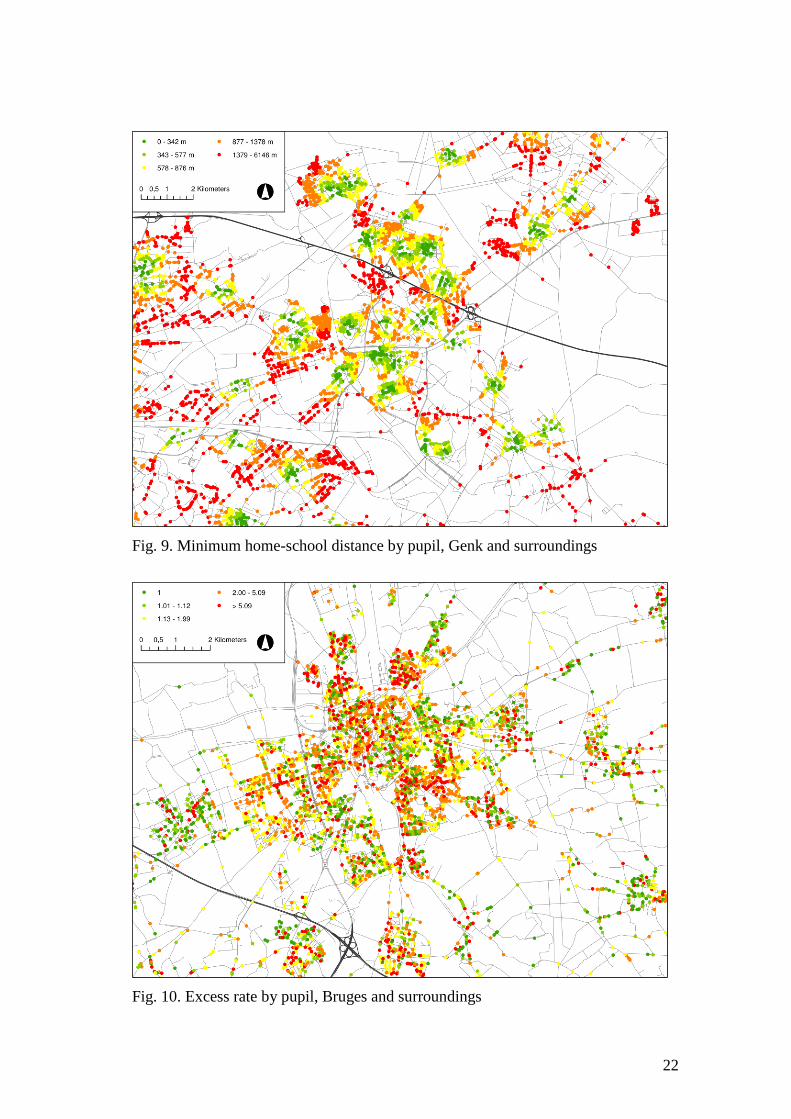
Fig. 9. Minimum home-school distance by pupil, Genk and surroundings
Fig. 10. Excess rate by pupil, Bruges and surroundings
Page 23
23
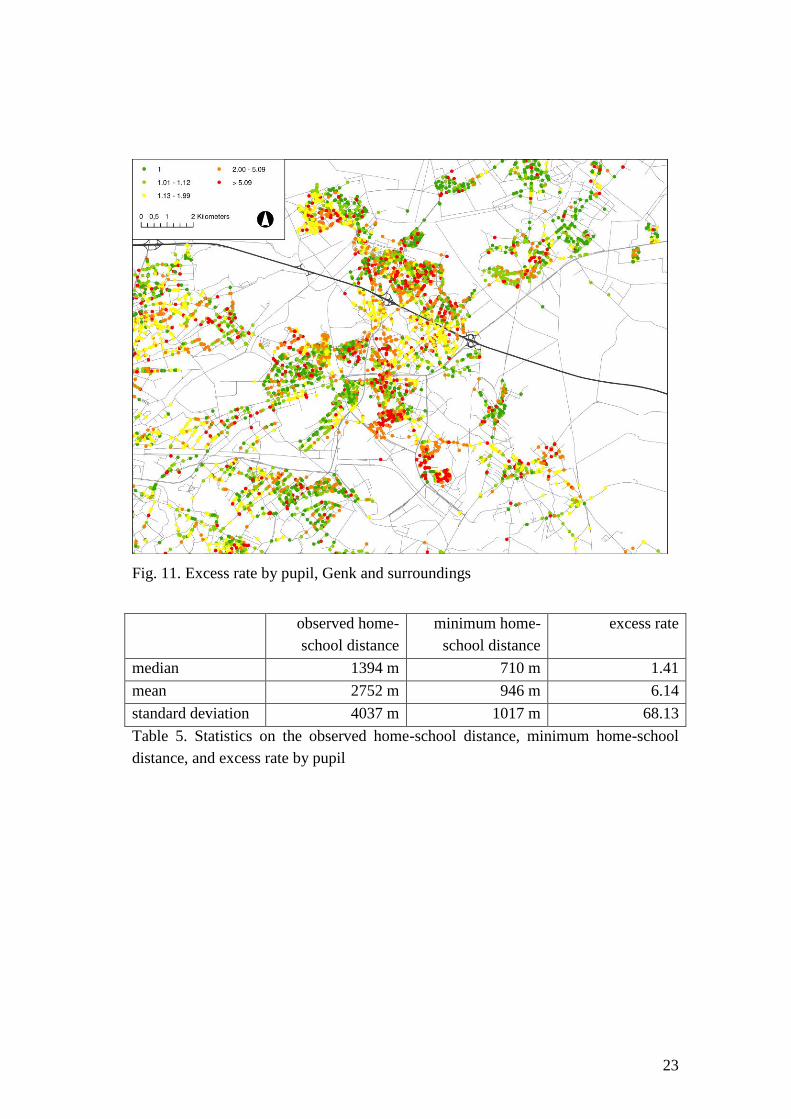
Fig. 11. Excess rate by pupil, Genk and surroundings
observed home-
school distance
minimum home-
school distance
excess rate
median 1394 m 710 m 1.41
mean 2752 m 946 m 6.14
standard deviation 4037 m 1017 m 68.13
Table 5. Statistics on the observed home-school distance, minimum home-school
distance, and excess rate by pupil
Page 24
24
class MA RUA SSUA PSUA NOA OA outside
number of
pupils
76545 45272 18611 15095 150165 63544 4829
median obs.
home-school
distance
1078
m
1165
m
1156
m
1094
m
1307 m 2289
m
7768 m
median min.
home-school
distance
427 m 572 m 614 m 629 m 753 m 1415
m
4950 m
median excess
rate
2.14 1.65 1.56 1.36 1.19 1.24 1.32
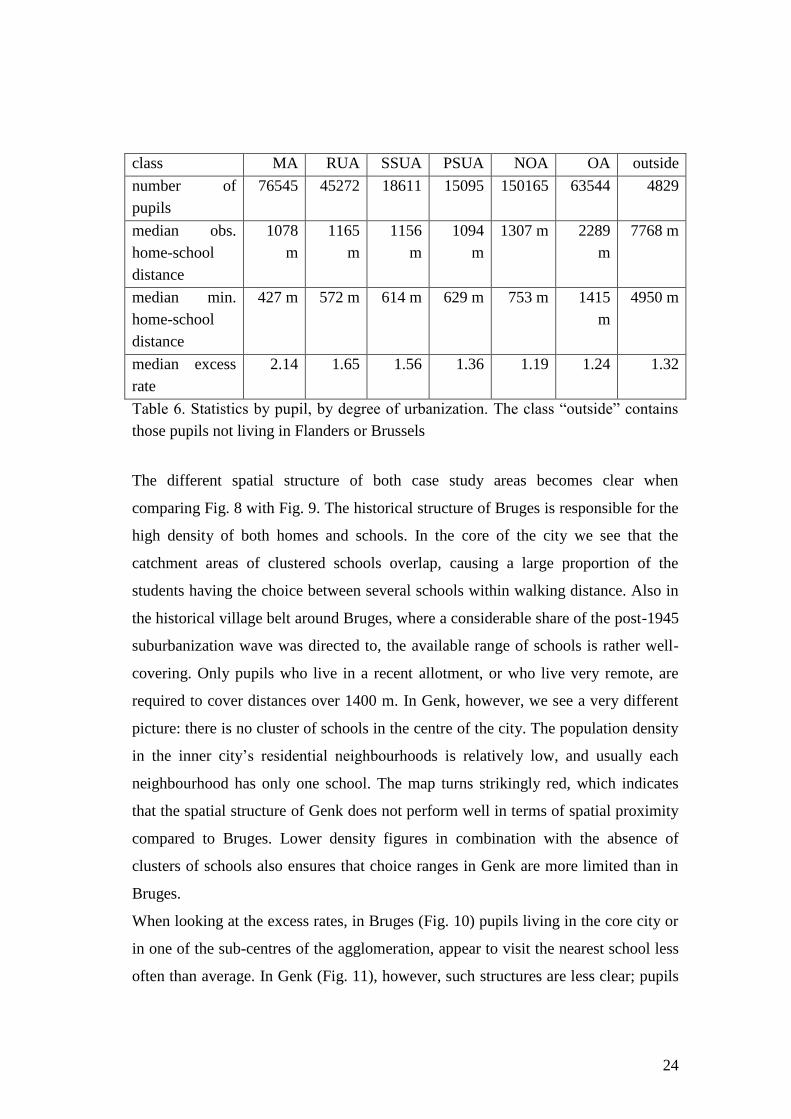
Table 6. Statistics by pupil, by degree of urbanization. The class “outside” contains
those pupils not living in Flanders or Brussels
The different spatial structure of both case study areas becomes clear when
comparing Fig. 8 with Fig. 9. The historical structure of Bruges is responsible for the
high density of both homes and schools. In the core of the city we see that the
catchment areas of clustered schools overlap, causing a large proportion of the
students having the choice between several schools within walking distance. Also in
the historical village belt around Bruges, where a considerable share of the post-1945
suburbanization wave was directed to, the available range of schools is rather well-
covering. Only pupils who live in a recent allotment, or who live very remote, are
required to cover distances over 1400 m. In Genk, however, we see a very different
picture: there is no cluster of schools in the centre of the city. The population density
in the inner city’s residential neighbourhoods is relatively low, and usually each
neighbourhood has only one school. The map turns strikingly red, which indicates
that the spatial structure of Genk does not perform well in terms of spatial proximity
compared to Bruges. Lower density figures in combination with the absence of
clusters of schools also ensures that choice ranges in Genk are more limited than in
Bruges.
When looking at the excess rates, in Bruges (Fig. 10) pupils living in the core city or
in one of the sub-centres of the agglomeration, appear to visit the nearest school less
often than average. In Genk (Fig. 11), however, such structures are less clear; pupils
Page 25
25
usually opt for the nearest school despite living in centrally located neighbourhoods.
One of the causes may be Genk’s more extensive fragmentation by infrastructure.
Even when studying the observed home-school distance (Fig. 6 and 7), it is obvious
that in Genk the theoretical catchment areas (Fig. 8 and 9) are better reflected in the
observed travel patterns than is the case in Bruges. From a CPT perspective, in Genk
we can say that the combination of school availability and upper limit of the range
tends to lead to a situation of spatial monopoly, whereas in the more centralized
situation of Bruges, from a spatial perspective, there is a potentiality for school
choice within the average time-space budget.
The home-school distance statistics in Table 5 are of the same order of magnitude as
the values already presented in Table 3. Also, the values of Table 6 correspond fairly
well with those of Table 4. It is striking that 58% of the Dutch-language pupils in
Flanders or Brussels live outside any urban area. However, the share of them (70%)
living in a nucleus in the outlying area, usually corresponding with a village, hardly
suffer from their peripheral residential location: half of these pupils still choose a
school at 1300 m or less from home, and is faced with the possibility to further
reduce this distance to a mere 750 m. For those living outside such a nucleus (17% of
the pupils in Flanders and Brussels), in contrast, the remote home location is
responsible for the relatively large home-school distance, affecting the autonomy of
the child concerned. Pupils living in Wallonia or abroad are naturally obliged to
cover above average distances. Since this category of pupils includes some rather
inaccurate data, we will draw no further conclusions from the figures for this
“outside” class.
Excess rates roughly decrease when the degree of urbanization increases. This means
that, as expected, pupils living more remotely choose more often the nearest school,
which corresponds to the observations made on the basis of Table 4.
Page 26
26
6. Conclusions and policy recommendations
Based on the analysis of detailed information about the home-school distances in the
Flemish primary education system in Belgium, we are able to answer both research
questions. With regard to the first question, we note that at the level of the pupil there
is a strong correlation between the minimum home-school distance, which defines
the theoretical minimal catchment area of a school, and the observed home-school
distance, which represents the real catchment area. Taking into account that schools
are often part of a cluster of local amenities, this indicates that the spatial distribution
of the primary schools seems to correspond to a certain extent with the pattern that is
expected from CPT, corroborating that lower order central functions and places
retain analytical relevance. Depending on local properties of the spatial structure, at
this level central places are represented by either one school (as is the case in Genk),
or by a cluster of schools located within walking distance of each other (as is the case
in the centre of Bruges). This corresponds with the historical urbanization trajectory
of these two urban areas. Although the school’s real catchment areas, defined by the
observed home-school distances, largely overlap, this overlap is mainly occurring at
the local level, in contrast with home-work commute areas which overlap at the
regional scale. Also striking is that theoretical and real catchment areas better match
up where the surface covered by these areas is larger, especially in the nuclei of the
outlying area.
With regard to the second question, the research presents arguments to conclude that
the spatial distribution of the Dutch-language primary schools in Belgium is quite
well adapted to a sustainable form of home-school travel, based on short distances.
The order of magnitude of the median observed and minimum home-school distances
allows travel on foot or by bicycle (Cardon et al., 2012), and almost every village
core has at least one primary school.
Nevertheless, a few qualifications apply. First, mainly in the 1980s, the
rationalization of the primary education system has led to a systematic increase of the
average distance between home and the nearest school, a development that has
contributed to further motorization of schoolchildren’s travel behaviour. Second, the
housing stock kept suburbanizing during the last decades, which again contributed to
Page 27
27
the growth of home-school distances. Third, it is still possible to identify a number of
villages and residential neighbourhoods that are quite remote from any primary
school, locally qualifying the coverage of the school network as below average or
even insufficient.
We also see that quite a few schools located in an urban area represent relatively
large home-school distances. This phenomenon can be partly explained through
parents choosing a school for their children on the route of their own commute. In
addition, this may indicate a shortage of primary education facilities in some inner
cities, particularly in Brussels (Janssens, 2009), but also in Antwerp and Ghent,
where schools are often fully booked. This reduces the chance that a child can be
enrolled in the school of choice, often the nearest one. The problem of ethnically
segregated schools, which are often avoided by autochthonous pupils, reinforces this
phenomenon (Van Houtte and Stevens, 2009). A good spatial distribution of schools
does not mean that there are no local problems in terms of capacity or social and
ethnic segregation.
Finally, the literature review suggests a clearly autonomous growth of home-school
mobility, which is at least partly independent from the spatial distribution of schools
and homes. The overall increase in mobility, which is caused by various factors,
including the rise of prosperity and a more critical consumer’s attitude, is present too
in the school commute. In practice this is reflected in the increasing number of
children taken to school by car, with the commonly known vicious circle of
increasing car use (Sonkin et al., 2006) as a result.
Although the primary school network’s rather high density, as well as the elevated
level of proximity between schools and homes in Flanders should generally be
considered as an important quality of place, the spatial distribution of this asset is not
homogeneous. In order to maintain the general quality, and in order to ensure a more
equal spatial distribution, policy measures are needed. In addition to the well-known
ingredients of a compact city policy, such as avoiding sprawl, offering a dense
network of amenities and facilitating non-motorized trips, from our study also some
less obvious issues are addressed. One of these is the importance of sufficient supply
in terms of school capacity, in order to avoid inefficient home-school travel. It is
equally important to keep the quality of education as uniform as possible across
Page 28
28
municipalities, in order to avoid parents choosing distant schools for quality reasons.
Lastly, when considering further consolidation of the school network, it should be
taken in account that costs saved at the operational level of the school may well be
passed in a hardly visible way to the pupils’ parents and even to society in general in
the form of additional transport related burden. It is our conviction that the latter
theme offers a challenging avenue for further research.
References
Banister, D., Watson, S., & Wood, C. (1997). Sustainable cities: Transport, energy,
and urban form. Environment and Planning B, 24(1), 125-143.
Berry, B. J. L., & Garrison, W. (1958). Recent developments of central place theory.
Papers in Regional Science, 4(1), 107-120.
Berry, B. J. L., Parr, J. B., Epstein, B. J., Ghosh, A., & Smith, R. H. T. (1988).
Market Centers and Retail Location. Eaglewood Cliffs, NJ: Prentice Hall.
Bertaud, A. (2004). The spatial organization of cities: Deliberate outcome or
unforeseen consequence? Berkeley, CA: Institute of Urban and Regional
Development, UC Berkeley.
Bontje, M. (2004). From suburbia to post-suburbia in the Netherlands: Potentials and
threats for sustainable regional development. Journal of Housing and the
Built Environment, 19(1), 25-47.
Boussauw, K. (2011). Aspects of spatial proximity and sustainable travel behaviour
in Flanders : A quantitative approach. PhD Thesis. Ghent: Ghent University.
Boussauw, K., Derudder, B., & Witlox, F. (2011). Measuring spatial separation
processes through the minimum commute: The case of Flanders. European
Journal of Transport and Infrastructure Research, 11(1), 42-60.
Boussauw, K., Van Acker, V., & Witlox, F. (2012). Excess travel in non-professional
trips: Why look for it miles away? Tijdschrift voor Economische en Sociale
Geografie, 103(1), 20-38.
Burger, M. J., Meijers, E. J., & Van Oort, F. G. (2013). Regional spatial structure and
retail amenities in the Netherlands. Regional Studies, in press.
Cardon, G. M., Maes, L. R. D., Haerens, L. L., & Bourdeaudhuij, I. M. M. D. (2012).
Bicycling to school during the transition from childhood into adolescence: a
six-year longitudinal study. Pediatric Exercise Science, 24(3), 369-383.
Cervero, R., & Duncan, M. (2006). Which reduces vehicle travel more: Jobs-housing
balance or retail-housing mixing? Journal of the American Planning
Association, 72(4), 475-490.
Cervero, R., & Wu, K.-L. (1997). Polycentrism, commuting, and residential location
in the San Francisco Bay area. Environment and Planning A, 29(5), 865-886.
Christaller, W. (1966 [1933]). Central Places in Southern Germany. Eaglewood
Cliffs, NJ: Prentice Hall.
De Boer, E. (2010). School Concentration and School Travel. PhD Thesis. Delft:
Delft University of Technology.
Page 29
29
Dujardin, S., Boussauw, K., Brévers, F., Lambotte, J.-M., Teller, J., & Witlox, F.
(2012). Sustainability and change in the institutionalized commute in
Belgium: Exploring regional differences. Applied Geography, 35(1-2), 95-
103.
Ewing, R., & Greene, W. (2003). Travel and environmental implications of school
siting. Washington, DC: United States Environmental Protection Agency.
Flemish Ministry of Education and Training. (2013). Statistisch jaarboek van het
Vlaams onderwijs - schooljaar 2011-2012. Brussel: Flemish Government.
Glenn, C. L. (1989). Choice of Schools in Six Nations: France, Netherlands,
Belgium, Britain, Canada, West Germany. Washington, DC: Office of
Educational Research and Improvement.
Hall, P. (2002). Christaller for a global age: Redrawing the urban hierarchy. In A.
Mayr, M. Meurer & J. Vogt (Eds.), Stadt und Region: Dynamik von
Lebenswelten (pp. 110-128). Leipzig: Deutsche Gesellschaft für Geographie.
Halleux, J.-M., Lambotte, J.-M., Rixhon, G., & Mérenne-Schoumaker, B. (2009).
Pendel in België: De Woon-Schoolverplaatsingen. Brussels: FPS Economy -
Directorate-General Statistics and Economic Information.
Horner, M. (2002). Extensions to the concept of excess commuting. Environment
and Planning A, 34(3), 543-566.
Janssens, D., Cools, M., Miermans, W., Declercq, K., & Wets, G. (2011). Onderzoek
Verplaatsingsgedrag Vlaanderen 4.2 (2009-2010). Brussels-Diepenbeek:
Flemish Government.
Janssens, R. (2009). Onderzoek naar de capaciteit van het Nederlandstalig
basisonderwijs in het Brussels Hoofdstedelijk Gewest. Brussel: Brussels
Informatie-, Documentatie- en Onderzoekscentrum.
Karsten, L. (2007). Housing as a way of life: Towards an understanding of middle-
class families' preference for an urban residential location. Housing Studies,
22(1), 83-98.
Krizek, K. J. (2003). Neighborhood services, trip purpose, and tour-based travel.
Transportation, 30(4), 387-410.
Lambooy, J. G. (1969). City and city region in the perspective of hierarchy and
complementarity. Tijdschrift voor Economische en Sociale Geografie, 60(3),
141-154.
Leemans, G. (1998). Scholenbouw in de Vlaamse Gemeenschap: De behoefte aan
scholenbouw binnen het gesubsidieerd vrij en officieel onderwijs. Brussels:
Dienst voor Infrastructuurwerken van het Gesubsidieerd Onderwijs.
Marique, A.-F., Dujardin, S., Teller, J., & Reiter, S. (2013). School commuting: The
relationship between energy consumption and urban form. Journal of
Transport Geography, 26, 1-11.
Mérenne-Schoumaker, B., Van der Haegen, H., & Van Hecke, E. (1999). Algemene
Volks- en woningtelling op 1 maart 1991: Werk- en schoolpendel. Brussel:
Nationaal Instituut voor de Statistiek.
Müller, S. (2011). Assessment of school closures in urban areas by simple
accessibility measures. Erdkunde, 65(4), 401-414.
Neuman, M. (2005). The compact city fallacy. Journal of Planning Education and
Research, 25(1), 11-26.
Page 30
30
Neutens, T., Versichele, M., & Schwanen, T. (2010). Arranging place and time: A
GIS toolkit to assess person-based accessibility of urban opportunities.
Applied Geography, 30(4), 561-575.
Reginster, I., & Goffette-Nagot, F. (2005). Urban environmental quality in two
Belgian cities, evaluated on the basis of residential choices and GIS data.
Environment and Planning A, 37(6), 1067-1090.
RSV. (2004[1997]). Ruimtelijk Structuurplan Vlaanderen. Brussels: Ministry of the
Flemish Community.
Saey, P. (1973). Three fallacies in the literature on central place theory. Tijdschrift
voor Economische en Sociale Geografie, 64(3), 181-194.
Sonkin, B., Edwards, P., Roberts, I., & Green, J. (2006). Walking, cycling and
transport safety: an analysis of child road deaths. Journal of the Royal Society
of Medicine, 99(8), 402-405.
Stead, D., & Marshall, S. (2001). The relationships between urban form and travel
patterns: An international review and evaluation. European Journal of
Transport and Infrastructure Research, 1(2), 113-141.
Stern, E., & Michlis, M. (1986). Redefining high school catchment areas with
varying effects of achievement equality. Applied Geography, 6(4), 297–308.
Van Acker, V., & Witlox, F. (2013). Car ownership as a mediating variable in car
travel behaviour research using a structural equation modelling approach to
identify its dual relationship. Journal of Transport Geography, 18(1), 65-74.
Van Damme, D. (1999). Massificatie, democratisering en rationalisering: Het
schoolpact en de paradoxen van de onderwijsexpansie. In E. Witte, J. De
Groof & J. Tyssens (Eds.), Het Schoolpact van 1958 - Le Pacte Scolaire de
1958 (pp. 787-819). Brussels: Garant - VUBPress.
Van Diepen, A. M. L., & Musterd, S. (2009). Lifestyles and the city: Connecting
daily life to urbanity. Journal of Housing and the Built Environment, 24(3),
331-345.
Van Houtte, M., & Stevens, P. A. J. (2009). School ethnic composition and students'
integration outside and inside schools in Belgium. Sociology of Education,
82(3), 217-239.
Van Nuffel, N., & Saey, P. (2005). Commuting, hierarchy and networking: The case
of Flanders. Tijdschrift voor Economische en Sociale Geografie, 96(3), 313-
327.
Zwerts, E., Allaert, G., Janssens, D., Wets, G., & Witlox, F. (2010). How children
view their travel behaviour: A case study from Flanders (Belgium). Journal
of Transport Geography, 18(6), 702-710.