45
SELF ORGANIZING MAP AND LEAST SQUARE SUPPORT VECTOR MACHINE METHOD FOR RIVER FLOW MODELLING SHUHAIDA BTE ISMAIL UNIVERSITI TEKNOLOGI MALAYSIA

SELF ORGANIZING MAP AND LEAST SQUARE SUPPORT VECTOR
MACHINE METHOD FOR RIVER FLOW MODELLING
SHUHAIDA BTE ISMAIL
UNIVERSITI TEKNOLOGI MALAYSIA
SELF ORGANIZING MAP AND LEAST SQUARE SUPPORT VECTOR
MACHINE METHOD FOR RIVER FLOW MODELLING
SHUHAIDA BTE ISMAIL
A thesis submitted in fulfillment of the
requirements for the award of the degree of
Master of Science (Mathematic)
Faculty of Science
Universiti Teknologi Malaysia
DECEMBER 2011

iii
To my beloved family

iv
ACKNOWLEDGEMENT
Alhamdulillah, praise to the Almighty, Allah S.W.T for giving me a strength
and passion that I was able to complete my master. First and foremost I would like
to express my deep and sincere gratitude to my supervisor, Dr. Ani Shabri and Pn
Ruhaidah Samsudin for the encouragement, guidance, critic, friendship and
introducing me to this interesting subject and the continuous support of my study
and research. I would like to thank all lab mate of C22-451-01 for their continuous
support in many aspects of this research.
My special thank you also to my family; my parents and my siblings, for
being my supporters spiritually, strongly, keeping me cheerful and glad, throughout
my life. Untiring effort of caring and educating me is one of my most activator in
difficult moment.
v
ABSTRACT
Successful river flow time series forecasting is a primary goal and an
essential procedure required in the planning and water resources management. River
flow data are important for engineers to design, build and operate various water
projects and development. The monthly river flow data taken from Department of
Irrigation and Drainage, Malaysia are used in this study. This study aims to develop
a suitable model for short-term forecasting of monthly river flow in three catchment
areas in Malaysia. The hybrid model based on a combination of two methods of Self
Organizing Map (SOM) and Least Square Support Vector Machine (LSSVM) model
referred as SOM-LSSVM model is introduced. The hybrid model using the “divide
and conquer” approach where SOM algorithm is used to cluster the data into several
disjointed clusters. Next, the LSSVM model is used to forecast the river flow for
each cluster. This study also provides a method for determining the input structure
that will be used by Artificial Neural Network (ANN), LSSVM and hybrid SOM-
LSSVM models. There are three techniques used to determine the number of input
structures. The first technique is based on the past trend river flow data, the second
technique is based on the stepwise regression analysis and the third technique is the
best Autoregressive Integrated Moving Average (ARIMA) model. The experiments
present a comparison between a hybrid model and a single model of ARIMA, ANN,
and LSSVM. The comparison to determine the best of the model is based on three
types of statistical measures of Mean Absolute Error (MAE), Root Mean Square
Error (RMSE) and Correlation Coefficient (r). The results have shown that the
hybrid model shows better performance than other models for river flow forecasting.
It also indicates that the proposed model can be predicted more accurately and
provides a promising alternative technique in river flow forecasting.
vi
ABSTRAK
Peramalan siri masa aliran sungai yang tepat adalah matlamat utama dan
merupakan prosedur penting yang diperlukan dalam merancang dan menguruskan
sumber air. Data aliran sungai begitu penting kepada jurutera dalam merekabentuk,
membina dan mengendalikan pelbagai projek-projek pembangunan berasaskan air.
Data aliran sungai bulanan diambil dari Jabatan Pengairan dan Saliran, Malaysia
digunakan dalam kajian ini. Tujuan kajian ini adalah membangunkan model yang
bersesuaian untuk ramalan jangka pendek aliran sungai bulanan di tiga kawasan
tadahan di Malaysia. Model hibrid berasaskan gabungan dua kaedah iaitu Self
Organizing Map (SOM) dan Least Square Vector Machine (LSSVM) model dirujuk
sebagai SOM-LSSVM model diperkenalkan. Model hibrid ini menggunakan
pendekatan "pecah dan takluk" di mana algoritma SOM digunakan untuk
mengelompokkan data ke dalam beberapa kelompok yang teratur. Seterusnya model
LSSVM digunakan untuk meramal aliran sungai bagi setiap kelompok. Kajian ini
juga menyediakan kaedah bagi menentukan struktur input yang akan digunakan oleh
model Rangkaian Saraf Tiruan (ANN), LSSVM dan juga hibrid SOM-LSSVM.
Terdapat tiga kaedah yang digunakan bagi menentukan struktur input. Teknik
pertama adalah berdasarkan data aliran yang lepas, teknik kedua berdasarkan kaedah
analisis regrasi dan teknik ketiga merupakan model Autoregressive Integrated
Moving Average (ARIMA) yang terbaik. Eksperimen ini mengemukakan
perbandingan antara model hibrid dan model-model seperti ARIMA, ANN, dan
LSSVM. Perbandingan bagi menentukan model yang terbaik dibuat berdasarkan tiga
jenis pengukuran statistik iaitu Ralat Mutlak Min (MAE), Ralat Punca Min Kuasa
Dua (RMSE) dan Pekali Kolerasi (r). Keputusan menunjukkan bahawa model hibrid
menunjukkan prestasi yang lebih baik berbanding model lain untuk ramalan aliran
sungai. Ia juga menunjukkan bahawa model yang dicadangkan boleh menganggar
dengan lebih tepat dan menyediakan teknik alternatif yang lebih baik dalam ramalan
aliran sungai.
vii
TABLE OF CONTENTS
CHAPTER TITLE PAGE
DECLARATION ii
DEDICATION iii
ACKNOWLEDGEMENT iv
ABSTRACT v
ABSTRAK vi
TABLE OF CONTENTS vii
LIST OF TABLES x
LIST OF FIGURES xi
LIST OF ABBREVIATIONS xiii
1 INTRODUCTION 1
1.1 Introduction 1
1.2 Background Study 3
1.3 Problem Statement 7
1.4 Research Goal 9
1.5 Research Objective 9
1.6 Research Scope 9
1.6 Significance of The Study 10
viii
2 LITERATURE REVIEW 11
2.1 Introduction 11
2.2 Autoregressive Integrated Moving Average (ARIMA) 11
2.3 Artificial Neural Network 13
2.4 Least Square Support Vector Machine 17
2.5 Self Organizing Map 20
2.6 Hybrid Model 24
2.7 Input Determination 25
2.8 Summary 26
3 RESEARCH METHODOLOGY 28
3.1 Introduction 28
3.2 River Flow Forecasting 25
3.2.1 River Flow Forecasting Model 29
3.3 Autoregressive Integrated Moving Average Model 29
3.3.1 ARIMA Tentative Model 31
3.3.1.1 The ARIMA (p, 0, 0) Model 31
3.3.1.2 The ARIMA (0, 0, q Model 33
3.3.1.3 The ARIMA (p, d, q) Model 35
3.3.1.4 The SARIMA (p, d, q) x (P, D,Q)s) Model 36
3.3 Artificial Neural Network Model 37
3.3.1 FeedForward Network 38
3.3.1.1 Multilayer Perceptron 39
3.4.2 Backpropagation Algorithm 40
3.4.3 The ANN Architecture 41
3.4.3.1 The Number of Input Nodes 41
3.4.3.2 The Number of Hidden Layers and
Hidden Nodes 41
3.4.3.3 The Number of Output Nodes 42
3.4.3.3 Activation Function 42
ix
3.5 Least Square Support Vector Machine Model 44
3.5.1 Karush-Kuhn-Tucker 45
3.5.2 Validation Technique 46
3.5.2.1 Cross Validation 46
3.5.3 LSSVM Algorithm 46
3.5.1 Kernel 50
3.5.2.1 Kernel Function 50
3.6 Self Organizing Map (SOM) Model 52
3.6.1 Train The Network 53
3.6.1.1 Input Determination 53
3.6.1.2 Weight Vector 54
3.6.1.3 Learning Rate 55
3.6.1.4 Determining The Winning Node 55
3.6.1.5 Topological Neighbourhood 56
3.6.1.6 Neighbourhood Function 57
3.6.1.7 Updating The Weight 58
3.6.2 SOM Algorithm 58
3.7 Framework of The Study 60
4 DATA COLLLECTION AND ANALYSIS 63
4.1 Introduction 63
4.2 Data Source 63
4.2.1 Case Study 1 (Muda River)
65 4.2.2 Case Study 2 (Selangor River)
66 4.2.3 Case Study 3 (Bernam River)
68
4.3 Statistical Measure 69
4.4 Input Determination 71
4.4.1 Stepwise Regression Analysis 71
4.4.2 Step In Stepwise Regression Analysis 72
x
4.4.3 Input determination For Muda River 74
4.4.3 Input determination For Selangor River 76
4.4.3 Input determination For Bernam River 77
5 EXPERIMENT AND RESULT ANALYSIS 79
5.1 Introduction 79
5.2 Experiment Setup 79
5.3 Fitting The ARIMA Model To The Monthly River Flow 80
5.3.1 Case Study 1 – Muda River 81
5.3.1.1 Identification Step 81
5.3.1.2 Estimation and Diagnostic
Checking Step 85
5.3.1.3 Forecasting Step 89
5.3.2 Case Study2 – Selangor River 90
5.3.2.1 Identification Step 91
5.3.2.2 Estimation and Diagnostic
Checking Step 94
5.3.2.3 Forecating Step 98
5.3.3 Case Study 3 – Bernam River 99
5.3.3.1 Identification Step 100
5.3.3.2 Estimation and Diagnostic
Checking Step 104
5.3.3.3 Forecasting Step 104
5.4 Fitting The ANN Model To The Monthly River Flow 109
5.4.1 Case Study 1 – Muda River 110
5.4.2 Case Study 2 – Selangor River 113
5.4.3 Case Study 3 – Bernam River 116
5.5 Fitting The LSSVM Model To The Monthly River Flow 119
5.5.1 Case Study 1 – Muda River 120
5.5.2 Case Study 2 – Selangor River 121
5.5.3 Case Study 3 – Bernam River 123
xi
5.6 Fitting The SOM-LSSVM Model To The Monthly
River Flow 125
5.6.1 Case Study 1 – Muda River 126
5.6.2 Case Study 2 – Selangor River 128
5.6.3 Case Study 3 – Bernam River 131
6 COMPARISON AND DISCUSSION 134
6.1 Introduction 134
6.2 Muda River 134
6.3 Selangor River 139
6.4 Bernam River 143
7 CONCLUSION AND RECOMMENDATION 148
7.1 Introduction 148
7.2 Conclusion 148
7.3 Contributions 150
7.4 Suggestions For Future Research 151
REFERENCES 153
Appendices A-I 166
xii
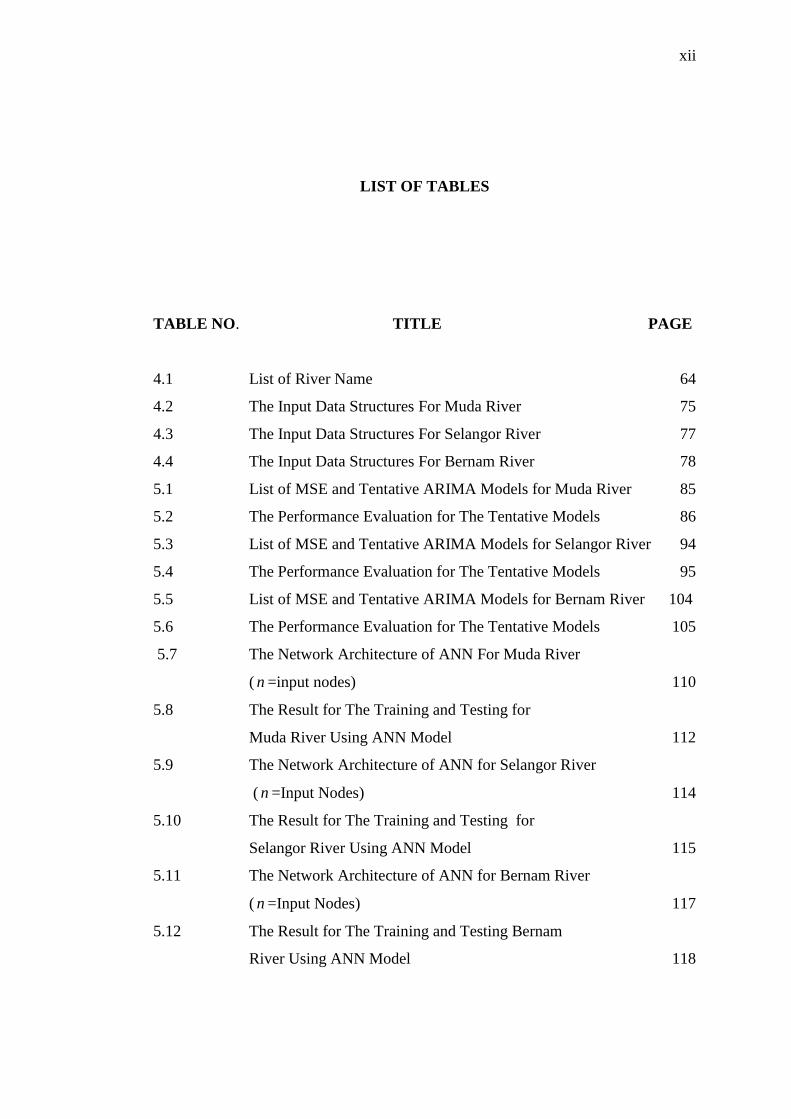
LIST OF TABLES
TABLE NO. TITLE PAGE
4.1 List of River Name 64
4.2 The Input Data Structures For Muda River 75
4.3 The Input Data Structures For Selangor River 77
4.4 The Input Data Structures For Bernam River 78
5.1 List of MSE and Tentative ARIMA Models for Muda River 85
5.2 The Performance Evaluation for The Tentative Models 86
5.3 List of MSE and Tentative ARIMA Models for Selangor River 94
5.4 The Performance Evaluation for The Tentative Models 95
5.5 List of MSE and Tentative ARIMA Models for Bernam River 104
5.6 The Performance Evaluation for The Tentative Models 105
5.7 The Network Architecture of ANN For Muda River
( n =input nodes) 110
5.8 The Result for The Training and Testing for
Muda River Using ANN Model 112
5.9 The Network Architecture of ANN for Selangor River
( n =Input Nodes) 114
5.10 The Result for The Training and Testing for
Selangor River Using ANN Model 115
5.11 The Network Architecture of ANN for Bernam River
( n =Input Nodes) 117
5.12 The Result for The Training and Testing Bernam
River Using ANN Model 118
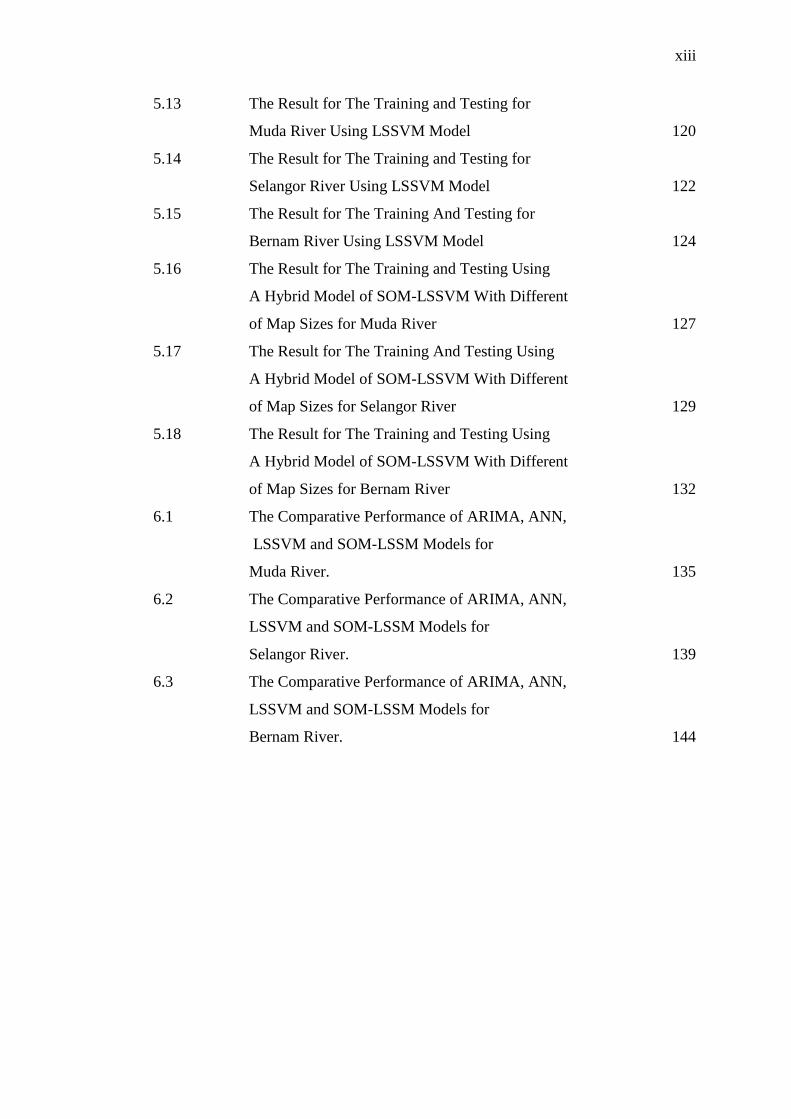
xiii
5.13 The Result for The Training and Testing for
Muda River Using LSSVM Model 120
5.14 The Result for The Training and Testing for
Selangor River Using LSSVM Model 122
5.15 The Result for The Training And Testing for
Bernam River Using LSSVM Model 124
5.16 The Result for The Training and Testing Using
A Hybrid Model of SOM-LSSVM With Different
of Map Sizes for Muda River 127
5.17 The Result for The Training And Testing Using
A Hybrid Model of SOM-LSSVM With Different
of Map Sizes for Selangor River 129
5.18 The Result for The Training and Testing Using
A Hybrid Model of SOM-LSSVM With Different
of Map Sizes for Bernam River 132
6.1 The Comparative Performance of ARIMA, ANN,
LSSVM and SOM-LSSM Models for
Muda River. 135
6.2 The Comparative Performance of ARIMA, ANN,
LSSVM and SOM-LSSM Models for
Selangor River. 139
6.3 The Comparative Performance of ARIMA, ANN,
LSSVM and SOM-LSSM Models for
Bernam River. 144
xiv
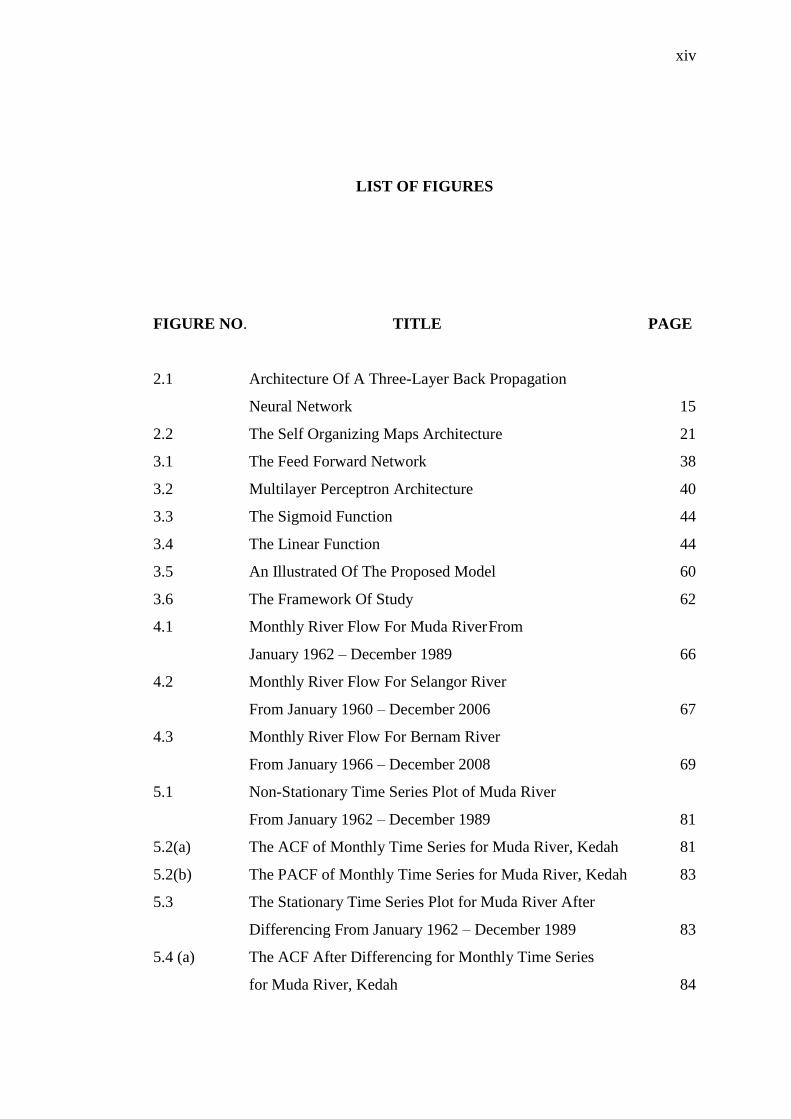
LIST OF FIGURES
FIGURE NO. TITLE PAGE
2.1 Architecture Of A Three-Layer Back Propagation
Neural Network 15
2.2 The Self Organizing Maps Architecture 21
3.1 The Feed Forward Network 38
3.2 Multilayer Perceptron Architecture 40
3.3 The Sigmoid Function 44
3.4 The Linear Function 44
3.5 An Illustrated Of The Proposed Model 60
3.6 The Framework Of Study 62
4.1 Monthly River Flow For Muda River From
January 1962 – December 1989 66
4.2 Monthly River Flow For Selangor River
From January 1960 – December 2006 67
4.3 Monthly River Flow For Bernam River
From January 1966 – December 2008 69
5.1 Non-Stationary Time Series Plot of Muda River
From January 1962 – December 1989 81
5.2(a) The ACF of Monthly Time Series for Muda River, Kedah 81
5.2(b) The PACF of Monthly Time Series for Muda River, Kedah 83
5.3 The Stationary Time Series Plot for Muda River After
Differencing From January 1962 – December 1989 83
5.4 (a) The ACF After Differencing for Monthly Time Series
for Muda River, Kedah 84
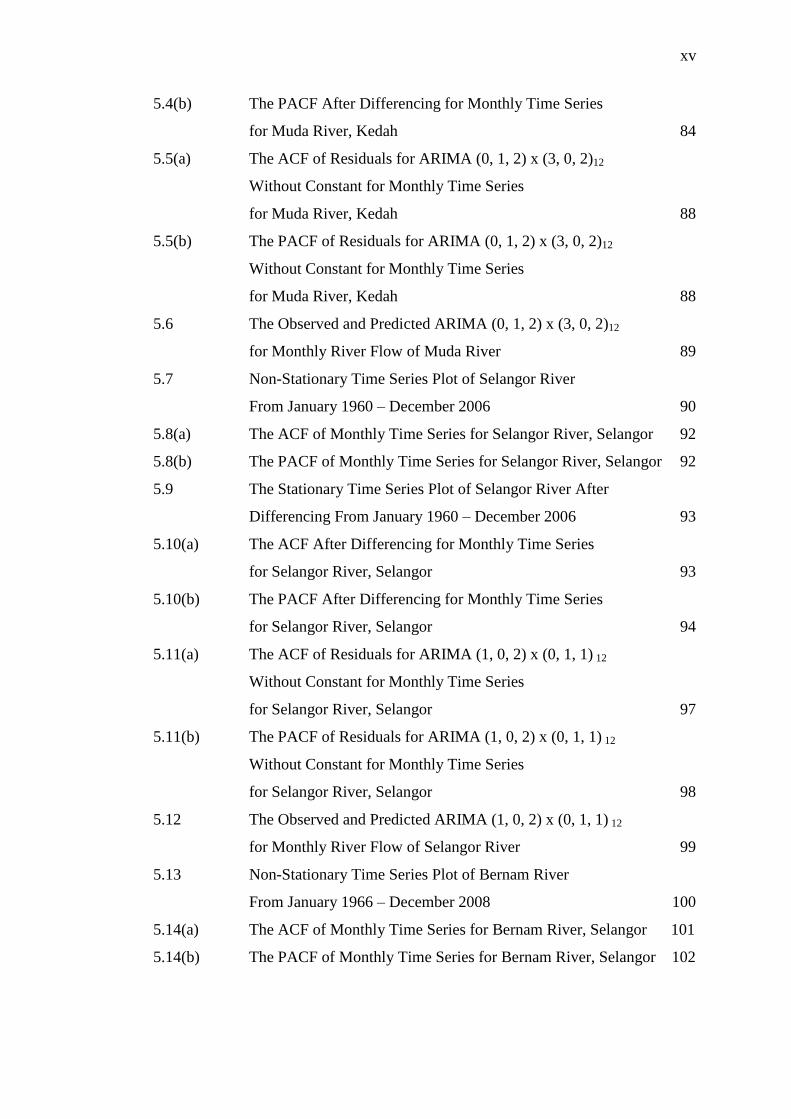
xv
5.4(b) The PACF After Differencing for Monthly Time Series
for Muda River, Kedah 84
5.5(a) The ACF of Residuals for ARIMA (0, 1, 2) x (3, 0, 2)12
Without Constant for Monthly Time Series
for Muda River, Kedah 88
5.5(b) The PACF of Residuals for ARIMA (0, 1, 2) x (3, 0, 2)12
Without Constant for Monthly Time Series
for Muda River, Kedah 88
5.6 The Observed and Predicted ARIMA (0, 1, 2) x (3, 0, 2)12
for Monthly River Flow of Muda River 89
5.7 Non-Stationary Time Series Plot of Selangor River
From January 1960 – December 2006 90
5.8(a) The ACF of Monthly Time Series for Selangor River, Selangor 92
5.8(b) The PACF of Monthly Time Series for Selangor River, Selangor 92
5.9 The Stationary Time Series Plot of Selangor River After
Differencing From January 1960 – December 2006 93
5.10(a) The ACF After Differencing for Monthly Time Series
for Selangor River, Selangor 93
5.10(b) The PACF After Differencing for Monthly Time Series
for Selangor River, Selangor 94
5.11(a) The ACF of Residuals for ARIMA (1, 0, 2) x (0, 1, 1) 12
Without Constant for Monthly Time Series
for Selangor River, Selangor 97
5.11(b) The PACF of Residuals for ARIMA (1, 0, 2) x (0, 1, 1) 12
Without Constant for Monthly Time Series
for Selangor River, Selangor 98
5.12 The Observed and Predicted ARIMA (1, 0, 2) x (0, 1, 1) 12
for Monthly River Flow of Selangor River 99
5.13 Non-Stationary Time Series Plot of Bernam River
From January 1966 – December 2008 100
5.14(a) The ACF of Monthly Time Series for Bernam River, Selangor 101
5.14(b) The PACF of Monthly Time Series for Bernam River, Selangor 102
xvi
5.15 Stationary Time Series Plot of Bernam River After
Differencing From January 1966 – December 2008 102
5.16(a) The ACF After Differencing for Monthly Time Series
for Bernam River, Selangor 103
5.16(b) The PACF After Differencing for Monthly Time Series
for Bernam River, Selangor 103
5.17(a) The ACF of Residuals for ARIMA (2, 0, 0) x (2, 0, 2)12
Without Constant for Monthly Time Series
for Bernam River, Selangor 107
5.17(b) The PACF of Residuals for ARIMA (2, 0, 0) x (2, 0, 2)12
Without Constant for Monthly Time Series
for Bernam River, Selangor 107
5.82 The Observed and Predicted ARIMA (2, 0, 0) x (2, 0, 2)12
for Monthly River Flow of Bernam River 108
5.19 The Observed and Predicted ANN for Monthly
River Flow of Muda River 113
5.20 The Observed and Predicted ANN for Monthly
River Flow of Selangor River 116
5.21 The Observed and Predicted ANN for Monthly
River Flow of Bernam River 119
5.22 The Observed and Predicted LSSVM for Monthly
River Flow of Muda River 121
5.23 The Observed and Predicted LSSVM for Monthly
River Flow of Selangor River 123
5.24 The Observed and Predicted LSSVM for Monthly
River Flow of Bernam River 125
5.25 The Observed and Predicted SOM-LSSVM for Monthly
River Flow of Muda River 128
5.26 The Observed and Predicted SOM-LSSVM for Monthly
River Flow of Selangor River 130
5.27 The Observed and Predicted SOM-LSSVM for Monthly
River Flow of Bernam River 133
xvii
6.1(a) The Observed and Predicted River Flow During Testing
Period By ARIMA, For Muda River 136
6.1(b) The Observed and Predicted River Flow During Testing
Period By ANN For Muda River 136
6.1(c) The Observed and Predicted River Flow During Testing
Period By LSSVM For Muda River 137
6.1 (d) The Observed and Predicted River Flow During Testing
Period By SOM-LSSVM For Muda River 137
6.2 The Boxplot For Predicted River Flow Using ARIMA,
ANN, LSSVM And SOM-LSSVM For Muda River 138
6.3 (a) The Observed and Predicted River Flow During Testing
Period By ARIMA, For Selangor River 140
6.3 (b) The Observed and Predicted River Flow During Testing
Period By Ann, For Selangor River 141
6.3 (c) The Observed and Predicted River Flow During Testing
Period By LSSVM, For Selangor River 141
6.3 (d) The Observed and Predicted River Flow During Testing
Period By SOM-LSSVM, For Selangor River 142
6.4 The Boxplot for Predicted River Flow Using ARIMA,
ANN, LSSVM And SOM-LSSVM For Selangor River 143
6.5 (a) The Observed and Predicted River Flow During Testing
Period By ARIMA, For Bernam River 145
6.5 (b) The Observed and Predicted River Flow During Testing
Period By ANN For Bernam River 145
6.5 (c) The Observed and Predicted River Flow During Testing
Period By LSSVM For Bernam River 146
6.5 (d) The Observed and Predicted River Flow During Testing
Period By SOM-LSSVM For Bernam River 146
6.6 The Boxplot for Predicted River Flow Using ARIMA,
ANN, LSSVM And SOM-LSSVM For Bernam River 147
xviii
LIST OF SYMBOLS
p - The non seasonal auto regression
d - The regular differencing
q - The non seasonal moving average
P - The seasonal auto regression
D - The seasonal differencing
Q - The seasonal moving average
S - The length of season
tx - The current value of the time series
- The constant
ta - The random errors
p ,....,, 21 - The AR parameters of the model
q ,, 21 - The MA parameters of the model
- The mean of time series
qttt ,...,, 21 - The errors of the model
ty - The output layers,
itx - The input of the network,
jw - The connection weights between nodes of input and
hidden layers
iw - The connection weights between nodes of hidden and
output layers,
g (.) and f (.) - The activation function.
(.) - Map from input space to feature space
xix
J - The loss function
ew, - The output layer vector or parameter vector in
primal space
Tw - The transpose of w
- The regularization constants
b - Bias term
L - The Lagrangian
)(t - The learning rate
)1( t - updated learning rate
j - The updated neighbourhood function
|||| jWX - Represent Euclidean distance
)(t - The bandwidth of the Gaussian RBF
)(t - The learning rate at time t
)(tW j - The old weight vector.
jih - The neighbourhood function
)1( tW j - The The adjusted weight vector at time )1( t .
xx
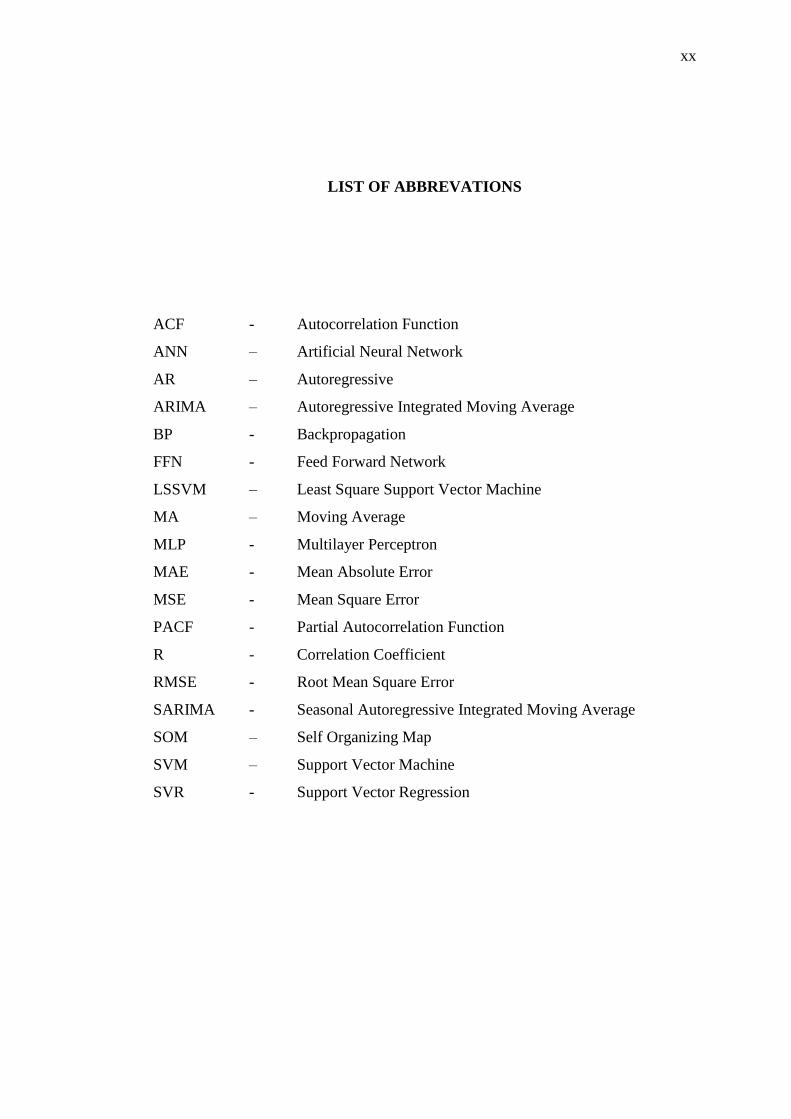
LIST OF ABBREVATIONS
ACF - Autocorrelation Function
ANN – Artificial Neural Network
AR – Autoregressive
ARIMA – Autoregressive Integrated Moving Average
BP - Backpropagation
FFN - Feed Forward Network
LSSVM – Least Square Support Vector Machine
MA – Moving Average
MLP - Multilayer Perceptron
MAE - Mean Absolute Error
MSE - Mean Square Error
PACF - Partial Autocorrelation Function
R - Correlation Coefficient
RMSE - Root Mean Square Error
SARIMA - Seasonal Autoregressive Integrated Moving Average
SOM – Self Organizing Map
SVM – Support Vector Machine
SVR - Support Vector Regression
xxi
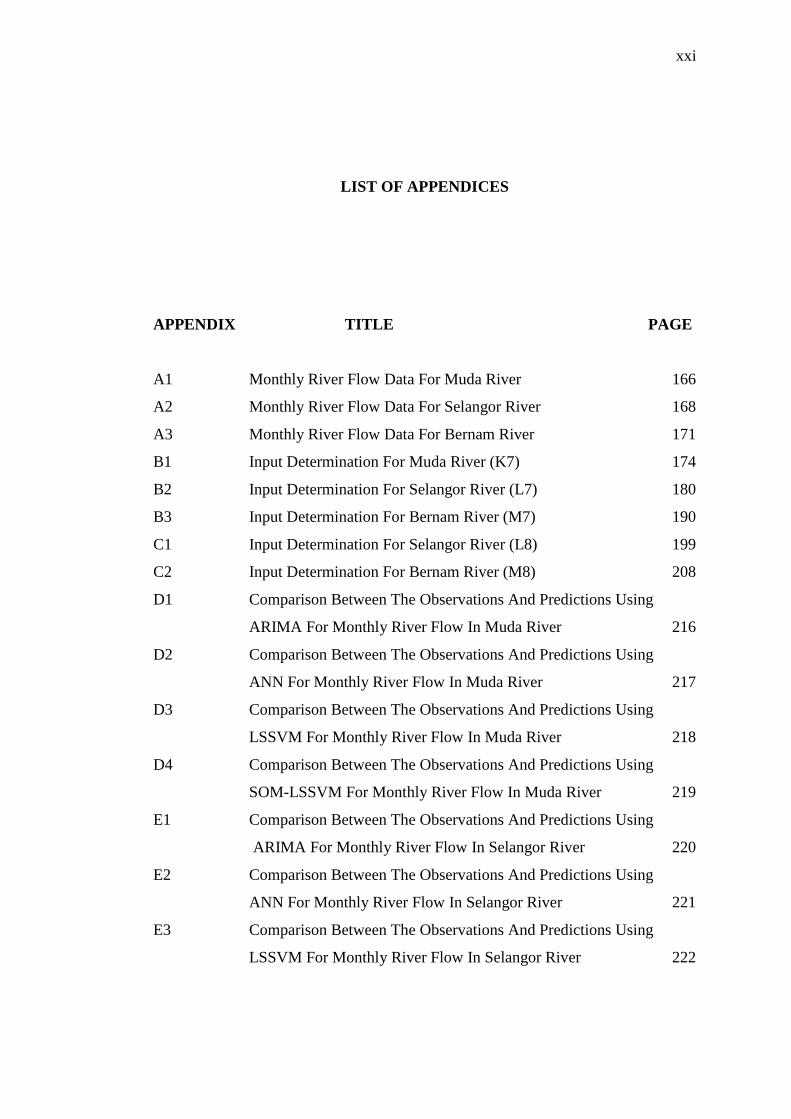
LIST OF APPENDICES
APPENDIX TITLE PAGE
A1 Monthly River Flow Data For Muda River 166
A2 Monthly River Flow Data For Selangor River 168
A3 Monthly River Flow Data For Bernam River 171
B1 Input Determination For Muda River (K7) 174
B2 Input Determination For Selangor River (L7) 180
B3 Input Determination For Bernam River (M7) 190
C1 Input Determination For Selangor River (L8) 199
C2 Input Determination For Bernam River (M8) 208
D1 Comparison Between The Observations And Predictions Using
ARIMA For Monthly River Flow In Muda River 216
D2 Comparison Between The Observations And Predictions Using
ANN For Monthly River Flow In Muda River 217
D3 Comparison Between The Observations And Predictions Using
LSSVM For Monthly River Flow In Muda River 218
D4 Comparison Between The Observations And Predictions Using
SOM-LSSVM For Monthly River Flow In Muda River 219
E1 Comparison Between The Observations And Predictions Using
ARIMA For Monthly River Flow In Selangor River 220
E2 Comparison Between The Observations And Predictions Using
ANN For Monthly River Flow In Selangor River 221
E3 Comparison Between The Observations And Predictions Using
LSSVM For Monthly River Flow In Selangor River 222
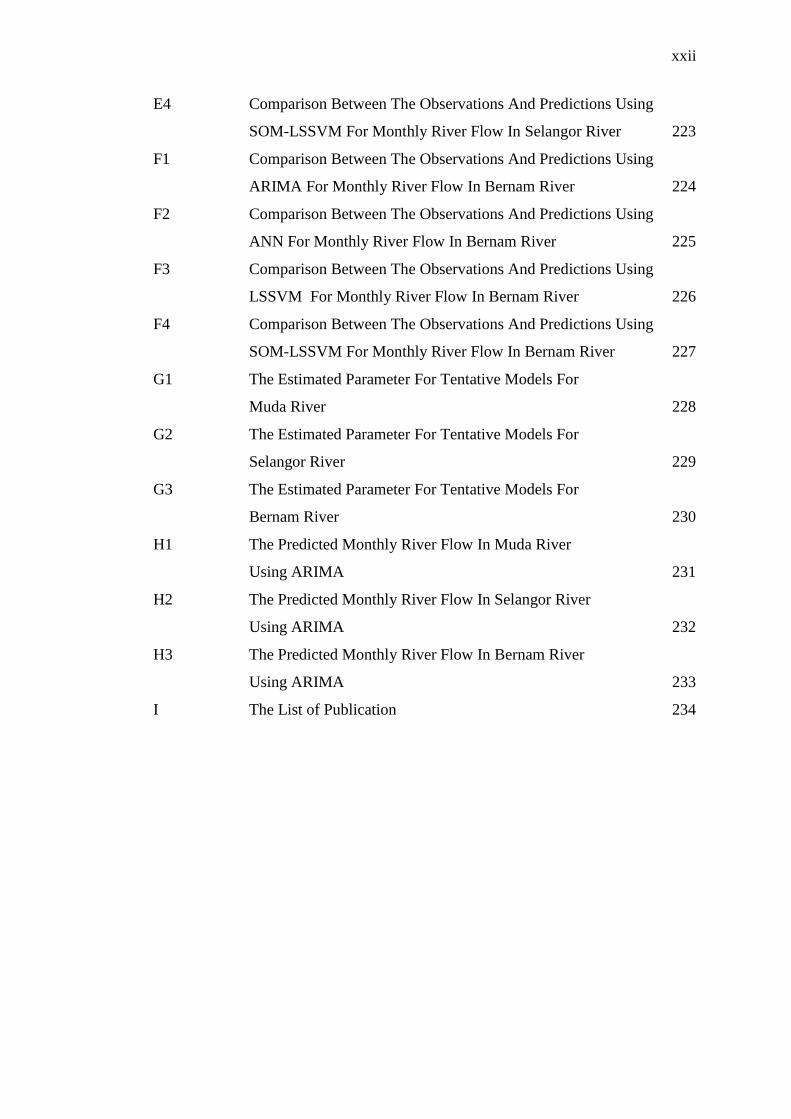
xxii
E4 Comparison Between The Observations And Predictions Using
SOM-LSSVM For Monthly River Flow In Selangor River 223
F1 Comparison Between The Observations And Predictions Using
ARIMA For Monthly River Flow In Bernam River 224
F2 Comparison Between The Observations And Predictions Using
ANN For Monthly River Flow In Bernam River 225
F3 Comparison Between The Observations And Predictions Using
LSSVM For Monthly River Flow In Bernam River 226
F4 Comparison Between The Observations And Predictions Using
SOM-LSSVM For Monthly River Flow In Bernam River 227
G1 The Estimated Parameter For Tentative Models For
Muda River 228
G2 The Estimated Parameter For Tentative Models For
Selangor River 229
G3 The Estimated Parameter For Tentative Models For
Bernam River 230
H1 The Predicted Monthly River Flow In Muda River
Using ARIMA 231
H2 The Predicted Monthly River Flow In Selangor River
Using ARIMA 232
H3 The Predicted Monthly River Flow In Bernam River
Using ARIMA 233
I The List of Publication 234
0
CHAPTER 1
INTRODUCTION
1.1 Introduction
Hydrology is a scientific study of the water, distribution and the effects on
the earth‟s surface, in the soil as well as in the atmosphere. The water is in various
forms such as liquid, vapour and ice at various places all the time. Water on earth
can be stored in several reservoirs such as the atmosphere, oceans, lakes, rivers,
lands and etc. Ocean is the largest reservoir that holds water, which is about 97%
water from earth. Due to the huge ocean surface, the water will evaporate in a large
amount and then form clouds of vapour (Viessman et al., 1989). The water that has
been through the process of evaporation will be back in the form of rain, snow or
hail in both land and sea.
Hydrological cycle referred as continuous movement of water on, above and
below the earth surface. The changes and movements of water are link together with
the hydrological cycle. The components of the hydrologic cycle including vapour
and clouds in the atmosphere, but also include surface water such as seas, lakes and
rivers and ground water. A river is part of hydrological cycle; usually contain a
freshwater, flowing toward oceans, lakes, or other rivers. River may also be called
2
as stream, tributary and rill. On the way down to the ocean, river may collect some
water from rain, and from other streams/rivers.
Hydrology data such as flows and rainfall are the basic information used in
the design of the water resources system. Knowledge about the characteristics and
volume of river flow is very important, especially for predicting the future river flow
in the monsoon season where the heavy rainfall may cause heavy river flow. By
knowing and analyzing statistical properties of hydrologic records and data like
rainfall or river flow, hydrologists are able to estimate future hydrologic phenomena.
The river flow can be measured by using several methods such as the velocity-area
method, level to flow method, and others. This information is very useful for the
river flow forecasting. Heavy river flow may cause some damage to the
environment such as flooding. Flood, also known as deluge, is a natural disaster that
could diminish properties, infrastructures, animals, plants and even human lives.
Flooding occurs when the volume of water exceeds the capacity of the catchment
area.
Floods are one of the natural disasters that occur not only in Malaysia, but
also in other part of the world. It is also the most costly natural hazard since its
ability to destroy human properties and lives. The basic cause of river flooding is
the incidence of heavy rainfalls such as during monsoon season, and the resultant
large concentration of runoff, which exceeds river capacity (Ministry of Natural
Resources and Environment, Malaysia, June 2007). Meanwhile, reduced river flow
is likely to restrict the supply of water for domestic consumption, transportation, an
industrial and hydroelectric power generation. Therefore, the ability to forecast the
future river flow will be beneficial in the field of water management and helps in the
design of flood protection works in urban areas and for agricultural land.
In hydrology, different types of models are used such as lumped conceptual
models, physical-based model also known as knowledge-driven modelling;
empirical models also known as data-driven modelling and so on. By using the
3
knowledge driven modelling, the other catchment variables such as catchment
characteristics (size, shape, slope and storage characteristics of the catchment),
geomorphologic characteristics of a catchment (topography, land use patterns,
vegetation and soil types that affect the infiltration) must be considered because it is
hypothesized that forecasts could be improved if catchment characteristic variables
which affect the flow were to be included (Jain & Kumar, 2007; Dibike &
Solomatine, 2001).
Although combining others variables may improve the prediction accuracy,
for developing countries like Malaysia, the information is often either difficult to
obtain or unavailable. Moreover, the influence of these variables and many of their
combinations in generating river flow is an extremely complex physical process,
especially due to the data collection of multiple inputs and parameters, which vary in
space and time and not clearly understood (Zhang & Govindaraju, 2000).
In river flow forecasting, the data-driven modelling using previous river flow
time series data become increasingly popular (Kisi, 2008; 2009; Wang et al., 2009).
The data-driven modelling which is based on extracting and re-using the information
without taking into an account any physical law that underlie. Although, river flow
forecasting models using historical river flow time series data may lacking in an
ability to provide physical interpretation and insight into catchment processes, they
are nevertheless able to provide relatively accurate flow forecasts and becoming
increasingly popular due to their rapid development times and minimum information
requirements.
1.2 Background Study
Time series analysis and forecasting is an active research area over the last
few decades. Various kinds of forecasting models have been developed and
4
researchers have relied on statistical techniques to predict time series data. The
accuracy of time series forecasting is fundamental to many decisions processes and
hence the research for improving the effectiveness of forecasting models has never
been stopped (Zhang, 2003). The reason that forecasting is so important is that
prediction of future events is a critical input into many types of planning and
decision making.
River flow forecasting is an active research area that have been studied.
River flow forecasting is an important yet difficult task in the field of hydrology
because predicting future events involve a decision-making process. The flow is
critical to many activities such as designing flood protection works for urban areas
and agricultural land, and assessing how much water may be extracted from a river
for water supply or irrigation. Because the accuracy of river flow forecasting is very
important, models that deal with meteorological, hydrologic, and geological
variables should be improved so that controlling water and operating water
structures effectively will be possible. The ability to predict future river flow will
provide the right edge and assist the engineer in terms of flood control management,
and provide some benefits in the areas of water supply management (Viessman &
Lewis, 1996). In the past, conventional statistical methods were employed to forecast
a time series data. However, the time series data are often full of non-linearity and
irregularity.
The most popular and widely known statistical methods used for time series
forecasting is an Autoregressive Integrated Moving Average (ARIMA) or also
known as Box Jenkins model. The popularity of the ARIMA model is due to its
statistical properties. Several studies shown that ARIMA can be trusted as a reliable
method in time series forecasting and the ability of ARIMA to identify the
relationship between different time series (Muhamad & Hassan, 2005; Modarres,
2007; Shabri, 2001; Zhang, 2003). The ARIMA also received an attention in
hydrology area. The extensive applications and reviews of ARIMA model proposed
for modeling of water resources time series were reported (Huang et al., 2004; Wang
et al., 2009). There are some researcher employed ARIMA for river flow forecasting
5
(Noakes et al., 1985; Muhamad & Hassan, 2005; Modarres, 2007). ARIMA model is
only a class of linear model and thus it can only capture linear feature of data time
series. However, most river flow time series of practical relevance are nonlinear and
chaotic nature.
Artificial Neural Network (ANN) model has become an alternative
forecasting technique used to capture the problems that cannot be solved by using
the ARIMA model (Dolling & Varas, 2003). In the last decade, ANN are being used
more frequently in the analysis of time series forecasting, pattern classification and
pattern recognition capabilities (Sharda, 1994; Zou et al., 2007). The ANN also
provides an alternative tool for forecasting and has shown their nonlinear modelling
capability in data time series forecasting. The ANN is the most widely and
comprehensive statistical methods used for time series forecasting including to
model a complex hydrologic system and has been successfully employed in
modelling a wide range of hydrologic process where there were some researchers
employed ANN for a river flow forecasting (Kisi, 2004; Keskin & Taylan, 2009),
and some of them used to compare ANNs with the other traditional statistical
technique for river flow prediction (Muhamad & Hassan, 2005; Wang et al., 2009).
The major advantage of ANN is the flexible nonlinear modelling capability.
The majority of the studies showed that ANNs are able to outperform other
traditional statistical techniques (Wu et al., 2008). However, the selection of an
optimal network structure (layers and nodes) and training algorithms still remain a
difficult issue in ANNs applications (Maier & Dandy, 2000). ARIMA model and
ANN are often compared with mixed conclusions in terms of superiority in
forecasting performance. Survey of the literature shows that both ARIMA and ANN
models performed well in different cases (Zhang, 1999). Since the real world highly
complex, there exits some linear and nonlinear patterns in the time series
simultaneously.
6
Other than ANN, the Support Vector Machine (SVM) model which was first
suggested by Vapnik (1995), has recently been used in a range of applications such
as in data mining, classification, regression and time series forecasting (Tay & Cao,
2001; Zhang, 2003). Several studies showed that SVM is a powerful methodology
and has become most wanted in studies due to ability to solve most nonlinear
regression and time series problem. SVM also become a new method to model in
hydrology modelling such as stream flow forecasting (Asefa et al., 2006), flood
stage forecasting (Yu et al., 2006), rainfall runoff modeling (Dibike & Solomatine,
2001) and etc. However, the standard SVM is solved using complicated quadratic
programming methods, which are often time consuming and has higher
computational burden because of the required constrained optimization
programming.
Suykens et al. (2005) introduced a revolution of SVM called Least Square
Support Vector Machine (LSSVM) to encounter the SVM quadratic programming
problem. The LSSVM encompasses similar advantages as SVM, but its additional
advantage is that it requires solving a set of only linear equations, which are much
easier and simpler computationally. The method uses equality constraints instead of
inequality constraints and adopts the least squares linear system as its loss function,
which is computationally attractive. LSSVM also has good convergence and high
precision, hence this method is easier to use than quadratic programming solvers in
SVM method. The LSSVM has been used successfully employed in various areas of
pattern recognition and regression problems (Hanbay, 2009; Kang et al., 2008). In
the water resource, the LSSVM method has received very little attention literature
and only a few applications of LSSVM to modeling of environmental and ecological
systems such as water quality prediction (Yunrong & Liangzhong, 2009).
The Self Organizing Map (SOM) proposed by Kohonen (2001) is one
category of ANN that was first used as an information processing tool in the fields of
speech and image recognition. The SOM has developed increasing interest in water
resources application such as classification of satellite imagery data and rainfall
estimation (Murao et al., 1993), rainfall-rounoff modeling (Hsu et al., 2002),
7
typhoon-rainfall forecasting (Lin & Wu, 2009), river flood forecasting (Chang et al.,
2007), water resource problems (Kalteh et al., 2008), and model evaluation (Herbst
& Casper, 2008; Herbst et al., 2009b). SOM is an excellent method to cluster data
according to their similarity. As for SOM, this technique can project high-
dimensional input space on a low dimensional topology so as to allow the number of
clusters to be determined by inspection (Lin & Chen, 2006). Therefore, SOM
pursues a goal that is conceptually different from that of clustering (Wu & Chow,
2004).
Improving the forecasting accuracy is a fundamental yet a difficult task
facing decision-makers in many areas. Using hybrid models has become a common
practice to improve the forecasting accuracy. There are several studies that show
hybrid models can be an effective way to improving predictions achieved by either
of the models used separately (Zhang, 2003; Jain & Kumar, 2007). In recent years,
more hybrid models were proposed where the models are combinations of clustering
techniques with other forecasting model, have successfully solved many predictions
problems such as a hybrid of SOM with ANN (Pal et al., 2003), SOM with SVM
(Cao, 2003; Huang & Tsai, 2009), and other models (Chang & Liao, 2006; Chang et
al., 2007).
1.3 Problem Statement
The ARIMA and ANN have been shown as powerful tools for time series
forecasting. The ARIMA can only capture the linear instead nonlinear data.
However, the time series data full with nonlinearity. At the mean time, the ANN has
shown their ability in capturing the linear as well as nonlinear data, and also
provides a reliable forecasting result. There are some disadvantages of the ANN
where the network structure is hard to determine and it is usually determined by
using a trial-and-error approach (Kisi, 2004).
8
Because of this matter, the forecasting result may be inaccurate or invalid.
An incorrect or inaccurate prediction will cause such a huge loss and inconvenience
to the management and to the end-user. The suitability of forecasting method
depending on the type and amount of the available data. The researcher believed by
applying the hybrid model is an alternative way to solve the problem facing in
forecasting area. There are many types of hybrid model that might be useful in
forecasting, however the development of hybrid model have increase every day. In
this study, the hybrid model of SOM-LSSVM is proposed to improve the accuracy
of prediction for river flow forecasting. Therefore, the research question is stated as
below:
“How to design a hybrid model based on SOM clustering technique and LSSVM
model that are capable to improve the prediction accuracy”.
The other issue is considered in order to solve the problem:
i. Will the LSSVM model fits the observation values of the monthly river
flow?
ii. Since the SOM-LSSVM is the most promising technique in forecasting,
will the hybrid SOM-LSSVM outperformed others?
The ARIMA, ANN, LSSVM and the hybrid model of SOM-LSSVM were
tested and compare to each others, and to ensure the capability and applicability of
these models in predicting the monthly river flow forecasting. To verify the
application of this approach, three different rivers were selected as case studies
which are Bernam River, Selangor River and Muda River.

9
1.4 Research Goal
The goal of this research is to develop and propose a new hybrid model
which combines the SOM with the LSSVM (SOM-LSSVM) for river flow
forecasting. The proposed hybrid SOM-LSSVM is expected to be useful for river
flow forecasting.
1.5 Research Objectives
The objectives of this research are:
i. To explore the potential application of LSSVM model for river flow
forecasting.
ii. To propose a hybrid model for river flow forecasting by combining the SOM
and LSSVM.
iii. To evaluate the performance of the proposed hybrid model compared with
the other benchmark individual models such as ANN, ARIMA and LSSVM.
1.6 Research Scope
The scopes of this research are:
i. This research focused on proposing a new method for river flow forecasting
using a hybrid model. The proposing model is a hybrid of SOM-LSSVM.
ii. Several map sizes of SOM are utilized using trail and error approach.
10
iii. The monthly river flow from three different rivers were selected as case
studies. The data were obtained from Department of Irrigation and Drainage,
Ministry of Natural Resources and Environment, Malaysia.
iv. Several evaluation measures used to verify the best models which are Root
Mean Square Error (RMSE), Mean Absolute Error (MAE) and Correlation
Coefficient (r). The model with smallest MAE, RMSE and largest r values
are considered as the best model.
1.7 Significance of The Study
This research is expected to contribute towards the hydrological field in term
of river flow forecasting. From this study the LSSVM and hybrid SOM-LSSVM
models is proposed for the forecasting, and the obtained result demonstrate the
proposed method exhibits higher accuracy and superb predictive capability in
comparison to some previous models available in the literature.
153
REFERENCES
Abrahart, R. J. and See, L. (2000). Comparing neural network and autoregressive
moving average techniques for the provision of continuous river flow
forecasts in two contrasting catchments. Hydrological Process (14): 2157–
2172.
Ahmad, S., Khan, I. H., and Parida, B. P. (2001). Performance Of Stochastic
Approaches For Forecasting River Water Quality. Water Research (35):
4261-4266.
Asefa, T., Kemblowski, M., Mckee M. and Khalil, A. (2006). Multi-Time Scale
Stream Flow Predictions: The Support Vector Machines Approach. Journal
of Hydrology. 318 (1-4): 7-16.
Aqil, M., Kita, K., and Macalino, M. (2006). A Preliminary study on the suitability
of data driven approach for continuous water laeve modeling. International
Journal of Computer Science. 1(4): 246-252.
Behzad, M., Asghari, K., Eazi, M., and Palhang, M. (2009). Generalization
performance of support vector machines and neural networks in runoff
modeling. Expert Systems with Applications 36(4): 7624-7629.
Birkinshaw S. J. , Parkin G., Rao, Z. (2008). A Hybrid Neural Networks And
Numerical Models Approach For Predicting Groundwater Abstraction
Impacts. Journal of Hyrdoinformatics. 127-137.
154
Bowerman, B. L. and O'Connell, R. T. (1987). Time Series Forecasting: Unified
Concepts and Computer Implementation. USA: PWS-Kent Publishing
Company.
Bowden, G. J., Maier, H. R., and Dandy, G.C. (2002). Optimal division of data for
neural network models in water resources applications. Water Resources
Research 38(2): 1010.
Bowden, G. J., Dandy, G. C., and Maier, H. R. (2005a). Input determination for
neural network models in water resources applications. Part 1--background
and methodology. Journal of Hydrology 301(1-4): 75-92.
Bowden, G. J., Dandy, G. C., and Maier, H. R. (2005b). Input determination for
neural network models in water resources applications. Part 2. Case study:
forecasting salinity in a river. Journal of Hydrology 301(1-4): 93-107.
Box, G. E. P., Jenkins, G. M., and Reinsel, G. C. (2008). Time Series Analysis:
Forecasting and Control. New Jersey: John Wiley Publication.
Budayan, C., Dikmen, I., and Birgonul, M. T. (2009) Comparing The Performance
of Traditional Cluster Analysis, Self-Organizing Maps And Fuzzy C-Means
Method For Strategic Grouping. Expert Systems With Applications. 36(9):
11772-11781.
Cao, L. (2003). Support vector machines experts for time series forecasting.
Neurocomputing. 51: 321-339.
Chang, F.J., Chang, L.C., Wang, Y. C. (2007). Enforced self-organizing map neural
networks for river flood forecasting. Hydrological Processes. 21(6): 741-
749.
Chang, P. C. and Liao, T. W. (2006). Combining SOM and fuzzy rule base for flow
time prediction in semiconductor manufacturing factory. Applied Soft
Computing. 6(2): 198-206.
155
Cheung, K. H., Szeto, K. Y., Tam, K. Y. (1996). Maximum-entropy approach to
identify time series lag structure for developing intelligent forecasting
systems. International Journal of Computational Intellegence and
Organization. 1(2): 94-106.
Chen, K.-Y. and Wang, C.-H. (2007) A Hybrid SARIMA And Support Vector
Machines In Forecasting The Production Values of The Machinery Industry
In Taiwan. Expert Systems With Applications. 32(1): 254-264.
Corzo, G. A., Solomatine, D. P., Hidayat, Wit, M., Werner, M., Uhlenbrrook, S.,
Price, R. K. (2009). Combining semi-distributed process-based and data-
driven models in flow simulation: a case study of the Meuse river basin.
Hydrology and Earth System Science. 13: 1619-1634.
Cristianini, N. and John S. T. (2000). An Introduction To Support Vector Machines
And Other Kernel Based Learning Methods. Cambridge University Press.
Deng, S. and Yeh, T.-H. (2010). Applying least squares support vector machines to
the airframe wing-box structural design cost estimation. Expert Systems with
Applications. 37(12): 8417-8423.
DeLurgio, S. A. (1998). Forecasting principles and applications. Boston: McGraw-
Hill
Diebold, F. X. (2007). Elements Of Forecasting. USA: Thomson.
Dibike, Y. B. and Solomatine, D. P. (2001). River Flow Forecasting Using Artificial
Neural Networks. Physics And Chemistry Of The Earth, Part B: Hydrology,
Oceans And Atmosphere, 26: 1-7.
Dibike, Y. B., Slavco, V., Solomatine, D. P., Abbott, M. B. (2001). Model Induction
with Support Vector Machines: Introduction and Applications. Journal of
Computing in Civil Engineering 15(3): 208-216.
156
Dolling, O.R. and Varas, E.A. (2003) Artificial neural networks for streamflow
prediction. Journal of Hydraulic Research. 40(5): 547-554.
Enke, D. and Thawornwong, S. (2005). The use of data mining and neural networks
for forecasting stock market returns. Expert Systems with Applications 29(4):
927-940.
Faruk, D. Ö. (2010). A Hybrid Neural Network and Arima Model For Water Quality
Time Series Prediction. Engineering Applications of Artificial Intelligence
23(4): 586-594.
Fauset, L. (1994). Fundamentals Of Neural Networks Architectures, Algorithms And
Applications. New Jersey: Prentice Hall
Gestel, T. V., Suykens, J. A. K., Baestaens, D.-E., Lambrechts, A., Lanckriet, G.,
Vandaele, B., De Moor, B., Vandewalle, J. (2001). Financial time series
prediction using least squares support vector machines within the evidence
framework. Neural Networks, IEEE Transactions 12(4): 809-821.
Gencoglu, M. T. and Uyar, M. (2009). Prediction Of Flashover Voltage Of
Insulators Using Least Squares Support Vector Machines. Expert Systems
With Applications. 36(7): 10789-10798.
Hall, M. J. and Minns, A. W. (1999). The classification of hydrologically
homogeneous regions. Hydrological Sciences Journal. 44(5): 693-704
Hamza, H. (2009). Water quality trend at the upper part of johor river in relation to
rainfall and runoff pattern. Master Thesis. Universiti Teknologi Malaysia,
Skudai.
157
Hanbay, D. (2009). An expert system based on least square support vector machines
for diagnosis of valvular heart disease. Expert Systems with Applications.
36(4): 8368-8374.
Haofei, Z., Guoping, X., Fangting, Y. and Han, Y (2007). A Neural Network Model
Based On The Multi-Stage Optimization Approach For Short-Term Food
Price Forecasting In China. Expert Systems With Applications 33: 347-356.
Hecht-Nielsen, R. (1990). Neurocomputing. Menlo Park, CA: Addison-Wesley.
Herbst, M. and Casper, M. C. (2008). Towards model evaluation and identification
using Self-Organizing Maps. Hydrology Earth System Science. 12: 657-667.
Herbst, M., Casper, M. C., Grundmann, J., Buchholz, O. ( 2009a). Comparative
analysis of model behaviour for flood prediction purposes using Self-
Organizing Maps. Natural. Hazards Earth System Science. 9: 373-392.
Herbst, M., Casper, M. C., and Gupta, H. V. (2009b). Mapping model behaviour
using Self-Organizing Maps. Hydrology Earth System Science. 13: 395-409.
Huang, W., Bing, X.B., Hilton, A. (2004). Forecasting Flow In Apalachicola River
Using Neural Networks. Hydrological Processes 18: 2545-2564.
Huang, C.-L. and Tsai, C.-Y. (2009). A Hybrid SOFM-SVR With A Filter-Based
Feature Selection For Stock Market Forecasting. Expert Systems With
Applications, 36(2): 1529-1539.
Hung, N. Q., Babel, M. S., Weesakul, S., Tripathi, N. K. ( 2009). An artificial neural
network model for rainfall forecasting in Bangkok, Thailand. Hydrology
Earth System Science. 13: 1413–1425.
Hsu, S. -H., Hsieh, J. J., P.-A., Chih, T. -C., Hsu, K.-C. (2009). A two-stage
architecture for stock price forecasting by integrating self-organizing map
158
and support vector regression. Expert Systems with Applications 36(4): 7947-
7951
Hsu, K., Gupta, H.V., Gao,X., Sorooshian,S., Imam, B. (2002). Self-organizing
linear output map (SOLO): an artificial neural network suitable for
hydrologic modeling and analysis. Water Resources Research 38(12): 1302.
Ho, S. L. and Xie, M. (1998). The Use Of Arima Models For Reliability Forecasting
And Analysis. Computers & Industrial Engineering. 35(1-2): 213-216.
Jain, A. and Kumar, A. M. (2007). Hybrid Neural Network Models For Hydrologic
Time Series Forecasting. Applied Soft Computing, 7(2): 585-592.
Jauhir, H ., Zain, M. S., Mustafa, Z. Khamis, A. (2001). Ramalan Kepekatan
Oksigen Terlarut Menggunakan Analisis Siri Masa di Sungai Langat, Hulu
Langat Selangor. Matematika 17(2): 77-87.
Jeong, K. -S., Hong, D.-G., Byeon, M.-S., Jeong, J.-C., Kim, H.-G., Kim, D.-K.,
Joo, G.-J. (2010). Stream modification patterns in a river basin: Field survey
and self-organizing map (SOM)application. Ecological Informatics. 5: 293-
303.
Kang, S. (1991). An investigation of the Use of Feedforward Neural Network for
Forecasting., Kent State University. Ph.D. Thesis.
Kang, Y.W., Li, J., Cao, G.Y., Tu, H.Y., Li, J. Yang, J. (2008). Dynamic
temperature modeling 10 of an SOFC using least square support vector
machines. Journal of Power Sources 179: 683-692.
Kalteh, A. M., Hjorth, P., Berndtsson, R. (2008). Review of the self-organizing map
(SOM) approach in water resources: Analysis, modelling and application.
Environmental Modelling & Software 23(7): 835-845.
159
Katimon, A. and Demun, A. S. (2004). Water Use Trend At Universiti Teknologi
Malaysia: Application Of Arima Model. Journal Teknologi. 41b: 47–56.
Karunanithi, N., Willam J. G., Darrel W., Ken B. (1994). Neural Networks For
River Flow Prediction. Journal of Computing in Civil Engineering. 8(2):
201-220.
Keskin, M. E. and Taylan, D. (2009). Artificial Models For Interbasin Flow
Prediction In Southern Turkey. Journal Of Hydrologic Engineering. 14(7):
752-758.
Kisi, O. (2004). River Flow Modeling Using Artificial Neural Networks. Journal Of
Hydrologic Engineering. 9(1): 60-63.
Khashei, M. and Bijari, M. (2010). An Artificial neural network (p,d,q) model for
timeseries forecasting. Expert Systems with Applications. 37: 479-489.
Kohonen, T. (1997). Self-Organizing Maps. New York: Springer.
Kohonen, T. (2001). Self-Organizing Maps. New York, Springer.
Kuo, R. J., Ho, L. M. and Hu, C. M. (2002). Integration Of Self-Organizing Feature
Map And K-Means Algorithm For Market Segmentation. Computers &
Operations Research, 29(11): 1475-1493.
Kuo, R. J., An, Y. L., Wang, H. S. and Chung, W. J. (2006) Integration Of Self-
Organizing Feature Maps Neural Network And Genetic K-Means Algorithm
For Market Segmentation. Expert Systems With Applications. 30(2): 313-
324.
Ley, R., Casper,M. C., Hellebrand,H., Merz,R. (2011). Catchment classification by
runoff behaviour with self-organizing maps (SOM). Hydrology Earth System
Science Discussions 8: 3047–3083.

160
Lehmann, A. and Rode, M. (2001). Long-Term Behaviour And Cross-Correlation
Water Quality Analysis Of The River Elbe, Germany. Water Research
35(9): 2153-2160
Lin, G.-F. and Chen, L.-H. (2006) Identification Of Homogeneous Regions For
Regional Frequency Analysis Using The Self-Organizing Map. Journal of
Hydrology. 324(1-4), 1-9.
Lin, G.-F. and Wu, M.-C. (2007). A SOM-Based Approach To Estimating Design
Hyetographs Of Ungauged Sites. Journal of Hydrology. 339 (3-4), 216-226.
Lin, G.-F. and Wu, M.-C. (2009) A Hybrid Neural Network Model For Typhoon-
Rainfall Forecasting. Journal Of Hydrology. 375(3-4), 450-458.
Modarres, R. (2007). Streamflow drought time series forecasting. Stoch. Environ.
Res. Risk Assess 21: 223-233.
Moreno, D., Marco, P., and Olmeda, I. (2006) Self-Organizing Maps Could Improve
The Classification Of Spanish Mutual Funds. . European Journal Of
Operational Research, 147, 1039–1054.
Mostafa, M. M. (2009) Clustering The Ecological Footprint Of Nations Using
Kohonen's Self-Organizing Maps. Expert Systems With Applications, In
Press, Corrected Proof.
Muhamad, J. R. and J. N. Hassan (2005). Khabur River flow using artificial neural
networks. Al-Rafidain Engineering 13(2): 33-42.
Murao, H., Nishikawa,I., Kitamura,S., Yamada,M., and Xie, P. (1993). A hybrid
neural network system for the rainfall estiamtion using saellite imagery.
Proceedings of International Joint Conference on Neural Networks, IEEE
Press.
161
Noakes, D. J., Mcleod, L. A., and Hipel, K. W. (1985). Forecasting monthly
riverflow time series. International Journal of Forecasting: 179-190.
Faruk, O. D. (2010). A Hybrid Neural Network And Arima Model For Water
Quality Time Series Prediction. Engineering Applications Of Artificial
Intelligence, 23, 586-594.
Pal, N. R., Pal, S., Das, J., Majumdar, K. (2003) SOFM-MLP: A Hybrid Neural
Network For Atmospheric Temperature Prediction. Ieee Trans. On Syst.,
Man, Cybernetics. 41(12), 2783-2791.
Palmer, A., Mantano, J. J., Sese, A. (2005). Designing an artificial neural network
for forecasting tourism time series. Tourism Management. 27(5): 781-790.
Plummer, E. A. (2000). Time series forecasting with feed-forward neural networks:
Guidelines and limitations, Master Thesis. University of Wyoming.
Prybutok, V.R., Yi, J. and Mitchell D. (2000). Comparison of neural network
models with ARIMA and regression models for prediction of Houston‟s
daily maximum ozone concentrations. European Journal of Operational
Research. 122(1): 31–40.
Refenes, A. P. N., Burgess, A. N., Bentz, Y. (1997). Neural networks in financial
engineering: a study in methodology. IEEE Transactions on Neural
Networks. 8(6): 1222-1267.
Roadknight, C. M., Balls, G. R., Mills, G.E, Palmer-Brown, D. (1997). Modeling
complex environmental data. IEEE Transactions on Neural Networks. 8(4):
852-862.
Rui Xu, D. C. W. (2009). Clustering, IEEE
162
Sahai, A.K., Soman, M.K., Satyan V. (2000). All India Summer Monsoon Rainfall
Prediction Using An Artificial Neural Network. Climate Dynamics. 16: 291-
302.
Samui, P. (2011). Application of Least Square Support Vector Machine (LSSVM)
for Determination of Evaporation Losses in Reservoirs. Scientific Research.
Schreider, S. Y., Jakeman, A. J., Dyer, B. G., Francis, R. I. (1997). A Combined
Deterministic And Self-Adaptive Stochastic Algorithm For Streamflow
Forecasting With Application To Catchments Of The Upper Murray Basin,
Australia. Environmental Modelling & Software. 12(1): 93-104.
Shabri, A. (2001) Comparision Of Time Series Forecasting Methods Using Neural
Networks And Box-Jenkins Model. Matematika,, 17, 1-6.
Sharda, R. (1994). Neural Networks for the MS/OR analyst: An application
bibliography. Interfaces 24(2): 116-130.
Sharda, R. and Patil, R. B. (1992). Connectionist approach to time series prediction:
an empirical test. Journal of Intelligent Manufacturing. 3: 317-323.
Srinivas, V. V., Tripathi, S., Rao, A. R., Govindaraju, R. S. (2008). Regional flood
frequency analysis by combining self-organizing feature map and fuzzy
clustering. Journal of Hydrology 348(1-2): 148-166.
Solomatine, P. D., Maskey, M., Shrestha, D.L. (2008). Instance-based learning
compared to other data-driven methods in hydrological forecasting.
Hydrological Processes 22: 275-287.
Suykens J.A.K. , Gestel, T. V., Brabanter, J. D. , Moor, B. D., Vandewalle, J.
(2005). Least Square Support Vector Machine. New Jersey: World
Scientific.
163
Tan, C. N. W. and Wittig, G. E. (1993). A study of the parameters of a
backpropagation stock price prediction model. The First New Zealand
International Two Stream Conference on Artificial Neural Networks and
Expert Systems (ANNES. University of Otago, Dunedin, New Zealand, IEEE
Computer Society Press.
Tang, Z. and Fishwick, P. A. (1993). Feedforward Neural Nets as Models for Time
Series Forecasting. ORSA Journal on Computing. 5(4): 374-385.
Tay, F. E. H., and Cao, L. J. (2001). Improved Financial Time Series Forecasting By
Combining Support Vector Machines With Self-Organizing Feature Map.
Intelligent Data Analysis. 5: 339–354.
Vapnik., V. (1995). The Nature Of Statistical Learning Theory. New York:
Springer.
Viessman, W. J., Lewis, G. L., and Knapp, J. W. (1989). Introduction To Hydrology.
Singapore: Harper & Row.
Wang, J. and Yan, D. (2004). A High Precision Prediction Method By Using
Combination Of Elman And SOM Neural Networks. Advances In Neural
Networks. 3174: 943-949.
Wang, H. and Hu, D. (2005) Comparison Of SVM And LSSVM For Regression.
International Conference On Neural Networks And Brain, 2005. 1: 279-283.
Wang, W., Gelder, P. H. A. J. M. V., Vrijling, J. K., Ma, J. (2006). Forecasting
Daily Streamflow Using Hybrid Ann Models. Journal of Hydrology. 324 (1-
4):383-399.
Wang, W.-C., Chau, K.-W., Cheng, C.-T.., Qiu, L. (2009). A comparison of
performance of several artificial intelligence methods for forecasting
monthly discharge time series. Journal of Hydrology. 374(3-4): 294-306
164
Wong, F. S. (1991). Time series forecasting using back propagation neural
networks. Neurocomputing 2: 147–159.
Wu, S., and Chow, T. W. S. (2004). Clustering of the self-organizing map using a
clustering validity index based on inter-cluster and intra-cluster density.
Pattern Recognition. 37(1): 175–188.
Wu, C. L., Chau, K. W., Li, Y. S. (2008). River stage prediction based on a
distributed support vector regression. Journal of Hydrology. 358(1-2): 96-
111.
Yu, P.-S., Chen, S.-T., Chang, I. F. (2006). Support vector regression for real-time
flood stage forecasting. Journal of Hydrology. 328(3-4): 704-716.
Yunrong, X. and Liangzhong, J. (2009) Water Quality Prediction Using Ls-Svm
And Particle Swarm Optimization. Second International Workshop On
Knowledge Discovery And Data Mining, 2009.
Yusof, N. M. (2006). Time Series Modeling And Designing of Artificial Neural
Network (ANN) For Revenue Forecasting. Master Thesis. Universiti
Teknologi Malaysia, Skudai.
Zaiwen, L., and Xiaoyi, W. (2009). Research on Water Bloom Prediction Based on
Least Squares Support Vector Machine. WRI World Congress on Computer
Science and Information Engineering, 2009.
Zou, H. F., Xia, G. P., Yang, F. T., Wang, H. Y. (2007). An Investigation And
Comparison Of Artificial Neural Network And Time Series Models For
Chinese Food Grain Price Forecasting. Neurocomputing. 70(16-18): 2913-
2923.
Zhang, Y. (1992). Prediction Of Traffic Fluctuation In Telephone Networks With
Neural Networks. IEEE. 909-912.

165
Zhang, G., Eddy, P. B., Michael, Y. H. (1998). Forecasting with artificial neural
networks: The state of the art. International Journal of Forecasting 14(1):
35-62.
Zhang, G. P. (2003) Time Series Forecasting Using A Hybrid ARIMA And Neural
Network Model. Neurocomputing, 50: 159-175.


