SIEMENS-UV OPTICAL FLAME DETECTION MONA HEMENDRA RAITHATHA College of Engineering University of California, Berkeley Fung Technical Report No. 2013.06.01 http://www.funginstitute.berkeley.edu/sites/default/files/OpticalFlameDetection.pdf June 1, 2013 130 Blum Hall #5580 Berkeley, CA 94720-5580 | (510) 664-4337 | www.funginstitute.berkeley.edu
Transcript
SIEMENS-UV OPTICAL FLAME DETECTION
MONA HEMENDRA RAITHATHA
College of EngineeringUniversity of California, Berkeley
130 Blum Hall #5580 Berkeley, CA 94720-5580 | (510) 664-4337 | www.funginstitute.berkeley.edu
Lee Fleming, Faculty Director, Fung Institute
Advisory Board
Coleman FungFounder and Chairman, OpenLink Financial Charles GiancarloManaging Director, Silver Lake PartnersDonald R. Proctor Senior Vice President, O�ce of the Chairman and CEO, CiscoIn Sik RheeGeneral Partner, Rembrandt Venture Partners
Fung Management Lee FlemingFaculty DirectorBeth HochDirector, Academic A�airs
Permission to make digital or hard copies of all or part of this work for personal or classroom use is granted without fee provided that copies are not made or distributed for pro�t or commercial advantage and that copies bear this notice and the full citation on the �rst page. To copy otherwise, to republish, to post on servers or to redistribute to lists, requires prior speci�c permission.
The Coleman Fung Institute for Engineering Leadership, launched in January 2010, prepares engineers and scientists – from students to seasoned professionals – with the multidisciplinary skills to lead enterprises of all scales, in industry, government and the nonpro�t sector.
Headquartered in UC Berkeley’s College of Engineering , the Fung Institute combines leadership coursework in technology innovation and management with intensive study in an area of industry specialization. This integrated knowledge cultivates leaders who can make insightful decisions with the con�dence that comes from a synthesized understanding of technological, marketplace and operational implications.
130 Blum Hall #5580 Berkeley, CA 94720-5580 | (510) 664-4337 | www.funginstitute.berkeley.edu
Abstract:
The increasingly stringent air pollution standards that prompted the transition fromtraditional di�usion based combustion to premixed-type combustion in the early 1990s hassigni�cantly increased the need to detect �ame presence in gas turbines. However, usingpremixed air reduces the stability of the �ame and thereby increases the likelihood of �ashbackphenomena. Water accumulation on the lens of the �ame sensor reduces the system’s ability tocorrectly monitor �ame inside the turbine. Furthermore, multi-fuel gas turbines are able to burndiesel fuel, and there is an occasional build-up of oil in the combustor can. In e�ect, water andoil buildup on the lens may change the focal length of the lens causing limited light wavetransmission.
To determine the response of sensors to �ame �icker, background radiation and water-oilbuildup on lenses, three tests were conducted in the combustion lab at the University ofCalifornia, Berkeley under atmospheric conditions. A hydrocarbon �ame spectra mainlycomprises of shorter wavelengths i.e. UV wavelengths. Hence, all the sensors selected were UVsensors. Five sensors - General Electric Reuter Stokes (GE), Ametek, Azbil, Forney, andIndustrial Turbine Services (ITS) were chosen for testing. The results of the three tests indicateGE, ITS, and Ametek are the best sensors with similar performance. Hence, based on the seriesof tests conducted, as well as a cost and market analysis, the recommendation for Siemens wouldbe to use either Ametek or ITS sensor.
130 Blum Hall #5580 Berkeley, CA 94720-5580 | (510) 664-4337 | www.funginstitute.berkeley.edu
SIEMENS-UV OPTICAL FLAME DETECTION
BY
MONA HEMENDRA RAITHATHA
THESIS
Submitted in partial fulfillment of the requirements
for the degree of Master of Engineering in Mechanical Engineering
in the Graduate College of the
University of California at Berkeley, 2013
Berkeley, California
Advisor:
Professor Albert P. Pisano
2
ABSTRACT
The increasingly stringent air pollution standards that prompted the transition from
traditional diffusion based combustion to premixed-type combustion in the early 1990s has
significantly increased the need to detect flame presence in gas turbines. However, using
premixed air reduces the stability of the flame and thereby increases the likelihood of flashback
phenomena. Water accumulation on the lens of the flame sensor reduces the system’s ability to
correctly monitor flame inside the turbine. Furthermore, multi-fuel gas turbines are able to burn
diesel fuel, and there is an occasional build-up of oil in the combustor can. In effect, water and
oil buildup on the lens may change the focal length of the lens causing limited light wave
transmission.
To determine the response of sensors to flame flicker, background radiation and water-oil
buildup on lenses, three tests were conducted in the combustion lab at the University of
California, Berkeley under atmospheric conditions. A hydrocarbon flame spectra mainly
comprises of shorter wavelengths i.e. UV wavelengths. Hence, all the sensors selected were UV
sensors. Five sensors - General Electric Reuter Stokes (GE), Ametek, Azbil, Forney, and
Industrial Turbine Services (ITS) were chosen for testing. The results of the three tests indicate
GE, ITS, and Ametek are the best sensors with similar performance. Hence, based on the series
of tests conducted, as well as a cost and market analysis, the recommendation for Siemens would
be to use either Ametek or ITS sensor.
3
To my Family
4
ACKNOWLEDGMENTS
This project would not have been possible without the support of many people. Many
thanks to my adviser, Albert P. Pisano, who read my drafts and helped make some sense of the
confusion. Also, thanks to my committee member, Liwei Lin, who offered support. Many thanks
to Fabian Goericke, Jim Cheng, Roseane Warren, and Joanne Lo for offering guidance and help.
Thanks to Siemens Energy for the visit to their facility in Orlando, which gave direction to the
project. And finally, thanks to my parents, brother, and numerous friends who endured this long
process with me, always offering support and love.
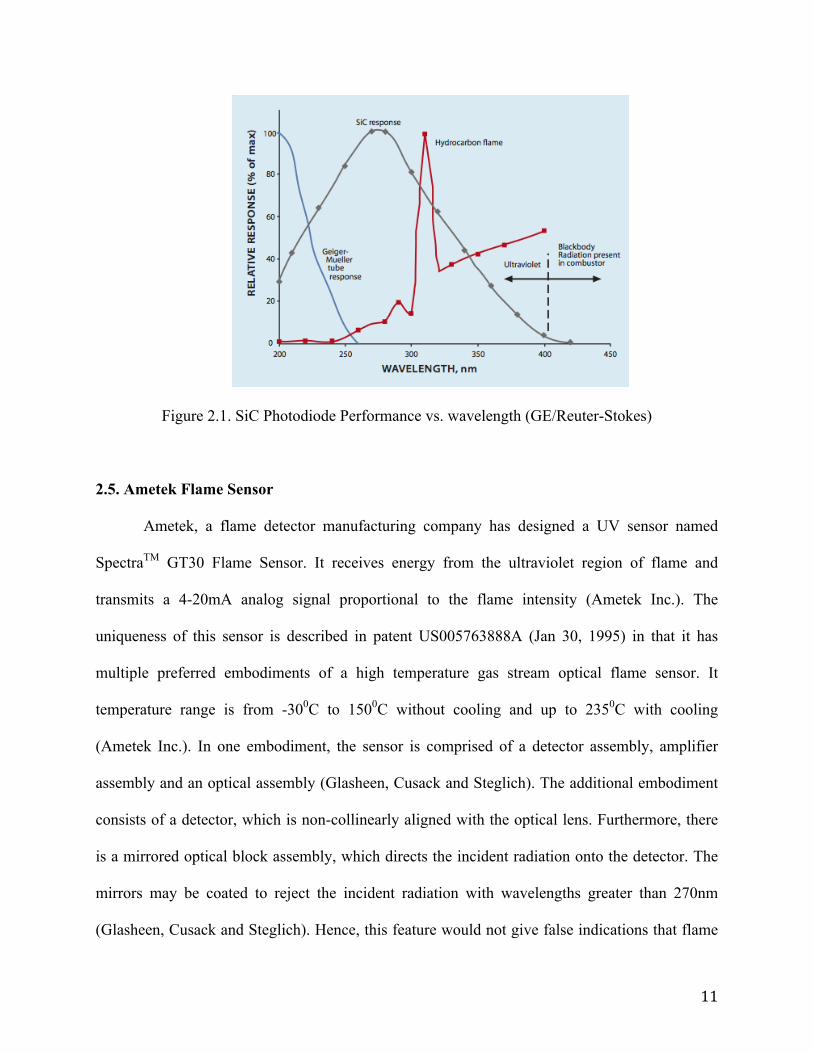
The UV flame sensor designed by ITS uses a silicon carbide photodiode and a quarzglass
window. Its temperature range is the same as that of the Ametek flame sensor and its spectral
sensitivity is from 210-380nm (ITS- Industrial Turbine Services). This sensor was introduced in
2012 and no patents have been filed yet. However, its components are the same as the other
sensors and hence the performance should be similar as well.
Based on the previous work done, it is evident that a UV sensor is the best approach to
solve our problem. A SiC photodiode peaks at the right wavelengths, which makes is suitable for
turbine use. To see which sensor is the best, a series of tests would be done on the sensors. The
sensor with best results would be suggested to Siemens. The method used to carry the tests is
describe in the section below.
13
CHAPTER 3: METHODOLOGY
Three series of tests (chopper wheel, water-oil, and infrared) were done to evaluate the
performance of GE Reuter Stokes, Ametek, Forney, ITS and Azbil flame sensor. I did the
chopper wheel test and water- oil test with another team member, and the results were analyzed
together. However, all the tests and results are mentioned in this report so that final conclusion
can be reached.
3.1. Materials
Five UV flame sensors- GE Reuter Stokes, Ametek, Forney, ITS and Azbil were used to
perform the test. The criterion for choosing the sensor was based on its operating temperature
and the range of wavelength detection. The details are summarized in Table 3.1. The tests were
carried out in 33 Hesse Hall of UC Berkeley. A Bunsen burner was used to emit a flame and a
spectrometer was used to measure its spectral emission. Clamp stands were used to hold sensors
and a 24V DC power supply was used to power the flame sensors. A chopper wheel with varying
frequency (15Hz-200Hz) was used mimic the flame flicker. To carry out the oil and water test,
an additional container was custom made, which had adjustable quartz lens at both ends to give
different oil and water thickness. No. 2 diesel was used since it is this diesel that builds up in
front of the lens in gas turbines. For infrared test, a propane torch was used to heat the steel until
it was red-hot. The spectrometer was used to know the exact spectral emission of the infrared
waves from the red-hot steel. To record the output a DAQ (digital acquisition) board was used,
which converts the output into digital numeric values. These results were then plotted with the
help of Labview and Microsoft Excel to carry out frequency analysis.
14
Table 3.1. Properties of Sensors
Name Temperature (with cooling) Detection Range Cost ($)
Target 450 0C UV -
GE 150 0C (235 0C) UV (200-400 nm) 3800
Ametek 125 0C (371 0C) UV (200-400 nm) 1800
Forney 65 0C (400 0C) UV (295-340 nm) 1400
ITS 150 0C (235 0C) UV (210-380nm) 4000
Azbil 100 0C UV (200-400 nm) N/A
3.2. Methodology
All the flame sensors were placed so that they faced a flame set 10’’ away. The height of
the flame sensor varies depending on its lens position; hence it was ensured (by using a ruler as a
reference) that the entire lens could see the blue cone inside the flame (fig. 3.1). The advantage
of this set up is that all the sensors can be tested simultaneously, giving consistent results and
saving time. The sensors were connected as shown in fig.3.2. A 390-Ω resistor was used to
complete the DAQ circuit. This was chosen based on the current output range of the sensor and
the optimum voltage output of the DAQ board. All sensors performed in the range of 20-40mA
and the maximum voltage of the DAQ board was 10V. Based on the results of ohm’s law (V=IR)
a 390-Ω resistor was used. (Ametek Inc.) (GE/Reuter-Stokes) (ITS- Industrial Turbine Services).
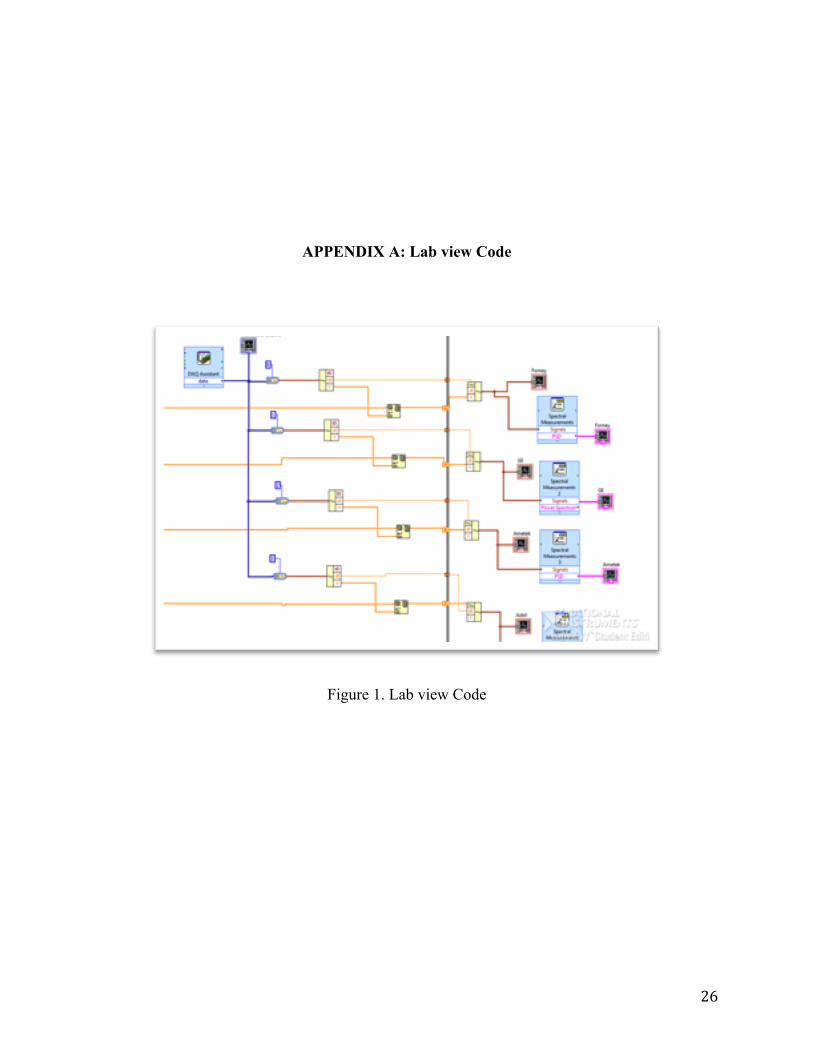
The code used in lab view converts signal to graphical form (Appendix A). Once this preparation
was done, the flame was turned on and the airflow was adjusted until the inner blue cone of the
flame was seen. To identify the flame on voltage, the flame sensor viewed the flame and the data
was recorded on Labview. To find the flame off voltage, we put a hand in between the flame and
the sensor. It was assumed that the hand would not allow radiation to pass through and wouldn’t
15
get hot quickly enough as to act like a secondary radiation source. This data was recorded on
Labview as well. The procedure for each test is described below.
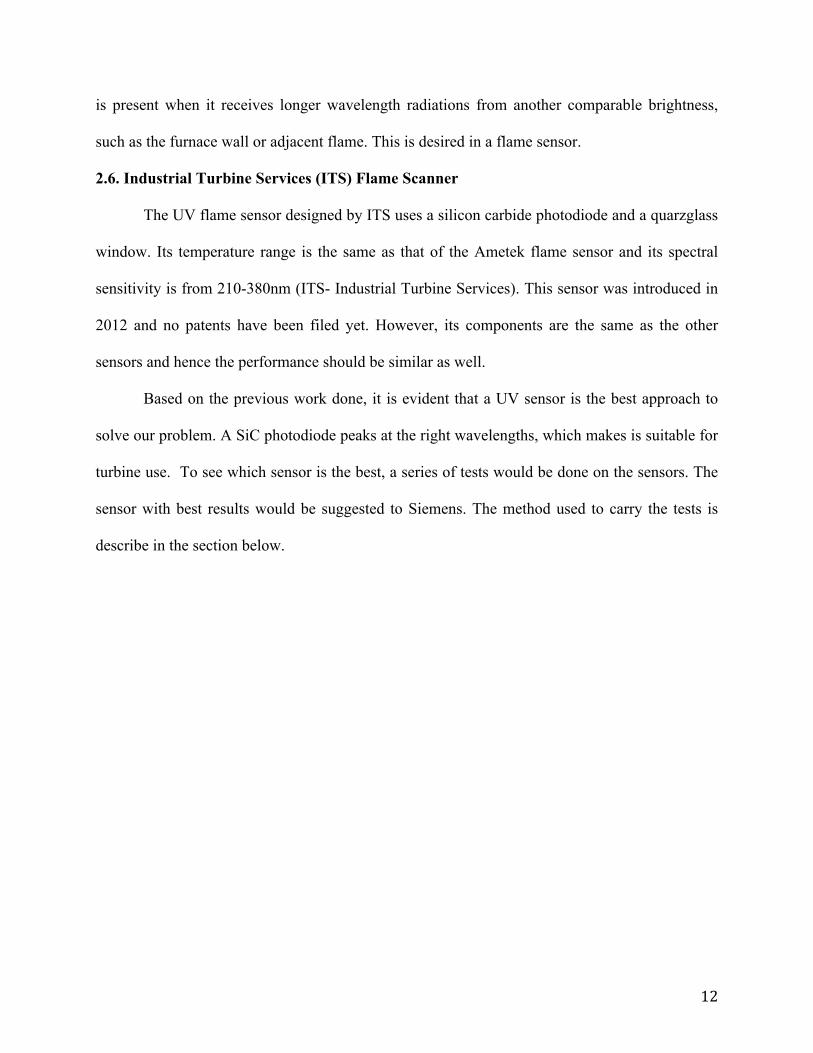
Figure 3.1. Horizontal test set up
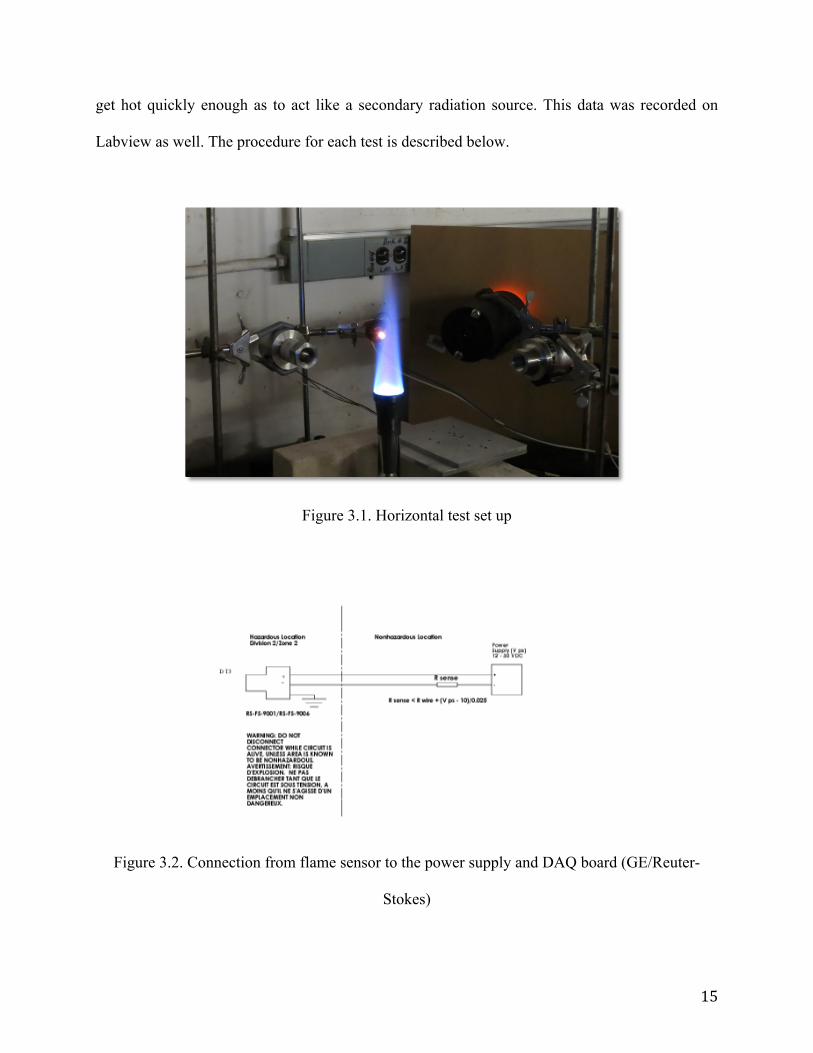
Figure 3.2. Connection from flame sensor to the power supply and DAQ board (GE/Reuter-
Stokes)
16
3.2.1. Sensor Sensitivity Test
The motivation for this test was to identify the sensor with fastest response time. A
chopper wheel was placed between the flame and the sensor (fig. 3.3). The chopper wheel was
made to rotate at different frequencies ranging from 15Hz to 200 Hz. The lower frequency
corresponds to lower flame flicker and vice versa. With this, it was possible to see how sensors
are able to match up with the chopper wheel frequency. The data was collected through Labview,
and analyzed in Excel. It should be noted that flame flicker is especially important for IR flame
sensors because they rely on flicker to differentiate between radiations from flame and from
black body source. UV sensors, on the other hand, rely on UV radiation emitted from the flame.
This test would help determine the response time of each sensor.
Figure 3.3. Chopper Wheel Test Set up
17
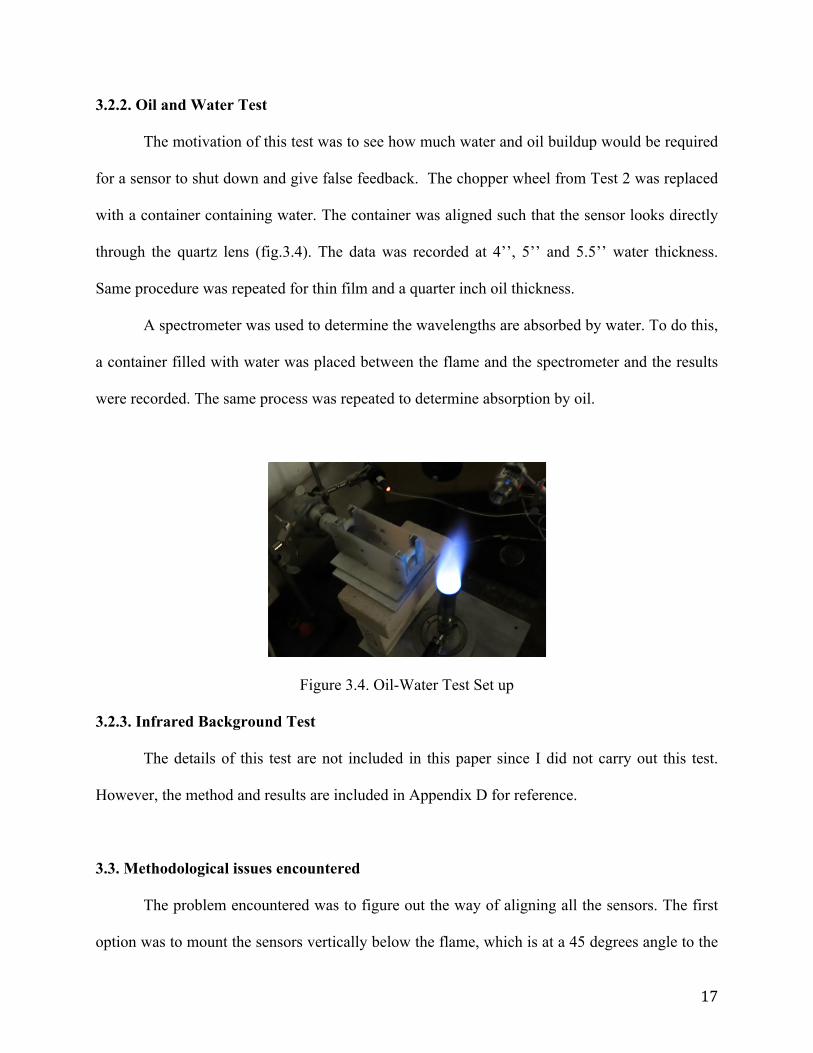
3.2.2. Oil and Water Test
The motivation of this test was to see how much water and oil buildup would be required
for a sensor to shut down and give false feedback. The chopper wheel from Test 2 was replaced
with a container containing water. The container was aligned such that the sensor looks directly
through the quartz lens (fig.3.4). The data was recorded at 4’’, 5’’ and 5.5’’ water thickness.
Same procedure was repeated for thin film and a quarter inch oil thickness.
A spectrometer was used to determine the wavelengths are absorbed by water. To do this,
a container filled with water was placed between the flame and the spectrometer and the results
were recorded. The same process was repeated to determine absorption by oil.
Figure 3.4. Oil-Water Test Set up
3.2.3. Infrared Background Test
The details of this test are not included in this paper since I did not carry out this test.
However, the method and results are included in Appendix D for reference.
3.3. Methodological issues encountered
The problem encountered was to figure out the way of aligning all the sensors. The first
option was to mount the sensors vertically below the flame, which is at a 45 degrees angle to the
18
viewing tube. This option was appealing because of two reasons. Firstly, having the flame at a
45-degree angle provides dynamic flame flicker signal needed for the evaluation (Shepherd,
Cheng and Day). Secondly, a vertically aligned viewing tube allows for accumulation of water
and oil on the lens. The disadvantage, however, is that none of the sensor are designed to
accumulate enough oil and water in front of its lens. Therefore, the vertical set up was not
preferred.
The problem was addressed by using a set up where sensors were placed horizontally, all
looking at the flame simultaneously (fig.3.1). The advantage is that it is more consistent, quicker
and avoids repetitiveness. However, the major problem encountered regarded testing with oil and
water. The requirements demanded the container to have a flat edge, be adjustable, and made out
of material, which does not attenuate the signal. A standard glass container couldn’t be used
because glass absorbs signal. This problem was addressed by making a custom made container
with adjustable quartz lens. Quartz lenses were used because they do not absorb any UV signal.
This custom made container addressed the issue of oil and water container.
19
CHAPTER 4: DISCUSSION
The results and discussion of the test are summarized below:
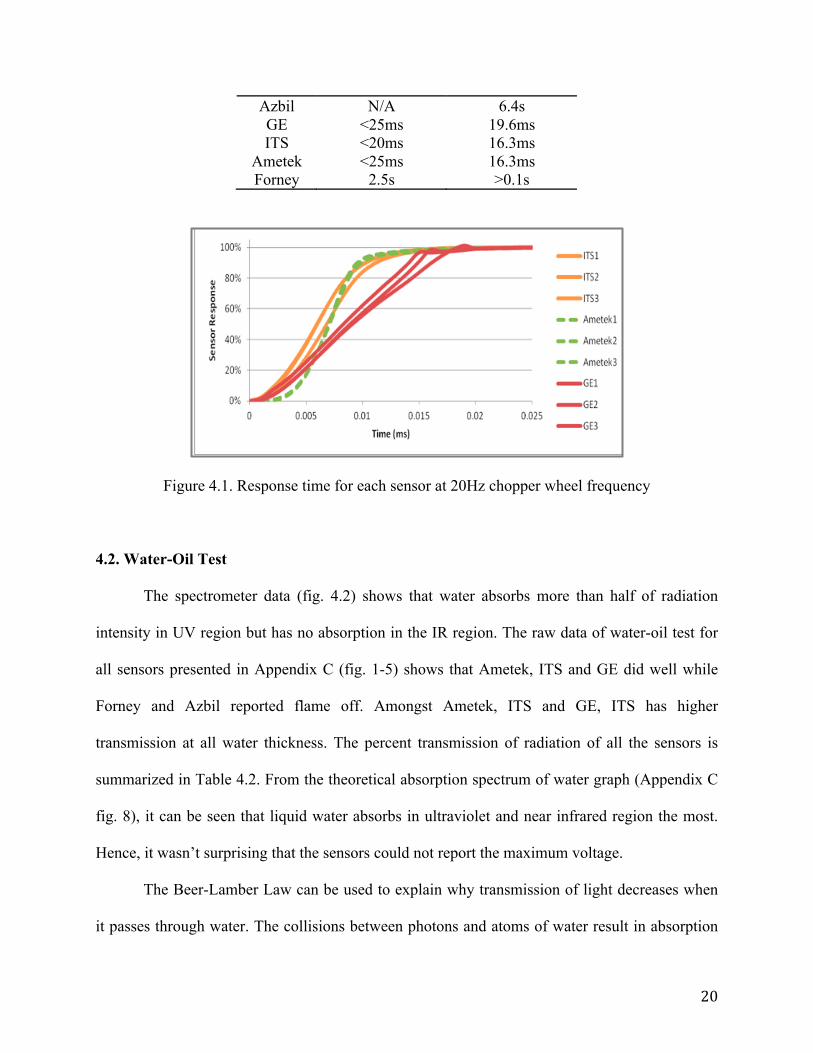
4.1. Chopper Wheel
The results of chopper wheel test (Table. 4.1) show that ITS and Ametek take the same
amount of time to reach their respective maximum voltages while GE takes a little longer. The
response times from three trials of GE, ITS and Ametek sensor (fig 4.1) show that ITS and
Ametek have steep slopes. Hence, they can reach 80% of their maximum voltage faster than GE.
The GE sensor takes a few milliseconds more but it is still comparable to the response times of
Ametek and ITS. Any sensor with response time less than 25millisecond is considered to be a
fast sensor.
From the raw data (Appendix B, fig.1-5), it was also concluded that all sensors match the
chopper wheel frequency until 50 Hz. The sensors are unable to reach their minimum voltage
after 50 Hz. Consequently; the range (the difference between the maximum and minimum
voltage) decreases with frequency increase. It can be deduced that all three sensors (GE, Ametek
and ITS) would give accurate response if flame flicker is below 50 Hz. Overall, the results
indicate that all the UV sensors have fast response times and can match up with the chopper
wheel frequency quickly.
Based on this test, the recommendation to Siemens would be a GE, Ametek or ITS sensor.
Table 4.1. Actual and Observed Response Times of all Sensors
Sensor Specified Response Time
Observed Response Time
20
Azbil N/A 6.4s GE <25ms 19.6ms ITS <20ms 16.3ms
Ametek <25ms 16.3ms Forney 2.5s >0.1s
Figure 4.1. Response time for each sensor at 20Hz chopper wheel frequency
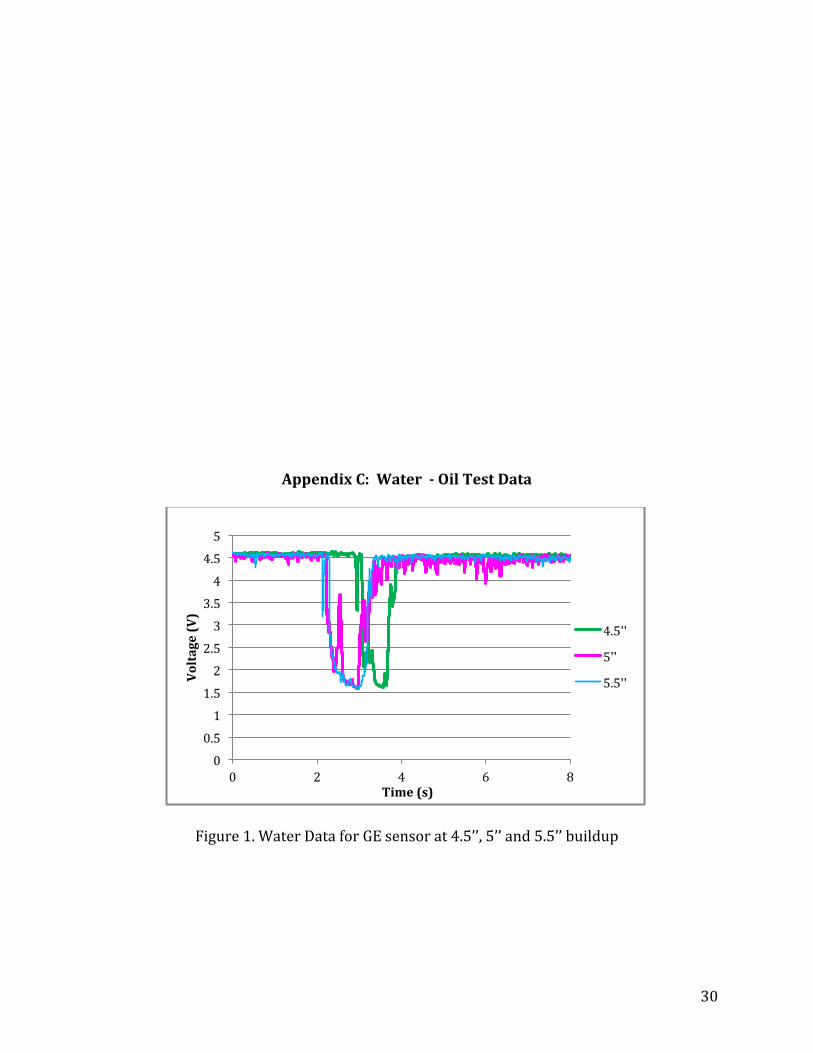
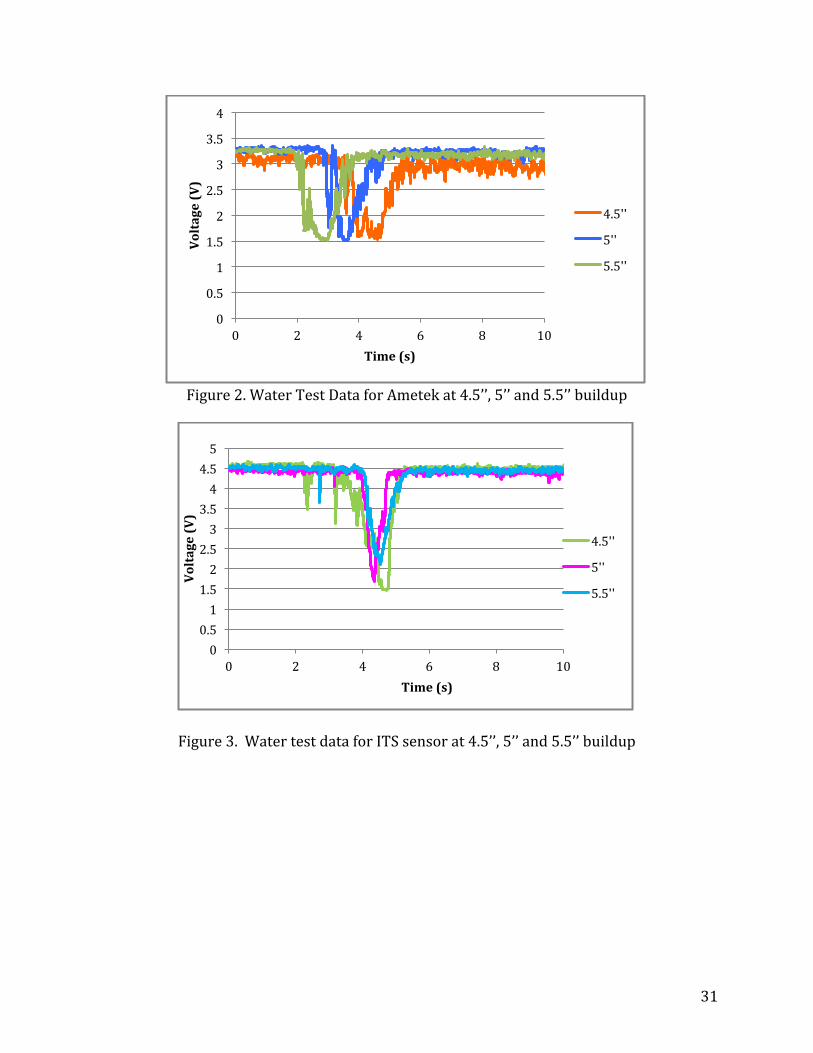
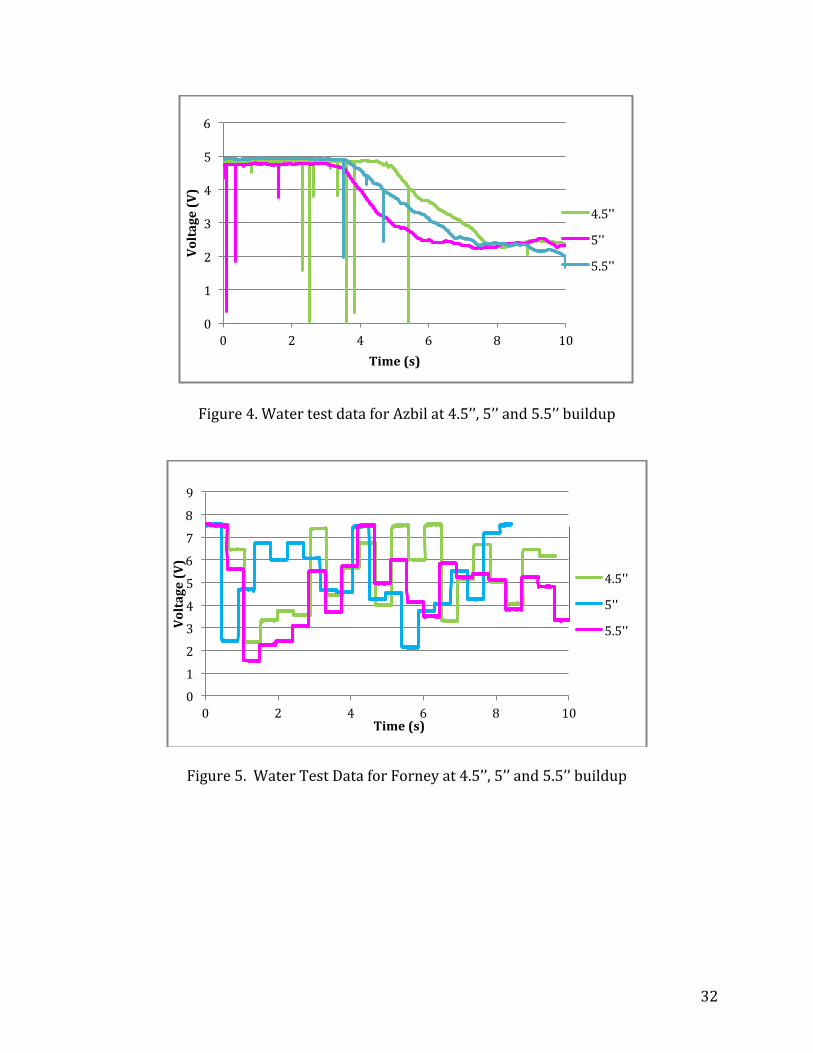
4.2. Water-Oil Test
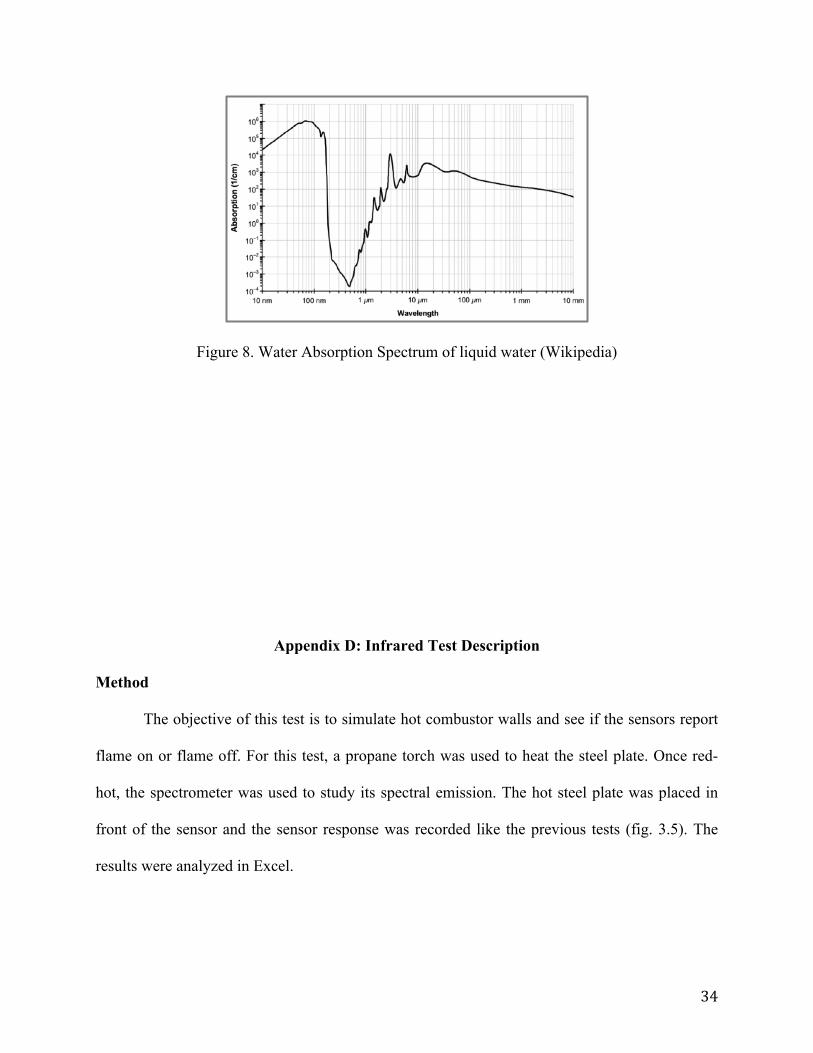
The spectrometer data (fig. 4.2) shows that water absorbs more than half of radiation
intensity in UV region but has no absorption in the IR region. The raw data of water-oil test for
all sensors presented in Appendix C (fig. 1-5) shows that Ametek, ITS and GE did well while
Forney and Azbil reported flame off. Amongst Ametek, ITS and GE, ITS has higher
transmission at all water thickness. The percent transmission of radiation of all the sensors is
summarized in Table 4.2. From the theoretical absorption spectrum of water graph (Appendix C
fig. 8), it can be seen that liquid water absorbs in ultraviolet and near infrared region the most.
Hence, it wasn’t surprising that the sensors could not report the maximum voltage.
The Beer-Lamber Law can be used to explain why transmission of light decreases when
it passes through water. The collisions between photons and atoms of water result in absorption
21
and scattering of photons, which in turn attenuates the radiation. In our case, we would only be
considering absorption because it shows how quickly the wavelength loses intensity due to
absorption alone. The theoretical transmitted radiation can be calculated using the Beer-Lambert
Law:
𝐼 = 𝐼!𝑒 !!" (1)
where I and I0 are the transmitted and incident radiation intensities, and α is the attenuation
coefficient. With this equation, one can find the maximum thickness of water buildup allowed at
particular flame off threshold. This analysis was not done since the flame-off threshold was not
known.
For the oil test, all sensors indicate flame off with ¼ inch of oil but show some response
if it is thin film oil (Appendix B fig 6, 7). The reason is that oil absorbs almost all of the radiation
in the UV region but very little in IR (fig. 4.2). Again, it can be seen that GE, Ametek and ITS
have similar performances when a thin film of oil is present. However, all of them give a flame
off signal when oil buildup increases. Hence, UV sensors are not suitable if more than thin layer
of oil is present inside the combustor.
The reduction in sensitivity when the window of the IR sensor is contaminated is
presented in Table 4.3 (Flame Detector User Manual). It can be seen that the IR sensor has 75%
transmission with water and about 85% transmission of signal with oil. Therefore, a UV sensor is
good for water contamination but an IR sensor is good for oil contamination.
Based on the water-oil test, the recommendation to Siemens would be to use GE, Ametek
or ITS sensor if water buildup is an issue. Either of the sensors is fine because they transmit
about 95% at all thickness of water. If only oil is present, UV sensors do not perform well and
22
hence an IR sensor should be used. . However, if both oil and water is present, an IR sensor
should be used in conjunction with a UV sensor.
Figure 4.2. Absorption of spectra from water and oil
Table 4.2. UV Detector Window Contamination
Sensor Water Oil
4 inch 5 inch 5.5 inch Thin Film ¼ inch
Azbil 37% 35% 32% 41% 0%
GE 98% 97% 95% 94% 0%
ITS 98% 97% 97% 90% 0%
Ametek 96% 96% 94% 91% 0%
Forney 43% 0%
Table 4.3. IR Detector Window Contamination
Contamination Typical percentage of
normal response
0
1000
2000
3000
4000
200 300 400 500 600 700
Inensity (#)
Wavelength (nm)
Oil Absorption Water Absorption Flame Spectrum
23
Water spray 75%
Steam 75%
Smoke 75%
Oil film 86%
CHAPTER 5: CONCLUSION
The main problem the project was to find a reliable flame sensor for gas turbine, which
would improve turbine’s reliability and safety. From this project, it was concluded that UV
sensors had all the desirable qualities of being able to correctly identify flame presence with
water contamination and had fast response times. Based on the results, ITS or Ametek sensor
was recommended to Siemens.
The project had several strengths and some shortcomings. The strength of the project was
that we were able to mimic the turbine wall radiation and carry out the oil tests, both of which
were extremely difficult to do. A shortcoming of the project would be the inability to test
robustness of flame sensors. For example, all the tests were done in a stable environment
condition with no vibrations and dust/smog, which is far different from the real working
environment of sensors. Another weakness was to not test sensors with flame as big, as intense,
and as hot as the actual flame inside the combustor. However, given the constraints of the
experiment, best results were achieved and were as expected.
As future work, we plan to improvise this technology by incorporating fiber optic cables
to transmit the spectral energy from the combustion process to the electronics unit. This feature
would allow of remote mounting of the electronics thereby eliminating complex and expensive
cooling systems usual in flame sensors. Additionally, we plan to explore the applications of this
24
technology to other industries such as the ones that use highly flammable solvents such as
Methyl Isobutyl Ketone (MIBK).
REFERNCES
Ametek Inc. "SpectraTM GT30 Gas Turbine Flame Sensor." Manual. 2005. Brown, Dale, et al. "Experience Using Flame Tracker." General Electric, 2006. Casady, J. B. and R. W Johnson. "Status of Silicon Carbide (SiC) as a Wide-‐ Bandgap Semiconductor for High-‐Temperature Applications: A Review." Solid-‐State Electronics 39 (1996). Chemistry Department, University of Florida. 15 April 2013 <http://www.chem.ufl.edu/~itl/4411L_f00/OH/OH.html>. "Flame Detector User Manual." www.talentum.co.uk. 01 May 2013 <http://www.talentum.co.uk/wp-‐content/uploads/2009/07/FD-‐User-‐Manual.pdf>. GE/Reuter-‐Stokes. Flame TRacker SiC Two Wire Flame Sensor (4-‐20mA), Operation and Maintenance Manualand M. Manual. Twinsburg: Reuter-‐Stokes, 2003. Glasheen, William M., et al. High Temperature Gas Stream Optical Flame Sensor and Method for Fabricating Same. United States of America: Patent 5763888. 27 July 1999. ITS-‐ Industrial Turbine Services. "Technical Specification Flame Scanner-‐ ITS 184X0254M029." Technical Specification Manual. 2013. JSC "Electronstandart-‐Pribor". "Fire Detection Introduction." www.esp.com.ru. 01 May 2013 <http://electronstandart-‐pribor.com/shared/docs/pres.pdf>. Knoll, Glenn F. Radiation Detection and Measurement. Third. John Vilegy and Sons, 2000. Lieuwen, Tim, et al. "Fuel Flexibility Influences on Premixed Combustor Blowout, Flashback, Autoignition, and Stability." Journal of Engineering for Gas Turbines and Power 130 (2008). MacDonald, Malcolm F. Flame Monitoring System. United States of America: Patent 4039844. 2 August 1977.
25
Measurement Specialities. Temperature Sensors: Advantages and Disadvantages. Electronic. Dayton, October 2003. Myher, Douglas C., et al. Apparatus for Detecting Flame Conditions in Combustion Systems. United States of America: Patent 5961314. 5 October 1999. Nussbaum, R, B. G. Liptak and S Pate. "Flame, Fire, and Smoke Detectors." Instrument Enginer's Handbook, Process Measurement and Analysis. Vol. I. CRC Press, 1995. Schneider, Donald A. and Leo Lombardo. Flame Sensor with Dynamic Sensitivity Adjustment. USA: Patent 6013919. 11 January 2000. Shepherd, I.G., R.K. Cheng and M.S. Day. "The Dyanamics of Flame Flicker in Conical Premixed Flames: An Experimental and Numerical Study." Publication. Lawrence Berkeley National Laboratory, n.d. US NRC. Intrumentation. Wikipedia. 01 May 2013 <http://en.wikipedia.org/wiki/Electromagnetic_absorption_by_water>. Zizak, Giorgio. Flame Emission Spectroscopy: Fundamentals and Applications. Istituto per la Tecnologia dei Materiali e dei Processi Energetici. Milano, n.d.
26
APPENDIX A: Lab view Code
Figure 1. Lab view Code
27
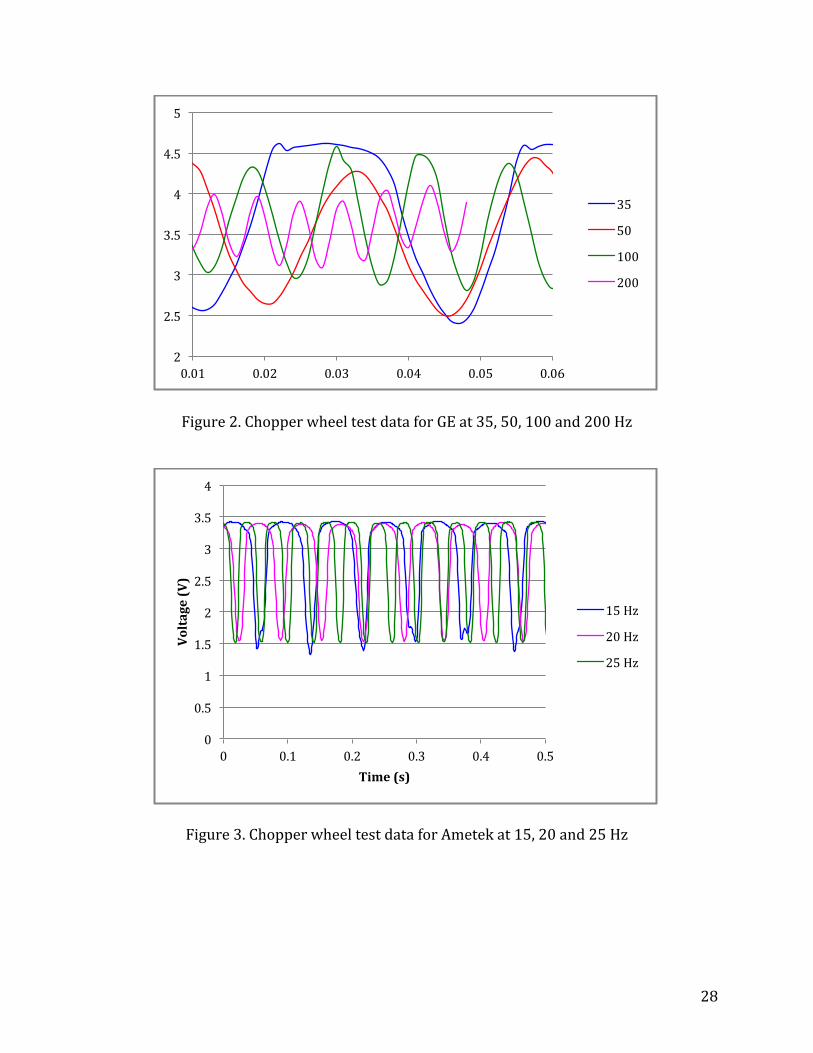
Appendix B: Chopper Wheel Test Data
Figure. 1. Chopper Wheel Test data for GE at 15, 20 and 25 Hz
0
0.5
1
1.5
2
2.5
3
3.5
4
4.5
5
0 0.05 0.1 0.15 0.2 0.25 0.3
15
20
25
28
Figure 2. Chopper wheel test data for GE at 35, 50, 100 and 200 Hz
Figure 3. Chopper wheel test data for Ametek at 15, 20 and 25 Hz
2
2.5
3
3.5
4
4.5
5
0.01 0.02 0.03 0.04 0.05 0.06
35
50
100
200
0
0.5
1
1.5
2
2.5
3
3.5
4
0 0.1 0.2 0.3 0.4 0.5
Voltage (V)
Time (s)
15 Hz
20 Hz
25 Hz
29
Figure 4. Chopper Wheel Test Data for Ametek at 35, 50, 100 and 200 Hz
Figure 5. Chopper Wheel Test Data for ITS sensor at 20, 25, 30 and 35 Hz
0.00
0.50
1.00
1.50
2.00
2.50
3.00
3.50
4.00
0 0.02 0.04 0.06 0.08 0.1
Voltage (V)
Time (s)
35 Hz
50 Hz
100 Hz
200 Hz
0
0.5
1
1.5
2
2.5
3
3.5
4
4.5
5
0.000 0.050 0.100 0.150
Votlage (V)
Time (s)
20 Hz
25 Hz
30 Hz
35 Hz
30
Appendix C: Water -‐ Oil Test Data
Figure 1. Water Data for GE sensor at 4.5’’, 5’’ and 5.5’’ buildup
0
0.5
1
1.5
2
2.5
3
3.5
4
4.5
5
0 2 4 6 8
Voltage (V)
Time (s)
4.5''
5''
5.5''
31
Figure 2. Water Test Data for Ametek at 4.5’’, 5’’ and 5.5’’ buildup
Figure 3. Water test data for ITS sensor at 4.5’’, 5’’ and 5.5’’ buildup
0
0.5
1
1.5
2
2.5
3
3.5
4
0 2 4 6 8 10
Voltage (V)
Time (s)
4.5''
5''
5.5''
0 0.5 1
1.5 2
2.5 3
3.5 4
4.5 5
0 2 4 6 8 10
Voltage (V)
Time (s)
4.5''
5''
5.5''
32
Figure 4. Water test data for Azbil at 4.5’’, 5’’ and 5.5’’ buildup
Figure 5. Water Test Data for Forney at 4.5’’, 5’’ and 5.5’’ buildup
0
1
2
3
4
5
6
0 2 4 6 8 10
Voltage (V)
Time (s)
4.5''
5''
5.5''
0
1
2
3
4
5
6
7
8
9
0 2 4 6 8 10
Voltage (V)
Time (s)
4.5''
5''
5.5''
33
Figure 6. Oil Test Data for all sensors at thin film buildup
Figure 7. Oil Test Data for GE, Ametek, Forney and Azbil sensor at ¼’’ oil buildup
0 1 2 3 4 5 6 7 8
0 1 2 3 4 5 6
Voltage (V)
Time (s)
Forney GE Azbil Ametek ITS
0 0.2 0.4 0.6 0.8 1
1.2 1.4 1.6 1.8 2
0.000 0.500 1.000 1.500 2.000
Voltage (V)
Time (s)
GE
Ametek
Forney
Azbil
34
Figure 8. Water Absorption Spectrum of liquid water (Wikipedia)
Appendix D: Infrared Test Description
Method
The objective of this test is to simulate hot combustor walls and see if the sensors report
flame on or flame off. For this test, a propane torch was used to heat the steel plate. Once red-
hot, the spectrometer was used to study its spectral emission. The hot steel plate was placed in
front of the sensor and the sensor response was recorded like the previous tests (fig. 3.5). The
results were analyzed in Excel.
35
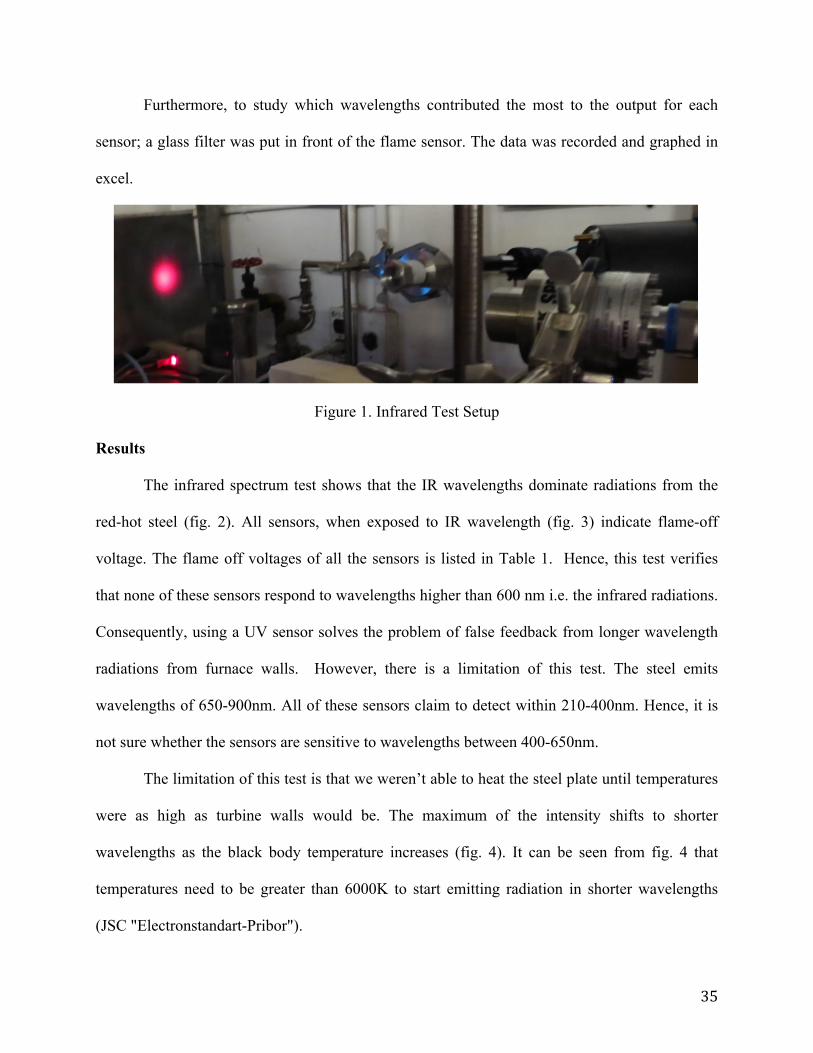
Furthermore, to study which wavelengths contributed the most to the output for each
sensor; a glass filter was put in front of the flame sensor. The data was recorded and graphed in
excel.
Figure 1. Infrared Test Setup
Results
The infrared spectrum test shows that the IR wavelengths dominate radiations from the
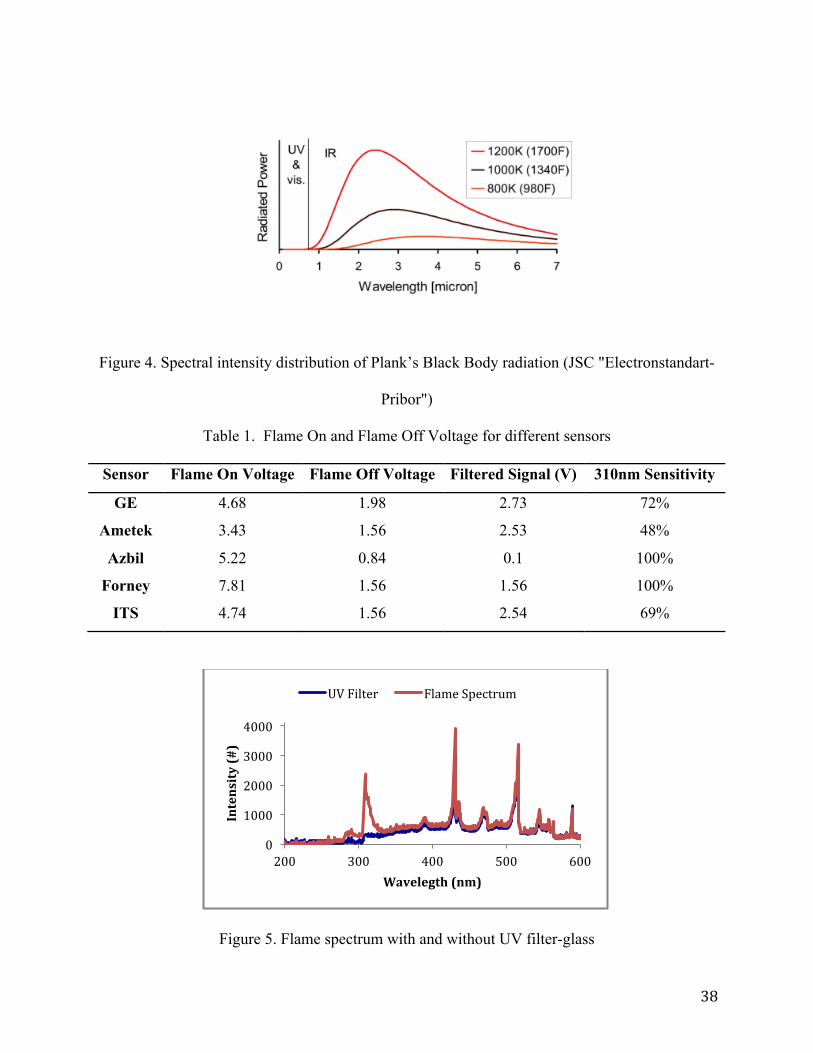
red-hot steel (fig. 2). All sensors, when exposed to IR wavelength (fig. 3) indicate flame-off
voltage. The flame off voltages of all the sensors is listed in Table 1. Hence, this test verifies
that none of these sensors respond to wavelengths higher than 600 nm i.e. the infrared radiations.
Consequently, using a UV sensor solves the problem of false feedback from longer wavelength
radiations from furnace walls. However, there is a limitation of this test. The steel emits
wavelengths of 650-900nm. All of these sensors claim to detect within 210-400nm. Hence, it is
not sure whether the sensors are sensitive to wavelengths between 400-650nm.
The limitation of this test is that we weren’t able to heat the steel plate until temperatures
were as high as turbine walls would be. The maximum of the intensity shifts to shorter
wavelengths as the black body temperature increases (fig. 4). It can be seen from fig. 4 that
temperatures need to be greater than 6000K to start emitting radiation in shorter wavelengths
(JSC "Electronstandart-Pribor").
36
Additionally, the results of using a glass filter (fig. 3) indicate that the glass filter
attenuates radiation in the UV region. The calculation shown below helps in identifying
contribution of 310 nm wavelength to the flame sensor output.
1− !.!"!!.!"!.!"!!.!"
= 0.72 (For GE sensor)
From this calculation, it can be seen that 310nm wavelength contributes to about three-
fourths of the output voltage for GE sensor. The radiation at 310nm no longer contributes to the
output while using glass because glass filters out that wavelength. This leads to a significant drop
in voltage of GE sensor. This result is consistent with the information given in GE patent (US
6013919A), which claims that the sensor detects EM radiation having a wavelength in the range
of about 190-400nm (Schneider and Lombardo). Similarly, 310 nanometers wavelength in the
EM radiation contributes to about 70% of final output of ITS sensor. On the other hand, Ametek
sensor is not so sensitive to the 310 nm peak. This fact is also consistent with Ametek patent (US
5929450), which claims the spectral range of sensor of about 190-400 nanometers, preferably
within the UV range of from about 190-270 nanometers (Glasheen, Cusack and Steglich).
Based on this test, the recommendation to Siemens would be to use either a GE, ITS or
Ametek flame sensor because they don’t cause false alarms. If the actual spectrum of the flame
inside the combustor consists of a 310nm peak, use a GE or ITS sensor because they are more
sensitive to that peak. For example, if the 310nm peak disappears when the flame is not present,
the sensors would detect flame off instead of flame off, thus making gas turbine operation safer.
37
Figure 2. Emission spectra from the hot wall
Figure 3. Response of flame sensor with IR radiation background
0 500 1000 1500 2000 2500 3000 3500 4000 4500
200 400 600 800
Intensity (#)
Wavelength (nm)
Hot Wall
0
0.2
0.4
0.6
0.8
1
1.2
1.4
1.6
1.8
0.000 0.050 0.100 0.150 0.200 0.250
Voltage (V)
Time (s)
Forney
GE
Ametek
Azbil
38
Figure 4. Spectral intensity distribution of Plank’s Black Body radiation (JSC "Electronstandart-
Pribor")
Table 1. Flame On and Flame Off Voltage for different sensors
Sensor Flame On Voltage Flame Off Voltage Filtered Signal (V) 310nm Sensitivity
GE 4.68 1.98 2.73 72%
Ametek 3.43 1.56 2.53 48%
Azbil 5.22 0.84 0.1 100%
Forney 7.81 1.56 1.56 100%
ITS 4.74 1.56 2.54 69%
Figure 5. Flame spectrum with and without UV filter-glass