25
Signals Ahead Network Benchmark Study Report Preview

Signals AheadNetwork Benchmark StudyReport Preview
MCS SNR MIMO RI BLER 64QAM 16QAM QPSK CQI L1 DL RSSI RSRQ RSCP CINR ACK NACK PDSCH HS-PDSCH HS-SCCH MAC-HS E-DPCH FTP UDP HTTP RTT TCP dBm dB Mbps ms MOS LTE HSPA+ DC-HSDPA TD-LTE EV-DO Rev A/B Mobile WiMAX MCS MCS SNR MIMO RI BLER 64QAM 16QAM QPSK CQI L1 DL RSSI RSRQ RSCP CINR ACK NACK PDSCH HS-PDSCH HS-SCCH MAC-HS E-DPCH FTP UDP HTTP RTT TCP dBm dB Mbps ms MOS LTE HSPA+ DC-HSDPA TD-LTE EV-DO Rev A/B Mobile WiMAX MCS MCS SNR MIMO RI BLER 64QAM 16QAM QPSK CQI L1 DL RSSI RSRQ RSCP CINR ACK NACK PDSCH HS-PDSCH HS-SCCH MAC-HS E-DPCH FTP UDP HTTP RTT TCP dBm dB Mbps ms MOS LTE HSPA+ DC-HSDPA TD-LTE EV-DO Rev A/B Mobile WiMAX MCS MCS SNR MIMO RI BLER 64QAM 16QAM QPSK CQI L1 DL RSSI RSRQ RSCP CINR ACK NACK PDSCH HS-PDSCH HS-SCCH MAC-HS E-DPCH FTP UDP HTTP RTT TCP dBm dB Mbps ms MOS LTE HSPA+ DC-HSDPA TD-LTE EV-DO Rev A/B Mobile WiMAX MCS MCS SNR MIMO RI BLER 64QAM 16QAM QPSK CQI L1 DL RSSI RSRQ RSCP CINR ACK NACK PDSCH HS-PDSCH HS-SCCH MAC-HS E-DPCH FTP UDP HTTP RTT TCP dBm dB Mbps ms MOS LTE HSPA+ DC-HSDPA TD-LTE EV-DO Rev A/B Mobile WiMAX MCS MCS SNR MIMO RI BLER 64QAM 16QAM QPSK CQI L1 DL RSSI RSRQ RSCP CINR ACK NACK PDSCH HS-PDSCH HS-SCCH MAC-HS E-DPCH FTP UDP HTTP RTT TCP dBm dB Mbps ms MOS LTE HSPA+ DC-HSDPA TD-LTE EV-DO Rev A/B Mobile WiMAX MCS MCS SNR MIMO RI BLER 64QAM 16QAM QPSK CQI L1 DL RSSI RSRQ RSCP CINR ACK NACK PDSCH HS-PDSCH HS-SCCH MAC-HS E-DPCH FTP UDP HTTP RTT TCP dBm dB Mbps ms MOS LTE HSPA+ DC-HSDPA TD-LTE EV-DO Rev A/B Mobile WiMAX MCS MCS SNR MIMO RI BLER 64QAM 16QAM QPSK CQI L1 DL RSSI
100%
90%
80%
70%
60%
50%
40%
30%
20%
10%
0%
Other Nokia Kyocera Palm LG
RIM HTC Motorola Samsung Apple
18.5%
52.9%35.7%
17:2
9.0
17:37
.0
17:4
5.0
17:53
.0
18:0
1.0
18:0
9.0
18:17
.0
18:2
5.0
18:33
.0
18:4
1.0
18:4
9.0
18:57
.0
19:0
5.0
19:13
.0
19:2
1.0
19:2
9.0
19:37
.0
19:4
5.0
19:53
.0
20:0
1.0
20:0
9.0
20:17
.0
20:2
5.0
20:33
.0
20:4
1.0
HSPA Demo Phone - Cat 8 (1Rx)
HSPA Demo Phone - Cat 8 (1Rx)
20:4
9.0
20:57
.0
21:0
5.0
21:13
.0
21:2
0.0
21:2
7.0
21:35
.0
21:4
3.0
21:51
.0
-50 -40 -30 -20
PHY Layer Primary Throughput (Kbps)
PHY Layer Secondary Throughput (Kbps)
Total DC-HSDPA PHY Layer Throughput (Kbps)
35:4
5.0
35:57
.0
36:0
9.0
36:2
1.0
36:33
.0
36:4
5.0
36:57
.0
37:0
9.0
37:2
1.0
37:33
.0
37:4
5.0
37:57
.0
38:0
9.0
38:2
1.0
0
1,000
2,000
3,000
4,000
5,000
6,000
7,000
8,000 kbps Other Nokia Kyocera Palm LG
Other HTC Motorola Samsung Apple
How not to spend your summer vacation
Redefining Research
THE MOTHER OF ALLNETWORK
BENCHMARKTESTS
October 3, 2011, Vol. 7 No. 11–12 PREVIEW
PREVIEW EDITION
InItIal feedback receIved In the fIrst few hours after releasIng thIs report Included the followIng comments:
“This is a real differentiator… well worth it.” –Marketing Director, infrastructure supplier
“Very detailed and above and beyond my expectations.” –CTO, tier two operator
“Great report as always” –CTO, leading mobile operator
“High impact stuff… Nobody even comes close to delivering this kind of data. Nice, nice move” –Marketing Director, infrastructure supplier
“YOU kick $@tt… This is great stuff” –Managing Director, financial institution
“Great report again.” –Senior Technical Fellow, infrastructure supplier
“Great stuff…well thought out and most of all – fair.” –Network Services, leading mobile operator
3 October 3, 2011 | Signals Ahead, Vol. 7, Number 11–12 PREVIEW
1.0 executive summary
This document contains a highly redacted executive summary a complete table of contents, and our complete test methodology (Chapter 8 from the main report) for a Signals Ahead research product that we published on September 28th. Additionally, it provides a summary of past topics that we have covered in Signals Ahead and a list of likely topics that we plan to tackle in the coming months. The 155-page report contains 125 figures and tables, with many of the figures and tables consisting of multiple parts. This report can be purchased separately for $1,995 or it is included with any paid corporate subscription to Signals Ahead.
For reasons that escape us, and which call into question our sanity, we took it upon ourselves to drive test all of the next-generation broadband wireless technologies in order to determine the relative performance differences of each technology in a side-by-side comparison. To make matters worse, but nonetheless more interesting, we decided to include as many vendor + technology permutations as possible. We have visited numerous markets to conduct these tests, including Phoenix, Dallas, Kansas City, San Francisco, San Jose, Oakland, Myrtle Beach, SC, Charleston, SC, and Houston. As we wind down the data collection phase of this study we have transferred well more than 500GB of data on the various networks that we have tested and driven literally hundreds of miles.
Operators in this study include AT&T (HSPA+ and LTE), Clearwire (LTE 2x20MHz and Mobile WiMAX), T-Mobile USA (DC-HSDPA and HSPA+), and Verizon Wireless (EV-DO Rev A and LTE). Infrastructure suppliers in this study include Alcatel Lucent (EV-DO Rev A, HSPA+ and LTE), Ericsson (DC-HSDPA, EV-DO, HSPA+ and LTE), Huawei (LTE and Mobile WiMAX), Nokia Siemens Networks (DC-HSDPA, HSPA+ and Mobile WiMAX), and Samsung (Mobile WiMAX). With the exception of mobile operators who provided us with free and unlim-ited access to their networks, this study was entirely funded by Signals Research Group without any involvement from the aforementioned companies.
In the first volume of a special three-part series we offer high-level results about how each tech-nology performs. In the second volume we will analyze results from separately collected “user experi-ence” test scenarios and in the third volume we will take a deep dive into the results in order to analyze important technology enablers, such as 64QAM and MIMO, and to identify infrastructure supplier differentiators that currently exist.
Our ability to collect and analyze the network performance data would not have been possible without the support of Accuver, who allowed us to use its suite of network drive test tools, including its recently released XCAL-MO network benchmarking tool and XCAL-M drive test solution, as well as its XCAP post-processing software to analyze the results. We have used the Accuver tools several times in the past for various Signals Ahead reports and we have grown quite fond of their capabilities and their ease of use. In particular, for the most recent round of network benchmark
we have transferred well more than 500gb of data on
the various networks that we have tested and driven
literally hundreds of miles.
we leveraged accuver’s suite of network drive test tools and its post-processing software to
analyze the results.
4 October 3, 2011 | Signals Ahead, Vol. 7, Number 11–12 PREVIEW
testing, the company’s XCAL-MO tool proved to be an invaluable asset and without it, we would have found it next to impossible to accomplish our objectives.
For the first time, we are now able to offer their tools with our services for commissioned-based projects on behalf of operators, government regulators, vendors, trade associations or other inter-ested parties on a global basis. We look forward to discussing such opportunities with anyone that is interested.
Although the actual report provides very comprehensive and in-depth analysis of each network/technology configuration in a fourteen page executive summary, we can offer some very high-level takeaways in this report preview.
key high-level takeaways (among many) include the following:
1) By and large, all technologies performed as expected and as advertised by the operators. However, none of them qualify as IMT- Advanced technologies.
2) Operators control their own destiny and the decisions that they make can greatly alter the perfor-mance capabilities of their chosen network technology. We identified several key shortcomings in certain operator deployments which had a meaningful impact on performance relative to the capabilities of the technology.
3) Latency is an area where all technologies/networks could show meaningful improvement – a mere 40ms of latency separates the best performing technology from the worst performing tech-nology. Interestingly, we observed the lowest latency (27ms) on T-Mobile’s DC-HSDPA network
– during early morning rush hour traffic.
4) The performance of the network depends on the capabilities of the chipset/device, which in some cases we found to be lacking.
5) Once normalized for channel bandwidth and MIMO, not to mention taking into consideration network loading, the performance differences across all technologies were relatively modest in the downlink. In a few cases, DC-HSDPA outperformed LTE, even without making these adjustments and EV-DO Rev A outperformed HSPA+. Uplink throughput is an area where LTE generally has a big advantage over its peers.
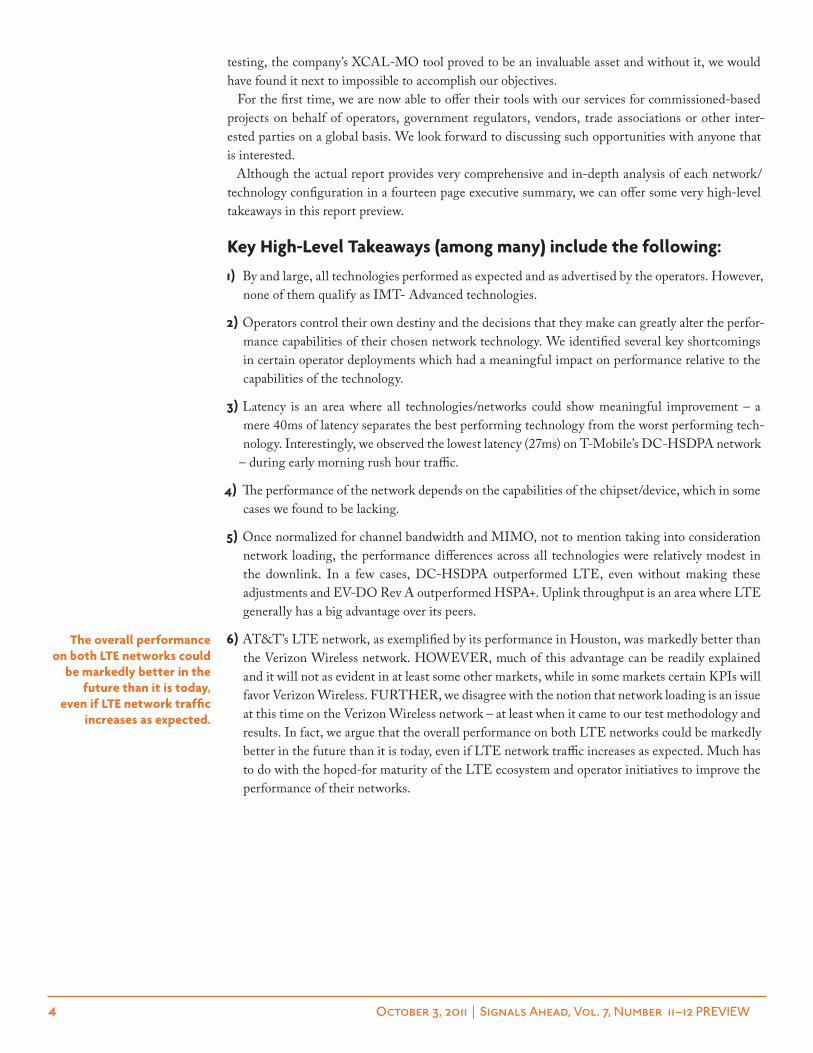
6) AT&T’s LTE network, as exemplified by its performance in Houston, was markedly better than the Verizon Wireless network. HOWEVER, much of this advantage can be readily explained and it will not as evident in at least some other markets, while in some markets certain KPIs will favor Verizon Wireless. FURTHER, we disagree with the notion that network loading is an issue at this time on the Verizon Wireless network – at least when it came to our test methodology and results. In fact, we argue that the overall performance on both LTE networks could be markedly better in the future than it is today, even if LTE network traffic increases as expected. Much has to do with the hoped-for maturity of the LTE ecosystem and operator initiatives to improve the performance of their networks.
the overall performance on both lte networks could
be markedly better in the future than it is today,
even if lte network traffic increases as expected.

5 October 3, 2011 | Signals Ahead, Vol. 7, Number 11–12 PREVIEW
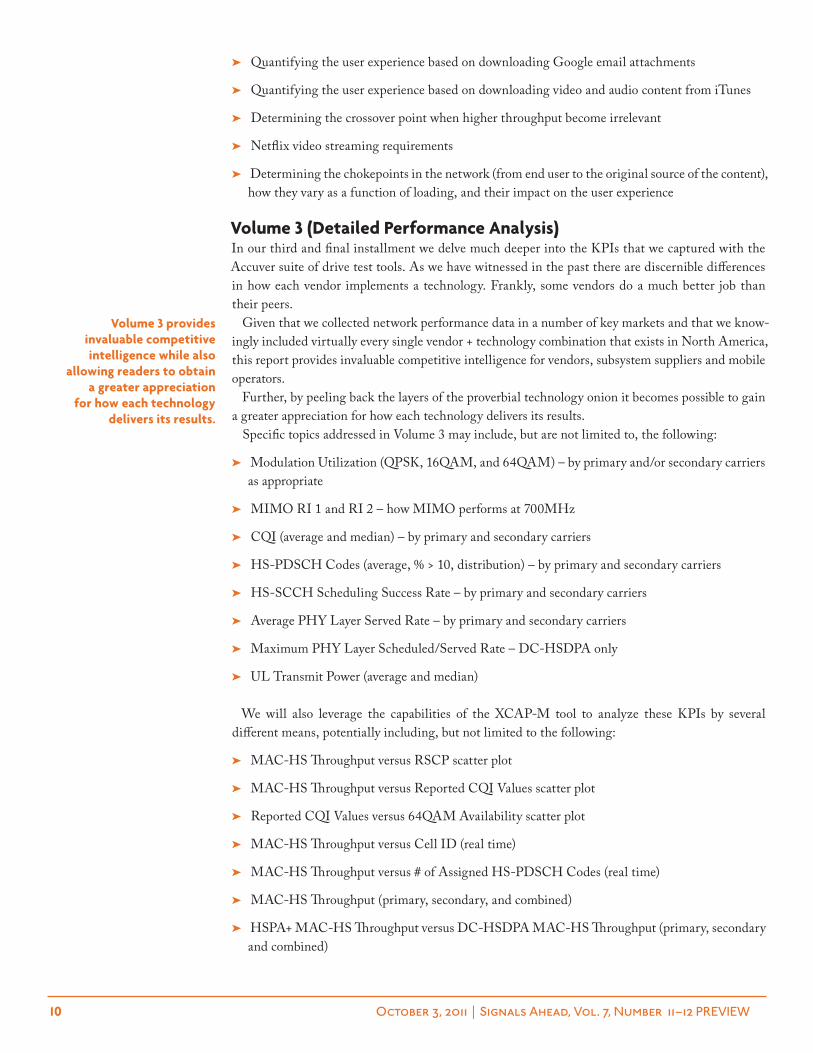
The full report contains graphs and graphical maps which show network performance and cell site density, among other metrics. We have included a couple of figures in this report preview. Without going into too much detail, Figure 1 helps justify our conclusion that tremendous performance differences exist between different combinations of devices + chipsets, especially with respect to LTE.
Figure 2 on the following page shows the drive route that we used on a single day of testing in the Bay Area. Although our objective wasn’t too map out the network performance coverage maps for each operator/technology, we wanted to collect enough data in order to reach definitive and largely indisputable conclusions on how the various technologies perform in a commercially deployed network.
Source: The Mother of all Network Benchmark Tests – Figure 16
Verizon Wireless LTE Device 1 Average APP Layer Throughput = 19.1MbpsVerizon Wireless LTE Device 2 Average APP Layer Throughput = 9.9Mbps
Combined LTE Device 1 and Device 2 Median APP Layer Throughput = 29.0Mbps
Time
Mbps
0
5
10
15
20
25
30
35
40
45
0 50 100 150 200 250
(Mbps)
Verizon Wireless Device 2 APP Layer Downlink Throughput (Mbps)
Combined APP Layer Downlink Throughput (Mbps)
Verizon Wireless Device 1 APP Layer
Downlink Throughput (Mbps)
figure 1. lte and lte app layer downlink throughput versus time (test scenario 161)

6 October 3, 2011 | Signals Ahead, Vol. 7, Number 11–12 PREVIEW
Source: The Mother of all Network Benchmark Tests – Figure 22
figure 2. drive route – bay area (oakland, san Jose, san francisco, and all points in between)
50 <= x 40 <= x < 5030 <= x < 4020 <= x < 30
15 <= x < 2010 <= x < 155 <= x < 100 <= x < 5
vehicular speed (mph)
MCS SNR MIMO RI BLER 64QAM 16QAM QPSK CQI L1 DL RSSI RSRQ RSCP CINR ACK NACK PDSCH HS-PDSCH HS-SCCH MAC-HS E-DPCH FTP UDP HTTP RTT TCP dBm dB Mbps ms MOS LTE HSPA+ DC-HSDPA TD-LTE EV-DO Rev A/B Mobile WiMAX MCS MCS SNR MIMO RI BLER 64QAM 16QAM QPSK CQI L1 DL RSSI RSRQ RSCP CINR ACK NACK PDSCH HS-PDSCH HS-SCCH MAC-HS E-DPCH FTP UDP HTTP RTT TCP dBm dB Mbps ms MOS LTE HSPA+ DC-HSDPA TD-LTE EV-DO Rev A/B Mobile WiMAX MCS MCS SNR MIMO RI BLER 64QAM 16QAM QPSK CQI L1 DL RSSI RSRQ RSCP CINR ACK NACK PDSCH HS-PDSCH HS-SCCH MAC-HS E-DPCH FTP UDP HTTP RTT TCP dBm dB Mbps ms MOS LTE HSPA+ DC-HSDPA TD-LTE EV-DO Rev A/B Mobile WiMAX MCS MCS SNR MIMO RI BLER 64QAM 16QAM QPSK CQI L1 DL RSSI RSRQ RSCP CINR ACK NACK PDSCH HS-PDSCH HS-SCCH MAC-HS E-DPCH FTP UDP HTTP RTT TCP dBm dB Mbps ms MOS LTE HSPA+ DC-HSDPA TD-LTE EV-DO Rev A/B Mobile WiMAX MCS MCS SNR MIMO RI BLER 64QAM 16QAM QPSK CQI L1 DL RSSI RSRQ RSCP CINR ACK NACK PDSCH HS-PDSCH HS-SCCH MAC-HS E-DPCH FTP UDP HTTP RTT TCP dBm dB Mbps ms MOS LTE HSPA+ DC-HSDPA TD-LTE EV-DO Rev A/B Mobile WiMAX MCS MCS SNR MIMO RI BLER 64QAM 16QAM QPSK CQI L1 DL RSSI RSRQ RSCP CINR ACK NACK PDSCH HS-PDSCH HS-SCCH MAC-HS E-DPCH FTP UDP HTTP RTT TCP dBm dB Mbps ms MOS LTE HSPA+ DC-HSDPA TD-LTE EV-DO Rev A/B Mobile WiMAX MCS MCS SNR MIMO RI BLER 64QAM 16QAM QPSK CQI L1 DL RSSI RSRQ RSCP CINR ACK NACK PDSCH HS-PDSCH HS-SCCH MAC-HS E-DPCH FTP UDP HTTP RTT TCP dBm dB Mbps ms MOS LTE HSPA+ DC-HSDPA TD-LTE EV-DO Rev A/B Mobile WiMAX MCS MCS SNR MIMO RI BLER 64QAM 16QAM QPSK CQI L1 DL RSSI
100%
90%
80%
70%
60%
50%
40%
30%
20%
10%
0%
Other Nokia Kyocera Palm LG
RIM HTC Motorola Samsung Apple
18.5%
52.9%35.7%
17:2
9.0
17:37
.0
17:4
5.0
17:53
.0
18:0
1.0
18:0
9.0
18:17
.0
18:2
5.0
18:33
.0
18:4
1.0
18:4
9.0
18:57
.0
19:0
5.0
19:13
.0
19:2
1.0
19:2
9.0
19:37
.0
19:4
5.0
19:53
.0
20:0
1.0
20:0
9.0
20:17
.0
20:2
5.0
20:33
.0
20:4
1.0
HSPA Demo Phone - Cat 8 (1Rx)
HSPA Demo Phone - Cat 8 (1Rx)
20:4
9.0
20:57
.0
21:0
5.0
21:13
.0
21:2
0.0
21:2
7.0
21:35
.0
21:4
3.0
21:51
.0
21:59
.0
22:0
7.0
22:15
.0
22:2
3.0
22:31
.0
22:39
.0
-60 -50 -40 -30 -20
0
3,000
6,000
9,000
12,000
15,000
PHY Layer Primary Throughput (Kbps)
PHY Layer Secondary Throughput (Kbps)
Total DC-HSDPA PHY Layer Throughput (Kbps)
35:0
9.0
35:2
1.0
35:33
.0
35:4
5.0
35:57
.0
36:0
9.0
36:2
1.0
36:33
.0
36:4
5.0
36:57
.0
37:0
9.0
37:2
1.0
37:33
.0
37:4
5.0
37:57
.0
38:0
9.0
38:2
1.0
0
1,000
2,000
3,000
4,000
5,000
6,000
7,000
8,000 kbps Other Nokia Kyocera Palm LG
Other HTC Motorola Samsung Apple
7 October 3, 2011 | Signals Ahead, Vol. 7, Number 11–12 PREVIEW
MCS SNR MIMO RI BLER 64QAM 16QAM QPSK CQI L1 DL RSSI RSRQ RSCP CINR ACK NACK PDSCH HS-PDSCH HS-SCCH MAC-HS E-DPCH FTP UDP HTTP RTT TCP dBm dB Mbps ms MOS LTE HSPA+ DC-HSDPA TD-LTE EV-DO Rev A/B Mobile WiMAX MCS MCS SNR MIMO RI BLER 64QAM 16QAM QPSK CQI L1 DL RSSI RSRQ RSCP CINR ACK NACK PDSCH HS-PDSCH HS-SCCH MAC-HS E-DPCH FTP UDP HTTP RTT TCP dBm dB Mbps ms MOS LTE HSPA+ DC-HSDPA TD-LTE EV-DO Rev A/B Mobile WiMAX MCS MCS SNR MIMO RI BLER 64QAM 16QAM QPSK CQI L1 DL RSSI RSRQ RSCP CINR ACK NACK PDSCH HS-PDSCH HS-SCCH MAC-HS E-DPCH FTP UDP HTTP RTT TCP dBm dB Mbps ms MOS LTE HSPA+ DC-HSDPA TD-LTE EV-DO Rev A/B Mobile WiMAX MCS MCS SNR MIMO RI BLER 64QAM 16QAM QPSK CQI L1 DL RSSI RSRQ RSCP CINR ACK NACK PDSCH HS-PDSCH HS-SCCH MAC-HS E-DPCH FTP UDP HTTP RTT TCP dBm dB Mbps ms MOS LTE HSPA+ DC-HSDPA TD-LTE EV-DO Rev A/B Mobile WiMAX MCS MCS SNR MIMO RI BLER 64QAM 16QAM QPSK CQI L1 DL RSSI RSRQ RSCP CINR ACK NACK PDSCH HS-PDSCH HS-SCCH MAC-HS E-DPCH FTP UDP HTTP RTT TCP dBm dB Mbps ms MOS LTE HSPA+ DC-HSDPA TD-LTE EV-DO Rev A/B Mobile WiMAX MCS MCS SNR MIMO RI BLER 64QAM 16QAM QPSK CQI L1 DL RSSI RSRQ RSCP CINR ACK NACK PDSCH HS-PDSCH HS-SCCH MAC-HS E-DPCH FTP UDP HTTP RTT TCP dBm dB Mbps ms MOS LTE HSPA+ DC-HSDPA TD-LTE EV-DO Rev A/B Mobile WiMAX MCS MCS SNR MIMO RI BLER 64QAM 16QAM QPSK CQI L1 DL RSSI RSRQ RSCP CINR ACK NACK PDSCH HS-PDSCH HS-SCCH MAC-HS E-DPCH FTP UDP HTTP RTT TCP dBm dB Mbps ms MOS LTE HSPA+ DC-HSDPA TD-LTE EV-DO Rev A/B Mobile WiMAX MCS MCS SNR MIMO RI BLER 64QAM 16QAM QPSK CQI L1 DL RSSI
100%
90%
80%
70%
60%
50%
40%
30%
20%
10%
0%
Other Nokia Kyocera Palm LG
RIM HTC Motorola Samsung Apple
18.5%
52.9%35.7%
17:2
9.0
17:37
.0
17:4
5.0
17:53
.0
18:0
1.0
18:0
9.0
18:17
.0
18:2
5.0
18:33
.0
18:4
1.0
18:4
9.0
18:57
.0
19:0
5.0
19:13
.0
19:2
1.0
19:2
9.0
19:37
.0
19:4
5.0
19:53
.0
20:0
1.0
20:0
9.0
20:17
.0
20:2
5.0
20:33
.0
20:4
1.0
HSPA Demo Phone - Cat 8 (1Rx)
HSPA Demo Phone - Cat 8 (1Rx)
20:4
9.0
20:57
.0
21:0
5.0
21:13
.0
21:2
0.0
21:2
7.0
21:35
.0
21:4
3.0
21:51
.0
21:59
.0
22:0
7.0
22:15
.0
22:2
3.0
22:31
.0
22:39
.0
-60 -50 -40 -30 -20
0
3,000
6,000
9,000
12,000
15,000
PHY Layer Primary Throughput (Kbps)
PHY Layer Secondary Throughput (Kbps)
Total DC-HSDPA PHY Layer Throughput (Kbps)
35:0
9.0
35:2
1.0
35:33
.0
35:4
5.0
35:57
.0
36:0
9.0
36:2
1.0
36:33
.0
36:4
5.0
36:57
.0
37:0
9.0
37:2
1.0
37:33
.0
37:4
5.0
37:57
.0
38:0
9.0
38:2
1.0
0
1,000
2,000
3,000
4,000
5,000
6,000
7,000
8,000 kbps Other Nokia Kyocera Palm LG
Other HTC Motorola Samsung Apple
100%
90%
80%
70%
60%
50%
40%
30%
20%
10%
0%
Other Nokia Kyocera Palm LG
RIM HTC Motorola Samsung Apple
18.5%
52.9%35.7%
17:2
9.0
17:37
.0
17:4
5.0
17:53
.0
18:0
1.0
18:0
9.0
18:17
.0
18:2
5.0
18:33
.0
18:4
1.0
18:4
9.0
18:57
.0
19:0
5.0
19:13
.0
19:2
1.0
19:2
9.0
19:37
.0
19:4
5.0
19:53
.0
20:0
1.0
20:0
9.0
20:17
.0
20:2
5.0
20:33
.0
20:4
1.0
HSPA Demo Phone - Cat 8 (1Rx)
HSPA Demo Phone - Cat 8 (1Rx)
20:4
9.0
20:57
.0
21:0
5.0
21:13
.0
21:2
0.0
21:2
7.0
21:35
.0
21:4
3.0
21:51
.0
21:59
.0
22:0
7.0
22:15
.0
22:2
3.0
22:31
.0
22:39
.0
-60 -50 -40 -30 -20
0
3,000
6,000
9,000
12,000
15,000
PHY Layer Primary Throughput (Kbps)
PHY Layer Secondary Throughput (Kbps)
Total DC-HSDPA PHY Layer Throughput (Kbps)
35:0
9.0
35:2
1.0
35:33
.0
35:4
5.0
35:57
.0
36:0
9.0
36:2
1.0
36:33
.0
36:4
5.0
36:57
.0
37:0
9.0
37:2
1.0
37:33
.0
37:4
5.0
37:57
.0
38:0
9.0
38:2
1.0
0
1,000
2,000
3,000
4,000
5,000
6,000
7,000
8,000 kbps Other Nokia Kyocera Palm LG
Other HTC Motorola Samsung Apple
lIcense costs (pre-publishing and post-publishing prices) Volume 1 – AVAILABLE NOW! Network and Technology Performance ($1,995)Volume 2 – Quantifying the User Experience ($1,295, $1,495)Volume 3 – Detailed Performance Analysis ($1,295, $1,495)full report – all 3 volumes ($3,300, $3,995)
contact InformatIonYou may call us at +1 (510) 273-2439 or email us at [email protected] and we will contact you for your billing information or respond to any further inquiries that you may have. Subscription information for our Signals Ahead research product, which includes these reports, can be found on the last page of this report. You can also visit our website at www.signalsresearch.com or write us at
Signals Research Group, LLC10 Ormindale CourtOakland, CA 94611
pre-order your report lIcense now (included as part of a Signals Ahead subscription)
Coming Soon!

8 October 3, 2011 | Signals Ahead, Vol. 7, Number 11–12 PREVIEW
Our three-part series of reports is included with a subscription to Signals Ahead or it can be purchased on an individual basis – the former option is far more economical since it includes at least 14 additional Signals Ahead reports. A summary of each report, including the report associated with this report preview, follows in the subsequent paragraphs.
volume 1 (network and technology performance)Next-generation network technologies are not created equal. On paper, there exist meaningful performance differences, some of which are due to channel bandwidth considerations, but also to the underlying technology itself. Further, operator deployment philosophies and the maturity of the solutions can have an over-arching impact on the results.
As operators around the globe struggle to make crucial strategic decisions regarding their network technology evolution, it is imperative that they fully understand and appreciate the potential of these technologies as well as their limitations. While this report is intended to address the needs of operators worldwide by focusing on the performance of the technologies, as a secondary feature it also provides valuable insight into the performance of each major network deployment in the United States. Everyone claims that they have the best network, but only one operator can be right.
Specific topics addressed in Volume 1 include, but are not limited to, the following:
➤➤ Application and/or Physical Layer Throughput
➤➤ Mean, median and CDF plots
➤➤ Geo plots of throughput for all test scenarios using Google Earth
➤➤ Technology comparisons, including
➤➤ DC-HSDPA versus LTE (2x10MHz) with 2x2 MIMO
➤➤ LTE (2x20MHz) versus LTE (2x10MHz)
➤➤ Mobile WiMAX versus HSPA+, LTE and DC-HSDPA
➤➤ DC-HSDPA versus HSPA+
➤➤ EV-DO versus LTE, HSPA+, etc
➤➤ Single User Spectral Efficiency Results
➤➤ Throughput normalized for channel bandwidth and duplex scheme
➤➤ Does LTE with MIMO really outperform narrow bandwidth solutions
➤➤ LTE network performance with multiple devices
➤➤ DC-HSDPA and HSPA+ devices in the same 10MHz channel allocations
➤➤ Side-by-Side operator network coverage maps for drive routes used in each market
➤➤ Downlink throughput
➤➤ Uplink throughput
➤➤ Network Latency
➤➤ Variance based on time of day and network loading
➤➤ LTE network deployment philosophies (LTE cell site density relative to the legacy network) and their implications for coverage and capacity
➤➤ AT&T HSPA+ versus AT&T LTE
volume 1 is critical for operators around the
globe who are currently making strategic decisions
regarding their network technology evolution.

9 October 3, 2011 | Signals Ahead, Vol. 7, Number 11–12 PREVIEW
➤➤ Verizon Wireless EV-DO versus Verizon Wireless LTE
➤➤ AT&T LTE versus Verizon Wireless LTE
➤➤ Mobile WiMAX (2500MHz) versus LTE (700MHz)
volume 2 (Quantifying the user experience)Although mobile operators, industry pundits and most well-informed consumers understand the notion that a higher megabit-per-second throughput is preferable, the typical consumer is generally clueless when it comes to understanding what these obscure marketing messages really mean for the mobile Internet experience. Most operators recognize that they need to move away from the “my pipe is bigger than your pipe” marketing mentality, but it is easier said than done.
Further, it is readily apparent that the capabilities of these next-generation networks frequently exceed the requirements of the application and/or the capabilities of the Internet itself. Very few applications and/or web site servers support high double-digit megabit-per-second throughput. Instead, it may actually be the combination of relatively high throughput and low network latency
– offset by transport latency – that really defines the user experience. But to what degree do these relationships provide the most benefit to the user?
Mobile video, be it YouTube or Netflix, is driving mobile data growth and the capabilities of next-generation networks will only serve as an impetus to even higher data usage. The perceived quality of the video playback also matters, not only for consumers, but also for mobile operators, content owners, and video hosting services. As higher resolution video formats with higher encoding rates become more mainstream, this issue becomes even more important, especially if the performance of next-generation networks fails to keep up with the requirements of the video content.
This report is critical for operators trying to understand how to market their broadband wireless service offering as well as how they should prioritize their network optimization activities in order to achieve the best possible user experience for their subscribers. In addition to mobile operators, this report provides invaluable insight to application developers and content providers who require a greater appreciation for how network performance characteristics impact the user experience.
Specific topics addressed in Volume 2 may include, but are not limited to, the following:
➤➤ Quantifying the user experience based on HTTP web page download times
➤➤ Popular websites, including Yahoo, CNN, iTunes, Amazon, YouTube, etc.
➤➤ Results down to the millisecond, based on device/chipset signaling messages
➤➤ Network/technology comparisons
➤➤ Comparisons based on network loading – same location over a 12-15 hour period of time
➤➤ Determining if perceived differences in network/technology performance have more to do with network loading than the actual capabilities of the network/technology itself
➤➤ Determining how the combination of throughput and latency impact the HTTP web page download time results
➤➤ 3 axis plot, showing maximum achievable throughput and network latency versus webpage load time and required throughput
➤➤ Which matters most – latency or throughput
➤➤ Does DC-HSDPA really offer a quantifiable benefit over HSPA+
➤➤ Determining the crossover point when higher throughput become irrelevant
volume 2 is critical for operators trying
to understand how to market their broadband wireless service offering
as well as how they should prioritize their network optimization activities.
10 October 3, 2011 | Signals Ahead, Vol. 7, Number 11–12 PREVIEW
➤➤ Quantifying the user experience based on downloading Google email attachments
➤➤ Quantifying the user experience based on downloading video and audio content from iTunes
➤➤ Determining the crossover point when higher throughput become irrelevant
➤➤ Netflix video streaming requirements
➤➤ Determining the chokepoints in the network (from end user to the original source of the content), how they vary as a function of loading, and their impact on the user experience
volume 3 (detailed performance analysis)In our third and final installment we delve much deeper into the KPIs that we captured with the Accuver suite of drive test tools. As we have witnessed in the past there are discernible differences in how each vendor implements a technology. Frankly, some vendors do a much better job than their peers.
Given that we collected network performance data in a number of key markets and that we know-ingly included virtually every single vendor + technology combination that exists in North America, this report provides invaluable competitive intelligence for vendors, subsystem suppliers and mobile operators.
Further, by peeling back the layers of the proverbial technology onion it becomes possible to gain a greater appreciation for how each technology delivers its results.
Specific topics addressed in Volume 3 may include, but are not limited to, the following:
➤➤ Modulation Utilization (QPSK, 16QAM, and 64QAM) – by primary and/or secondary carriers as appropriate
➤➤ MIMO RI 1 and RI 2 – how MIMO performs at 700MHz
➤➤ CQI (average and median) – by primary and secondary carriers
➤➤ HS-PDSCH Codes (average, % > 10, distribution) – by primary and secondary carriers
➤➤ HS-SCCH Scheduling Success Rate – by primary and secondary carriers
➤➤ Average PHY Layer Served Rate – by primary and secondary carriers
➤➤ Maximum PHY Layer Scheduled/Served Rate – DC-HSDPA only
➤➤ UL Transmit Power (average and median)
We will also leverage the capabilities of the XCAP-M tool to analyze these KPIs by several different means, potentially including, but not limited to the following:
➤➤ MAC-HS Throughput versus RSCP scatter plot
➤➤ MAC-HS Throughput versus Reported CQI Values scatter plot
➤➤ Reported CQI Values versus 64QAM Availability scatter plot
➤➤ MAC-HS Throughput versus Cell ID (real time)
➤➤ MAC-HS Throughput versus # of Assigned HS-PDSCH Codes (real time)
➤➤ MAC-HS Throughput (primary, secondary, and combined)
➤➤ HSPA+ MAC-HS Throughput versus DC-HSDPA MAC-HS Throughput (primary, secondary and combined)
volume 3 provides invaluable competitive intelligence while also
allowing readers to obtain a greater appreciation
for how each technology delivers its results.

11 October 3, 2011 | Signals Ahead, Vol. 7, Number 11–12 PREVIEW
➤➤ CINR versus RSSI (scatter plot and real-time)
➤➤ Throughput versus CINR (scatter plot and real-time)
➤➤ Throughput versus Cell ID (e.g., handover performance)
➤➤ CINR versus RSSI (scatter plot and real-time)
➤➤ CINR versus Modulation Scheme and/or MCS
➤➤ UL Transmit Power versus Cell ID
➤➤ UL Throughput versus Transmit Power
➤➤ Modulation Scheme (antenna 1 and antenna 2)
potential topics for the coming year include:
➤➤ The Mother of all Network Drive Tests (LTE, DC-HSDPA, HSPA+, Rev A and Mobile WiMAX)
➤➤ The challenges of delivering video in a mobile network
➤➤ How network performance (throughput and latency) impacts the user experience
➤➤ Embedded modules/netbooks
➤➤ TD-LTE network performance benchmark results
➤➤ CoMP and LTE Advanced
➤➤ Going Green – financial implications and challenges
➤➤ Smartphone signaling implications and LTE
➤➤ LTE chipset performance benchmark test results
➤➤ The impact of Type 3i receivers on UE performance (includes chipset benchmark tests of leading solutions)
➤➤ Whatever happened to IMS?
➤➤ LTE Americas
➤➤ 4G World and GSMA MAC
➤➤ HSPA+ (MIMO) network performance benchmark results
➤➤ The impact of latency
➤➤ Public Safety Options with 700MHz
➤➤ EV-DO Rev B network performance benchmark results
➤➤ LTE chipset landscape

12 October 3, 2011 | Signals Ahead, Vol. 7, Number 11–12 PREVIEW
➤➤ 7/6/11 “Mobile Platforms – the center of mobile networks” In this report we discuss the recent trends impacting the various mobile platforms that exist and what has transpired since our piece from three years ago on Web 2.0. We address the state of the mobile platforms that exist, provide our thoughts on the current and future prospects and look at the various trends that are driving the industry.
➤➤ 6/8/2011 “United we stand, fragmented we fail” We provide the key takeaways from the LTE World Summit, held in Amsterdam. Spectrum fragmentation tops the list of key LTE topics, although a growing focus on the use of 1800MHz for those operators that have access to it is encouraging. VoLTE, or the lack thereof, is still on everyone’s minds, but in the interim CSFB isn’t even working as promised. Finally, there was a lot of talk about Mobile WiMAX, but the emphasis seemed to be on how to best move away from the technology and adopt TD-LTE.
➤➤ 5/16/2011 “HetNet: When big cells and small cells collide” In addition to covering the basics of heterogeneous networks (HetNet), a key LTE-Advanced (R10) feature, we present a compelling series of analytical studies which demon-strate the need for macro network offload, starting as early as 2015. We also get into the technical details of how HetNet works, including discussions on eICIC, ABS and the impor-tance of interference cancellation in the handset. Finally, we look at what is being done with legacy 3G femtocells to limit interference-related problems that they introduce, both with the macro network and between each other.
➤➤ 4/26/2011 “Chips and Salsa XIII: Now Seasoned with Soy Sauce” In collaboration with Spirent Communications we provide results from the industry’s only independent performance benchmark tests of HSPA+/HSPA chipsets. In the most recent benchmark study we tested 16 different device configurations, representing chipsets from 9 different suppliers, including new entrants, such as Samsung (HSPA+), Intel (HSPA+), MediaTek and HiSilicon. We provide the results, based on a total of 42 HSPA+ test scenarios and 26 HSPA test scenarios.
➤➤ 3/15/2011 “Looking beyond HSPA+: keeping up with the Joneses” Based on interviews with 3GPP member companies and a thorough review of 3GPP submissions, we offer an in-depth look at the future of HSPA+ (Release 11 and beyond). Ultimately, we conclude that many of the features that are being incorporated into LTE will find their way into HSPA+, thus blurring the performance differences between the two technologies. Latency and the impact of new features on legacy devices are two areas of prime importance where HSPA+ could face challenges relative to LTE.
➤➤ 1/12/2011 “DC-HSDPA: Double the Bandwidth, Double the Pleasure, Part II” In collaboration with Accuver, who provided us with its XCAL-W drive test tool and XCAP-W post-processing software, we provide results and analysis from an extensive drive test of Telstra’s DC-HSDPA network. We compare DC-HSDPA with HSPA+ performance in a number of side-by-side tests.
➤➤ 1/12/2011 DC-HSDPA: “Double the Bandwidth, Double the Pleasure, Part I” In collaboration with Accuver, who provided us with its XCAL-W drive test tool and XCAP-W post-processing software, we provide results and analysis from an extensive drive test of Telstra’s DC-HSDPA network. We compare DC-HSDPA with HSPA+ performance in a number of side-by-side tests.
➤➤ 12/10/2010“Can you schedule me now?” In collabora-tion with Sanjole we examine how some of today’s commer-cial LTE eNodeBs allocate network resources when serving multiple devices. We determine that while LTE may deliver a compelling user experience, it is largely due to an empty network and the large channel bandwidths, and that further improvements are necessary if LTE is going to support multiple users in an efficient manner.
➤➤➤12/3/2010 “A Perspective from LTE Americas and the GSMA Mobile Asia Congress” We provide and discuss various data points which stem from our participation at the LTE Americas event in Dallas and the GSMA MAC event in Hong Kong. We provide an LTE market update, including TD-LTE, discuss the debate about a smart or dumb pipe strategy, and the impact of smartphones and social networking services, including the use of cloud computing, intelligent networks, network offloading and data caching.
➤➤➤11/4/2010 “A G-Wiz World” We provide drive test results for TeliaSonera’s HSPA+ network in Sweden and provide data points from this year’s 4G World event in Chicago. We also discuss the growing trend of operators who are intelligently adding more capacity to their networks through the use of higher performing devices/chipsets and upgrades to their network infrastructure.
➤➤➤10/7/2010 “2x20MHz of LTE and the Heisenberg Uncertainty Principle” We provide an update on LTE network performance based on extensive testing of TeliaSonera’s LTE networks in Stockholm and Gothenburg, Sweden. The 60+ page report provides detailed results and analysis based on more than 600GB of transferred data.
In Case You Missed It
13 October 3, 2011 | Signals Ahead, Vol. 7, Number 11–12 PREVIEW
table of contentsVolume 1: Network and Technology Performance ………………………………………………………………………………………… 1
1.0 Executive Summary ……………………………………………………………………………………………………………………………………… 3
2.0 Introduction ……………………………………………………………………………………………………………………………………………… 14
3.0 Key Conclusions and Observations …………………………………………………………………………………………………………… 16
4.0 Detailed Test Results and Analysis – Downlink Throughput …………………………………………………………………… 30
4.1 Clearwire 2x20MHz LTE – Phoenix demonstration network ……………………………………………………………………… 30
4.2 dc-hsdpa versus lte ……………………………………………………………………………………………………………………………… 32
4.2.1 DC-HSDPA versus LTE (Dallas, June 16, 2011 – 0650) ………………………………………………………………………………… 32
4.3 dc-hsdpa and hspa+ results ……………………………………………………………………………………………………………… 37
4.3.1 DC-HSDPA and HSPA+ Results (Houston, September 6, 0638) …………………………………………………………………… 37
4.3.2 DC-HSDPA and HSPA+ Results (Oakland, July 8, 0540 ……………………………………………………………………………… 39
4.3.3 DC-HSDPA and HSPA+ (San Francisco, June 29, 1245 ……………………………………………………………………………… 40
4.4 LTE and LTE Results …………………………………………………………………………………………………………………………………… 42
4.4.1 LTE and LTE Results (Oakland, July 8, 0652) ……………………………………………………………………………………………… 42
4.4.2 Verizon Wireless LTE and Verizon Wireless LTE Results (Houston, September 6, 0910) …………………………………………………………………………………………………………………… 43
4.4.3 Verizon Wireless LTE and Verizon Wireless LTE Results (Houston, September 6, 0957) …………………………………………………………………………………………………………………… 44
4.5 all technologies …………………………………………………………………………………………………………………………………… 45
4.5.1 All Technologies (Dallas, June 14, 1450) …………………………………………………………………………………………………… 45
4.5.2 All Technologies (Dallas, June 14, 1515) …………………………………………………………………………………………………… 46
4.5.3 All Technologies (San Francisco) …………………………………………………………………………………………………………… 47
4.6 verizon wireless lte versus at&t lte ……………………………………………………………………………………………………… 59
4.6.1 Verizon Wireless LTE versus AT&T LTE (Houston, September 5, 1501) ………………………………………………………… 61
4.6.2 Verizon Wireless LTE versus AT&T LTE (Houston, September 5, 0634) ……………………………………………………… 63
4.7 hspa+ versus mobile wimaX (kansas city, June 17, 0540) ………………………………………………………………………… 65
4.8 hspa+ versus hspa+ (kansas city, June 17, 1300) ……………………………………………………………………………………… 67
4.9 dc-hsdpa versus mobile wimaX (houston, september 6, 0722) …………………………………………………………… 68
4.10 LTE versus HSPA+ (Houston, September 5, 1622) ……………………………………………………………………………………… 69
5.0 Detailed Test Results and Analysis – Uplink Throughput ………………………………………………………………………… 72
5.1 clearwire 2x20mhz lte – phoenix demonstration network ……………………………………………………………………… 72
5.2 All Technologies …………………………………………………………………………………………………………………………………… 73
5.2.1 DC-HSDPA versus LTE (Dallas, June 16, 0815) …………………………………………………………………………………………… 73
5.2.2 All Technologies (San Jose, July 1, 1425) …………………………………………………………………………………………………… 75
5.3 lte focus – multiple devices and network comparisons …………………………………………………………………………… 77
5.3.1 Verizon Wireless (San Francisco, July 17, 0805) ………………………………………………………………………………………… 77
5.3.2 AT&T (Houston, September 7, 1212) ………………………………………………………………………………………………………… 78
5.3.3 Verizon Wireless LTE versus AT&T LTE (Houston, September 5-7) ……………………………………………………………… 80
14 October 3, 2011 | Signals Ahead, Vol. 7, Number 11–12 PREVIEW
6.0 Detailed Test Results and Analysis – Latency …………………………………………………………………………………………… 81
6.1 clearwire and verizon wireless lte networks (phoenix, June 10) ……………………………………………………………… 81
6.2 numerous technologies (dallas) ……………………………………………………………………………………………………………… 83
6.2.1 Numerous Technologies (Dallas, June 14, 0930) ………………………………………………………………………………………… 83
6.2.2 All Technologies (Dallas, June 14, 1600) ………………………………………………………………………………………………… 84
6.3 numerous technologies (kansas city) ……………………………………………………………………………………………………… 85
6.3.1 Numerous Technologies (Kansas City, June 17, 1340) ………………………………………………………………………………… 85
6.3.2 Numerous Technologies (Kansas City, June 17, 1450) ………………………………………………………………………………… 86
6.3.3 LTE and EV-DO Rev A (Kansas City Airport, June 17, 1815) ………………………………………………………………………… 87
6.4 all technologies …………………………………………………………………………………………………………………………………… 88
6.4.1 All Technologies (Oakland Hills, June 29, 1700) ………………………………………………………………………………………… 88
6.4.2 All Technologies (San Francisco, July 29) ………………………………………………………………………………………………… 89
6.4.3 All Technologies (Houston) …………………………………………………………………………………………………………………… 90
7.0 Network Design Criteria …………………………………………………………………………………………………………………………… 91
7.1 multiple technologies …………………………………………………………………………………………………………………………… 92
7.1.1 Downtown San Francisco – all technologies 92
7.1.2 Dallas ………………………………………………………………………………………………………………………………………………… 96
7.1.3 Peninsula …………………………………………………………………………………………………………………………………………… 99
7.2 verizon wireless ev-do versus verizon wireless lte – multiple scenarios 103
7.3 at&t hspa+ versus at&t lte – multiple scenarios 105
7.4 at&t lte versus verizon wireless lte – multiple scenarios 109
8.0 Test Methodology ………………………………………………………………………………………………………………………………… 114
9.0 Conclusions …………………………………………………………………………………………………………………………………………… 117
10.0 Appendix 1 …………………………………………………………………………………………………………………………………………… 118
15 October 3, 2011 | Signals Ahead, Vol. 7, Number 11–12 PREVIEW
Index of figuresfigure 1. Clearwire 2x20MHz LTE APP Layer Downlink Throughput Results – CDF and Pie Chart Distribution ……………30
figure 2. Clearwire 2x20MHz Vehicular Mode – Geo Plot of Downlink APP Layer Data Rates ………………………………… 31
figure 3. DC-HSDPA versus LTE APP Layer Downlink Throughput versus Time (Test Scenario 2) ………………………………… 32
figure 4. DC-HSDPA versus LTE APP Layer Downlink Throughput – CDF (Test Scenario 2) ………………………………………… 33
figure 5. DC-HSDPA Performance in Dallas during early Morning Hours – Geo Plot of App Layer Throughput …………… 34
figure 6. DC-HSDPA APP Layer Downlink Throughput Results for all Dallas Test Scenarios - CDF and Pie Chart ………… 35
figure 7. LTE APP Layer Downlink Throughput Results for all Dallas Test Scenarios - CDF and Pie Chart …………………… 36
figure 8. Drive Route (Test Scenario 157) ……………………………………………………………………………………………………………… 37
figure 9. DC-HSDPA and HSPA+ APP Layer Downlink Throughput Results for all Dallas Test Scenarios – CDF (Test Scenario 157) ………………………………………………………………………………………………………………………………………… 38
figure 10. DC-HSDPA and HSPA+ APP Layer Downlink Throughput versus Time (Test Scenario 114) …………………………… 39
figure 11. DC-HSDPA and HSPA+ APP Layer Downlink Throughput versus Time (Test Scenario 103) ……………………………40
figure 12. Drive Route (Test Scenarios 102-103) …………………………………………………………………………………………………… 41
figure 13. LTE and LTE APP Layer Downlink Throughput versus Time (Test Scenario 115) …………………………………………… 42
figure 14. LTE and LTE APP Layer Downlink Throughput versus Time (Test Scenario 152) …………………………………………… 43
figure 15. Drive Route (Test Scenario 152) ……………………………………………………………………………………………………………… 43
figure 16. LTE and LTE APP Layer Downlink Throughput versus Time (Test Scenario 161) ……………………………………………44
figure 17. All Technologies APP Layer Throughput Results – CDF (Test Scenario 12) ………………………………………………… 45
figure 18. Drive Route – Test Scenarios 12-13 …………………………………………………………………………………………………………46
figure 19. All Technologies APP Layer Downlink Throughput Results – CDF (Test Scenario 13) …………………………………… 47
figure 20. All Technologies APP Layer Downlink Throughput Results – CDF and Pie Chart Distribution (Bay Area, July 1) ……………………………………………………………………………………………………48
figure 21. All Technologies APP Layer Downlink Throughput Results – CDF and Pie Chart Distribution (Oakland, July 8) ……………………………………………………………………………………………………49
figure 22. Drive Route – Bay Area (Oakland, San Jose, San Francisco, and all points in between) ………………………………50
figure 23. Drive Route – Test Scenario 73 …………………………………………………………………………………………………………… 51
figure 24. All Technologies APP Layer Downlink Throughput versus Time (Test Scenario 73) …………………………………… 52
figure 25. All Technologies APP Layer Downlink Throughput Results – CDF (Test Scenario 73) ………………………………… 52
figure 26. All Technologies APP Layer Downlink Throughput Results with Bandwidth and MIMO Adjustments – CDF (Test Scenario 33) ………………………………………………………………………………………………………………………………………… 53
figure 27. Drive Route – Test Scenarios 83 and 88 ……………………………………………………………………………………………… 53
figure 28. All Technologies APP Layer Downlink Throughput versus Time (Test Scenario 83) …………………………………… 54
figure 29. All Technologies APP Layer Downlink Throughput Results – CDF (Test Scenario 83) ………………………………… 54
figure 30. All Technologies APP Layer Downlink Throughput Results with Bandwidth and MIMO Adjustments – CDF (Test Scenario 83) ………………………………………………………………………………………………………………………………………… 55
figure 31. All Technologies APP Layer Downlink Throughput versus Time (Test Scenario 88) …………………………………… 55
figure 32. All Technologies APP Layer Downlink Throughput Results – CDF (Test Scenario 88) ………………………………… 56
figure 33. All Technologies APP Layer Downlink Throughput Results with Bandwidth and MIMO Adjustments – CDF (Test Scenario 88) ………………………………………………………………………………………………………………………………………… 56

16 October 3, 2011 | Signals Ahead, Vol. 7, Number 11–12 PREVIEW
figure 34. Drive Route – Test Scenario 104 …………………………………………………………………………………………………………… 57
figure 35. All Technologies APP Layer Downlink Throughput versus Time (Test Scenario 104) …………………………………… 58
figure 36. All Technologies APP Layer Downlink Throughput Results – CDF (Test Scenario 104)………………………………… 58
figure 37. AT&T LTE PHY Layer Downlink Throughput Results – geo plot (Houston) ………………………………………………… 59
figure 38. Verizon Wireless LTE versus AT&T Wireless LTE PHY Layer Downlink Throughput Results – CDF (ALL COMPARATIVE RESULTS) ………………………………………………………………………………………………………………………60
figure 39. Drive Route – Test Scenario 137 …………………………………………………………………………………………………………… 61
figure 40. Verizon Wireless LTE versus AT&T Wireless PHY Layer Downlink Throughput versus Time (Test Scenario 137) ……………………………………………………………………………………………………………………………………………… 62
figure 41. Verizon Wireless LTE versus AT&T Wireless LTE PHY Layer Downlink Throughput Results – CDF (Test Scenario 137) ………………………………………………………………………………………………………………………………………… 62
figure 42. Drive Route – Test Scenario 124 …………………………………………………………………………………………………………… 63
figure 43. Verizon Wireless LTE versus AT&T Wireless PHY Layer Downlink Throughput versus Time (Test Scenario 124) ………………………………………………………………………………………………………………………………………………64
figure 44. Verizon Wireless LTE versus AT&T Wireless LTE PHY Layer Downlink Throughput Results – CDF (Test Scenario 124) …………………………………………………………………………………………………………………………………………64
figure 45. Drive Route – Test Scenario 3665
figure 46. HSPA+ versus Mobile WiMAX APP Layer Downlink Results – CDF (Test Scenario 36)66
figure 47. Drive Route – Test Scenario 4367
figure 48. T-Mobile HSPA+ and AT&T HSPA+ APP Layer Downlink Results – CDF (Test Scenario 43) …………………………… 67
figure 49. T-Mobile DC-HSDPA and Clearwire Mobile WiMAX APP Layer Downlink Results – CDF (Test Scenario 158-159) …………………………………………………………………………………………………………………………………68
figure 50. AT&T LTE and AT&T HSPA+ PHY/MAC Layer Downlink Results – CDF (Test Scenario 140) ……………………………69
figure 51. Drive Route – Test Scenario 140 ……………………………………………………………………………………………………………70
figure 52.Inter-RAT Handover ………………………………………………………………………………………………………………………………70
figure 53. Clearwire 2x20MHz LTE Uplink Throughput Results – CDF and Pie Chart Distribution (Test Scenario 57) ………………………………………………………………………………………………… 72
figure 54. Drive Route – Test Scenario 4 ……………………………………………………………………………………………………………… 73
figure 55. DC-HSDPA versus LTE APP Layer Uplink Throughput versus Time (Test Scenario 4) …………………………………… 74
figure 56. DC-HSDPA versus LTE APP Layer Uplink Throughput Results – CDF (Test Scenario 4) ………………………………… 74
figure 57. All Technologies APP Layer Uplink Throughput versus Time (Test Scenario 97) ………………………………………… 75
figure 58. All Technologies APP Layer Uplink Throughput Results – CDF (Test Scenario 97) ……………………………………… 75
figure 59. All Technologies APP Layer Uplink Throughput Results with Bandwidth Adjustments – CDF (Test Scenario 97) ………………………………………………………………………………………………………………………………………… 76
figure 60. LTE APP Layer Uplink Throughput versus Time (Test Scenario 119) ……………………………………………………………77
figure 61. LTE PHY Layer Uplink Throughput versus Time (Test Scenario 150) ……………………………………………………………78
figure 62. AT&T LTE PHY Layer Uplink Throughput Results – geo plot (Houston)………………………………………………………79
figure 63. Verizon Wireless LTE and AT&T LTE APP Layer Uplink Throughput Results – CDF (ALL RESULTS) ………………80
figure 64. Clearwire Demo LTE and Verizon Wireless LTE Latency Results (Test Scenario 2, 4) ………………………………… 81
figure 65. LTE, DC-HSDPA and HSPA+ Latency Results (Test Scenario 5) …………………………………………………………………… 83
figure 66. All Technologies Latency Results (Test Scenario 13) …………………………………………………………………………………84
figure 67. AT&T HSPA+, Mobile WiMAX and Verizon Wireless EV-DO Rev A Latency Results (Test Scenario 17) ………… 85

17 October 3, 2011 | Signals Ahead, Vol. 7, Number 11–12 PREVIEW
figure 68. AT&T HSPA+, T-Mobile HSPA+ and Verizon Wireless EV-DO Rev A Latency Results (Test Scenario 18) …………86
figure 69. Verizon Wireless LTE and EV-DO Rev A Latency Results (Test Scenario 20) ………………………………………………87
figure 70. All Technologies Latency Results (Test Scenario 21) …………………………………………………………………………………88
figure 71. All Technologies Latency Results ……………………………………………………………………………………………………………89
figure 72. All Technologies Latency Results …………………………………………………………………………………………………………90
figure 73. Drive Route with Serving Cell ID Sector Information – San Francisco (by network) Verizon Wireless EV-DO Rev A – 850/1900MHz ……………………………………………………………………………………………………92
figure 73a. Drive Route with Serving Cell ID Sector Information – San Francisco (by network) Verizon Wireless LTE – 700MHz …………………………………………………………………………………………………………………………… 93
figure 73b. Drive Route with Serving Cell ID Sector Information – San Francisco (by network) AT&T HSPA+ – 1900MHz ……………………………………………………………………………………………………………………………………… 93
figure 73c. Drive Route with Serving Cell ID Sector Information – San Francisco (by network) T-Mobile DC-HSDPA – 1700MHz ……………………………………………………………………………………………………………………………94
figure 74. Cell Sector Handoffs versus Time – San Francisco (by network) ……………………………………………………………… 95
figure 75. Drive Route with Serving Cell ID Sector Information – Dallas (by network) Verizon Wireless LTE – 700MHz ……………………………………………………………………………………………………………………………96
figure 75a. Drive Route with Serving Cell ID Sector Information – Dallas (by network) Clearwire Mobile WiMAX – 2500MHz …………………………………………………………………………………………………………………96
figure 75b. Drive Route with Serving Cell ID Sector Information – Dallas (by network) T-Mobile DC-HSDPA – 1700MHz ……………………………………………………………………………………………………………………………97
figure 75c. Drive Route with Serving Cell ID Sector Information – Dallas (by network) AT&T HSPA+ Coverage – 850MHz …………………………………………………………………………………………………………………………97
figure 76. Cell Sector Handoffs versus Time – Dallas (by network) …………………………………………………………………………98
figure 77. Drive Route with Serving Cell ID Sector Information – Peninsula (by network) AT&T HSPA+ – 850/1900MHz ………………………………………………………………………………………………………………………………99
figure 77. Drive Route with Serving Cell ID Sector Information – Peninsula (by network) Clearwire Mobile WiMAX – 2500MHz ……………………………………………………………………………………………………………… 100
figure 77a. Drive Route with Serving Cell ID Sector Information – Peninsula (by network) T-Mobile DC-HSDPA – 1700MHz ……………………………………………………………………………………………………………………… 100
figure 77b. Drive Route with Serving Cell ID Sector Information – Peninsula (by network) Verizon Wireless EV-DO Rev A – 850MHz ………………………………………………………………………………………………………… 101
figure 77c. Drive Route with Serving Cell ID Sector Information – Peninsula (by network) Verizon Wireless LTE – 700MHz ………………………………………………………………………………………………………………………… 101
figure 78. Cell Sector Handoffs versus Time – Peninsula (HSPA+ and Mobile WiMAX) ………………………………………… 102
figure 79. Drive Route with Serving Cell ID Sector Information – San Francisco and Oakland (EV-DO Rev A and LTE) Verizon Wireless EV-DO Rev A – 850/1900MHz ……………………… 103
figure 79a. Drive Route with Serving Cell ID Sector Information – San Francisco and Oakland (EV-DO Rev A and LTE) Verizon Wireless LTE – 700MHz …………………………………………… 104
figure 80. Cell Sector Handoffs versus Time – Peninsula (EV-DO Rev A and LTE) ………………………………………………… 104
figure 81. Drive Route with Serving Cell ID Sector Information – Houston (HSPA+ and LTE) AT&T HSPA+ – 1900MHz ………………………………………………………………………………………………………………………………… 105
figure 81a. Drive Route with Serving Cell ID Sector Information – Houston (HSPA+ and LTE) AT&T LTE – 700MHz ………………………………………………………………………………………………………………………………………… 106
figure 82. Cell Sector Handoffs versus Time – Houston (HSPA+ 1900MHz and LTE) ……………………………………………… 106

18 October 3, 2011 | Signals Ahead, Vol. 7, Number 11–12 PREVIEW
figure 83. Drive Route with Serving Cell ID Sector Information – Houston (HSPA+ and LTE) AT&T HSPA+ – 850MHz/1900MHz …………………………………………………………………………………………………………………… 107
figure 83a. Drive Route with Serving Cell ID Sector Information – Houston (HSPA+ and LTE) AT&T LTE – 700MHz ………………………………………………………………………………………………………………………………………… 108
figure 84. Drive Route with Serving Cell ID Sector Information – Houston (LTE and LTE) AT&T LTE – 700MHz ………………………………………………………………………………………………………………………………………… 109
figure 84a. Drive Route with Serving Cell ID Sector Information – Houston (LTE and LTE) Verizon Wireless LTE – 700MHz ………………………………………………………………………………………………………………………… 110
figure 85. Cell Sector Handoffs versus Time – Houston (LTE and LTE) ………………………………………………………………… 110
figure 86. Drive Route with Serving Cell ID Sector Information – Houston (LTE and LTE) AT&T LTE – 700MHz ……………………………………………………………………………………………………………………………………………111
figure 86a. Drive Route with Serving Cell ID Sector Information – Houston (LTE and LTE) Verizon Wireless LTE – 700MHz ………………………………………………………………………………………………………………………… 112
figure 87. Cell Sector Handoffs versus Time – Houston (LTE and LTE) ………………………………………………………………… 112
figure 88. XCAL-M Drive Test Tool in Action – DL performance ………………………………………………………………………… 114
figure 89. XCAL-M Drive Test Tool in Action – UL performance ………………………………………………………………………… 115
figure 90. Verizon Wireless APP Layer Downlink Throughput Results – CDF and Pie Chart Distribution (Phoenix) … 118
figure 91. Verizon Wireless APP Layer Uplink Throughput Results – CDF and Pie Chart Distribution (Phoenix) ……… 118
figure 92. Clearwire Mobile WiMAX APP Layer Downlink Throughput Results – CDF and Pie Chart Distribution (Dallas) ……………………………………………………………………………………………………………… 119
figure 93. Clearwire Mobile WiMAX APP Layer Downlink Throughput Results – geo plot (Dallas) ………………………… 119
figure 94. Clearwire Mobile WiMAX APP Layer Uplink Throughput Results – CDF and Pie Chart Distribution (Dallas) ……………………………………………………………………………………………………………… 120
figure 95. Verizon Wireless LTE APP Layer Downlink Throughput Results – CDF and Pie Chart Distribution (Dallas) 120
figure 96. Verizon Wireless LTE APP Layer Downlink Throughput Results – geo plot (Dallas) ………………………………… 121
figure 97. Verizon Wireless LTE APP Layer Uplink Throughput Results – CDF and Pie Chart Distribution (Dallas) …… 121
figure 98. T-Mobile DC-HSDPA APP Layer Downlink Throughput Results – CDF and Pie Chart Distribution (Dallas) 122
figure 99. T-Mobile DC-HSDPA APP Layer Downlink Throughput Results – geo plot (Dallas) ………………………………… 122
figure 100. T-Mobile DC-HSDPA APP Layer Uplink Throughput Results – CDF and Pie Chart Distribution (Dallas) … 123
figure 101. AT&T HSPA+ APP Layer Downlink Throughput Results – CDF and Pie Chart Distribution (Dallas) ………… 123
figure 102. AT&T HSPA+ APP Layer Downlink Throughput Results – geo plot (Dallas) …………………………………………… 124
figure 103. AT&T HSPA+ APP Layer Uplink Throughput Results – CDF and Pie Chart Distribution (Dallas) ……………… 124
figure 104. AT&T HSPA+ APP Layer Downlink Throughput Results - CDF and Pie Chart Distribution (Kansas City) …… 125
figure 105. AT&T HSPA+ APP Layer Downlink Throughput Results – geo plot (Kansas City) …………………………………… 125
figure 106. AT&T HSPA+ APP Layer Uplink Throughput Results – CDF and Pie Chart Distribution (Kansas City) ……… 126
figure 107. T-Mobile HSPA+ APP Layer Downlink Throughput Results – CDF and Pie Chart Distribution (Kansas City) 126
figure 108. T-Mobile HSPA+ APP Layer Downlink Throughput Results – geo plot (Kansas City) ……………………………… 127
figure 109. T-Mobile HSPA+ APP Layer Uplink Throughput Results – CDF and Pie Chart Distribution (Kansas City) … 127
figure 110. Verizon Wireless EV-DO Rev A APP Layer Downlink Throughput Results – CDF and Pie Chart Distribution (Kansas City) ……………………………………………………………………………………………………… 128
figure 111. Verizon Wireless EV-DO Rev A APP Layer Uplink Throughput Results – CDF and Pie Chart Distribution (Kansas City) ……………………………………………………………………………………………………… 128

19 October 3, 2011 | Signals Ahead, Vol. 7, Number 11–12 PREVIEW
figure 112. Clearwire Mobile WiMAX APP Layer Downlink Throughput Results – CDF and Pie Chart Distribution (Kansas City) ……………………………………………………………………………………………………… 129
figure 113. Clearwire Mobile WiMAX APP Layer Downlink Throughput Results – geo plot (Kansas City) ……………… 129
figure 114. Clearwire Mobile WiMAX APP Layer Uplink Throughput Results – CDF and Pie Chart Distribution (Kansas City) ……………………………………………………………………………………………………… 130
figure 115. Verizon Wireless LTE APP Layer Downlink Throughput Results – geo plot (Bay Area) …………………………… 131
figure 116. Verizon Wireless EV-DO Rev A APP Layer Downlink Throughput Results – geo plot (Bay Area) ……………… 132
figure 117. T-Mobile DC-HSDPA APP Layer Downlink Throughput Results – geo plot (Bay Area) …………………………… 133
figure 118. AT&T HSPA+ APP Layer Downlink Throughput Results – geo plot (Bay Area) ……………………………………… 134
figure 119. Clearwire Mobile WiMAX APP Layer Downlink Throughput Results – geo plot (Bay Area) …………………… 135
figure 120. Cell Sector Handoffs versus Time – Oakland (by network) ……………………………………………………………… 135
figure 121. Oakland Drive Route for Cell Handover Study …………………………………………………………………………………… 136
figure 122. Verizon Wireless LTE PHY Layer Downlink Throughput Results – geo plot (Houston) …………………………… 136
figure 123. Verizon Wireless LTE PHY Layer Downlink Throughput Results – geo plot (Houston) ………………………… 137
Index of tablestable a. Summary of Downlink and Uplink Throughput Test Scenarios ……………………………………………………………… 138

20 October 3, 2011 | Signals Ahead, Vol. 7, Number 11–12 PREVIEW
8.0 test methodologyFor the drive tests that we have been conducting this summer we primarily used the Accuver XCAL-MO network benchmarking tool along with the Accuver XCAL drive test tool to collect the underlying performance indicators and to conduct the user experience tests. For purposes of our tests, we “limited” the XCAL-MO to only four dongles – one dongle for each network/technology that we wanted to test. In theory we could have installed multiple dongles for each network/technology.
We used the Accuver XCAP post-processing tool to analyze the data and to help us create the figures which appear in this summary report. Thanks to a combination of the powerful tool and countless hours spent on the road, we are convinced that we have witnessed network performance – both good and bad – that would have otherwise not been observed.
Figure 88 and Figure 89 illustrate a typical user display that we used when collecting the data. We have included two figures since they also help prove that we observed downlink data rates greater than 61Mbps (Figure 88) and uplink data rates in excess of 23Mbps (Figure 89).
we used the accuver Xcal-mo and Xcal-m tools
to collect the underlying performance indicators
and the accuver Xcap-m post-processing tool to
do the analysis of the data that we collected.
figure 88. Xcal-m drive test tool in action – dl performance
Source: Accuver XCAL and SRG

21 October 3, 2011 | Signals Ahead, Vol. 7, Number 11–12 PREVIEW
Each operator provided us with at least two dongles, although in the case of operators, such as Clearwire, with multiple network/technology deployments (e.g., 2x20MHz LTE and 1x10MHz Mobile WiMAX), we received multiple dongles.
In order to ensure that we fully loaded the air link channel for the networks/technologies that we were testing, we leveraged multiple high-bandwidth servers, including servers in Phoenix (>100Mbps), Dallas (300Mbps) and Chicago (150Mbps). Further, we established multiple sessions in order to offset some of effects of transport latency and the TCP ACK window associated with FTP.
Although everyone that we spoke to agreed with our approach, it did result in unintentional consequences. Specifically, we observed that the individual FTP sessions would periodically stop sending data with the frequency and the length of the stop period increasing during times when we believed the wireless networks were experiencing higher network loading. Reducing the number of FTP sessions to a single session resolved the issue and we were generally able to use at least two FTP sessions, thus solving the problem that we were originally trying to address. We can’t explain what was causing the performance issue but it was evident in all networks that we tested and across all vendors, albeit to varying degrees. We’ve ruled out RF-related issues as being the source of the problem.
For purposes of these tests, we used the Windows 7 operating system, which uses a dynamic window allocation methodology to theoretically deliver the best possible throughput for the given combination of latency and channel conditions. As we have documented in the past, we believe Windows 7 leaves something on the table, meaning that the super-high data rates associated with LTE, in particular with a 20MHz channel, are not always achieved. We believe our approach is still appropriate given that it is logistically impossible to purchase a notebook computer with the Windows XP operating system. We also note that the connection manager associated with at least one operator’s technology/network does not change the TCP window size when it is installed, meaning that the data rates could already be limited, even with the legacy operating system.
we used the windows 7 operating system, which uses a dynamic window
allocation methodology to theoretically deliver the best
possible throughput for the given combination of latency
and channel conditions.
figure 89. Xcal-m drive test tool in action – ul performance
Source: Accuver XCAL and SRG

22 October 3, 2011 | Signals Ahead, Vol. 7, Number 11–12 PREVIEW
Network latency tests were done to servers located in the vicinity of the market in which we were doing the tests. Since we can’t rule out the effect of transport latency, readers should focus their attention on the relative performance differences versus the absolute results.
Testing in each market took place from as early as 4AM local time until the early evening hours. We also did a lot of user experience testing during the dead of the night when we suspect the networks were wide open. Since we were using test equipment we had the ability to deter-mine whether or not network loading was impacting the results. Suffice it to say that in the early morning hours network loading was not a concern for any of the networks. Later in the day, network loading impacted the performance of certain networks/technologies while it was not even a consideration with other networks/technologies. We take this phenomenon into consideration when doing our analysis.
A large percentage of our test data was collected from a moving vehicle. This approach ensured that we achieved statistically meaningful results since as we have demonstrated in past reports, moving a few feet or turning 90 degrees can meaningfully impact the achievable throughput. Further, we based our analysis and conclusions on literally hundreds of Gigabytes of transferred data. This approach is markedly different from the more commonly used method which involves using popular web-based “speed testing” sites and transferring tens of Megabytes of data. From our perspective, this latter approach achieves anecdotal results which are statistically meaningless and not neces-sarily reflective of the overall network performance. This sampling of the network performance also provides no insight whatsoever into how/why the throughput was achieved since the KPIs are limited to throughput and latency, versus KPIs, such as modulation type, number of assigned resource blocks, MIMO availability, scheduling frequency, etc.
One drawback of our approach is that it does tend to understate the performance of the network since the fading conditions from a moving vehicle are more challenging than from a stationary position or someone walking down the street. Given the emergence of next-generation smartphones (LTE, HSPA+, Mobile WiMAX, etc.), accessing the broadband wireless network from a moving vehicle will be more commonplace now than in the past. Ideally, we would include stationary tests from hundreds of locations in a given market and all times of day, but this approach goes well beyond something that we can reasonably do for these studies.
Although we do not include results from our user experience tests in this summary report, we used popular websites for our HTTP web page download tests and Google Mail for the email application. We also used popular video content delivery services, such as Netflix and YouTube, not to mention Skype Video and iTunes where we downloaded numerous large files of video content.
Like all Signals Ahead reports, we received no sponsorship or funding from the participating companies, in order to maintain our independence. As such, we foot the bill for all of our travel expenses not to mention an inordinate amount of time and effort collecting the data and writing these series of reports.
We also could not have done this report without the support of Accuver who provided us with its suite of drive test tools and post-processing software. SRG takes full responsibility for the analysis and conclusions that are documented in this report and in our forthcoming series of reports.
by testing from a moving vehicle and by transferring
hundreds of gigabytes of data, we believe that
our conclusions are statistically significant, even if the results may
slightly understate the true capabilities of the network.

23 October 3, 2011 | Signals Ahead, Vol. 7, Number 11–12 PREVIEW
michael thelanderMichael Thelander is the CEO and Founder of Signals Research Group. In his current
endeavor he leads a team of industry experts providing technical and operator economics anal-ysis for clients on a global basis. Mr. Thelander is also responsible for the consultancy’s Signals Ahead research product, including its widely acclaimed “Chips and Salsa” series of reports that focus on the wireless IC industry.
Previously, Mr. Thelander was an analyst with Deutsche Bank Equity Research. Prior to joining Deutsche Bank, Mr. Thelander was a consultant with KPMG (now known as BearingPoint) and a communications officer with the United States Army. Mr. Thelander has also published numerous articles for leading trade publications and engineering journals throughout his career.
He has been an invited speaker at industry conferences around the world and he is frequently quoted by major news sources and industry newsletters, including The Economist, The Wall Street Journal, Investors Business Daily, Reuters, Bloomberg News, and The China Daily. Mr. Thelander earned a Masters of Science in Solid State Physics from North Carolina State University and a Masters of Business Administration from the University of Chicago, Graduate School of Business.
Come join us!4g world, Chicago, IL Oct. 24-27lte americas, Dallas, TX Nov. 8-9 Invited speakerrcr wireless oc event, Orange County, CA Nov. 10 Invited Speaker
consumer electronics show, Las Vegas, NV Jan. 10-13mobile world congress, Barcelona, Spain Feb. 20-23

24 October 3, 2011 | Signals Ahead, Vol. 7, Number 11–12 PREVIEW
please note disclaimer: The views expressed in this newsletter reflect those of Signals Research Group, LLC and are based on our understanding of past and current events shaping the wireless industry. This report is provided for informational purposes only and on the condition that it will not form a basis for any investment decision. The information has been obtained from sources believed to be reliable, but Signals Research Group, LLC makes no representation as to the accuracy or completeness of such information. Opinions, estimates, projections or forecasts in this report constitute the current judgment of the author(s) as of the date of this report. Signals Research Group, LLC has no obligation to update, modify or amend this report or to otherwise notify a reader thereof in the event that any matter stated herein, or any opinion, projection, forecast or estimate set forth herein, changes or subsequently becomes inaccurate. If you feel our opinions, analysis or interpretations of events are inaccurate, please fell free to contact Signals Research Group, LLC. We are always seeking a more accurate understanding of the topics that influence the wireless industry. Reference in the newsletter to a company that is publicly traded is not a recommendation to buy or sell the shares of such company. Signals Research Group, LLC and/or its affiliates/investors may hold securities positions in the companies discussed in this report and may frequently trade in such positions. Such investment activity may be inconsistent with the analysis provided in this report. Signals Research Group, LLC seeks to do business and may currently be doing business with companies discussed in this report. Readers should be aware that Signals Research Group, LLC might have a conflict of interest that could affect the objectivity of this report. Additional information and disclosures can be found at our website at www.signalsresearch.com. This report may not be reproduced, copied, distributed or published without the prior written authorization of Signals Research Group, LLC (copyright ©2011, all rights reserved by Signals Research Group, LLC).
Signals Ahead Subscription The Signals Ahead newsletter is available on a subscription basis. We offer four distinct packages that have been tai-lored to address the needs of our corporate users. The Group License includes up to five users from the same company. The Global License is the most attractive package for companies that have several readers since it is offered to an unlimited number of employees from the same organization. Finally, the Platinum package includes the Global License, plus up to five hours of analyst time. Other packages are available.
Corporate Rates (18 issues)❒➤Group License ($3,995) ❒➤Global License ($7,995) ❒➤Platinum ($9,495) Payment Terms❒➤American Express ❒➤Visa ❒➤MasterCard Credit Card # Exp Date / / ❒➤Check Check Number ❒➤Purchase Order PO Number Name: Title: Affiliation: Phone: ( ) Mailing Address:
Mailing AddressSignals Research Group, LLC – ATTN: Sales10 Ormindale CourtOakland, CA 94611
Our fax number is (510) 338-1284.
Alternatively, you may contact us at (510) 273-2439 or at [email protected] and we will contact you for your bill-ing information. We will not process your payment until after the trial subscription period is completed.
Terms and Conditions: Any copying, redistributing, or republishing of this material, including unauthorized sharing of user accounts, is strictly prohibited without the written consent of SRG.


