35
Silver Survey Update 2017 15 November 2017 Johann Wiebe, Lead Analyst, Precious Metals Demand

Silver Survey Update 2017 15 November 2017 Johann Wiebe, Lead Analyst, Precious Metals Demand

THE SILVER MARKET IN 2017
• SILVER PRICES
• DEMAND
• SUPPLY
• INVESTMENT
• PRICE OUTLOOK

SILVER PRICE IN DIFFERENT CURRENCIES IN 2017
Prices in different currencies on an intra year basis: Silver in…
• Lira: + 4%
• US$: + 1%
• GBP: - 5%
• EUR: - 7%
80
85
90
95
100
105
110
Jan Feb Mar Apr May Jun Jul Aug Sep Oct Nov
Silver Price in different currencies
$/oz €/kg £/g Yen/g Rmb/g Lira/g
Source: Thomson Reuters Eikon

SILVER PRICE RANGE, US$/OZ
Source: Thomson Reuters Eikon

LONG TERM GOLD/SILVER RATIO
(BASIS MONTHLY AVERAGE PRICES)
Source: Thomson Reuters Eikon

THE SILVER MARKET IN 2017
• PRICES
• DEMAND
• SUPPLY
• INVESTMENT
• OUTLOOK

WORLD SILVER SUPPLY AND DEMAND
Source: GFMS, Thomson Reuters
Moz 2013 2014 2015 2016 2017e
% ∆ - 2016
% ∆ - 2013
Mine Production 824 869 894
886 870 -1.8% 6%
Total Supply 988 1,051 1,043
1,007 1,008 0.1% 2%
Jewelry & Silverware 280 288 290
258 265 2.6% -5%
Coins & Bars 240 233 291
206 130 -37% -46%
Industrial Fabrication 605 596 570
562 581 3% -4%
Physical Demand 1,124 1,117 1,151
1,026 976 -5% -13% Physical
Surplus/Deficit -136 -66 -108 -19 32
Annual Average Silver Price $/oz 23.79 19.08 15.68 17.14 17.13 -0.1% -28%

WORLD PHYSICAL SILVER DEMAND ANNUAL CHANGES: 2015-2016 vs 2016-2017 (Moz)
-100
-80
-60
-40
-20
0
20
40
Jewellery Coins & Bars Silverware Industrial Fabrication
Mo
z
15-16 16-17

REGIONAL WORLD PHYSICAL SILVER DEMAND FORECAST ANNUAL CHANGES: 2016-2017 (Moz)
3 0.2
-47
-2 -4
-50
-40
-30
-20
-10
0
10
India China North America
Europe Other
Mo
z
Source: GFMS, Thomson Reuters

NORTH AMERICAN SILVER DEMAND FORECAST ANNUAL CHANGES: 2016-2017 (Moz)
-35
-16
-40
-35
-30
-25
-20
-15
-10
-5
0
5
Jewelry Coins Bars Silverware Electronics Brazing Photo Solar EO Other
Mo
z
Source: GFMS, Thomson Reuters

INDIAN SILVER IMPORTS
0
100
200
300
400
500
600
700
800
900
0
100
200
300
400
500
600
700
800
900
Jan-16 Mar Jun Sep Jan-17 Mar Jun Sep
$/K
G T
on
nes
Silver imports in tonnes
Fortnightly Tariff rates ($/kg) RHS
Source: GFMS, Thomson Reuters

INDUSTRIAL FABRICATION FORECAST ANNUAL CHANGES: 2015-2016 vs 2016-2017 (Moz)
-15
-10
-5
0
5
10
15
20
25
Electronics Brazing & Solders
Photo Solar EO Other Ind
Mo
z
15-16 16-17
Source: GFMS, Thomson Reuters

SOLAR DEMAND - SILVER POWDER PRODUCTION
39% 45% 45% 48% 45% 47%
60% 52% 43% 22%
40% 38%
1% 3%
12% 9%
15% 15%
0
10
20
30
40
50
60
70
80
90
2012 2013 2014 2015 2016 2017f
Sil
ver
Dem
an
d M
oz
Japan US China
Source: GFMS, Thomson Reuters

DEMAND SUMMARY
• Physical silver demand expected to decline 5% to below 1bn ounces for first time since 2012.
• Strong decline in physical bar and coin demand which has been particularly driven by very weak sentiment in North America.
• Jewelry fabrication switched marginally positive from the weak sentiment last year.
• Solar demand remained again a positive outlier this year driven in large by capacity expansions in China and a triple growth in installations.
• Thrifting continued to weigh on electronics demand countered by increased electrification in industries such as automotive.
THE SILVER MARKET IN 2017
• PRICES
• DEMAND
• SUPPLY
• INVESTMENT
• OUTLOOK

MINE PRODUCTION WINNERS AND LOSERS H1 2016 VERSUS H1 2017
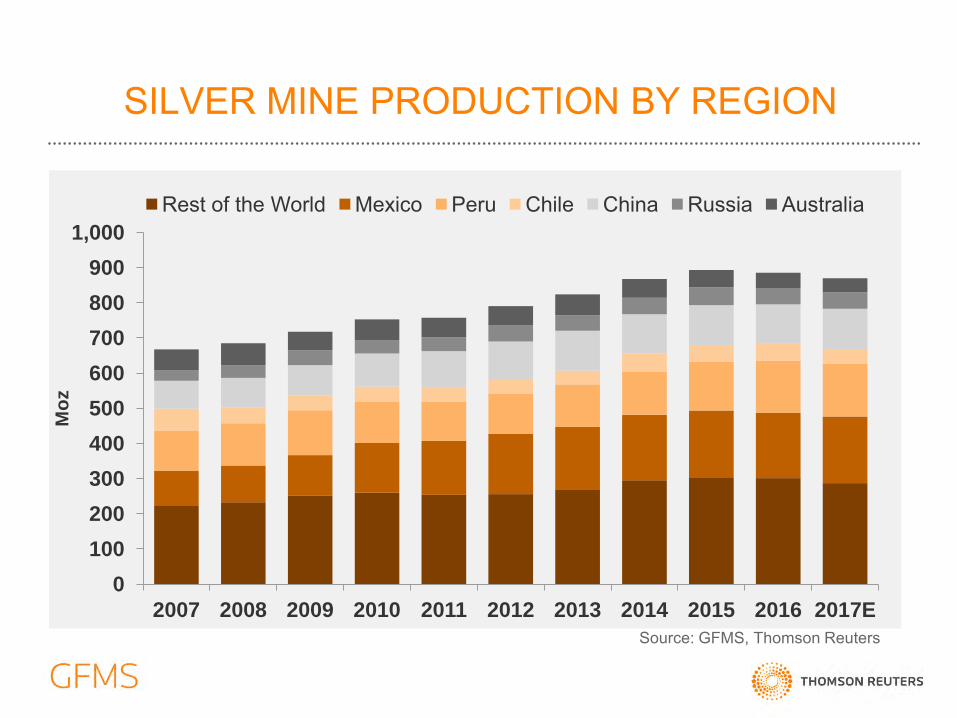
SILVER MINE PRODUCTION BY REGION
Source: GFMS, Thomson Reuters
0
100
200
300
400
500
600
700
800
900
1,000
2007 2008 2009 2010 2011 2012 2013 2014 2015 2016 2017E
Mo
z
Rest of the World Mexico Peru Chile China Russia Australia

TOP 20 SILVER PRODUCERS
Source: GFMS, Thomson Reuters

CAPITAL EXPENDITURE
10
15
20
25
30
35
300
400
500
600
700
800
900
1,000
1,100
Dec
-20
12
Ju
n-2
01
3
De
c-2
013
Ju
n-2
01
4
Dec
-20
14
Ju
n-2
01
5
Dec
-20
15
Ju
n-2
01
6
Dec
-20
16
Ju
n-2
01
7
Silv
er, U
S$/o
z
US
$ M
illi
on
s
Capital Expenditure
Silver Price
Source: GFMS, Thomson Reuters

FCF PROGRESSION
-800
-600
-400
-200
0
200
400
600
-1,500
-1,000
-500
0
500
1,000
1,500
2,000
De
c-2
01
2
Ju
n-2
01
3
De
c-2
01
3
Ju
n-2
01
4
De
c-2
01
4
Ju
n-2
01
5
De
c-2
01
5
Ju
n-2
01
6
De
c-2
01
6
Ju
n-2
01
7
Silv
er, U
S$/o
z
US
$ M
illio
ns
Cash from Operating Activities Capital Expenditure Net Income
Source: GFMS, Thomson Reuters

SILVER MINE PRODUCTION BY SOURCE METAL
Source: GFMS, Thomson Reuters
26%
13% 61%
Primary Silver
Primary Gold Mines
Primary Base Metals Mines
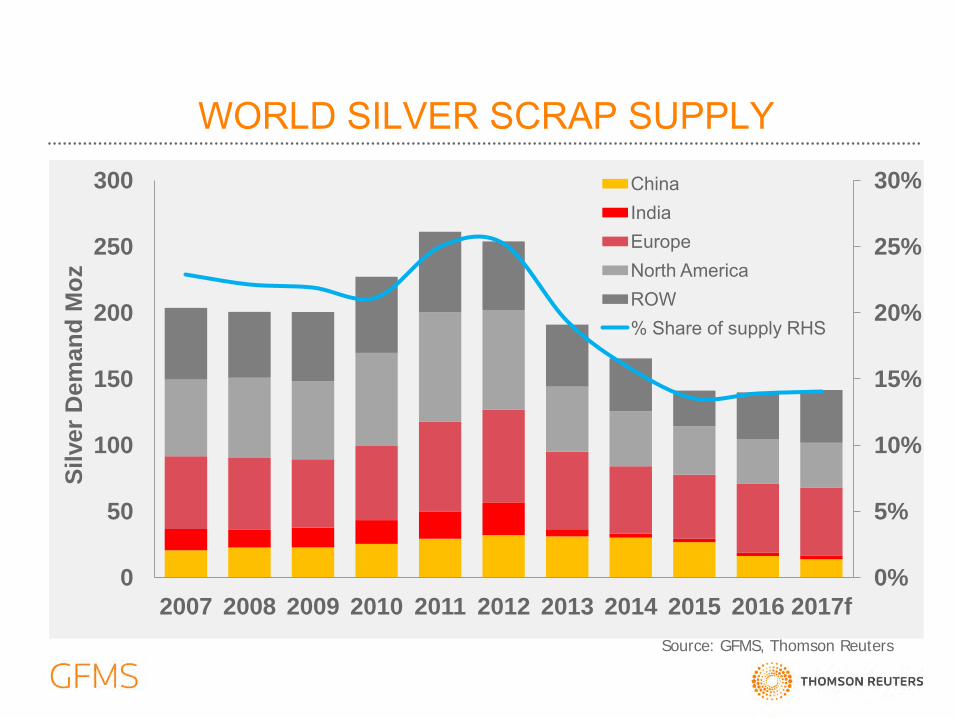
WORLD SILVER SCRAP SUPPLY
0%
5%
10%
15%
20%
25%
30%
0
50
100
150
200
250
300
2007 2008 2009 2010 2011 2012 2013 2014 2015 2016 2017f
Sil
ver
Dem
an
d M
oz
China India Europe North America ROW % Share of supply RHS
Source: GFMS, Thomson Reuters

OUTSTANDING DELTA ADJUSTED PRODUCERS HEDGE POSITION
Source: GFMS, Thomson Reuters
-60
-40
-20
-
20
40
60
2008 2009 2010 2011 2012 2013 2014 2015 2016 2017f
Moz
yea
r-on-
year
cha
nge
Net Hedging
Net De-hedging
SUPPLY SUMMARY
• Following a drop in mine production for the first time in 14 years, mine supply is set to fall another 2% this year.
• Supply from scrap marginally up this year mainly due to a rise in industrial generated waste.
• The hedge book is expected to contract by 3 Moz. Many players are at the side lines at current silver prices.
• Costs have risen slightly due to higher oil prices, production disruptions, lower grades and strong domestic currencies.
• Despite large fluctuations, primary silver miners are FCF positive indicating room for stronger capex further out.

THE SILVER MARKET IN 2017
• PRICES
• DEMAND
• SUPPLY
• INVESTMENT
• OUTLOOK

WORLD SILVER IDENTIFIABLE INVESTMENT VOLUME AND VALUE
Identifiable Investment is the sum of bars, coins and ETPs.
0
1
2
3
4
5
6
7
8
9
-50
0
50
100
150
200
250
300
350
2008 2009 2010 2011 2012 2013 2014 2015 2016 2017f
US
$ B
n
Mo
z
Coins & Bars ETP Inventory Build Total Identifiable Investment in US$ Bn (RHS)
Source: GFMS, Thomson Reuters

INVESTORS’ POSITIONS IN COMEX SILVER FUTURES & OPTIONS
As of 14th November

ABOVE GROUND STOCKS
*
Source: GFMS, Thomson Reuters As of end-Q3. Custodian vault figures exclude ETF holdings
0
500
1,000
1,500
2,000
2,500
3,000
2008 2009 2010 2011 2012 2013 2014 2015 2016 2017f
Government Custodian Vaults
ETFs Exchange
Industry
Mo
z
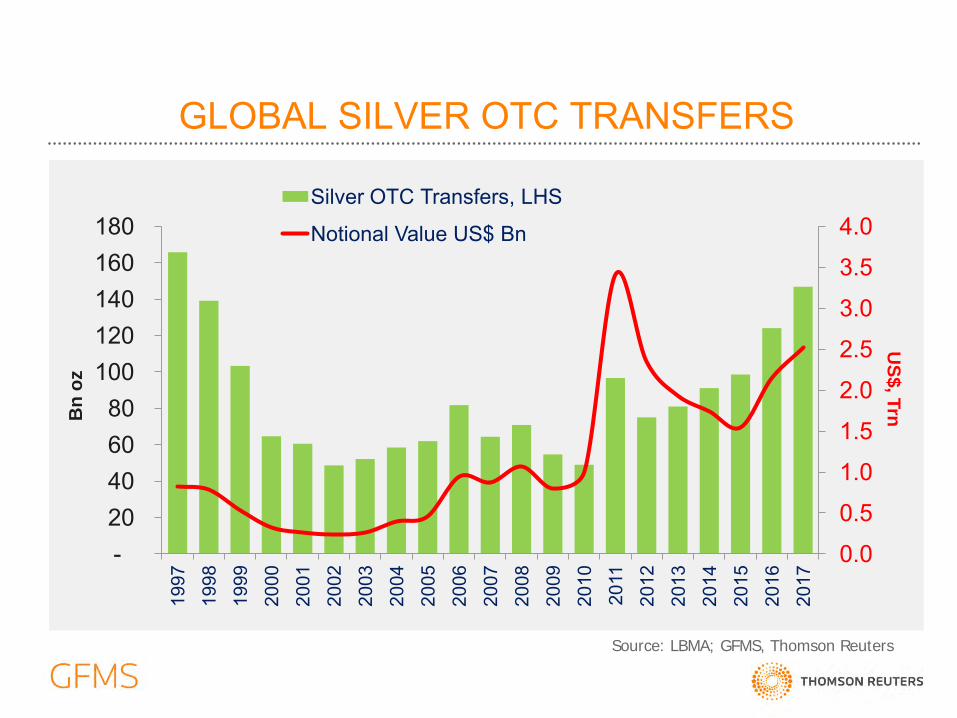
GLOBAL SILVER OTC TRANSFERS
0.0
0.5
1.0
1.5
2.0
2.5
3.0
3.5
4.0
- 20 40 60 80
100 120 140 160 180
1997
19
98
1999
20
00
2001
20
02
2003
20
04
2005
20
06
2007
20
08
2009
20
10
2011
20
12
2013
20
14
2015
20
16
2017
US
$, T
rn B
n o
z
Silver OTC Transfers, LHS
Notional Value US$ Bn
Source: LBMA; GFMS, Thomson Reuters

THE SILVER MARKET IN 2017
• PRICES
• DEMAND
• SUPPLY
• INVESTMENT
• OUTLOOK

EQUITIES BULL RUN
Source: Thomson Reuters Eikon
RHS: SP (yellow) LHS: FTSE (purple), DAX (blue)
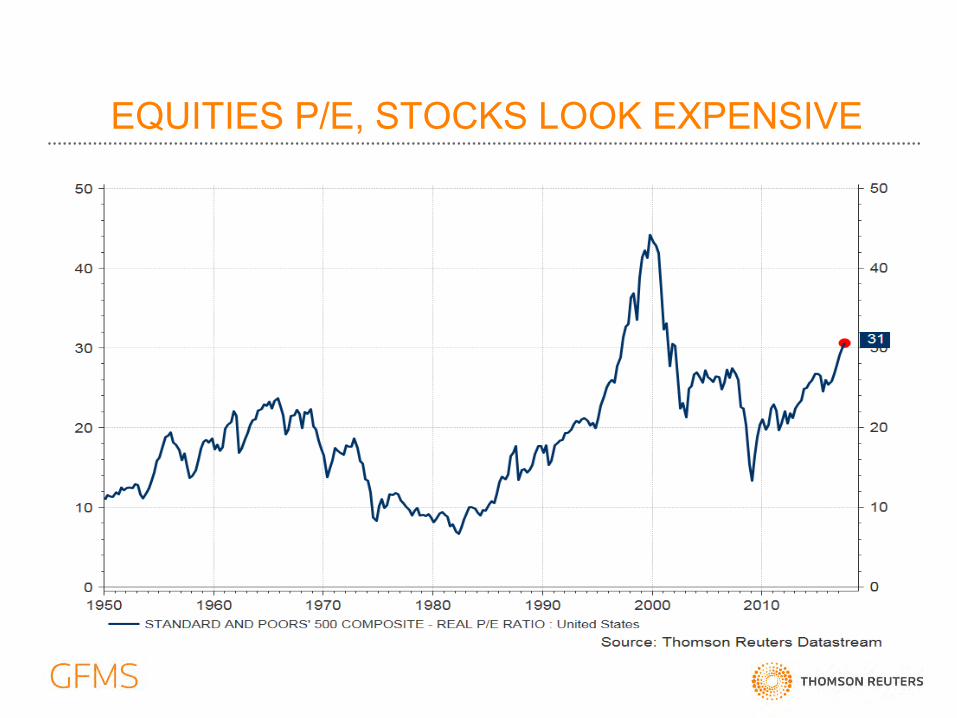
EQUITIES P/E, STOCKS LOOK EXPENSIVE

OUTLOOK
• In terms of prices we remain moderately optimistic and forecast average price $18.80/oz next year.
• Investment demand expected to show signs of recovery, although the next boom will be dependent on economic backdrop.
• PV demand in the solar sector is expected to continue to be the star performer of industrial offtake. Electronics will also be a positive driver.
• Mine supply is expected to decline in the long run and we believe that 2016 was the beginning of this protracted decline. Meanwhile, scrap will stabilise if not increase marginally on rising IP.
• Above ground stocks are likely to continue to grow particularly those held in custodian vaults. In the case of lack in significant demand increases, this could dampen sustainable price rises in the next years.

DISCLAIMER The information and opinions contained in this presentation have been obtained from sources believed to be reliable, but no representation, guarantee, condition or warranty, express or implied, is made that such information is accurate or complete and it should not be relied upon as such. Accordingly, Reuters Ltd accepts no liability whatsoever to the people or organizations attending this presentation, or to any third party, in connection with the information contained in, or any opinion set out or inferred or implied in, this presentation. This presentation does not purport to make any recommendation or provide investment advice to the effect that any gold related transaction is appropriate for all investment objectives, financial situations or particular needs. Prior to making any investment decisions investors should seek advice from their advisers on whether any part of this presentation is appropriate to their specific circumstances. This presentation is not, and should not be construed as, an offer or solicitation to buy or sell silver or any other metal. Expressions of opinion are those of Reuters Ltd only and are subject to change without notice.

Thank you for your attention! [email protected]


