and focusing only on common patterns can miss valuable complementary information. One recent machine-learning approach, iCluster7, uses a joint latent variable model for integrative clustering. Though powerful, iCluster and related machine-learning approaches4 do not scale to the full spectrum of available measurements, making the methods sensitive to the gene preselection step.
Our SNF approach is distinct in that it uses networks of sam-ples as a basis for integration. For example, when combining data from patient samples, SNF creates a patient network. Although networks of individuals have been extensively studied in other contexts, most notably in social science8 or in relation to disease9, to our knowledge patient-similarity networks have not been used specifically for integrating biological data. SNF consists of two main steps: construction of a sample-similarity network for each data type and integration of these networks into a single similarity network using a nonlinear combination method.
The fused network captures both shared and complementary information from different data sources (Supplementary Results and Supplementary Figs. 1–3), offering insight into how inform-ative each data type is to the observed similarity between samples. Because it is based on networks of samples, SNF can derive use-ful information even from a small number of samples, is robust to noise and data heterogeneity, and scales to a large number of genes. In addition to integrating data, our fused networks can effi-ciently identify subtypes among existing samples by clustering and predict labels for new samples based on the constructed network
Rapidly evolving technologies are making it progressively easier to collect multiple and diverse genome-scale data sets to address clinical and biological questions. For example, large-scale efforts by The Cancer Genome Atlas (TCGA) have already amassed genome, transcriptome and epigenome information for over 20 cancers from thousands of patients. The availability of such a wealth of data makes integrative methods essential for capturing the heterogeneity of biological processes and phenotypes, lead-ing to, for example, the identification of homogeneous subtypes in breast cancer. Data-integration methods need to overcome at least three computational challenges: (i) the small number of samples compared to the large number of measurements; (ii) the differences in scale, collection bias and noise in each data set, and (iii) the complementary nature of the information provided by different types of data. Current integration approaches have yet to address all of these challenges together1–4.
The simplest way to combine biological data is to concatenate normalized measurements from various biological domains, such as mRNA expression and DNA methylation, for each sam-ple. Unfortunately, concatenation further dilutes the already low signal-to-noise ratio in each data type. To avoid this, a common strategy is to analyze each data type independently2,3,5,6 before combining data. However, such independent analyses often lead to inconsistent conclusions that are hard to integrate. Another approach to increase signal is to preselect a set of important genes from each data source and use Consensus Clustering1 to combine the data3. However, preselecting genes leads to a biased analysis,
similarity network fusion for aggregating data types on a genomic scaleBo Wang1,5, Aziz M Mezlini1,2, Feyyaz Demir1,2, Marc Fiume2, Zhuowen Tu3, Michael Brudno1,2, Benjamin Haibe-Kains4,5 & Anna Goldenberg1,2
recent technologies have made it cost-effective to collect diverse types of genome-wide data. computational methods are needed to combine these data to create a comprehensive view of a given disease or a biological process. similarity network fusion (snF) solves this problem by constructing networks of samples (e.g., patients) for each available data type and then efficiently fusing these into one network that represents the full spectrum of underlying data. For example, to create a comprehensive view of a disease given a cohort of patients, snF computes and fuses patient similarity networks obtained from each of their data types separately, taking advantage of the complementarity in the data. We used snF to combine mrnA expression, dnA methylation and micrornA (mirnA) expression data for five cancer data sets. snF substantially outperforms single data type analysis and established integrative approaches when identifying cancer subtypes and is effective for predicting survival.
1Genetics and Genome Biology, SickKids Research Institute, Toronto, Ontario, Canada. 2Department of Computer Science, University of Toronto, Toronto, Ontario, Canada. 3Department of Cognitive Science, University of California San Diego, San Diego, California, USA. 4Institut de Recherches Cliniques de Montréal, Université de Montréal, Montréal, Quebec, Canada. 5Present addresses: Department of Computer Science, Stanford University, Stanford, California, USA (B.W.). and Ontario Cancer Institute, Princess Margaret Cancer Centre—University Health Network, Toronto, Ontario, Canada (B.H.-K.). Correspondence should be directed to A.G. ([email protected]).Received 8 May 2013; accepted 17 deceMbeR 2013; published online 26 januaRy 2014; doi:10.1038/nMeth.2810
(Online Methods, Supplementary Note 1 and Supplementary Fig. 4). Combining diverse data types from five different human cancers, we demonstrated that SNF yields coherent, clinically relevant patient subtypes and improves on the performance of popular integrative approaches and a network-based approach that uses individual data types. The SNF software easily scales to multiple genome-wide data types with tens of thousands of measurements and is freely available as Supplementary Software and at http://compbio.cs.toronto.edu/SNF/.
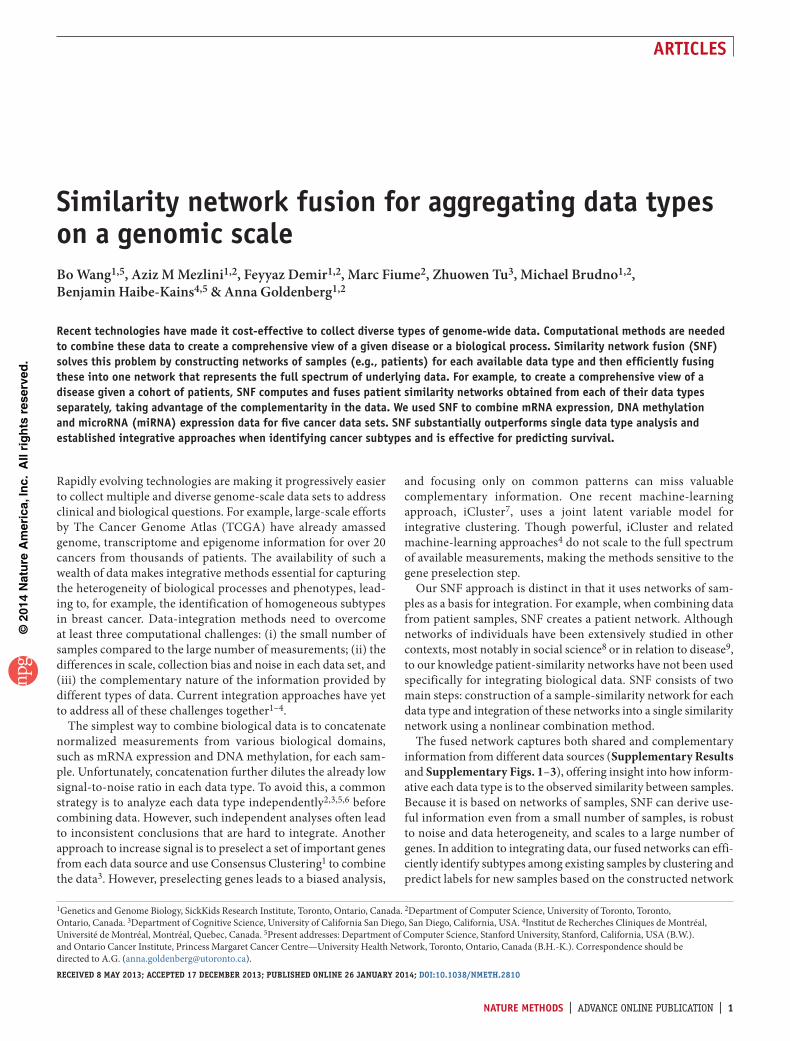
resultsmethod overviewGiven two or more types of data for the same set of samples (e.g., patients), SNF first creates a network for each data type and then fuses these into one similarity network. The initial step is to use a similarity measure for each pair of samples to construct a sample-by-sample similarity matrix for each available data type (Fig. 1a,b). The matrix is equivalent to a similarity network where nodes are samples (e.g., patients) and the weighted edges represent pairwise sample similarities (Fig. 1c). Both matrices and networks are effec-tive visual representations: similarity matrices help identify global patterns (clusters), whereas networks emphasize the detailed similarity patterns and the types of data that support each edge.
The network-fusion step (Fig. 1d) uses a nonlinear method based on message-passing theory10 that iteratively updates every network, making it more similar to the others with every itera-tion. After a few iterations, SNF converges to a single network (Fig. 1e). The empirical convergence for a variety of data sets is shown on Supplementary Figures 5–7. The method is robust to a variety of the hyperparameter settings (Online Methods and Supplementary Figs. 8–10). The advantage of our integrative procedure is that weak similarities (low-weight edges) disappear, helping to reduce the noise (Fig. 2 and Supplementary Fig. 2), and strong similarities (high-weight edges) present in one or more networks are added to the others. Additionally, low-weight edges supported by all networks are retained depending on how tightly connected their neighborhoods are across networks. Such nonlinearity allows SNF to make full use of a network’s
local structure, integrating common as well as complementary information across networks.
A case study: glioblastoma multiformeMultiple integrative approaches have been applied to understand the heterogeneity and identify the subtypes of glioblastoma multi-forme (GBM), an aggressive adult brain tumor. Depending on the type of data used, these integrative analyses often lead to different conclusions. For example, one analysis that had combined expres-sion and copy-number-variant data had identified two subtypes11, but a later analysis2, driven primarily by expression data, had identified four subtypes, which does not agree with the previous findings. A recent DNA methylation–based approach had identi-fied three subtypes: one characterized by a somatic mutation in IDH1 (ref. 12) and two others roughly corresponding to the sub-types identified in ref. 2. Though methylation data had been used for the analysis in ref. 2, the IDH subtype had not been identified because of the expression data–driven subtyping analysis.
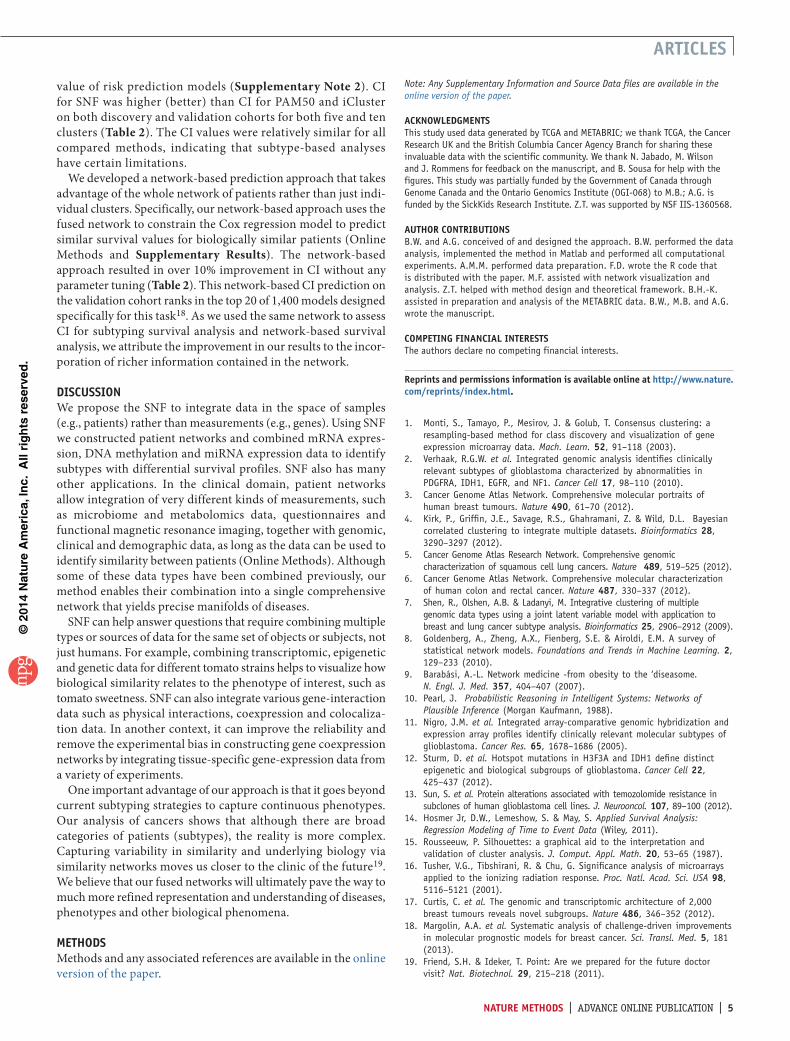
We used SNF to fuse three data types for 215 patients with GBM: DNA methylation (1,491 genes), mRNA expression (12,042 genes) and miRNA expression (534 miRNAs). As expected, networks built using a single data type yielded very different patterns sup-ports of patient similarity. For example, DNA methylation strongly supports connectivity in the smallest patient cluster (Fig. 2a), whereas mRNA expression supports similarity in the medium-sized cluster (Fig. 2b). DNA methylation and mRNA expression suggest relatively strong intercluster similarity (Fig. 2a,b), though the exact patterns are different between those data types. It is difficult to discern patterns in the patient-similarity network based on miRNA data alone (Fig. 2c). The fused network gives a much clearer picture of clustering in our set of patients with GBM, illustrated by the tightness of connectivity within clusters and relatively few edges between clusters (Fig. 2d).
We unified the results of several previous GBM analyses as well as identified new and potentially interesting associations. For example, our smallest cluster (subtype 3) corresponds to the previously identified IDH subtype12 consisting of younger patients with a substantially more favorable prognosis. All patients with
Patient similarity:Patients mRNA-based DNA methylation–based Supported by all data
Figure � | Illustrative example of SNF steps. (a) Example representation of mRNA expression and DNA methylation data sets for the same cohort of patients. (b) Patient-by-patient similarity matrices for each data type. (c) Patient-by-patient similarity networks, equivalent to the patient-by-patient data. Patients are represented by nodes and patients’ pairwise similarities are represented by edges. (d) Network fusion by SNF iteratively updates each of the networks with information from the other networks, making them more similar with each step. (e) The iterative network fusion results in convergence to the final fused network. Edge color indicates which data type has contributed to the given similarity.
an IDH1 mutation for whom the informa-tion was available (n = 14 patients, Fisher exact test P = 4.87 × 10⁻¹¹) belong to this cluster. Subtype 1 patients (hazards ratio (HR) = 0.278, Cox log-rank test P = 0.001; Supplementary Fig. 11c) had a favorable response to temozolomide (TMZ), a drug commonly used to treat GBM (Supplementary Figs. 11 and 12). One of the reasons for the lack of such an effect in subtype 2 could be its significant association with CTSD overexpression (P < 0.001, Bonferroni-corrected), which has been found to pre-vent the effect of TMZ in vitro13 (Supplementary Results).
Our network analysis goes beyond subtyping. Each edge in the fused network is colored by the data type(s) that contributed to the given similarity. A multicolor cluster means that no single data type or combination support patient similarity across GBM. We found that most edges were supported by at least two data types: 49.5% of all patient similarities (edges) were due to two data types, 17.2% were supported by all three data types and the remaining 33.3% of the edges were supported by only one data type, with strong enough similarity that those edges remained prominent in the fused network (Supplementary Fig. 13). The GBM analysis highlights three important features of our network-based integrative approach: (i) the ability to detect common as well as complementary signals (Fig. 2d and Supplementary Fig. 1); (ii) the ability to reduce noise by aggregating across multiple types of data (Fig. 2d, and Supplementary Figs. 2 and 3); and (iii) insight into the relative importance of each data source for determining patient similarity, thus refining our understanding of the heteroge-neity within each subtype (Fig. 2d and Supplementary Fig. 14).
evaluating snF across a wide spectrum of cancersIn addition to the GBM analysis, we applied SNF to four other cancer profiles by TCGA: breast invasive carcinoma (BIC), kidney renal clear cell carcinoma (KRCCC), lung squamous cell carci-noma (LSCC) and colon adenocarcinoma (COAD). The DNA methylation, mRNA and miRNA expression data for these cancers vary in sample size (from 92 for COAD to 215 for GBM) and number of measurements (from 534 miRNAs in GBM to 27,578 methylated genes in LSCC and COAD) as well as heterogeneity3,5,6 (Supplementary Data and Supplementary Table 1).
We evaluated SNF performance by identifying subtypes in each of these cancers. We report three commonly used measures: (i) P value in Cox log-rank test to evaluate the significance of the difference in survival profiles between subtypes14; (ii) silhouette score15, a measure of cluster coherence, to evaluate whether patients are more similar within or across subtypes; and (iii) algorithm running time to evaluate scalability (Supplementary Note 2). We used spectral clustering (Online Methods) on the patient network to identify homogeneous cancer subtypes. We compared SNF to iCluster7 and the concatenation of the three types of data (Supplementary Note 3).
We first compared data integration to the use of individual data types separately across the five cancers. We obtained patient clus-ters for individual data types by building a patient-similarity net-work and clustering it using spectral clustering (same as for SNF). Except for a few cases, single data type analysis did not lead to significantly different survival profiles, but networks fused by SNF had significant differences in survival among subtypes in all five cancers (Table 1). Note that the added fusion step is the only dif-ference between the single and fused analyses. Spatial embedding of the subtypes from the fused network for each cancer showed very clear separation between clusters (Supplementary Fig. 15).
One major limitation of current integrative methods such as iCluster is the need for a priori gene selection. Although SNF
a
b
c
d50
100
150
20050 100 150 200
Patients
Pat
ient
s
50
100
150
20050 100 150 200
PatientsP
atie
nts
50
100
150
20050 100 150 200
Patients
Pat
ient
s
50
100
150
20050 100 150 200
Patients
DNAmethylation
Patient subtype Similarly type
1
Pat
ient
s
2 3
Survival (months)
1 48 115
miRNA
mRNA
Figure � | Patient similarities for each of the data types independently compared to SNF fused similarity. (a–d) Patient-to-patient similarities for 215 patients with GBM represented by similarity matrices and patient networks, where nodes represent patients, edge thickness reflects the strength of the similarity, and node size represents survival. Clusters are coded in grayscale (subtypes 1–3) and arranged according to the subtypes revealed through spectral clustering of the combined patient network. The clustering representation is preserved for all four networks to facilitate visual comparison. DNA methylation (a), mRNA expression (b), miRNA expression (c) and SNF-combined similarity matrix and network (d; see supplementary Fig. �� for more information about network edges).
table 1 | SNF-based analysis versus individual data types
does not require preselection, for comparison we report the performance of all three methods as a function of the number of preselected genes, ordering genes by significance for differen-tial expression between tumor and healthy tissue using the sig-nificance analysis of microarrays (SAM) test16 (Supplementary Note 2). SNF achieved significance in survival analysis across the spectrum of preselected genes (Fig. 3a) and resulted in substan-tially more coherent clusters according to the silhouette score (Fig. 3b). Comparative performance across cancers showed that in GBM and BIC, Cox survival P values were very stable with respect to the number of preselected genes. There is more fluctua-tion in survival P values for KRCCC and LSCC. This is explained by the fact that both KRCCC and LSCC have at least one subtype with very few patients (Supplementary Fig. 15), making the P values very sensitive to any change in clustering. This is a com-mon problem of rare disease subtypes; the silhouette score in this case is a better indicator of clustering stability.
iCluster achieved significance for a small number of genes but was very sensitive to gene preselection. The performance of concatenation was even less predictable, though it was substantially faster, as illustrated by the running-time analysis (Fig. 3c). The computational complexity of the concatenation approach was equivalent to the time needed to run hierarchical clustering. Running time for SNF was only marginally higher than for concatenation. iCluster performance scaled exponentially in the number of genes, which explained the necessity for gene preselection.
From subtype-based to network-based outcome predictionWe showed that clustering patient networks derived from multiple data types using SNF performs as well or better than the state-of-the-art subtyping methods applied to survival analysis (Supplementary Figs. 16–19). On the harder task of survival risk prediction, we also found that subtyping was inferior to a true network-based approach (Supplementary Fig. 20).
We used the Molecular Taxonomy of Breast Cancer International Consortium (METABRIC) breast cancer data set17 to validate our network-based prediction. The METABRIC data set consists of a discovery cohort (997 patients) and vali-dation cohort (995 patients). We performed a PAM50 analysis (a standard breast cancer signature), iCluster analysis (InterClust17) and SNF analysis with five clusters (chosen by our model selection criterion) and ten clusters (for comparative purposes) (Table 2). The published17 significance value obtained using iCluster on the validation set is lower than both the iCluster-based discovery cohort P value and the validation P value obtained using SNF, suggesting the potential for overfitting by iCluster. The concordance index (CI) is a con-tinuous and robust accuracy measure to assess the prognostic
0 0.5 1.0 1.5
60
40
20
0
a GBM4
–log
10(P
val
ue)
3
2
1
00
0.4
Number of genes ×1040.8 1.2
BIC4
3
2
1
00 0.5 1.0 1.5 2.0
KRCCC4.5
3.5
2.5
1.5
0.5
0 0.5 1.0 1.5 2.0
LSCC2.5
1.5
0.5
0 0.5 1.0 1.5
COAD3.5
2.5
1.5
0.5
0 0.5 1.0 1.5 2.0
Silh
ouet
te
b0.3
Number of genes ×1040 0.4 0.8 1.2
0.2
0.1
0
–0.050 0.5 1.0 1.5 2.0
0.3
0.2
0.1
0
–0.050 0.5 1.0 1.5 2.0
0.7
0.5
0.3
0.1
–0.10 0.5 1.0 1.5
0.35
0.25
0.15
0.05
0 0.5 1.0 1.5 2.0
0.7
0.6
0.5
0.4
0.3
Run
ning
tim
e (m
in)
c
Number of genes ×1040 0.4 0.8 1.2
50
40
30
20
10
00 0.5 1.0 1.5 2.0
80
60
40
20
00 0.5 1.0 1.5 2.0
45
35
25
15
5
0 0.5 1.0 1.5 2.0
40
30
20
10
0
PNF P = 0.05iClusterConcatenation
Figure � | Comparison of the SNF approach to iCluster and concatenation. (a–c) Cox log-rank test P value for survival analysis (a), silhouette score representing the coherence of clusters (b) and running time (c) for each of the indicated cancers. Number of preselected genes is shown on x axes.
table 2 | METABRIC survival analysis and predictionPAm50
(5 clusters)icluster
(�0 clusters)snF
(5 clusters)snF
(�0 clusters) network
P value discovery cohort 3.0 × 10⁻⁹ 1.2 × 10⁻¹⁴ 6.10 × 10⁻¹¹ 3.31 × 10⁻¹² –P value validation cohort 1.7 × 10⁻⁹ 2.9 × 10⁻¹¹ 5.12 × 10⁻¹³ 7.86 × 10⁻¹² –CI discovery cohort 0.560 0.621 0.638 0.638 0.720CI validation cohort 0.551 0.605 0.633 0.633 0.706Comparison of SNF and alternative methods on survival analysis (Cox log-rank test P value) and risk of death prediction in the METABRIC data (CI, concordance index).
value of risk prediction models (Supplementary Note 2). CI for SNF was higher (better) than CI for PAM50 and iCluster on both discovery and validation cohorts for both five and ten clusters (Table 2). The CI values were relatively similar for all compared methods, indicating that subtype-based analyses have certain limitations.
We developed a network-based prediction approach that takes advantage of the whole network of patients rather than just indi-vidual clusters. Specifically, our network-based approach uses the fused network to constrain the Cox regression model to predict similar survival values for biologically similar patients (Online Methods and Supplementary Results). The network-based approach resulted in over 10% improvement in CI without any parameter tuning (Table 2). This network-based CI prediction on the validation cohort ranks in the top 20 of 1,400 models designed specifically for this task18. As we used the same network to assess CI for subtyping survival analysis and network-based survival analysis, we attribute the improvement in our results to the incor-poration of richer information contained in the network.
discussionWe propose the SNF to integrate data in the space of samples (e.g., patients) rather than measurements (e.g., genes). Using SNF we constructed patient networks and combined mRNA expres-sion, DNA methylation and miRNA expression data to identify subtypes with differential survival profiles. SNF also has many other applications. In the clinical domain, patient networks allow integration of very different kinds of measurements, such as microbiome and metabolomics data, questionnaires and functional magnetic resonance imaging, together with genomic, clinical and demographic data, as long as the data can be used to identify similarity between patients (Online Methods). Although some of these data types have been combined previously, our method enables their combination into a single comprehensive network that yields precise manifolds of diseases.
SNF can help answer questions that require combining multiple types or sources of data for the same set of objects or subjects, not just humans. For example, combining transcriptomic, epigenetic and genetic data for different tomato strains helps to visualize how biological similarity relates to the phenotype of interest, such as tomato sweetness. SNF can also integrate various gene-interaction data such as physical interactions, coexpression and colocaliza-tion data. In another context, it can improve the reliability and remove the experimental bias in constructing gene coexpression networks by integrating tissue-specific gene-expression data from a variety of experiments.
One important advantage of our approach is that it goes beyond current subtyping strategies to capture continuous phenotypes. Our analysis of cancers shows that although there are broad categories of patients (subtypes), the reality is more complex. Capturing variability in similarity and underlying biology via similarity networks moves us closer to the clinic of the future19. We believe that our fused networks will ultimately pave the way to much more refined representation and understanding of diseases, phenotypes and other biological phenomena.
methodsMethods and any associated references are available in the online version of the paper.
Note: Any Supplementary Information and Source Data files are available in the online version of the paper.
AcknoWledgmentsThis study used data generated by TCGA and METABRIC; we thank TCGA, the Cancer Research UK and the British Columbia Cancer Agency Branch for sharing these invaluable data with the scientific community. We thank N. Jabado, M. Wilson and J. Rommens for feedback on the manuscript, and B. Sousa for help with the figures. This study was partially funded by the Government of Canada through Genome Canada and the Ontario Genomics Institute (OGI-068) to M.B.; A.G. is funded by the SickKids Research Institute. Z.T. was supported by NSF IIS-1360568.
Author contriButionsB.W. and A.G. conceived of and designed the approach. B.W. performed the data analysis, implemented the method in Matlab and performed all computational experiments. A.M.M. performed data preparation. F.D. wrote the R code that is distributed with the paper. M.F. assisted with network visualization and analysis. Z.T. helped with method design and theoretical framework. B.H.-K. assisted in preparation and analysis of the METABRIC data. B.W., M.B. and A.G. wrote the manuscript.
comPeting FinAnciAl interestsThe authors declare no competing financial interests.
reprints and permissions information is available online at http://www.nature.com/reprints/index.html.
1. Monti, S., Tamayo, P., Mesirov, J. & Golub, T. Consensus clustering: a resampling-based method for class discovery and visualization of gene expression microarray data. Mach. Learn. 5�, 91–118 (2003).
2. Verhaak, R.G.W. et al. Integrated genomic analysis identifies clinically relevant subtypes of glioblastoma characterized by abnormalities in PDGFRA, IDH1, EGFR, and NF1. Cancer Cell �7, 98–110 (2010).
3. Cancer Genome Atlas Network. Comprehensive molecular portraits of human breast tumours. Nature �90, 61–70 (2012).
5. Cancer Genome Atlas Research Network. Comprehensive genomic characterization of squamous cell lung cancers. Nature �89, 519–525 (2012).
6. Cancer Genome Atlas Network. Comprehensive molecular characterization of human colon and rectal cancer. Nature �87, 330–337 (2012).
7. Shen, R., Olshen, A.B. & Ladanyi, M. Integrative clustering of multiple genomic data types using a joint latent variable model with application to breast and lung cancer subtype analysis. Bioinformatics �5, 2906–2912 (2009).
8. Goldenberg, A., Zheng, A.X., Fienberg, S.E. & Airoldi, E.M. A survey of statistical network models. Foundations and Trends in Machine Learning. �, 129–233 (2010).
9. Barabási, A.-L. Network medicine -from obesity to the ‘diseasome. N. Engl. J. Med. �57, 404–407 (2007).
10. Pearl, J. Probabilistic Reasoning in Intelligent Systems: Networks of Plausible Inference (Morgan Kaufmann, 1988).
11. Nigro, J.M. et al. Integrated array-comparative genomic hybridization and expression array profiles identify clinically relevant molecular subtypes of glioblastoma. Cancer Res. 65, 1678–1686 (2005).
12. Sturm, D. et al. Hotspot mutations in H3F3A and IDH1 define distinct epigenetic and biological subgroups of glioblastoma. Cancer Cell ��, 425–437 (2012).
13. Sun, S. et al. Protein alterations associated with temozolomide resistance in subclones of human glioblastoma cell lines. J. Neurooncol. �07, 89–100 (2012).
14. Hosmer Jr, D.W., Lemeshow, S. & May, S. Applied Survival Analysis: Regression Modeling of Time to Event Data (Wiley, 2011).
15. Rousseeuw, P. Silhouettes: a graphical aid to the interpretation and validation of cluster analysis. J. Comput. Appl. Math. �0, 53–65 (1987).
16. Tusher, V.G., Tibshirani, R. & Chu, G. Significance analysis of microarrays applied to the ionizing radiation response. Proc. Natl. Acad. Sci. USA 98, 5116–5121 (2001).
17. Curtis, C. et al. The genomic and transcriptomic architecture of 2,000 breast tumours reveals novel subgroups. Nature �86, 346–352 (2012).
18. Margolin, A.A. et al. Systematic analysis of challenge-driven improvements in molecular prognostic models for breast cancer. Sci. Transl. Med. 5, 181 (2013).
19. Friend, S.H. & Ideker, T. Point: Are we prepared for the future doctor visit? Nat. Biotechnol. �9, 215–218 (2011).
online methodsExperimental details. We used data from five different cancer types available from the TCGA website: GBM, BIC, LSCC, KRCCC and COAD. For each of these tumor types, we downloaded TCGA-curated level 3 data sets containing gene expression, miRNA expression and DNA methylation informa-tion. TCGA repository contains multiple platforms for each data type. We always chose the platform corresponding to the largest number of available individuals and describing both tumor sam-ples and controls whenever possible. For expression data, we used the Broad Institute HT-HG-U133A platform in GBM and LSCC, the UNC-Agilent-G4502A-07 platform in BIC and COAD and the UNC-Illumina-Hiseq-RNASeq platform in KRCCC. For miRNA expression data, we used the BCGSC-Illumina-Hiseq-miRNAseq platform in BIC, the UNC-miRNA-8X15K platform in GBM and the BCGSC-Illumina-GA-miRNAseq in LSCC, KRCCC and COAD. Finally, for the methylation data we used the JHU-USC-Illumina-DNA-Methylation platform in GBM, the JHU-USC-Human-Methylation-27 platform for BIC, LSCC, KRCCC and COAD. For all these tumor types, we also downloaded patients’ clinical information including the overall survival data.
We also used METABRIC data set to evaluate the effectiveness of survival prediction with network regularization. METABRIC data set consists of two cohorts: discovery (997 patients) and validation (995 patients). For each of these patients, matched DNA and RNA were extracted from each primary tumor speci-men and subjected to copy-number and genotype analysis on the Affymetrix SNP 6.0 platform and transcriptional profiling on the Illumina HT-12 v3 platform (Illumina-Human-WG-v3). We used the normalized data available from the European Genome-Phenome Archive (EGA, http://www.ebi.ac.uk/ega/). High-quality follow up clinical data including information on disease-free survival were also available for both cohorts. As a preprocessing step, we mapped copy-number variations to genes using the PennCNV package20.
Before applying our SNF, we performed three steps of prepro-cessing: outlier removal, missing-data imputation and normali-zation. If a patient had more than 20% missing data in a certain data type, we did not consider this patient. Similarly, if a certain biological feature (for example, mRNA expression) had more than 20% of missing values across patients, we filtered out this feature. Also, for missing data, we used K nearest neighbor (KNN) impu-tation21, where the number of neighbors is the same with K value used in our method (see below); therefore we do not have any free parameters. Last, before constructing the patient network, we performed the following normalization: f
f E ff
=− ( )
( )Var,
where f is any biological feature, f is the corresponding feature after normalization, E(f) and Var(f) represent the empirical mean and variance of f, respectively.
Evaluation metrics. We used several metrics for evaluation and comparison of our method to existing approaches. In the real-cancer data, we use three metrics, as ground truth was not known. First, we use silhouette15 to measure the homogeneity of the subtypes. For each patient i, let a(i) denote the average dis-similarity to all other patients within the same subtype and b(i)
denote the lowest average dissimilarity to all other patients in dif-ferent subtypes. The value of silhouette for patient i was defined as s(i) = (b(i) – a(i))/(max a(i), b(i)). The mean value of silhouette for all the patients was then used as a measure of how tightly grouped all the data in the cluster are. If silhouette value was close to 1, then it means the data were appropriately clustered.
We also used P value for log-rank test of survival separation in Cox regression model14. P value measures the significance in the difference of survival profiles between subtypes. In our test, we set 0.05 to be the threshold of the significance. The lower the P value was, the less likely it was that such differential survival was observed by chance, i.e., the more significantly different the survival profiles was between subtypes. For most cancers, we used days to the last follow-up and the vital status to perform the log-rank test for survival analysis. However, for COAD, we used the consensus of the days to last known alive together with the last follow-up as a proxy because there were a lot of missing values in the data for days to last follow up. We used running time (in minutes) to compare the scalability of each method.
Similarity network fusion. Suppose we have n samples (for example, patients) and m measurements (for example, mRNA gene expression). We will use the patient network example throughout this section for clarity though the method has broad applicability as discussed above. A patient similarity network is represented as a graph G = (V, E). The vertices V correspond to the patients {x1, x2, , xn} and the edges E are weighted by how similar the patients are. Edge weights are represented by an n × n similarity matrix W with W(i, j) indicating the similarity between patients xi and xj and are computed as follows. We denote ρ(xi, xj) as the Euclidean distance between patients xi and xj. We then use a scaled exponential similarity kernel to determine the weight of the edge:
W( , ) exp( , )
,i j
x xi j
i j= −
rme
2
(1)
where µ is a hyperparameter that can be empirically set and ε i,j is used to eliminate the scaling problem. Here we define
er r r
i ji i j j i jx N x N x x
,( ( , )) ( ( , )) ( , )
=+ +mean mean
3
where mean (ρ(xi Ni)) is the average value of the distances between xi and each of its neighbors. We recommend setting µ in the range of [0.3, 0.8]. Note that while this distance measure is suitable for continuous variables, we propose to use chi-squared distance for discrete variables and agreement-based measure for binary variables.
To compute the fused matrix from multiple types of measure-ments, we define a full and sparse kernel on the vertex set V. The full kernel is a normalized weight matrix P = D−1W, where D is the diagonal matrix whose entries D(i, i) = ΣjW(i, j), so that ΣjP(i, j) = 1. However, this normalization may suffer from numer-ical instability since it involves self-similarities on the diagonal entries of W. One way to perform a better normalization is as follows:
This normalization will be free of the scale of self-similarity in the diagonal entries and ΣjP(i, j) = 1 still holds.
Let Ni represent a set of xi’s neighbors including xi in G. Given a graph, G, we use K nearest neighbors (KNN) to measure local affinity as:
S
WW( , )
( , )( , )
,i j
i ji k
j Nk N
ii=
∈
∈Σ
0 otherwise
(3)
This operation sets the similarities between non-neighboring points (in terms of the pairwise similarity values) to zero. Essentially we make the assumption that local similarities (high values) are more reliable than remote ones; and we thus assign similarities to non-neighbors through graph diffusion on the network. This is a mild assumption widely adopted by other manifold learning algorithms. Note that P carries the full information about the similarity of each patient to all others whereas S only encodes the similarity to the K most similar patients for each patient. Our algorithm always starts from P as the initial state using S as the kernel matrix in the fusion process for both capacity of capturing local structure of graphs and computational efficiency.
Given m different data types, we can construct similarity matrices W(ν) using equation (1) for the νth view, ν = 1,2,
,
m. P(ν) and S(ν) are obtained from equations (2) and (3), respectively. Below we introduce our network fusion process given a set of networks.
Let us first consider the case when we have two data types, i.e., m = 2. We calculate the status matrices P(1) and P(2) as in equation (2) from two input similarity matrices; then the kernel matrices S(1) and S(2) are obtained as in equation (3).
Let P Pt = =01 1( ) ( ) and P Pt = =0
2 2( ) ( ) represent the initial two status matrices at t = 0. The key step of SNF is to iteratively update simi-larity matrix corresponding to each of the data types as follows:
P S P St tT
+ = × ×11 1 2 1( ) ( ) ( ) ( )( ) (4)
P S P St tT
+ = × ×12 2 1 2( ) ( ) ( ) ( )( ) (5)
where Pt + 1
1( ) is the status matrix of the first data type after t iterations. Pt + 1
2( ) is the similarity matrix for the second data type. This procedure updates the status matrices each time generating two parallel interchanging diffusion processes. After t steps, the overall status matrix is computed as
PP P( )( ) ( )
c t t=+1 2
2.
Since S is a KNN graph of P, which can reduce some noise between instances, our SNF is robust to the noise in similarity measures.
Another way to think of the updating rule (4) is
P S S Pt ti j i k j l k lk Ni l N j
+ = × ×∈ ∈∑ ∑1
1 1 1 2( ) ( ) ( ) ( )( , ) ( , ) ( , ) ( , ) (6)
(the same for Pt + 12( ) ). Note Ni represents the neighborhood
of xi. We can see that similarity information is only propagated through the common neighborhood. This renders SNF robust to noise. An important observation is that if xi and xj have com-mon neighbors in both similarity matrices, it is highly possible that they belong to the same cluster. Another essential fact our method benefits from is that even if xi and xj are not very similar
in one data type, their similarity can be expressed in another data type and this similarity information can be propagated through the fusion process.
After each iteration, we performed normalization on Pt + 11( )
and Pt + 12( ) as in equation (2). By performing the normalization,
we (i) ensure that throughout SNF iterations a patient is always most similar to himself than to other patients; (ii) ensure that our final network is full rank, important for the classification and clustering applications of the final network. Finally, we have found that the use of such normalization leads to quicker convergence of SNF.
Finally, an extension to the case m > 2 follows equations (4) and (5): P S P S( ) ( )
( )( )( ) , , , ,v v k v
kv T
mv m= ×
−
× =≠Σ
11 2 (7)
The input to our algorithm can be feature vectors, pairwise distances, or pairwise similarities. The learned status matrix P(c) can then be used for retrieval, clustering and classification; in this work, we focus mostly on clustering and prediction.
SNF is inspired by the theoretical multiview learning framework developed for the computer vision and image processing applications22 that is not directly applicable to biological data. SNF constructs networks of samples (for example, patients) by comparing samples’ molecular (or phe-notypic) profiles; fused networks are used for subtyping and label prediction distinguishing SNF from all the previously published research.
Network clustering (for example, for disease subtyping). Given n samples and m measurements we want to identify C clusters of samples, each of which corresponds to a (known or new) subtype. We associate each sample xi with a label indicator vector yi ∈ {0,1}C such that yi(k) = 1 if sample xi belongs to the kth cluster (subtype), otherwise yi(k) = 0. So a partition matrix Y = ; ; ...;1 2y y yT T
nT( ) is used
to represent a clustering scheme.Given the fused graph, in this work we used spectral clustering
to obtain network clusters. Traditional state-of-the-art spectral methods23, aim to minimize RatioCut24, an objective function that effectively combines MinCut and equipartitioning, by solving the following optimization problem:
min ( )
. .
QT
T
n C∈+
×
=
RTrace
s t
Q L Q
Q Q I (8)
where Q = Y(YTY)−1/2 is a scaled partition matrix, L+ denotes the normalized Laplacian matrix L I D WD+ − −= − 1 2 1 2/ / given the similarity matrix W). Matrix D is a network degree matrix, with degrees of each node on the diagonal and off-diagonal elements set to 0). Spectral clustering is effective in capturing global structure of the graph25.
Network-based survival risk prediction. With the fused network, we can perform tasks beyond disease subtyping. An example in this paper is survival prediction with network regularization. Cox model has been successfully applied to perform survival/risk prediction of given new patients. Given all the feature matrix X, the risk of an event (death) at time t for the i-th patient is given by h(t|X) = h0(t) exp(XTz), where z is a vector of regression coef-ficients and h0(t) is the baseline hazard function. This regression
coefficient vector z is estimated by maximizing the Cox’s log-partial likelihood:
lp z z zi
i
n( ) log exp= − ( )
= ∈
∑ ∑d1
X XiT
jT
j R ti( ) (9)
where n is the number of patients, ti is the survival time for the i-th patient and R(ti) is the risk set at time ti, i.e., the set of patients who still survived before ti. δi(·) is an indicator function whether the survival time is observed (δi = 1) or censored (δi = 0).
It is possible to improve survival prediction by incorporat-ing additional information, such as gene interaction data26 or patient similarity based constraints. To incorporate the network structure, similarity between either features or patients (or both) can be used as a regularizer. According to the hazard function of Cox’s model, the relative risk between patient i and patient j is exp( )X Xi
TjTz z− , therefore, a regularizer can be constructed as
( )X XiT
jTz z w− 2
ij . To estimate z, we can use a modified likelihood expression as follows:
lp X Xi
n
ii
( )( )
z z ziT
j R tjT
i
= −
−
= ∈
∑ ∑ ∑1d llog exp( )
jjijX X w∑ −( )i
TjTz z 2 (10)
where λ is the regularizing coefficient. Newton optimization techniques are applied to solve this maximization problem.
Combining data types. SNF can be used to incorporate arbitrary types of discrete (binary or categorical) and continuous data. For integration of discrete data, we recommend the use of chi-squared distance as the similarity measure. Compatibility of data sources can be checked via normalized mutual information (NMI). If the patient similarity obtained from different data sources is com-pletely discordant; NMI can help to clarify which data should and which should not be combined.
20. Wang, K. et al. PennCNV: an integrated hidden Markov model designed for high-resolution copy number variation detection in whole-genome SNP genotyping data. Genome Res. �7, 1665–1674 (2007).
21. Troyanskaya, O. et al. Missing value estimation methods for DNA microarrays. Bioinformatics �7, 520–525 (2001).
22. Wang, B., Jiang, J., Wang, W., Zhou, Z.-H. & Tu, Z. Unsupervised metric fusion by cross diffusion. in Proc. IEEE Comput. Soc. Conf. Comput. Vis. Pattern Recognit. 2997–3004 (IEEE, 2012).
23. Ng, A.Y., Jordan, M.I. & Weiss, Y. On spectral clustering: analysis and an algorithm. Adv. Neural Inf. Process. Syst. �, 849–856 (2002).
24. Wei, Y.C. & Cheng, C.K. Towards efficient hierarchical designs by ratio cut partitioning. in Proc. Int. Conf. Computer-Aided Design 298–301 (ICCAD, 1989).
25. Luxburg, U. A tutorial on spectral clustering. Stat. Comput. �7, 395–416 (2007).
26. Zhang, W. et al. Network-based survival analysis reveals subnetwork signatures for predicting outcomes of ovarian cancer treatment. PLoS Comput. Biol. 9, e1002975 (2013).