Simulation Based Cost-Benefit Analysis for the Inspection of Highway Bridges using Small Unmanned Aerial Systems By Rashmi Kadamkulangara Balagopalan A thesis submitted to the College of Engineering at Florida Institute of Technology in partial fulfillment of the requirements for the degree of Master of Science in Engineering Management Melbourne, Florida May 2018
Transcript
Simulation Based Cost-Benefit Analysis for the
Inspection of Highway Bridges using Small
Unmanned Aerial Systems
By
Rashmi Kadamkulangara Balagopalan
A thesis submitted to the College of Engineering at
Florida Institute of Technology
in partial fulfillment of the requirements
for the degree of
Master of Science
in
Engineering Management
Melbourne, Florida
May 2018
We the undersigned committee hereby approve the attached
thesis, “Simulation Based Cost- Benefit Analysis for the Inspection of
Highway Bridges using Small Unmanned Aerial System,”
by Rashmi Kadamkulangara Balagopalan
____________________________________________
Dr. Luis Daniel Otero, Associate Professor
Major Advisor
Department of Engineering Systems
____________________________________________
Dr. Ersoy Subasi, Assistant Professor
Committee Member
Department of Engineering Systems
_____________________________________________
Dr. Rodrigo Mesa-Arango
Outside Committee Member
Department of Civil Engineering – Construction Management
_____________________________________________
Dr. Muzaffar Shaikh
Department Head
Department of Engineering Systems
iii
Abstract
Title: Simulation Based Cost-Benefit Analysis for the Inspection of
Highway Bridges using Small Unmanned Aerial Systems
Author: Rashmi Kadamkulangara Balagopalan
Advisor: Dr. Luis Daniel Otero, Ph. D.
Visual inspections remain significantly important in surveying the
present decay and deterioration status of bridge inspections. These
inspections are critical to conduct patch-up remedies and
maintenance assignments to guarantee the continued
serviceability of structures. Given the high inventory of bridges
nationwide (over of 600,000 bridges), increasing costs of bridge
inspections are becoming a concern for departments of
transportation (DOTs). The conventional inspection method is costly
due to various factors. For example, the current approach often
requires specialized equipment (e.g., bucket trucks) to conduct
underside bridge inspections that significantly affect safety levels
on the field and overall costs, and inspectors need to coordinate
traffic control via maintenance of traffic (MOT) activities. As an
alternative to the conventional bridge inspection approach, the
academic community have been conducting research to
understand the feasibility of using unmanned aerial systems (UAS)
for bridge inspections. Therefore, there is a need to develop studies
to assist transportation decision-makers in deciding which bridge
inspection method –conventional versus UAS—will be best suitable
for particular bridges. This thesis work provides a first-step approach
to develop such decision-support system based on overall
iv
inspection costs. Discrete event simulation coupled with resource-
based costing are used as tools for the approach presented in this
thesis.
v
TABLE OF CONTENTS
List of Figures ........................................................................................... vii
List of Tables ............................................................................................ viii
Chapter 1: Introduction and Problem Statement ............................... 1
and signals, and environmental condition assessment of cameraroadside areas (Carroll and Rathbone 2002)
Florida monitor remote and rural areas of the state of Florida video/digital(Werner 2003) camera
Ohio capturing aerial images for data collection and traffic video/digitalsurveillance purpose on mountain slopes above state camerahighways (Coifman et al. 2004)
Washington capturing aerial images for data collection and traffic video/digitalState surveillance purpose on mountain slopes above state camera
highways (Coifman et al. 2004)
Utah take high-resolution pictures of highways to inventory video/digitaltheir features and conditions at a very low cost and in camerashort time (Barfuss et al. 2012)
7
(ODOT) are working with universities on SUAS systems to monitor
rural areas, traffic incidents and signals, and environmental
conditions. The authors, with the coordination of GDOT, have given
an analysis on GDOT division that might have the potential to use
SUASs based on operations, mission, and responsibility of each
division. The result identified a clear picture of the general goals
and tasks of different GDOT division and offices.
Once specified, the study continued to identify the requirements
for the GDOT divisions. The purpose and objectives of the divisions
were converted into a set of requirements considered to design the
SUASs depending on different requirements of the divisions based
on certain analysis such as: (1) defining the operational tasks in the
division, (2) studying the environmental conditions of the
operational workplace, (3) analyzing the user characteristics, and
(4) investigating the current technologies/tools used at the
division’s operations. This resulted in detailed matrix significant for
each division’s operation [3].
Based on the interviews conducted employees at the division and
office level from four divisions 24 experts where interviewed to
determining the requirement of a sUAS system was essential to meet
the need of the GDOT identified division. The requirements included
software, hardware, and the user interface. A cost-benefit analysis
was performed to consider design, construction, operation, and
maintenance of a SUAS. Additionally, the cost for training the user
at each division and recruiting an expert for sUAS who understood
the system to implement the job for GDOT was considered. The
interview results highlighted the understanding of SUAS application
throughout DOTs, operational requirements for each identified
8
GDOT division, parameters to design the SUAS for the identified
GDOT divisions, and finally the cost-benefit analysis.
2.3 Activity-based Costing
ABC gets budget plans from the levels of activities that drive costs,
resulting in a more precise and efficient budget plan. Each cost-
focus can have various cost-records, and spending for each cost-
record can be driven by various activities. The study in one journal
[4] discussed the application of discrete event simulation (DES) of
the activity-based manufacturing system to solve many of the
limitations of the traditional cost system (e.g., [4] the total direct cost
– labor cost is calculated from records and proportionally added to
that of new cost and it alters the original cost that is needed to
make a new product).
Simulation models were prepared using the WITNESS simulation
software to model a semi-automated printed circuit board
assembly line. The author conducted a case study to understand
and demonstrate how ABC can be applied to a manufacturing
system using simulation modelling techniques. The ABC technique
was adopted in this study to understand the limitation of the
traditional method of costing, which gives a less clear indicator of
how to properly cut costs and unable to support the decision-
making. Researchers like Cooper, Kaplan, and Turney [5] have
successfully explored cost theories and the development of ABC,
though they have not mentioned an effective cost technique to
the manufacturing environment.
A simulation model was made to understand the appropriate
combination of activity and cost-items required in ABC
methodology. As it considers the manufacturing unit a dynamic,
9
modelling-framework constructed in combination with its
operational aspect and financial variabilities, ABC is time
consuming if not planned and implement the framework in a
constructive way.
Additionally, the study started with the development of simulation
model, observing the processing time of activities in the system
characterizing its variation distribution. To achieve accuracy, the
developers used certain technology called activity-cost drivers,
which consisted of three types [4]: (1) transaction drivers (which
count each time an activity takes place); (2)duration drivers (which
represent the time taken for each activity and so considers
variation); and (3) intensity drivers (which directly cost resources
used each time an activity takes place). Therefore, simulation-
based ABC can be used in combination of these drivers.
This study illustrated the application of a discrete event software
tool helping to develop an ABC manufacturing environment by
creating events or activities that occurred in the manufacturing
system. Kaplan and Cooper of Harvard Business School introduced
ABC [5] as an alternate to the conventional costing method; the
purpose of this method was to break down the system into small
units based on activities, including its amount of time and resource
spent on that activity.
To implement ABC into the simulation model, calculations were
made on cost of each activity formulated in Eq. 1, where C is the
cost contributing to making a product, T the time during which the
resources are occupied, R the cost rates at which the resources are
being used, and M the cost of material used for the process (e.g.,
equipment, labor, etc.) were being used.
10
C=TR+M ----------------- Eq.1
The technique can provide more detailed analyses such as
calculation of the surplus capacity firstly by overhead cost, which
may not be proportional to the direct resource time, and secondly
by the concept of a lump sum overhead. The study explained the
surplus with certain formulas based on surplus capacity and total
cost of operation as shown in Eq.2, where S is the surplus capacity,
Tc the total cost of running the manufacturing system, Ci the cost
required to make the I th product, and m the total number of
products produced [4].
S =Tc - ∑ 𝐶𝑖𝑖=𝑚 𝑖=1 ---------------- Eq. 2
Simulation-based ABC showed a significant advantage, if carefully
planned and worked on the framework by proper verification and
validation of the issues involved. The result showed the accurate
cost information expressing ABC to help evaluate cost through
modeled framework in the simulator WITNESS, which gave an
output to aid the decision-making process. The output included a
time based on the DES methodology, which generated accurate
results of an ABC analysis within the manufacturing environment.
The results efficiently allocated the cost or expenses with respect to
the calculation of surplus capacity, management of quality cost,
and capital justification.
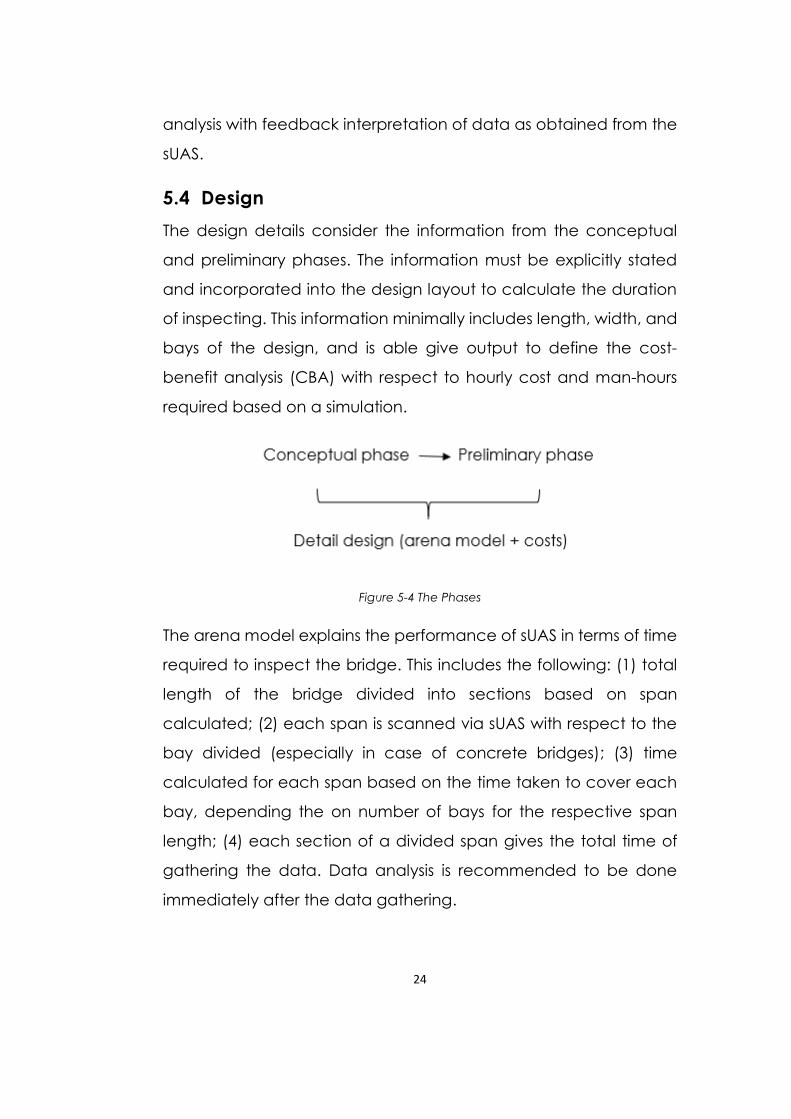
2.4 Production Cost-estimation Framework
The development of a production-cost estimation to support
product family design scope is to maintain economic scale with
minimum values in the performance of each product in the
11
production system [6]. Production cost is the primary concern of the
estimation framework to support product component design
based on ABC with concern to allocation estimation analysis. This
includes the following stages:
1. Concept stage: utilizing an ABC analysis, explicitly state
explanations of appropriate resource-allocation in each
activity
2. Estimation stage: work in direct and indirect cost with respect
to resource data
3. Analysis stage: rank costs
4. To understand the costs, the authors [6] selected the exact
component or design variable involved in the products
(more explicitly, this thesis is mainly concerned with
manpower and equipment for this).
5. Estimations were based on reduced usage of the activities
and reduce the time
6. An example of production process is considered to
understand the cost-estimation with activity-based costing
(ABC). This method considered the components, design
variables, and process variables.
Production costs of each component was carefully analyzed
by allocating the required resources and eliminating wasteful
activities. These cost estimations were further utilized to build
cost functions.
12
Chapter 3: SOLUTION APPROACH AND OPERATIONAL
SCENARIOS
3.1 Approach
A cost analysis framework is proposed to estimate bridge inspection
costs for using sUAS by selecting the exact component or the
parameters incurred in each activity to support the inspection
process to optimize or control costs. These variables will be
predicted based on the inspection process requirements. The
framework is applied to the activity flow to allocate an activity step-
by-step by utilizing the resources allocated for that activity. Similarly,
the activities in the chain are to be planned as per the resources
requirement and the time necessary to monitor each activity. This
allows for accurate and consistent costing by proposing ABC in the
sUAS bridge-inspection process by creating a cost-function
graphical representation.
To evaluate the above approach, it is critical to understand the
bridge inspection process. To extract the proper values, a DES of
sUAS-assisted bridge inspection was constructed using the Arena
simulation software package by Rockwell Automation. This
software can be effectively used to predict total inspection time,
and also to optimize the cost for such inspections. A simulation
model can be made for both conventional and sUAS bridge-
inspection processes.
13
3.2 Operational Scenarios
This section provides scenarios to illustrate how the proposed system
will assist bridge inspectors in the collection of visual data using sUAS
during routine bridge inspections.
3.2.1 Ideal Operational Scenario
In an ideal operational scenario, operations take place during
daylight hours, in good visibility conditions acceptable for sUAS
operations, no roadway or pedestrian traffic, and at least five miles
away from any other aviation activity. Also, this scenario assumes
that FDOT performed the planning of the inspection and a hands-
on inspection is not required, and the inspection to be performed is
a routine one.
To gather visual information of the bridge with the new system, the
process starts by the inspection crew (i.e., team leader, an assistant
bridge inspector, visual observer, and sUAS operator) arriving to the
inspection site. The team leader and the assistant bridge inspector
record the basic information such as bridge location, bridge
orientation, inspection crew, air temperature, weather conditions,
and time. In the meantime, the sUAS operator and visual observer
start setting up the sUAS, the image acquisition system, and the
base station or visual interface for the inspection. Before taking-off,
the pilot verifies the battery status of the sUAS and its components,
and verifies that the image acquisition system is capturing and
transmitting video feed to the visual interface.
Usually, the team starts by inspecting the deck. The sUAS system
equipped with the image acquisition system flies over the surface
of the bridge. The deck inspection can take between 10 to 15
14
minutes. The team leader and the assistant bridge inspector guide
the pilot to focus on specific areas of interest (e.g., bearings, signs
of cracking, corrosion, and spalling) based on the video feed
streamed to the visual interface in near real-time. The team leader
annotates the areas of interest. While the sUAS is flying, the visual
observer keeps communication checks with the pilot and scans for
unexpected aircraft activities, birds, people, and traffic. After the
deck is inspected, the pilot verifies the remaining flight time of the
system. If it is necessary, the sUAS returns to the base station to get
its batteries replaced. Then, the inspection crew proceed to collect
visual data of the superstructure, as well as the substructure
following a similar procedure to the one described above
(inspecting the superstructure usually takes between 15 to 20
minutes, while inspecting the substructure takes around 10 to 15
minutes). While inspecting the superstructure, special attention is
given to the bearings or connections since they provide the critical
link between the superstructure and the substructure and are
usually located at hard-to-reach locations. The video feed from the
image acquisition system in the sUAS is auto-saved and shown in
near real-time in the visual interface, so the team leader and the
assistant bridge inspector have access to the images to report the
observations.
3.2.2 Operational Scenario: Windy Conditions
In the “windy-conditions” operational scenario, the main difference
with the ideal operations scenario is the change in the environment
conditions, namely the presence of wind.
15
3.2.3 Operational Scenario: Traffic Conditions
For most bridges, traffic is an inevitable factor. According to FAA
regulations, sUAS systems cannot be flown in close proximity or
above traffic. Hence the sUAS cannot be used for deck inspection
due to traffic and pedestrian path except with the presence of an
inspection personnel who will be responsible for observing traffic
and guiding the sUAS pilot. The sUAS team will consist of the
pilot/operator, and two visual observers. In a situation where the
bridge location is less than five miles distance from the airport, the
sUAS crew will require authorization from the airport tower. In this
scenario, all other factors surrounding the inspection are favorable.
The operation begins with the inspection crew recording basic
information surrounding the bridge site while the sUAS team sets up
the system and image acquisition system. The sUAS visual observers
proceed to stand at opposite sides of the bridge having a clear
view of approaching traffic. The observers both communicate with
the sUAS pilot using a two-way radio transceiver telling him/her
when it is safe to fly the aircraft. The observers wait until there is no
traffic or pedestrian present before giving the pilot the go-ahead
to fly the sUAS over the deck. When there is an approaching
vehicle, the pilot will move the sUAS behind a barrier or to a
distance greater than 500 feet from non-participants to ensure FAA
requirements are met. From this point, the team leader and the
assistant bridge inspector guide the pilot to focus on specific areas
of interest. The team leader then records observations made and
passes the information to the inspector. When this observation
process is completed, the pilot navigates the sUAS back to landing.
16
Chapter 4: SYSTEM ENGINEERING PROCESS
4.1 System Overview
The sUAS technology (per request of the client) armed with high
definition, image-acquisition system, and a visual interface for the
inspector that will satisfy the FDOT needs as well as alleviate the
costs and amount of time invested on bridge inspections. The main
technical challenge is to allow for the streaming of the video feed
on the sUAS image-capturing device to the inspector’s visual
interface. The product will also reduce the risks associated with
traffic control, the inspection personnel, and the use of aerial work
platforms (AWP) or ropes.
4.2 Stakeholders Definitions
4.2.1 Active stakeholders:
Bridge inspection crew: main bridge inspector
sUAS pilot: person responsible for preflight inspections and
maintenance of the sUAS
sUAS operator: person controlling the payload of the sUAS
Visual observer (VO): person who assists and supports the
pilot to ensure that the sUAS operates within visual line-of-
sight limits.
4.2.2 Interested stakeholders:
FHWA bridge management systems: assists bridge owners in
selecting and performing work that is the right activity, to the
right bridge, at the right time, and at the right cost (as per
national bridge inventory (NBI))
FDOT: organization funding the project (i.e., sponsor)
17
DOT’s nationwide: potential customers, who might adapt
their bridge inspection practices to the one developed in this
project
American association of state highway and transportation
officials (AASHTO)
Federal aviation administration (FAA): entity that gives a
certificate of authorization (COA) necessary for public a sUAS
operations
Airports/heliports: sUAS-operational areas should be located
at least five miles away from any airport or heliport
Training and support personnel
National highway institute: organization that provides
certification in bridge inspections.
4.3 Primary Responsibilities
Primary responsibilities include identifying, reviewing, clarifying, and
prioritizing functional requirements for sUAS-assisted inspections. The
functional requirements include the product’s input, output, and
behavioral requirements in terms of calculations, technical details,
data manipulation, and all necessary criteria for the system. The key
role of the functional requirements is to design the system
framework involved in the entire process and interconnect
activities which help in the implementation of the system.
Behavioral requirements of each response in the system evaluate
the best use of the product.
Requirements are completely and comprehensively elaborated
and documented to reflect needs of stakeholders as shown in
18
Figure 4-1. Requirements are collected or controlled to establish the