Page 1
SIMULATION MODELING OF
SHOP FLOOR ACTIVITIES FOR SMEs
IN VIRTUAL ENTERPRISES
A THESIS SUBMITTED TO
THE GRADUATE SCHOOL OF NATURAL AND APPLIED SCIENCES
OF
MIDDLE EAST TECHNICAL UNIVERSITY
BY
MUSTAFA BAHTİYAR
IN PARTIAL FULFILLMENT OF THE REQUIREMENTS
FOR
THE DEGREE OF MASTER OF SCIENCE
IN
MECHANICAL ENGINEERING
JUNE 2005
Page 2
ii
Approval of the Graduate School of Natural and Applied Sciences
Prof. Dr. Canan ÖZGEN
Director
I certify that this thesis satisfies all the requirements as a thesis for the degree of Master of Science.
Prof. Dr. Kemal İDER Head of the Department
This is to certify that we have read this thesis and that in our opinion it is fully adequate, in scope and quality, as a thesis for the degree of Master of Science.
Prof. Dr. S.Engin KILIÇ Supervisor
Examining Committee Members Prof. Dr. Metin AKKÖK (METU,ME) Prof. Dr. S.Engin KILIÇ (METU,ME) Prof. Dr. Ömer ANLAĞAN (METU,ME) Prof. Dr. Mustafa İ.GÖKLER (METU,ME) Assoc. Prof. Dr. Tayyar ŞEN (METU,IE)
Page 3
iii
I hereby declare that all information in this document has been obtained and
presented in accordance with academic rules and ethical conduct. I also declare that,
as required by these rules and conduct, I have fully cited and referenced all material
and results that are not original to this work.
Mustafa BAHTİYAR
Signature:
Page 4
iv
ABSTRACT
SIMULATION MODELING OF
SHOP FLOOR ACTIVITIES FOR SMEs
IN VIRTUAL ENTERPRISES
Bahtiyar, Mustafa
M. Sc., Department of Mechanical Engineering
Supervisor: Prof. Dr. S.Engin KILIÇ
June 2005, 144 pages
The globalization of the markets and the worldwide competition forces the
SMEs to implement new technologies and organize themselves using new concepts
in order to maintain their competitivity. This type of temporary alliance is called as
Virtual Enterprise (VE). SMEs seem to be appropriate units for building this type of
temporary alliances when their properties (such as flexibility, adaptability and
agility) are taken into account. This study is concerned with the simulation modeling
of shop floor activities for SMEs in VEs. Analyzing the SMEs with their current and
new work load over the existing one by using simulation tool may help the VE
management unit to see the most appropriate SMEs for the projects. Because of
mentioned advantages, this thesis will test whether the simulation tool will or will
not be used in the selection of the VE partner.
The simulation methodology for modeling shop floor activities of SMEs was
developed by using ARENA simulation tool in this thesis. A hydraulic cylinder
company was selected for pilot application. Manufacturing of twelve basic hydraulic
cylinders was studied in the developed model. Four different queue rules were
Page 5
v
applied to the developed model to optimize the system efficiency. By analyzing the
output statistical results of ARENA which were obtained with the usage of the input
variables of SME (such as resource capacities, process times, setup and remove
times of parts, variables wrt to workers, etc.) best manufacturing policy for pilot
SME was able to be found. To see the response of the system under different
circumstances, grinding and hardening operations for a drive shaft manufacturing
were assigned to the company. This new job was applied on two models (Base
Model and Optimized System Model) and the statistical results of each were
examined.
Keywords: Simulation, Modeling, Virtual Enterprise System, Partner Selection.
Page 6
vi
ÖZ
SANAL İŞLETMELERDEKİ KOBİLERİN
ATELYE FAALİYETLERİNİN
BENZETİM MODELLENMESİ
Bahtiyar, Mustafa
Yüksek Lisans, Makine Mühendisligi Bölümü
Tez Yöneticisi: Prof. Dr. S. Engin KILIÇ
Haziran 2005, 144 sayfa
Piyasaların küreselleşmesi ve dünya çapındaki rekabet, KOBİleri bu rekabetin
içerisinde yer alabilmeleri için, yeni teknolojileri uygulamaya ve kendilerini yeni
konseptlere uyarlamaya zorlamıştır. KOBİler küreselleşmiş iş olanaklarına en etkin
yanıtı verebilmek için sahip oldukları yetenekleri paylaşarak geçici ortaklıklar
kurmalıdırlar. Bu tarz kurulan ortaklık sistemine Sanal Ortaklık Sistemi denir.
KOBİlerin özellikleri (esneklik, uyum ve çeviklik) gözönüne alındığında bu tür
geçici ortaklıklar için en uygun birimler oldukları ortaya çıkmaktadır. Bu çalışma,
Sanal Ortaklık Sisteminde yer alacak KOBİlerin atelye faaliyetlerinin simülasyon
modellemeleriyle ilgilidir. Oluşturulan modellerin anlık ve sonradan eklenmiş iş
yükleri altında incelenmesi Sanal Ortaklık yönetimine en uygun KOBİ yi seçimi
esnasında yardımcı olacaktır. Belirtilen bu avantajlar ışığında, bu tez, simülasyon
aracının Sanal Ortaklık Sisteminde yer alacak partner KOBİlerin seçimi sırasında
kullanılıp kullanılmayacağını test edecektir.
Page 7
vii
Bu tezde, KOBİlerin atelye faaliyetlerini modellemek için ARENA
simulasyon aracı baz alınarak bir simülasyon metodolojisi çıkartılmıştır. Pilot
uygulama için bir hidrolik silindir şirketi seçilmiştir. Toplam oniki adet temel
hidrolik silindir üretimi oluşturulan modelde denenmiştir. Sistemi en iyi şekilde
optimize edebilmek için 4 farklı kuyruk kuralı test edilmiştir. Modelleme esnasında
tanımlanan giriş değişkenlerini (kaynak kapasiteleri, proses zamanları, parça
yükleme çıkarma zamanları, işçilere ait değişkenler, vs.) kullanarak ARENA’nın
elde ettiği istatistiksel sonuçlar incelenerek en şirket için en uygun üretim politikası
bulunmuştur. Oluşturulan modelin değişik durumlarda verdiği tepkileri gözlemlemek
için dişli mil üretimi sırasında uygulanan taşlama ve yüzey sertleştirme
operasyonları, hazırlanan iki modele (Ana Model ve Optimize Edilmiş Sistem
Modeli) girilmiştir. Bu iki deneyin istatistiksel sonuçları incelenmiştir. Bu çalışma
sırasında ARENA simülasyon programı kullanılmıştır.
Anahtar Kelimeler: Simülasyon, Modelleme, Sanal Ortaklık Sistemi, Partner Seçimi.
Page 8
viii
To My Lovely Family
Page 9
ix
ACKNOWLEDGMENTS
I would like to thank my thesis supervisor Prof. Dr. S.Engin KILIÇ for his
continuous support and guidance throughout my work.
I would like to thank Erdemler Hydraulic Cylinder Company for their support
while developing my simulation model.
I am indebted to my friends Gülgün Aktakka, Onur Yazıcı, N. Deniz Yücel
and Burak Sarı for their continuous support.
I am also grateful to Ege Erşen and Berrin Erşen for their endless support
throughout this hard work.
Finally, my greatest thanks go to my parents who shaped me with their never
ending patience.
Page 10
x
TABLE OF CONTENTS
PLAGIARISM ............................................................................................................. iii
ABSTRACT................................................................................................................. iv
ÖZ ................................................................................................................................ vi
ACKNOWLEDGMENTS ........................................................................................... ix
TABLE OF CONTENTS.............................................................................................. x
LIST OF FIGURES ................................................................................................... xiv
LIST OF TABLES ...................................................................................................xviii
CHAPTER
1. INTRODUCTION.............................................................................................. 1
1.1 Definition of Modeling ............................................................................... 2
1.2 Definition of Simulation ............................................................................. 3
1.3 Scope........................................................................................................... 4
1.4 Outline ........................................................................................................ 4
2. LITERATURE SURVEY .................................................................................. 5
2.1 Development of VE Concept...................................................................... 5
2.2 Properties of Virtual Enterprise Concept.................................................. 11
2.3 Review of Virtual Enterprise Concept...................................................... 12
2.4 Modeling................................................................................................... 13
2.4.1 System to be Modeled..................................................................... 14
2.5 Simulation................................................................................................. 15
2.5.1 Benefits of Simulation Modeling and Analysis .............................. 18
2.5.2 Disadvantages of Simulation........................................................... 19
2.5.3 Pitfalls to Guard against in Simulation ........................................... 19
2.6 Usage of Simulation Tool under VE System............................................ 20
Page 11
xi
2.7 Selection of Simulation Software ............................................................. 22
2.7.1 ARENA® ......................................................................................... 23
2.7.2 SIMAN............................................................................................ 23
2.7.3 ARENA® Template ......................................................................... 24
2.7.4 Animation in ARENA®................................................................... 25
2.7.5 Flowchart Model Development in ARENA®.................................. 25
2.7.6 Integration via ActiveX, DAO and ODBC ..................................... 27
3. METHODOLOGY FOR SIMULATION MODELING OF SMEs WITH
ARENA®
.............................................................................................................................. 28
3.1 Overview................................................................................................... 28
3.2 Collecting General System (Company Properties) Data .......................... 29
3.3 Collecting and Processing Real System (Shop-Floor) Data ..................... 32
3.4 Formulate and Develop a Model .............................................................. 36
3.5 Verification & Validation ......................................................................... 36
3.6 Establish Experimental Conditions for Model.......................................... 37
3.7 Analysis and Interpretation of Simulation Results ................................... 38
4. A SAMPLE APPLICATION FOR SIMULATION MODELING WITH
ARENA®
.............................................................................................................................. 39
4.1 Overview................................................................................................... 39
4.2 Collecting General System (Company Properties) Data .......................... 40
4.2.1 Turning Operation............................................................................ 43
4.2.2 Welding Operation........................................................................... 44
4.2.3 Heat Treatment Process (Induction Surface Hardening) ................. 44
4.2.4 Grinding Operation .......................................................................... 44
4.2.5 Chorome Plating Process ................................................................. 44
4.2.6 Pipe Cutting Process ........................................................................ 45
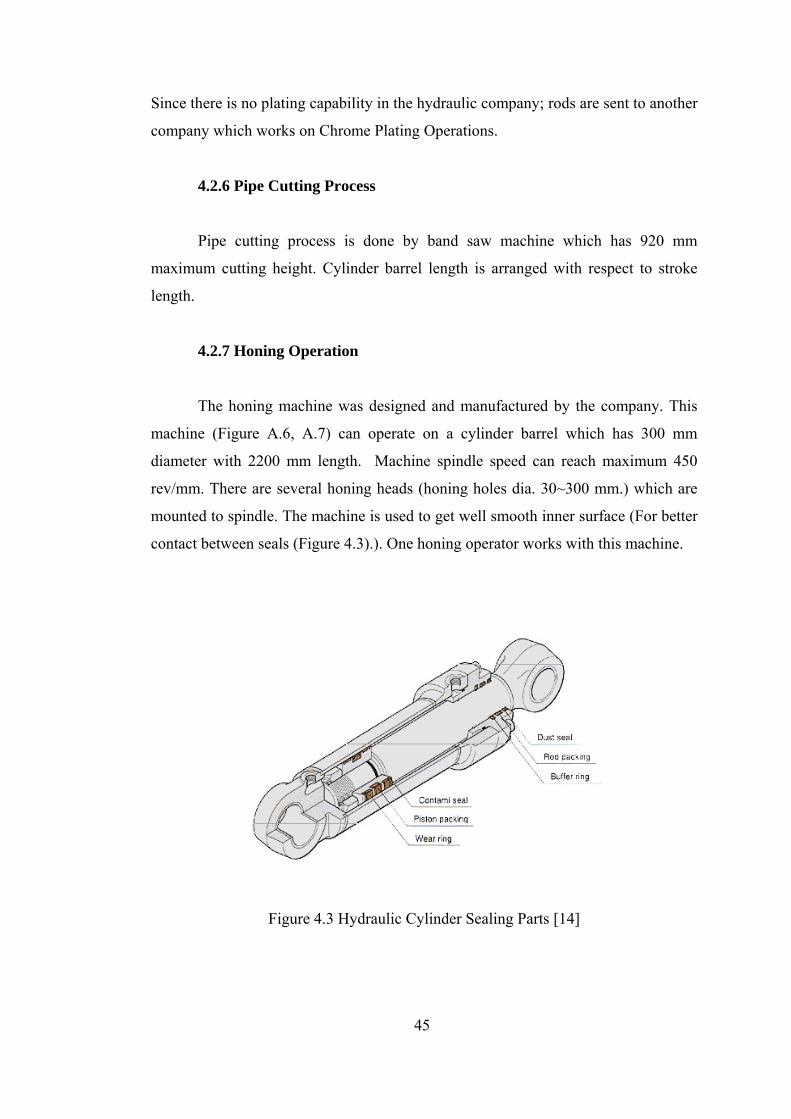
4.2.7 Honing Operation............................................................................. 45
4.2.8 Drilling Operation ............................................................................ 46
4.3 Collecting and Processing Real System (Shop-Floor) Data ..................... 46
4.4 Formulate and Develop a Model .............................................................. 51
Page 12
xii
4.4.1 Part Arrival Section.......................................................................... 54
4.4.2 Manufacturing Section..................................................................... 54
4.4.2.1 Sub-Model of Band Saw Machine .......................................... 55
4.4.2.2 Sub-Model of Heat Treatment Process ................................... 55
4.4.2.3 Sub-Model of Turning Machines ............................................ 55
4.4.2.4 Sub-Model of Grinding Machines .......................................... 56
4.4.2.5 Sub-Model of Chrome Plating Process ................................... 56
4.4.2.6 Sub-Model of Welding Process .............................................. 56
4.4.2.7 Sub-Model of Drilling Machine.............................................. 56
4.4.2.8 Sub-Model of Honing Machine .............................................. 57
4.4.2.9 Sub-Model of Cleaning Process.............................................. 57
4.4.2.10 Sub-Model of Assembling Process ....................................... 57
4.4.3 Disposal Section............................................................................... 57
4.5 Verification & Validation ......................................................................... 58
4.6 Experimental Models and Their Results................................................... 58
4.7 Experiments for VE Organization ............................................................ 64
5. CONCLUSIONS AND RECOMMENDATIONS FOR FUTURE WORK .... 67
REFERENCES..................................................................................................... 70
APPENDICES
A. MACHINERY CAPABILITIES & PRODUCT TYPES OF ERDEMLER
HYDRAULIC COMPANY
.............................................................................................................................. 72
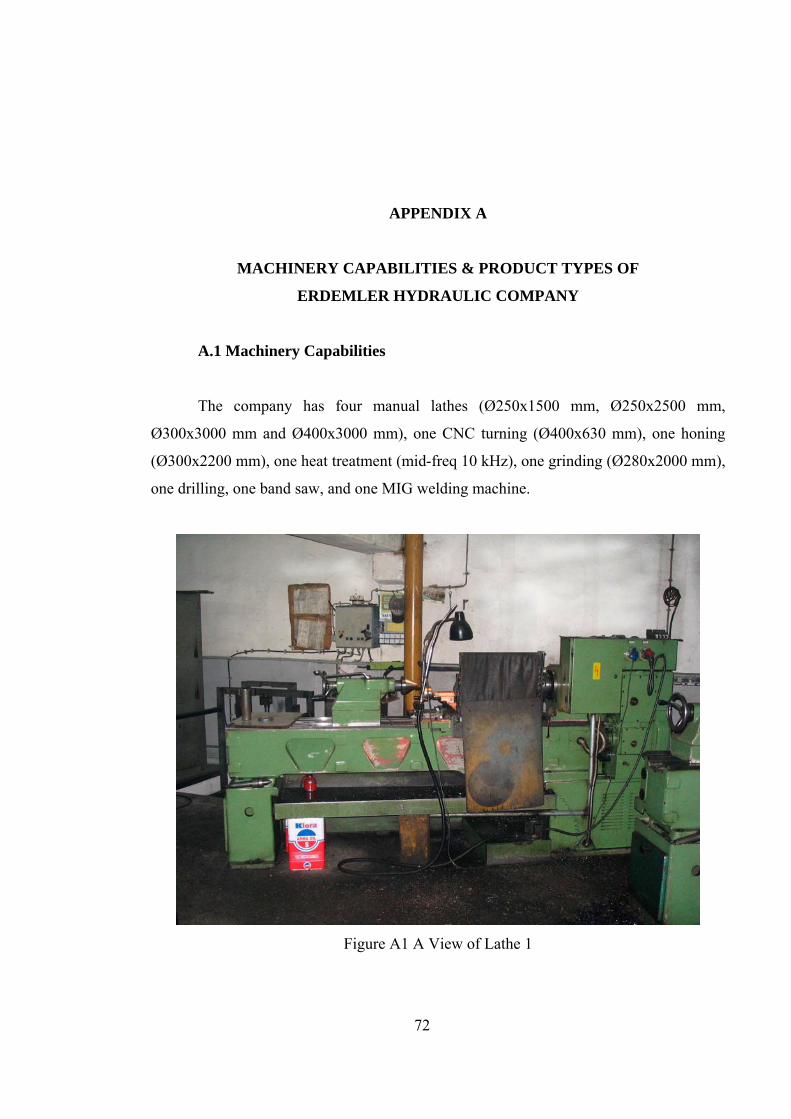
A.1 Machinery Capabilities ............................................................................ 72
A.2 Product Variety ........................................................................................ 79
B. MODEL DEVELOPMENT OF ERDEMLER HYDRAULIC CYLINDER
COMPANY
.............................................................................................................................. 83
B.1 Modules of Simulation............................................................................. 83
B.2 Animation of Simulation.......................................................................... 87
C. STATISTIC RESULTS OF EXPERIMENTAL RUNS
.............................................................................................................................. 89
Page 13
xiii
C.1 Statistical Results of “Process Type” Experiment (Time units: Minute). 89
C.2 Statistical Results of “FIFO” Experiment (Time units: Minute) ............. 97
C.3 Statistical Results of “LPT” Experiment (Time units: Minute) ............. 105
C.4 Statistical Results of “SPT” Experiment (Time units: Minute) ............. 113
C.5 Statistical Results of “Part Priority” Experiment (Time units: Minute) 121
C.6 Statistical Results of Drive Shaft manufacturing under “Process Type”
Experiment (Time units: Minute) ................................................................. 129
C.7 Statistical Results of Drive Shaft manufacturing under “Part Priority”
Experiment (Time units: Minute) ................................................................. 137
Page 14
xiv
LIST OF FIGURES
FIGURE
2.1 Requirements and Features of Future Manufacturing Systems [1]...................... 7
2.2 Virtual Enterprise [9]. ........................................................................................ 10
2.3 Simulation Study Schematic [12]. ..................................................................... 17
2.4 Virtual Enterprise Process Model [10]............................................................... 21
2.5 General View of Arena Simulation Tool ........................................................... 26
3.1 Examination of Firm:No1 .................................................................................. 29
3.2 Examination of Firm:No2 .................................................................................. 31
3.3 Examination of Firm:No3 .................................................................................. 32
3.4 Examination of Firm:No4 .................................................................................. 35
3.5 Examination of Firm:No5 .................................................................................. 36
4.1 Worker Schedule................................................................................................ 41
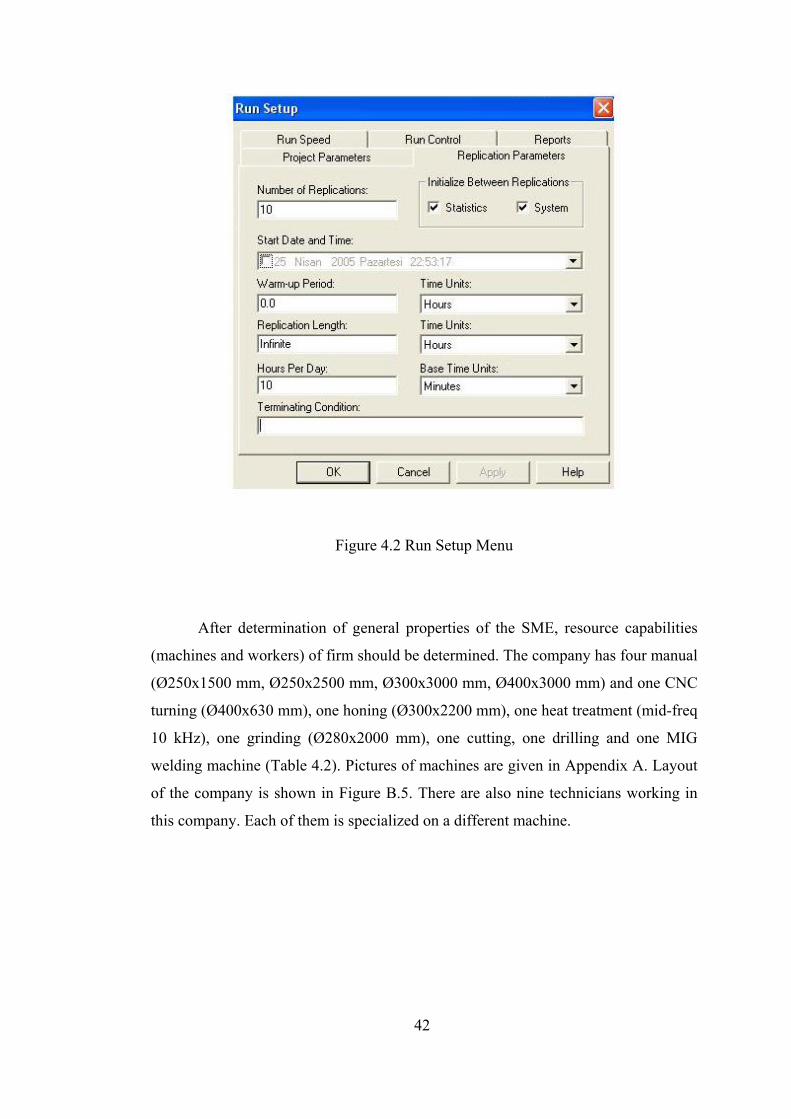
4.2 Run Setup Menu................................................................................................. 42
4.3 Hydraulic Cylinder Sealing Parts....................................................................... 45
4.4 Standard Part List............................................................................................... 47
4.5 Process Plan ....................................................................................................... 48
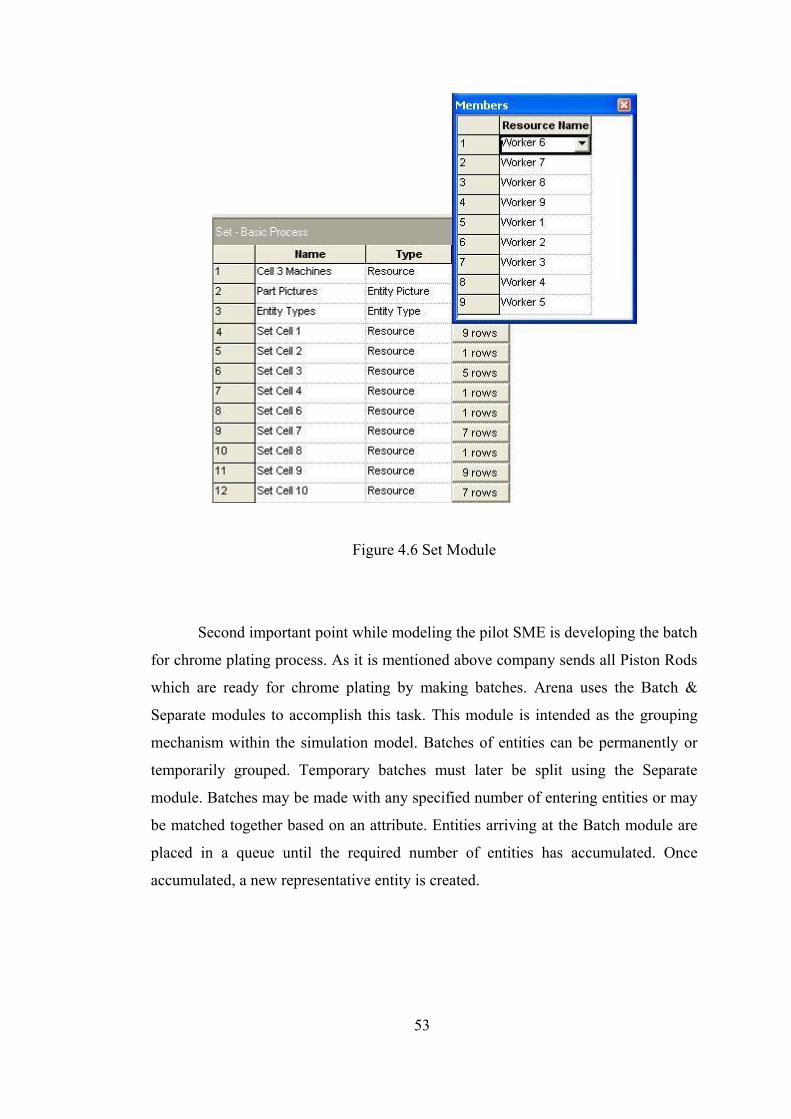
4.6 Set Module ......................................................................................................... 53
4.7 Value-Added Time for Entities.......................................................................... 59
4.8 Waiting Time for Entities................................................................................... 60
4.9 Transfer Time for Entities.................................................................................. 61
4.10 Total Time for Entities ..................................................................................... 61
4.11 Process Times wrt Machines............................................................................ 62
A.1 A View of Lathe 1............................................................................................. 72
A.2 A View of Lathe 2............................................................................................. 73
A.3 A View of Lathe 3............................................................................................. 73
Page 15
xv
A.4 A View of Lathe 4............................................................................................. 74
A.5 A View of CNC Lathe....................................................................................... 75
A.6 A View of Honing Machine.............................................................................. 75
A.7 A View of Honing Operation............................................................................ 75
A.8 A View of Heat Treatment Machine ................................................................. 76
A.9 A View of Grinding Machine ........................................................................... 76
A.10 A View of Vertical Drilling Machine ............................................................. 77
A.11 General View of Workshop_1......................................................................... 77
A.12 General View of Workshop_2......................................................................... 78
A.13 Basic Hydraulic Cylinders .............................................................................. 79
A.14 Three Stage Telescopic Cylinders................................................................... 80
A.15 Four Stage Telescopic Cylinders..................................................................... 81
A.16 Five Stage Telescopic Cylinders ..................................................................... 82
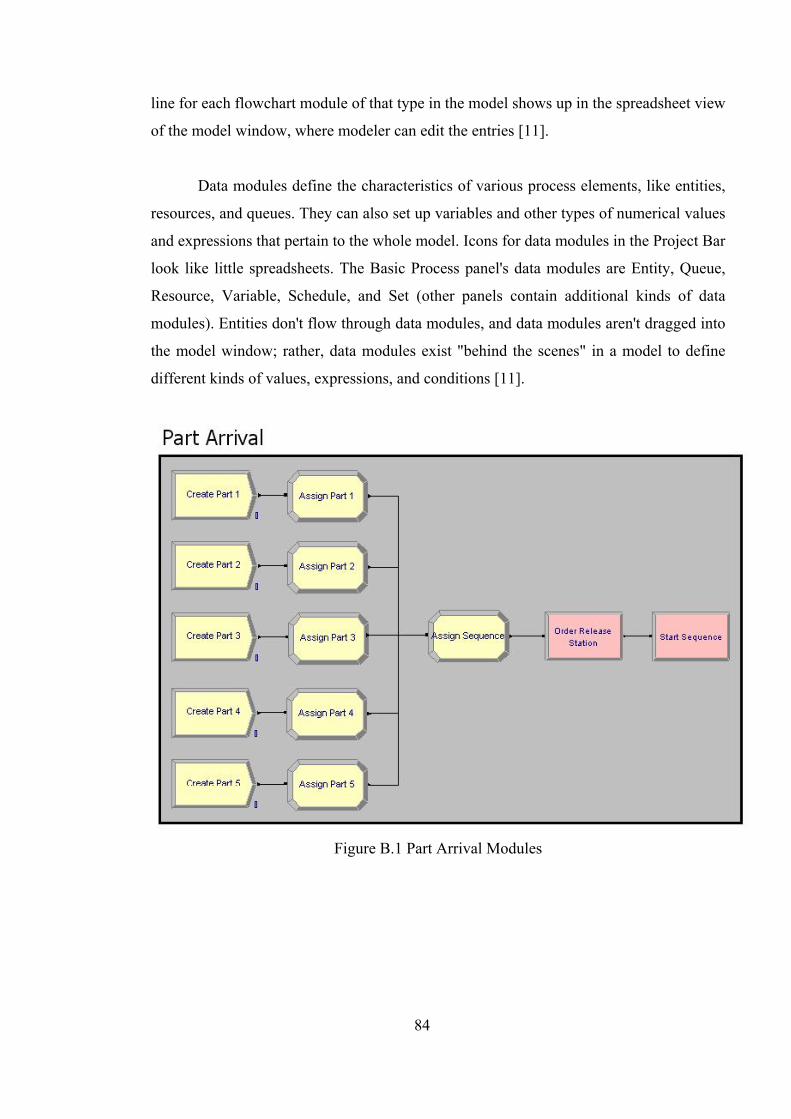
B.1 Part Arrival Modules ......................................................................................... 84
B.2 Manufacturing Modules Part_1......................................................................... 85
B.3 Manufacturing Modules Part_2......................................................................... 86
B.4 Part Disposal Modules....................................................................................... 86
B.5 Layout of Erdemler Hydraulic Company.......................................................... 87
B.6 Screen Shot of Simulation................................................................................. 88
C.1 Entity-Value Added Time ................................................................................. 89
C.2 Entity-Wait Time............................................................................................... 90
C.3 Entity-Transfer Time......................................................................................... 90
C.4 Entity-Total Time .............................................................................................. 91
C.5 Process-VA Time (Per Entity) .......................................................................... 92
C.6 Process-Total Time (Per Entity)........................................................................ 92
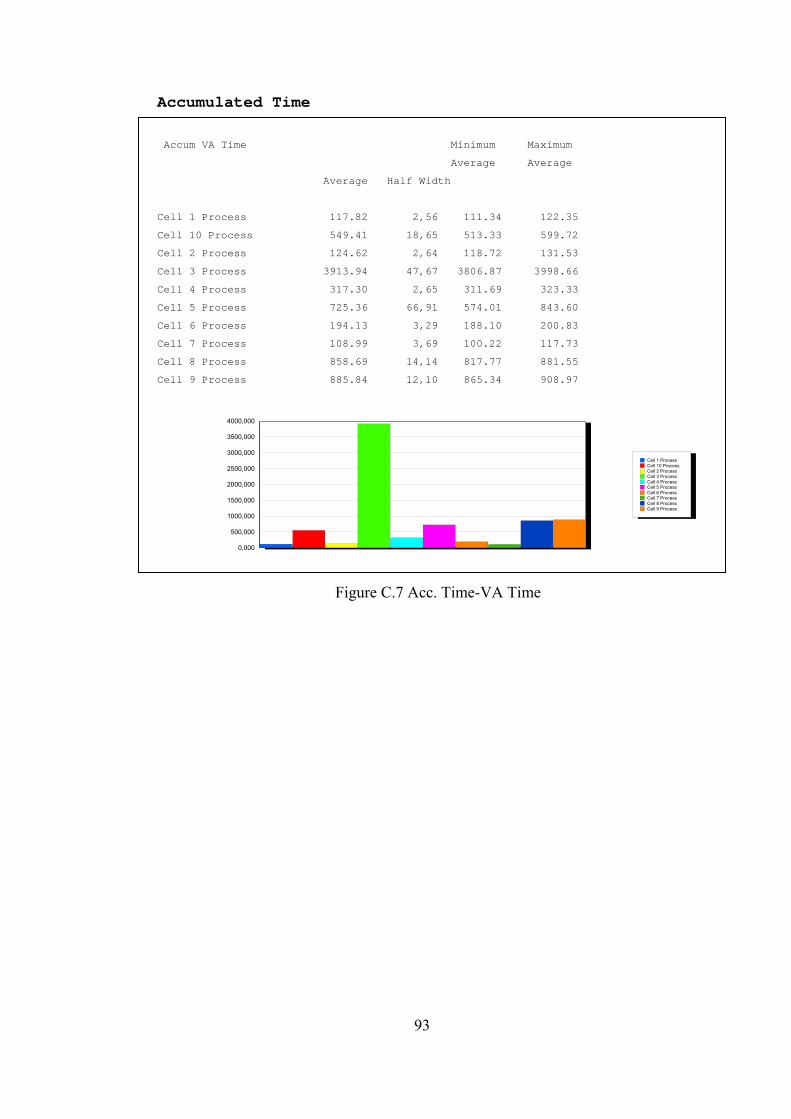
C.7 Acc. Time-VA Time.......................................................................................... 93
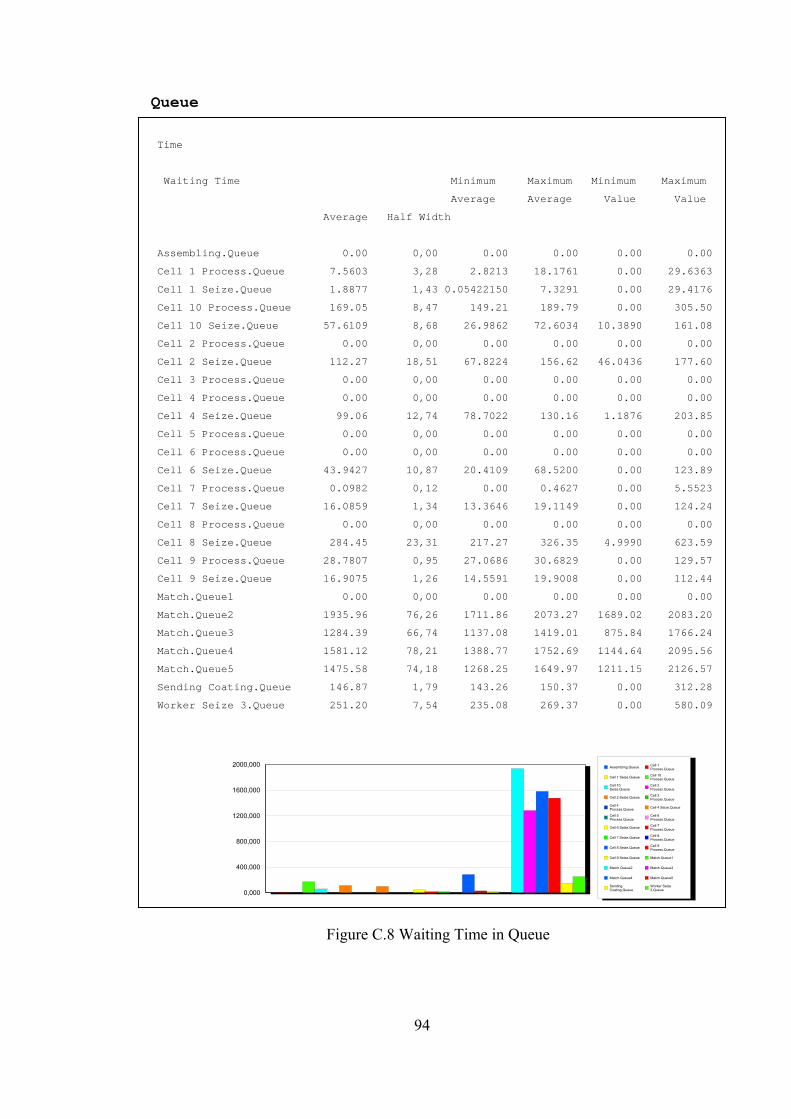
C.8 Waiting Time in Queue ..................................................................................... 94
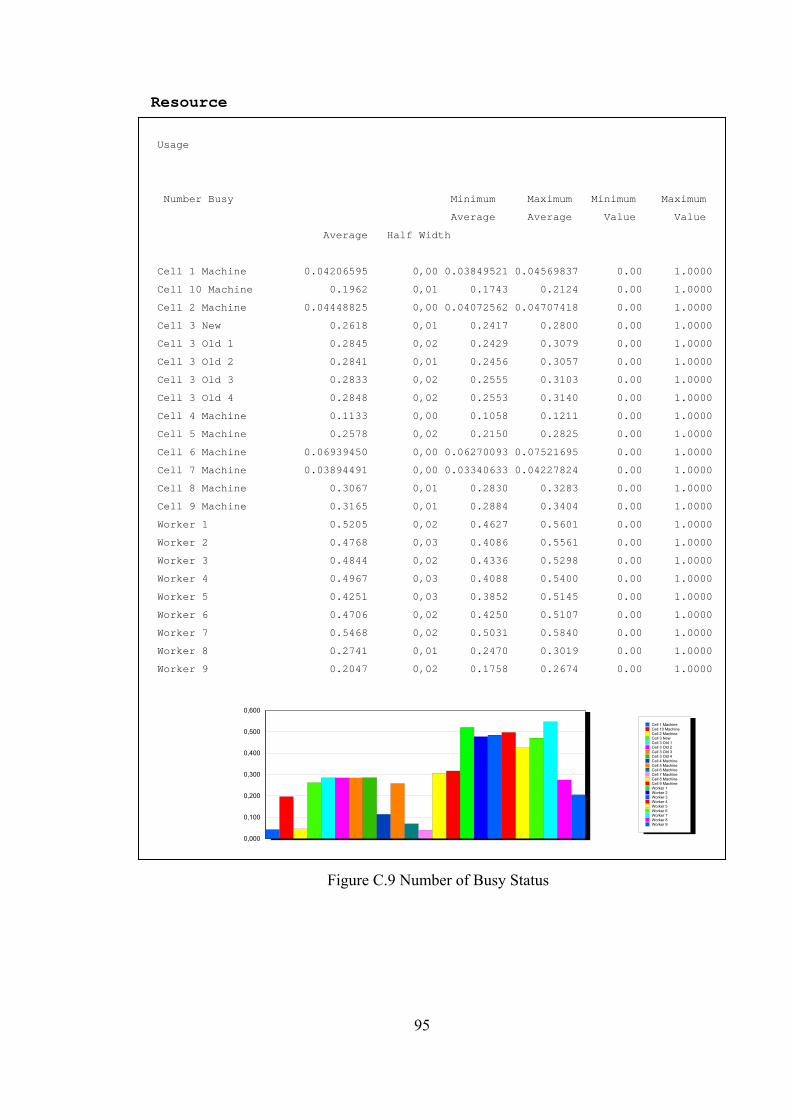
C.9 Number of Busy Status...................................................................................... 95
C.10 Total Number Seized (Resources)................................................................... 96
C.11 Entity-Value Added Time ............................................................................... 97
C.12 Entity-Wait Time............................................................................................. 98
C.13 Entity-Transfer Time ....................................................................................... 98
Page 16
xvi
C.14 Entity-Total Time ............................................................................................ 99
C.15 Process-VA Time (Per Entity) ...................................................................... 100
C.16 Process-Total Time (Per Entity).................................................................... 100
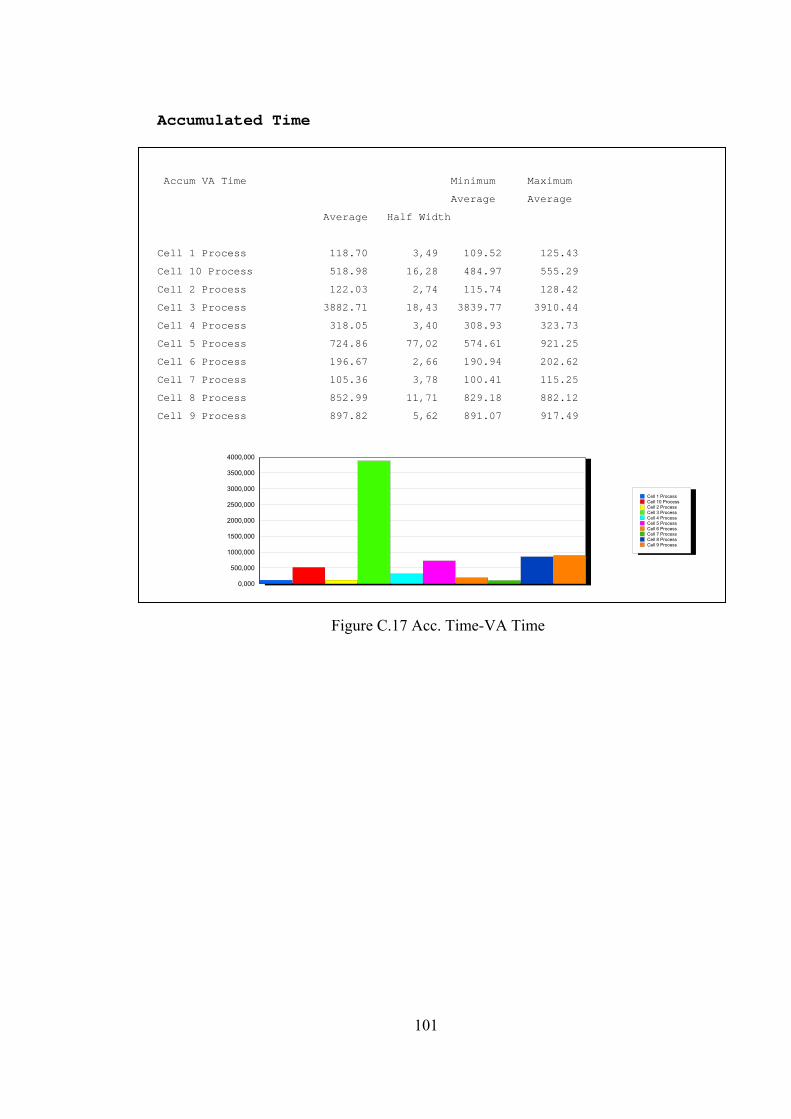
C.17 Acc. Time-VA Time...................................................................................... 101
C.18 Waiting Time in Queue ................................................................................. 102
C.19 Number of Busy Status.................................................................................. 103
C.20 Total Number Seized (Resources)................................................................. 104
C.21 Entity-Value Added Time ............................................................................. 105
C.22 Entity-Wait Time........................................................................................... 106
C.23 Entity-Transfer Time ..................................................................................... 106
C.24 Entity-Total Time .......................................................................................... 107
C.25 Process-VA Time (Per Entity) ...................................................................... 108
C.26 Process-Total Time (Per Entity).................................................................... 108
C.27 Acc. Time-VA Time...................................................................................... 109
C.28 Waiting Time in Queue ................................................................................. 110
C.29 Number of Busy Status.................................................................................. 111
C.30 Total Number Seized (Resources)................................................................. 112
C.31 Entity-Value Added Time ............................................................................. 113
C.32 Entity-Wait Time........................................................................................... 114
C.33 Entity-Transfer Time ..................................................................................... 114
C.34 Entity-Total Time .......................................................................................... 115
C.35 Process-VA Time (Per Entity) ...................................................................... 116
C.36 Process-Total Time (Per Entity).................................................................... 116
C.37 Acc. Time-VA Time...................................................................................... 117
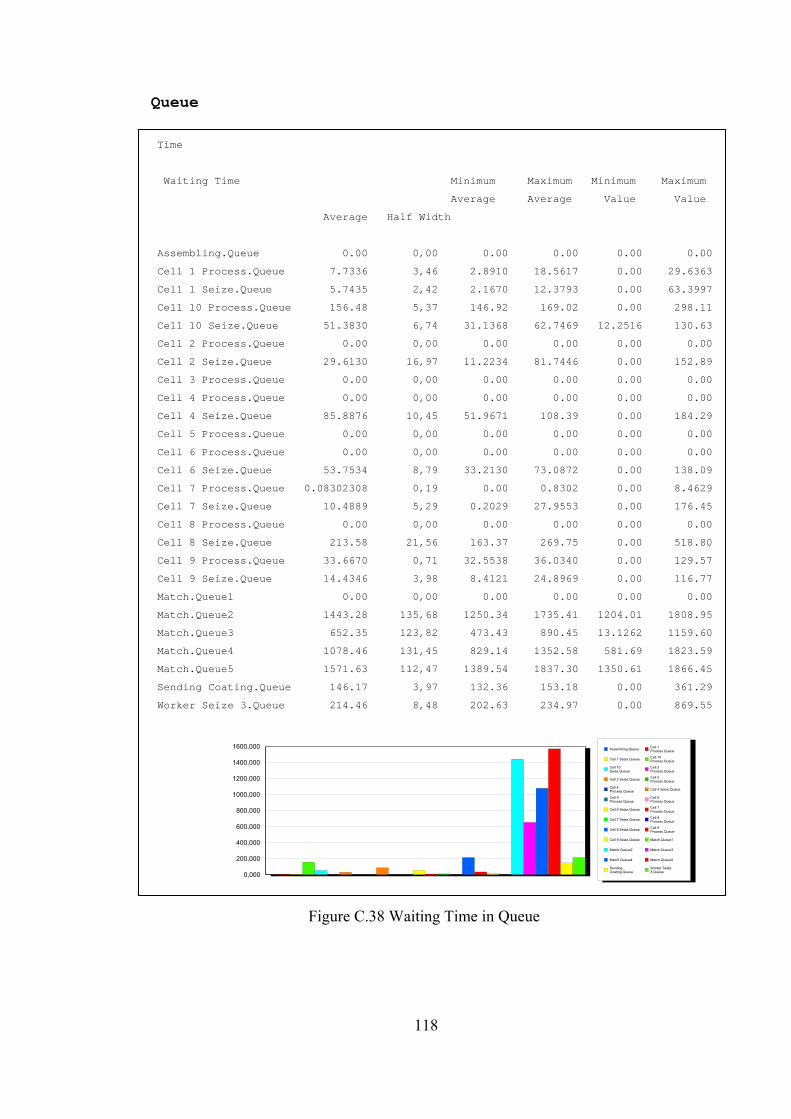
C.38 Waiting Time in Queue ................................................................................. 118
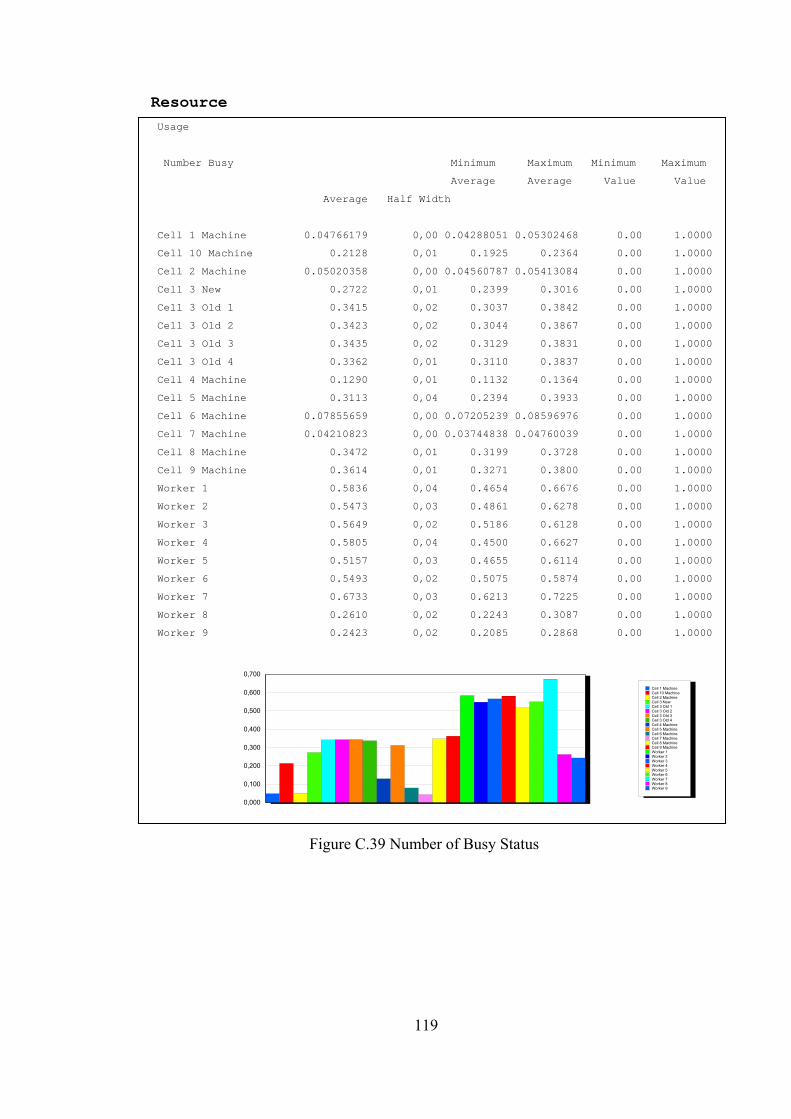
C.39 Number of Busy Status.................................................................................. 119
C.40 Total Number Seized (Resources)................................................................. 120
C.41 Entity-Value Added Time ............................................................................. 121
C.42 Entity-Wait Time........................................................................................... 122
C.43 Entity-Transfer Time ..................................................................................... 122
C.44 Entity-Total Time .......................................................................................... 123
C.45 Process-VA Time (Per Entity) ...................................................................... 124
Page 17
xvii
C.46 Process-Total Time (Per Entity).................................................................... 124
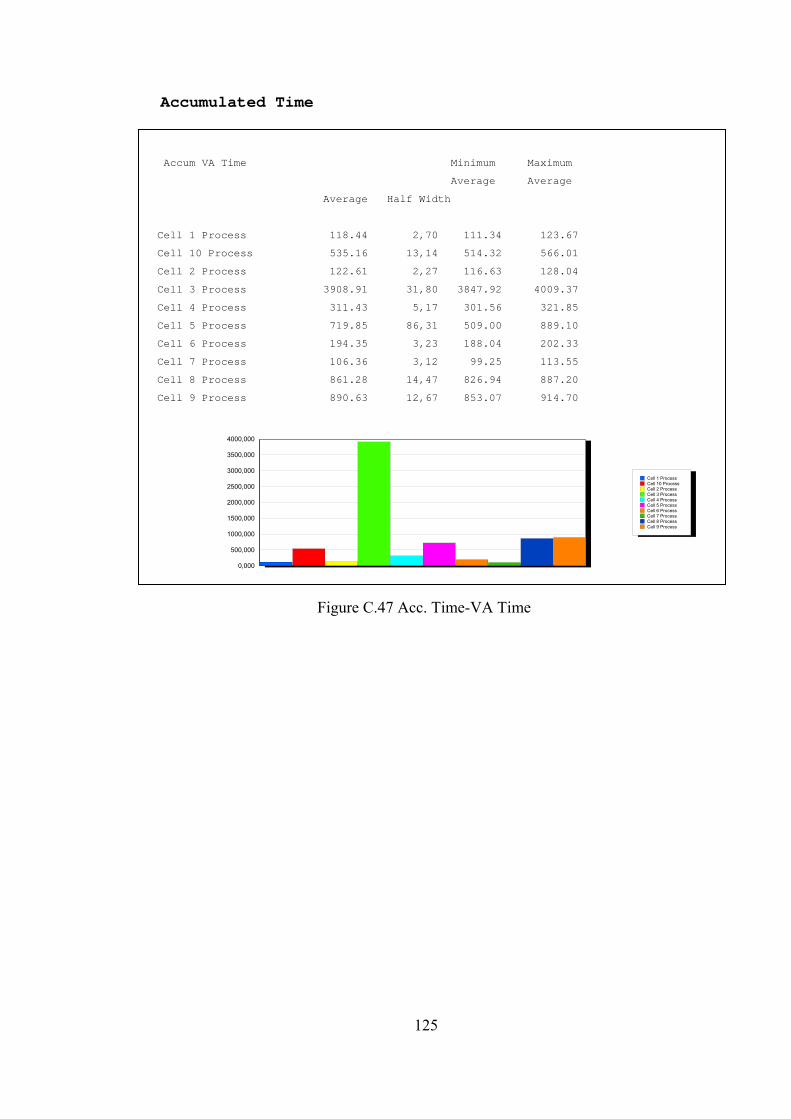
C.47 Acc. Time-VA Time...................................................................................... 125
C.48 Waiting Time in Queue ................................................................................. 126
C.49 Number of Busy Status.................................................................................. 127
C.50 Total Number Seized (Resources)................................................................. 128
C.51 Entity-Value Added Time ............................................................................. 129
C.52 Entity-Wait Time........................................................................................... 130
C.53 Entity-Transfer Time ..................................................................................... 130
C.54 Entity-Total Time .......................................................................................... 131
C.55 Process-VA Time (Per Entity) ...................................................................... 132
C.56 Process-Total Time (Per Entity).................................................................... 132
C.57 Acc. Time-VA Time...................................................................................... 133
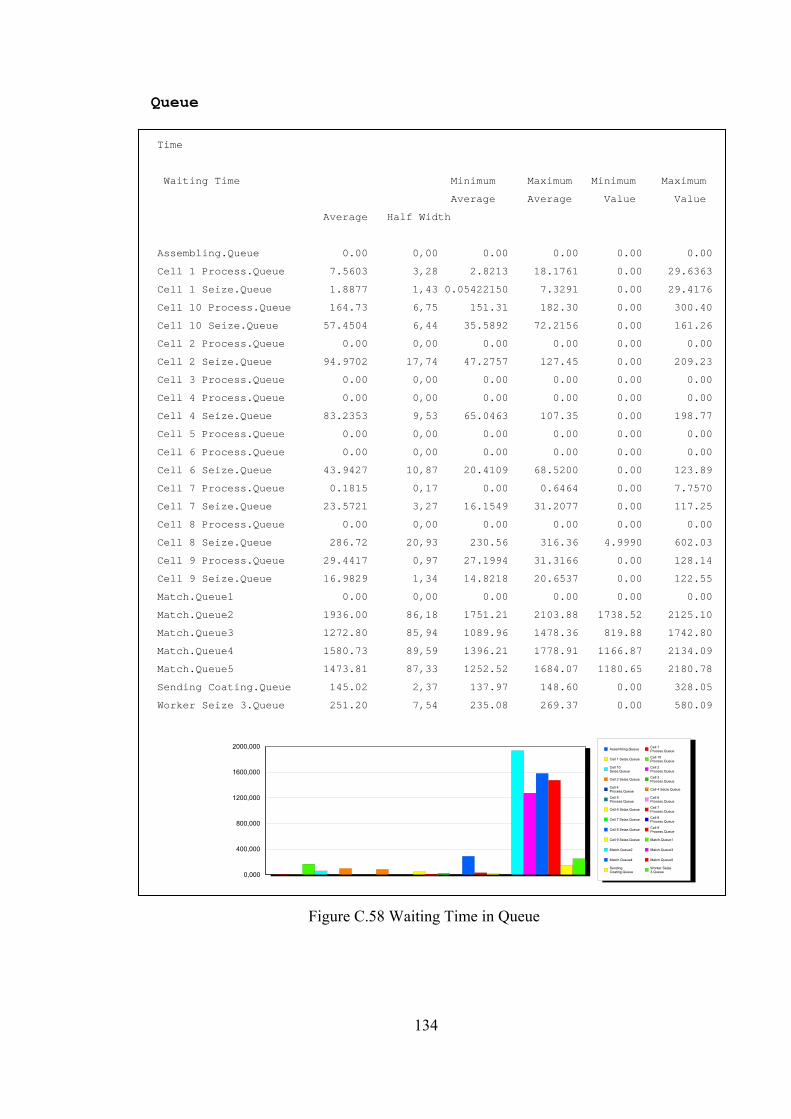
C.58 Waiting Time in Queue ................................................................................. 134
C.59 Number of Busy Status.................................................................................. 135
C.60 Total Number Seized (Resources)................................................................. 136
C.61 Entity-Value Added Time ............................................................................. 137
C.62 Entity-Wait Time........................................................................................... 138
C.63 Entity-Transfer Time ..................................................................................... 138
C.64 Entity-Total Time .......................................................................................... 139
C.65 Process-VA Time (Per Entity) ...................................................................... 140
C.66 Process-Total Time (Per Entity).................................................................... 140
C.67 Acc. Time-VA Time...................................................................................... 141
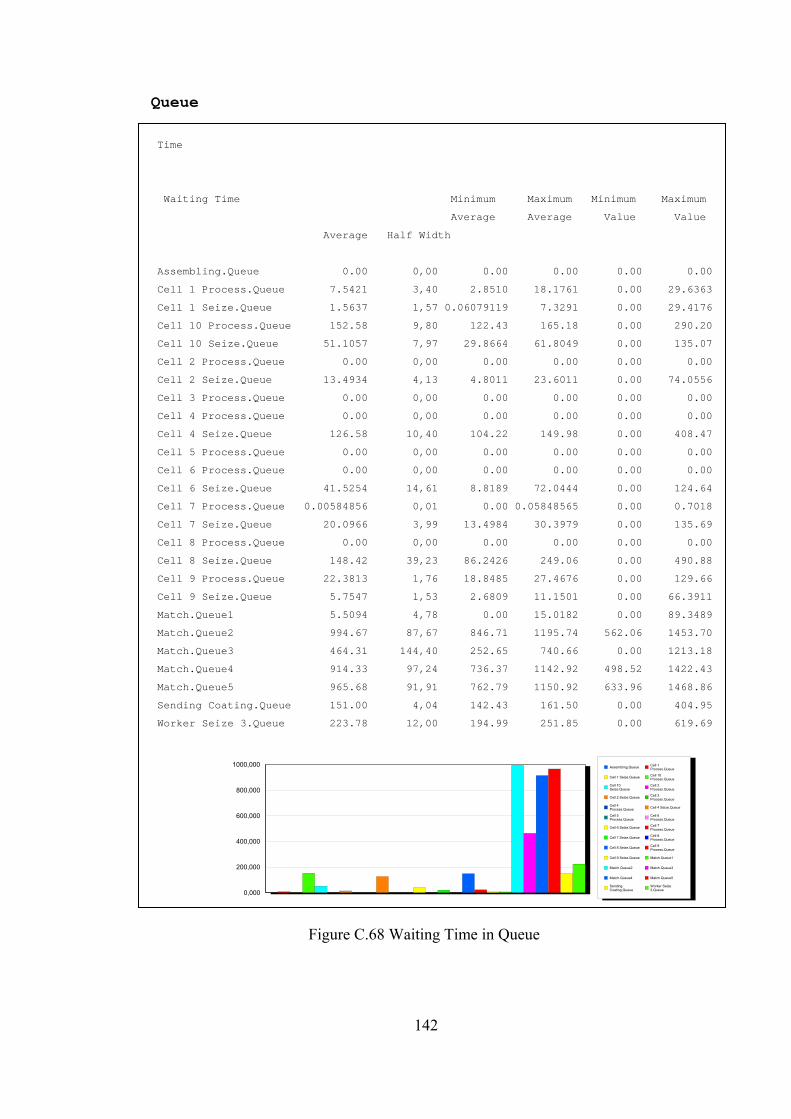
C.68 Waiting Time in Queue ................................................................................. 142
C.69 Number of Busy Status.................................................................................. 143
C.70 Total Number Seized (Resources)................................................................. 144
Page 18
xviii
LIST OF TABLES
TABLE
2.1 Simulation Packages [12]................................................................................... 22
3.1 Statistical Distributions and Their Application Areas [11]................................ 33
4.1 Workers -Processes Table .................................................................................. 43
4.2 Machine Capabilities.......................................................................................... 43
4.3 Process Sequence for Piston Rod (Part 1).......................................................... 49
4.4 Process Sequence for Piston (Part 2). ................................................................ 49
4.5 Process Sequence for Cylinder Barrel (Part 3) .................................................. 49
4.6 Process Sequence for Head End Cap (Part 4) .................................................... 49
4.7 Process Sequence for Cap End Cap (Part 5) ...................................................... 50
4.8 Transfer Time Distributions to Stations for Piston Rod .................................... 50
4.9 Transfer Time Distributions to Stations for Piston ............................................ 50
4.10 Transfer Time Distributions to Stations for Cylinder Barrel ........................... 51
4.11 Transfer Time Distributions to Stations for Head End Cap............................. 51
4.12 Transfer Time Distributions to Stations for Cap End Cap............................... 51
4.13 Resource Names in ARENA®.......................................................................... 55
4.14 Value-Added Time for Entities........................................................................ 59
4.15 Waiting Time for Entities................................................................................. 60
4.16 Transfer Time for Entities................................................................................ 60
4.17 Total Time for Entities ..................................................................................... 61
4.18 Process Times wrt Machines............................................................................ 62
4.19 Comparison between Simulation Results. ....................................................... 64
4.20 Comparison between Simulation Results 2. .................................................... 65
Page 19
1
CHAPTER 1
INTRODUCTION
The globalization of the markets and the worldwide competition, forces the
enterprises to implement new technologies and organize themselves using new
concepts in order to maintain their competitivity.
Apart from being a part of a well organized formation, enterprises will have
no chance to step forward even though they renew themselves. The firm that can not
grow is forced to disappear since it does not comply with the requirements of the
global world market. There are some partnership systems which are used to
overcome these difficulties. The essential one of them is the virtual enterprise
concept. Virtual enterprise concept is a temporary network or strategic alliances of
independent companies or enterprises that can quickly bring together a set of core
competencies to take the advantage of market opportunity.
SMEs (Small-medium size enterprises) seem to be appropriate units for
building this type of temporary alliances when their properties (such as flexibility,
adaptability and agility) are taken into account. In our country, although, almost
every region has industrial manufacturing areas which are composed of many SMEs,
these do not normally involve in big projects, either work as subcontractors of large
companies or order basis or work independently due to some reasons which are
peculiar to our country (economical conditions, resource insufficiencies in
manufacturing technologies, etc.). The IMTRG group in the structure of the ODTU
CIM Laboratory aimed to establish a virtual enterprise system that contains the
SMEs in the OSTIM industrial area in Ankara as to see the applicability of this
concept in Turkey.
Page 20
2
The objective of this thesis is to develop a simulation methodology and to
construct simulation models for Small Medium Size Enterprises (SMEs) for helping
partner selection of VE model. The important factors in selecting a VE member can
be stated as availability, risk, cost and performance. The simulation tool will be
useful in utilizing the resource availabilities of the enterprises, analyzing how the
new work order opportunities might change the system workload to determine the
time constraints that will be assigned for the new project.
A small company which produces hydraulic units was selected as the pilot
company to carry out the study. The company is believed to represent a typical SME
in OSTIM with its properties such as manufacturing policy, size and resource
capability. For simulation modeling of SME, ARENA® simulation tool was used and
its sketch was prepared by using MS Visio. The following sub-sections contain brief
definitions of modeling and simulation. Detailed explanation of the main subjects
can be found in Chapter 2.
1.1 Definition of Modeling
As it is described above, the pilot SME will be modeled and simulated for
different conditions to see how the system will react under different circumstances.
Model and simulation concept will be briefly described, in order to help understand
the objective of this study.
A model is a representation of the construction and working of some system
of interest. It is similar to but simpler than the system it represents. One purpose of a
model is to enable the analyst to predict the effect of changes on the system. On the
one hand, a model should be a close approximation to the real system and
incorporate most of its important features. On the other hand, it should be clear and
easy to comprehend and experiment with it.
Page 21
3
An important issue in modeling is model validity. The real system output
must be similar to the model output. Methodology helps, models to be prepared
similar to real system so that what we learn about the model will be a real reflection
of what we would have learned about the system by playing with it directly.
Models can be classified into two groups.
• Physical (iconic) models
o Tabletop material-handling models
o Mock-ups of fast-food restaurants
o Flight simulators
• Logical (mathematical) models
o Approximations and assumptions about a system’s operation
o Often represented via computer program in appropriate software
o Exercise the program to try things, get results, learn about model
behavior
1.2 Definition of Simulation
A simulation of a system is the operation of a model of the system.
Simulation is a tool to evaluate the performance of a system, existing or proposed,
under different configurations of interest and over long periods of real time. This
property will help users see various results on the computer screen. Since it may be
impossible expensive or impractical to go through the same changes in the system it
represents. Simulation tool is also used for a new system which will be built to help
reduce the chances of failure to meet specifications, eliminate unexpected
bottlenecks, prevent under or over-utilization of resources, and optimize system
performance. Detailed explanation about simulation will be discussed in Chapter 2.
Page 22
4
1.3 Scope
The scope of this study is to develop a simulation methodology for modeling
SMEs and to construct simulation model of a pilot SME. Different experiments were
done on this sample model and response of the system was observed statistically. As
it is mentioned above, these results will be used in partner determination part of the
VE model.
1.4 Outline
In Chapter 2, detailed explanations of Virtual Enterprise concept, definition
and advantages of simulation modeling topics can be found. In Chapter 3,
“Simulation Methodology for SME” topic was studied. In Chapter 4, application for
this methodology at a pilot SME was studied and experimental simulation runs were
analyzed and discussed in Chapter 5.
Page 23
5
CHAPTER 2
LITERATURE SURVEY
In this chapter the related literature and the historical background for Virtual
Enterprise evolution will be presented. Literature on simulation and modeling of
manufacturing systems, available tools, and the methodology will also be discussed
in this chapter.
2.1 Development of VE Concept
In the beginning of 20th century, Henry Ford introduced the revolutionary
concept of “Mass Production”. The main idea of this concept was to produce the
same product in large scale and perfecting the skills of laborers on a particular job by
means of division of labor. For many years, this paradigm was widely accepted and
implemented, but in last decades it could not respond to the challenges of modern,
dynamic and worldwide business. The mass production concept can no longer fulfill
the demanding but many times contradicting requirements of the new world order,
which aims reducing prices and costs but yet increasing product quality, production
rate and offering diversity of products. Nowadays, each product has several models
and even each model can be highly customized according to the liking of customers
at affordable prices. This could only be possible by means of new manufacturing
systems and technologies developed by merging the good sides of job-shop with
those of mass production through the use of flexible automation and the information
technologies, in an integrated manner. The companies are now obliged to adapt to
this manufacturing era in order to survive.
Page 24
6
In the 80s, Japanese companies introduced a new paradigm, called Lean
Manufacturing. The main idea of this concept was to shorten the time line between
the customer order and shipment, by eliminating waste. The Elimination of waste
process was achieved through;
• Less time to design
• Less inventory
• Less defects
• Reduction of setups, etc.
Lean Manufacturing is an extension of “Just in Time” concept, which consists
in having the right material at right place at right time, eliminating stocks, and using
very simple control and scheduling systems. The three main areas in Lean
Manufacturing are [1]:
• Manufacturing management excellence,
• Organizational learning,
• Principles and practices of lean manufacturing.
The USA responds to this paradigm by the Agile Manufacturing. Agile
Manufacturing is the ability to adapt quickly and profitably to continuous and
unexpected changes in the manufacturing environment. Agile Manufacturing has
been expressed as having four underlying principles:
• Delivery of value to the customer;
• Ability to react to changes;
• Value of human knowledge and skills
• Ability to constitute virtual partnerships.
Page 25
7
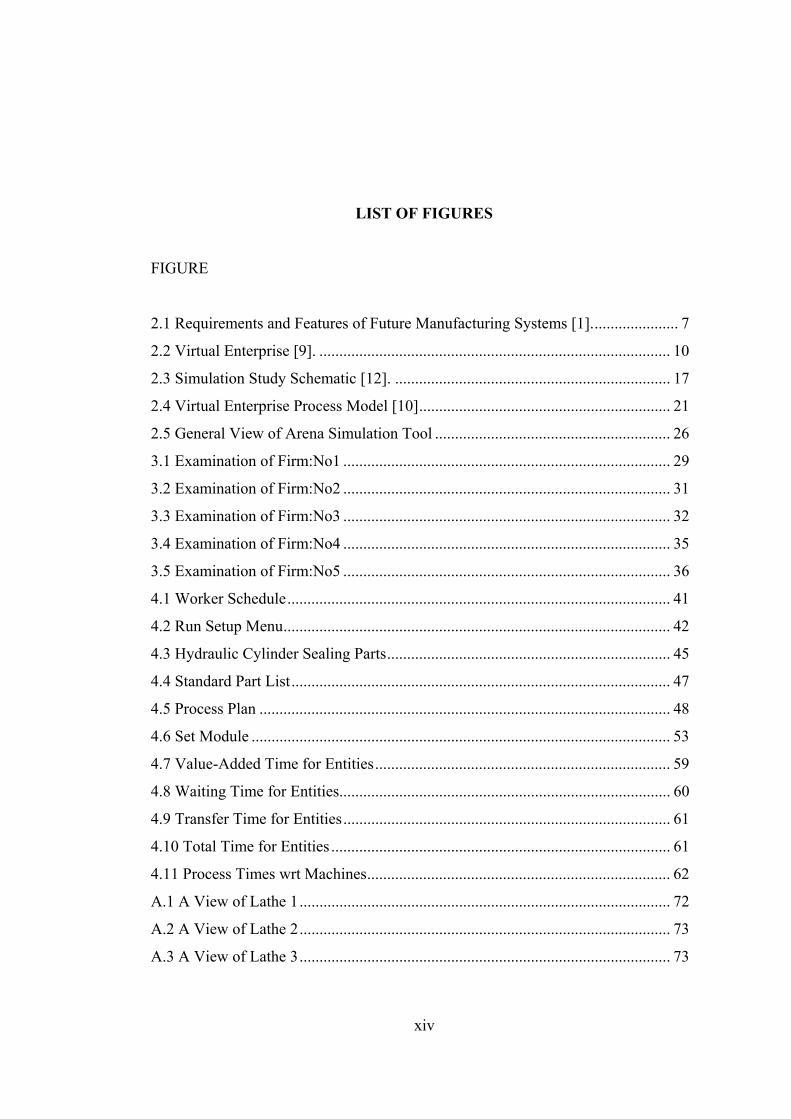
The first three principles can be found in lean manufacturing too but the forth
principle makes the difference between Lean and Agile Manufacturing. In Agile
Manufacturing the companies make temporary alliances with other companies, even
competitors, to react to unexpected situations, with mutual benefits for all companies
[1].
Customer Requirements Manufacturing Control System Features
Consumer needswill change rapidly
Reduction ofproducts life cycle
Products features:Better quality,
Faster deliver time,More diversity,Lower prices...
World wide marketcompetition
Integration of humanoperators in automated
control systems.
Decentralised manufacturingsystems, such as virtualenterprises and multisite.
Modular design allowingfaster and easier integration
of legacy systems.
Autonomous andcooperative decision making
entities.
Scalability, extendability,adaptability, reliability.
Next Generation ofthe Manufacturing
Systems
Figure 2.1 Requirements and Features of Future Manufacturing Systems [1].
The concept of virtual enterprise was actually born in the late 1800s. In the
late 1800s, firms were organized along functional lines often referred to as unitary
form or (U-form) organizations. The principal operating units in the U-form firm are
the functional divisions (e.g. sales, finance, manufacturing, etc.). Faced with the
types of internal operating problems that emerge as the U-form enterprise increases
in size and complexity, to achieve these difficulties the multidivisional (M-form)
Page 26
8
structure was devised in the early 1920s. This organizational innovation involved
substituting quasi-autonomous operating divisions (organized mainly along product,
brand, or geographic lines for the functional divisions) of the U-form structure as the
principal basis for dividing up the task and assigning responsibility. Each of these
operating divisions is subsequently divided along functional lines; one might
characterize these operating divisions as scaled down, specialized U-form structures
[2].
Today, the worldwide market competition implies that manufacturing
enterprises can no longer be seen acting stand-alone. They must react to customer
demands promptly and properly. Virtual Enterprise concept (V-form) strives with the
hope for achieving these objectives. In many cases it is replacing the M-form
structure, just as the M-form structure replaced the U-form structure, because of the
need for firms to remain competitive under given environmental changes. Several
factors are driving businesses to adopt the virtual organizational structure. First, the
pace of business is continually increasing with shorter product life cycles requiring
quicker response to market opportunities. Second, the cost of market entry is often
lower than the previous one, especially in the information services and other
technology-driven industries. Third, corporations are now driven more by customer
demands than by internal needs. And finally, there is an increased need for
globalization to remain competitive [3]. Properties of VE structure and its advantages
are described in the sub-section below.
In literature, Virtual Enterprise concept is defined in various ways;
“A Virtual Enterprise is an organization fundamentally customer-oriented
which accomplish the customer needs in a particular way and which is extremely
time and cost effective [4].”
Page 27
9
“A Virtual Corporation is a temporary network of independent companies –
suppliers, customers, even rivals – linked by information technology (IT) to share
skills, costs and access to one another’s markets. It will have neither central office
nor organization chart. It will have no hierarchy, no vertical integration [5].”
“Virtual corporates are fluid, on-line partnerships comprised of the best
practices from various companies that bring together their individual core
competencies to create a new product or service during a market window of
opportunity. Once the life cycle of the product or service ends, they will separate and
go about their businesses [6].”
“A Virtual Enterprise is not really different from a traditional enterprise other
than the fact that it can append and shed processes quickly. There are more legal
regulatory issues than technical issues when removing barriers to virtual enterprise
operations [7].”
Page 28
10
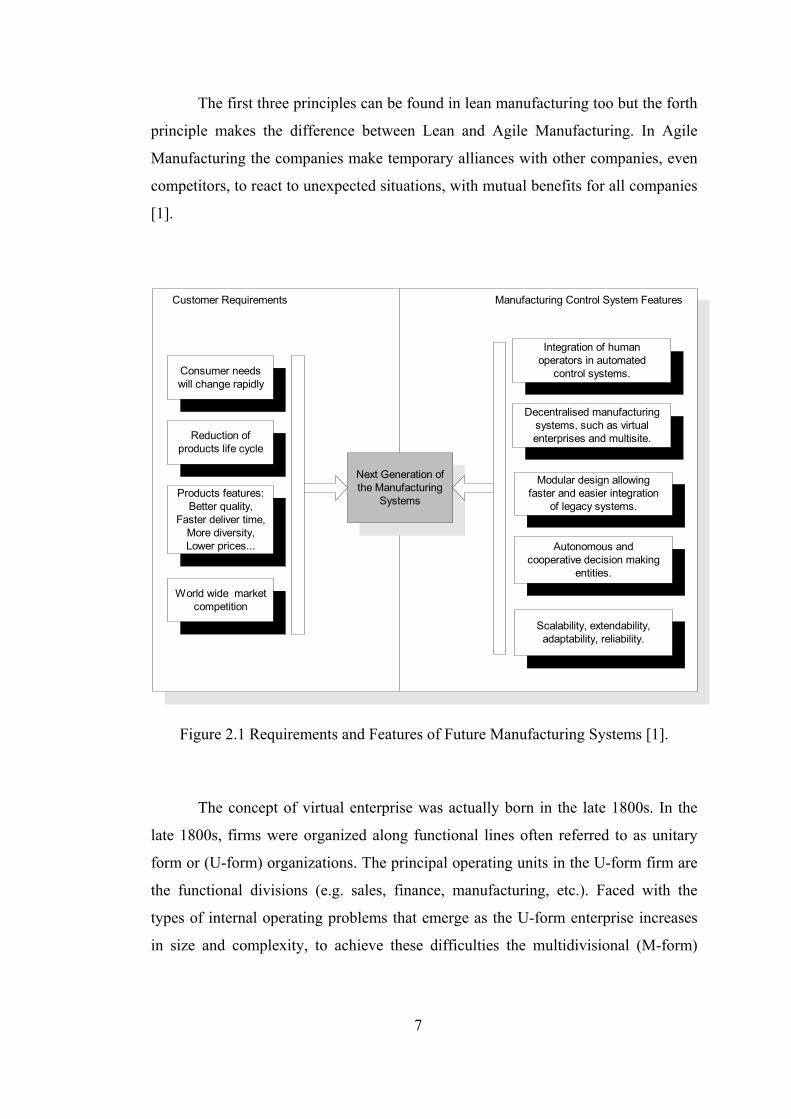
Figure 2.2 Virtual Enterprise [9].
Briefly, Virtual Enterprise concept is a paradigm that can be defined as a
temporary alliance of enterprises that come together to share skills and resources in
order to better respond to business opportunities and whose co-operation is supported
by computer networks [8]. The term Virtual Enterprise is to indicate that in spite of
having all the attributes of an enterprise, it would not be a permanent organization.
A joint venture, for instance, is a type of Virtual Enterprise; where some enterprises
group together in order to achieve a particular and common goal.
Today, large companies usually form partnerships with smaller firms. The
smaller companies become subcontractors to the larger companies; they routinely
and continually supply the same items and conduct the same duties for the same
firms. These kinds of partnerships are known as production networks. The main
Page 29
11
difference between production network and virtual enterprise concepts can be
clarified by giving the Boeing Company example. Boeing Company designs,
assembles and markets the aircraft, while an international network of suppliers
makes the components. This is a typical example for production network because
Boeing generally uses the same partner for the same job. But in the virtual enterprise
concept, the firms and jobs are totally changed by new projects. The partner firms are
selected from the developed network by examining the availability, risk, cost and
performance analysis of each of them.
2.2 Properties of Virtual Enterprise Concept
VE has some important properties and behaviors which distinguish it from
other operating systems. Firstly, VE organization can be defined as flexible,
adaptable and agile. Actually these properties belong to SMEs. VE organizations are
generally working with SMEs because of their properties. With more details, it can
be expressed as SMEs has less level of bureaucracy, which allows the inter-firm
alliance to react more quickly. Moreover, these firms will be more specialized in a
particular task. For example, two smaller firms specializing in manufacturing and
distribution may be better at these separate tasks than one large firm that attempts to
do both. Agility can be defined as giving quick response to customer orders. In order
to give better responses to customer orders, VE should have adequate number of
members. Firms can be added to or removed from the system in a dynamic way. This
is called flexibility. Besides this, ability to create new branches shows the system
flexibility in job breeding. If any firm gives up the job which is initially assigned,
system should search and find another firm which will be suitable for the job left
undone. This property shows system adaptability.
Secondly, resource (including money, technology, labor, etc.) capacity of VE
organization must be stated. VEs resource capacity can be defined as infinite. By the
help of partner firms, VE structure will have high production variety. In this way, VE
can overcome difficulties in dealing with different types of works effectively through
Page 30
12
the desired conditions. It is clearly seen that resource capability of VE structure is
always better than those of individual companies.
Thirdly, VE allows partner firms to concentrate on their core competence. In
fact, these core competencies are the reason why firms would be chosen as partners.
As companies of the past learned the value of specialization of labor, virtual
organization partnerships improve efficiency and effectiveness through firm
specialization. This specialization may result in a synergistic situation where the
overall alliance has much better performance than the sum of the individual partner’s
separate performances. Various combinations of firms may be uniquely suited to
working together.
Finally, the VE organizations give an advantage to SMEs for globalization.
Firms that want to take advantage of a global market opportunity can ally themselves
with a firm that has expertise or market share in a given region or country. Most of
the advantages of virtual organizations come from their ability to modularize. A
modular organization is one in which embedded coordination permits organizational
processes to be carried out within a loosely-coupled organization structure in which
each participating organizational unit can function autonomously and concurrently. It
has been suggested that a modular organization structure would have a superior
ability to quickly link together the resources and capabilities of many organizations
to form product development ‘resource chains’ that can respond flexibly. It is clear
that VEs attempt to incorporate many of the principles of modular organizations.
2.3 Review of Virtual Enterprise Concept
As a result, there are several reasons for choosing the VE structure. This
concept has some revolutionary properties which change the ordinary company to a
globally developed one.
The four advantages which are explained above make the virtual enterprise
structure a viable and powerful choice for many companies. Although the concept
Page 31
13
has several advantages, the result of internet searches shows that there is no VE
organization implemented in Turkish industry. SMEs rarely come together to share
skills and resources. Firms have insufficient technology and management structure in
Turkey. Mostly because they don’t want to leave their traditional manufacturing
process and they are scared of entering the global market.
In Ankara OSTIM, the management wants to improve the member SMEs by
finding them new job opportunities. But it is clearly seen that their limited capability
has hindered the implementation of VE concept effectively. The IMTRG group in the
structure of the ODTU CIM Laboratory has aimed at establishing a Virtual
Enterprise system that contains the SMEs in OSTIM industrial area in Ankara as to
see the applicability of this concept in Turkey.
2.4 Modeling
In this thesis, the simulation tool will be tested during the VE partner
selection. After a brief explanation of the VE concept, it might be helpful to clarify
the terms of modeling and simulation. Modeling is the process of producing a model;
a model is a representation of the construction and working of some system of
interest. A model is similar to, but simpler than the system it represents. A purpose of
a model is to enable the analyst to predict the effect of changes to the system. On the
one hand, a model should be a close approximation to the real system and
incorporate most of its salient features. On the other hand, it should not be so
complex that it is impossible to understand and experiment with it. A perfect model
will be a judicious tradeoff between realism and simplicity. An important issue in
modeling is the model validity. Model validation techniques include simulating the
model under known input conditions and comparing model output with system
output. Generally, a model intended for a simulation study is a mathematical model
developed with the help of simulation software. Types of models can be specified
into two groups. They are physical (iconic) and logical (or mathematical) models
[11]. In physical (iconic) models, the modeler makes a physical replica or scale
model of the system. For example, miniature versions of the facility, simulated
Page 32
14
control, physical flight simulators etc. A logical model is usually represented in a
computer program that is exercised to address questions about the model's behavior.
If a model is a valid representation of a system, system's behavior will be learned,
too.
2.4.1 System to be modeled
As described above computer simulation deals with models of systems. A
system is a facility or process, either actual or planned, such as [11]:
• A manufacturing plant with machines, people, transport devices, conveyor
belts, and storage space.
• A bank or other personal-service operation, with different kinds of customers,
servers, and facilities like teller windows, automated teller machines (ATMs),
loan desks, and safety deposit boxes.
• A distribution network of plants, warehouses, and transportation links.
• An emergency facility in a hospital, including personnel, rooms, equipment,
supplies, and patient transport.
• A field service operation for appliances or office equipment, with potential
customers scattered across a geographic area, service technicians with
different qualifications, trucks with different parts and tools, and a central
depot and dispatch center.
• A computer network with servers, clients, disk drives, tape drives, printers,
networking capabilities, and operators.
• A freeway system of road segments, interchanges, controls, and traffic.
• A central insurance claims office where a lot of paperwork is received,
reviewed, copied, filed, and mailed by people and machines.
• A criminal justice system of courts, judges, support staff, probation officers,
parole agents, defendants, plaintiffs, convicted offenders, and schedules.
• A chemical products plant with storage tanks, pipelines, reactor vessels, and
railway tanker cars in which to ship the finished product.
Page 33
15
• A fast-food restaurant with workers of different types, customers, equipment,
and supplies.
• A supermarket with inventory control, checkout, and customer service.
• A theme park with rides, stores, restaurants, workers, guests, and parking lots.
• The response of emergency personnel to the occurrence of a catastrophic
event.
This thesis will emphasize the manufacturing area of simulation. This is an
area in which people often study a system to measure its performance, improve its
operation, or design if the system doesn't exist. Managers or controllers of a system
might also like to have a readily available aid for day-to-day operations, such as help
in deciding what to do in a factory if an important machine goes down [11]. Often
simulation analysts find that the process of defining how the system works, which
must be done before one can start developing the simulation model, provides great
insight into what changes need to be made.
2.5 Simulation
A simulation of a system is the operation of a model of the system. The
model can be reconfigured and experimented with; usually, this is impossible, too
expensive or impractical to do in the system it represents. Simulation is a tool to
evaluate the performance of a system, existing or proposed, under different
configurations of interest and over long periods of real time. Simulation is used
before an existing system is altered or a new system built, to reduce the chances of
failure to meet specifications, to eliminate unforeseen bottlenecks, to prevent under
or over-utilization of resources, and to optimize system performance [12].
In the late 1950s and 1960s, simulation was a very expensive and specialized
tool that was generally used only by large corporations that required large capital
investments. Typical simulation users were found in steel and aerospace industry.
Only specialized persons like Ph.D.s, who would develop large, complex simulation
Page 34
16
models using available languages, such as FORTRAN, would use simulation tools.
The use of simulation as we know it today began during the 1970s and early 1980s
[12]. Computers were becoming faster and cheaper, and the value of simulation was
being discovered by other industries. However, simulation was seldom considered
until there was a problem (bottleneck) in manufacturing line. It became the tool of
choice for many companies, notably in the automotive and heavy industries, for
determining why the problem occurred. By using simulation tool companies had
performed a good sensitivity analysis on these questionable data and the problem had
been uncovered and resolved well before implementation. Meanwhile, simulation
also found a home in academia as a standard part of industrial engineering and
operations research area. By the end of the 1980s, the value of simulation was
recognized by many larger firms. However, it was still not in widespread use and
was rarely used by smaller firms. Simulation really began to mature during the 1990s
[12]. Better animations, ease of use, faster computers and easy integration with other
packages have all helped simulations become a standard tool in many companies.
Simulation model can be classified as deterministic (input and output
variables are fixed values) or stochastic (at least one of the input or output variables
is probabilistic); static (time is not taken into account) or dynamic (time-varying
interactions among variables are taken into account); discrete system (state
variable(s) change only at a discrete set of points in time) or continuous system (state
variable(s) change continuously or smoothly over time). Typically, simulation
models are discrete system, stochastic and dynamic. Discrete event simulation can be
defined as a less detailed system (coarser in its smallest time unit) but it is much
simpler to implement, and hence, is used in a wide variety of situations.
In a simulation study, human decision making is required at all stages,
namely, model development, experiment design, output analysis, conclusion
formulation, and making decisions to alter the system under study. The only stage
where human intervention is not required is the running of the simulations, which
most simulation software packages perform efficiently.
Page 35
17
SystemUnderStudy
AlteredSystem
SimulationModel
SimulationExperiment
SimulationAnalysis
Conclusions
Real World Simulation Study
Figure 2.3 Simulation Study Schematic [12].
Briefly, steps involved in developing a simulation model, can be explained
designing a simulation experiment, and performing simulation analysis [12]: Identify
the problem, determine the objectives and overall project plan, collect and process
real system data, formulate and develop a model, validate the model, select
appropriate experimental design, establish experimental conditions for runs and
perform simulation runs, documentation and reporting and implementation.
Although this is a logical ordering of steps in a simulation study, additional
steps at various sub-stages may be required before the objectives of a simulation
study are achieved. Also not all the steps may be possible or required. The modified
methodology for modeling SMEs -objective of thesis- will be discussed in following
chapter.
Page 36
18
2.5.1 Benefits of Simulation Modeling and Analysis
Simulation modeling and analysis is one of the most frequently used
operations research techniques. When used judiciously, simulation modeling and
analysis makes it possible to [12]:
• Obtain a better understanding of the system by developing a mathematical
model of a system of interest, and observing the system's operation in detail
over long periods of time.
• Study the internal interactions of a complex (sub)-system.
• Test hypotheses about the system for feasibility.
• Compress time to observe certain task over long periods or expand time to
observe a complex task in detail.
• Study the effects of certain informational, organizational, environmental and
policy changes on the operation of a system by altering the system's model;
this can be done without disrupting the real system and significantly reduces
the risk of experimenting with the real system.
• Allow training & learning at a lower cost.
• Experiment with new or unknown situations about which only weak
information is available.
• Identify bottlenecks of system (material, people, etc.)
• Improve system through model building.
• Use multiple performance metrics for analyzing system configurations.
• Understand & verify analytic solutions.
• Employ a systems approach to problem solving.
• Visualize operations through animation.
• Develop well designed and robust systems and reduce system development
time.
Page 37
19
2.5.2 Disadvantages of Simulation
Despite its advantages, simulation may not be a perfect tool for system
analysis. This is because many real systems are affected by uncontrollable and
random inputs, many simulation models involve random, or stochastic, input
components, causing their output to be random too. Although modelers think
carefully about designing and analyzing simulation experiments, simulation output
may still be uncertain. This uncertainty might be solved by making a lot of over-
simplifying assumptions about the system. Unfortunately, though, such an over-
simplified model will probably not be a valid representation of the system. In
general, modelers would prefer an approximate answer to the right problem rather
than an exact answer to the wrong problem.
2.5.3 Pitfalls to Guard against in Simulation
Simulation can be a time consuming and complex exercise, from modeling
through output analysis that necessitates the involvement of experts and decision
makers in the entire process. Following is a checklist of pitfalls to guard against [12].
• Unclear objective.
• Using simulation when an analytic solution is appropriate.
• Invalid model.
• Simulation model too complex or too simple.
• Erroneous assumptions.
• Undocumented assumptions. This is extremely important and it is strongly
suggested that assumptions made at each stage of the simulation modeling
and analysis exercise be documented thoroughly.
• Using the wrong input probability distribution.
• Replacing a distribution (stochastic) by its mean (deterministic).
• Using the wrong performance measure.
• Bugs in the simulation program.
Page 38
20
• Using standard statistical formulas that assume independence in simulation
output analysis.
• Initial bias in output data.
• Making one simulation run for a configuration.
• Poor schedule and budget planning.
• Poor communication among the personnel involved in the simulation study.
2.6 Usage of Simulation Tool under VE System.
The simulation tool is generally used in system utilization and optimization in
the manufacturing area. By the help of this tool, the bottlenecks that take place in the
modeling companies can easily be reflected both statistically and visually to the user.
These developed models can work in the preferred simulation parameters and the
responses that it gives on various work loads can be indicated. Because of these
mentioned advantages, this thesis will test whether the simulation tool will or will
not be used in the selection of the VE partner.
As it is seen clearly, “VE partner selection” is a great research subject on its
own. With a brief explanation, the partner selection is done by the VE management
in terms of the risk, cost, performance and availability analysis. In this analysis, VE
management unit gives grades to these properties with respect to their goals. After
this determination, some calculation steps are done and the closest SMEs with
respect to the management’s goal will be chosen. The literature survey revealed that
the simulation tool wasn’t used in this type of analysis. Chapter 4 will focus on the
testing of the positive sides of the simulation tool in SME analysis.
In this work it is aimed to develop a simulation methodology and to construct
simulation models for Small Medium Size Enterprises (SMEs) for helping the SME
selection of the VE model. The reason for the usage of the simulation tool is to get
realistic statistical results which are used in the selection part of the general model
(Figure 2.4).
Page 39
21
Figure 2.4 Virtual Enterprise Process Model [10]
Page 40
22
2.7 Selection of Simulation Software
The two types of simulation packages are simulation languages and
application-oriented simulators (Table 2.1). Simulation languages offer more
flexibility than the application-oriented simulators. On the other hand, languages
require varying amounts of programming expertise. Application-oriented simulators
are easier to learn and have modeling constructs closely related to the application.
Most simulation packages incorporate animation which is excellent for
communication and can be used to debug the simulation program; a "correct
looking" animation, however, is not a guarantee of a valid model. More importantly,
animation is not a substitute for output analysis.
Table 2.1 Simulation Packages [12].
Type Of Simulation Package Examples
Simulation
languages
Arena (previously SIMAN), AweSim! (previously SLAM II),
Extend, GPSS, Micro Saint, SIMSCRIPT, SLX Object-oriented
software: MODSIM III, SIMPLE++ Animation software: Proof
Animation
Application-Oriented
Simulators
Manufacturing: AutoMod, Extend+MFG, FACTOR/AIM,
ManSim/X, MP$IM, ProModel, QUEST, Taylor II, WITNESS
Communications/computer: COMNET III, NETWORK II.5,
OPNET Modeler, OPNET Planner, SES/Strategizer,
SES/workbench Business: BP$IM, Extend+BPR, ProcessModel,
ServiceModel, SIMPROCESS, Time machine Health Care:
MedModel
Page 41
23
Although statistics seem to be more important than animation, animation
property is indispensable for modeler too. Entities and resources can be easily traced
by modeler. First of all, simulation tool should be selected by modeler. When all data
implement into selected program “a simulation model” will be formed.. In this study,
ARENA® Simulation Tool was used to develop the model. This tool was selected
because of its distinct properties which are explained below.
2.7.1 ARENA®
The Arena modeling system from Systems Modeling Corporation is a flexible
and powerful tool that allows analysts to create animated simulation models that
accurately represent virtually any system. First released in 1993, Arena employs an
object - oriented design for entirely graphical model development. Simulation
analysts place graphical objects, called modules, on a layout in order to define
system components such as machines, operators, and material handling devices.
Arena is built on the SIMAN simulation language. After creating a simulation model
graphically, Arena automatically generates the underlying SIMAN model used to
perform simulation runs [13].
2.7.2 SIMAN
The core technology of Arena is the SIMAN simulation language. The
modules contained in the Arena template were created using SIMAN’s modeling
blocks as their components. SIMAN blocks are made available to all Arena users in
the SIMAN template. SIMAN modules provide the user with increased flexibility
and increased control of detailed system logic. Those users who have become
accustomed to writing SIMAN code directly in a text editor are able to do so within
Arena. In this case, Arena provides an option for directly recognizing this code,
which is contained in a file external to the Arena graphical modeling environment
[13].
Page 42
24
2.7.3 ARENA® Template
The Arena template is the core collection of more than 60 modules provided
as part of the general Arena system. It was designed to provide a general-purpose
collection of modeling features for all types of applications. In addition to providing
core features for resources, queuing, inspection, system logic, and external file
interface, the Arena template provides modules specifically focused on specific
aspects of manufacturing and material handling. For manufacturing, it contains
modules that incorporate such features as machine downtime and maintenance
schedules. For material handling applications, modules exist for representing
conveyors (synchronous and asynchronous) and various types of transportation
devices. Three panels compose the Arena template: the Common panel, containing
modules representing fundamental simulation processes such as arrivals, service, and
departures; the Support panel, containing supplemental modules for specific actions
and decision logic; and the Transfer panel, whose modules are used to model the
transfer (or flow) of entities through the system. In order to develop a simulation
model using the Arena template, the user simply picks a module, places it in the
model, and then is prompted for the necessary information. For example, when
placing the Server module from the Arena template, the user is asked for such
information as how long entities spend at the server, the server’s operating schedule,
and where entities should go. After responding with the appropriate information, the
user closes the dialog to accept the completed module. Animation is automatically
included with many of the modules in the Arena template. Graphics symbols that are
automatically provided when placing a module from the Arena template can be
changed with Arena’s built-in graphics tools (similar to CAD systems) or can be
replaced with icons from Arena’s symbol library or from external applications (e.g.,
clip art , M.S Visio) [13].
Page 43
25
2.7.4 Animation in ARENA®
Arena animations can be run concurrently with the executing simulation
model. Animations can be created in several ways: they can be created entirely using
Arena’s graphics drawing tools, they can be created from AutoCAD or other .DXF
file formats, they can be created in other tools and imported to Arena via Active X
(formerly known as OLE), they can be created by using other Windows®-compliant
drawing systems that can be pasted into Arena layouts, or any combination of the
above. Arena’s drawing tools include all standard CAD objects (e.g., rectangle,
ellipse, arc, text, etc.) and provide virtually unlimited color selection. Arena’s
interface with .DXF file formats was developed to allow for a direct import of CAD
drawings to provide the animation background and dynamic icons. Arena includes
various animation options for real time display of model statistics. For example, the
user can place dynamic plots, histograms, levels, and time clocks directly within a
simulation in order to illustrate system status as the model performs [13].
2.7.5 Flowchart Model Development in ARENA®
Arena was designed to make creating simulation models an entirely graphical
process. All system behaviors are represented by using the graphical modules
described above. For system logic such as IF/THEN/ELSE-type branching and queue
selection rules, the user creates a flowchart of his/her system by placing the
appropriate graphical modules on the Arena layout and directly connecting these
modules [13].
Page 44
26
Figure 2.5 General View of Arena Simulation Tool
Page 45
27
2.7.6 Integration via ActiveX, DAO and ODBC
Arena is a Microsoft® Windows® 95, 98, Me, XP and Windows® NT
compliant product. The entire product was developed using Microsoft’s Foundation
Classes (MFC) and is written in object-oriented Visual C++™. Arena is also
Microsoft® Office compliant that means that it utilizes all of the standard user
interface options (e.g., toolbar buttons, function keys, etc.) that are in use in all
Microsoft® Office products. Arena’s support of Active X (formerly known as OLE)
allows the user to embed other technologies such as Excel® spreadsheets,
Microsoft® Word files, clipart, and Microsoft® PowerPoint® presentations within
simulation models. Arena’s support of DAO (Data Access Objects) and ODBC
(Open Database Connectivity) allows the user to integrate all database systems that
are compliant with Microsoft’s ODBC standard. Model data contained in products
like FoxPro® database, Excel®, Oracle®, Informix®, and many others can easily be
read into an Arena model without taking the time to enter it manually [13].
Page 46
28
CHAPTER 3
METHODOLOGY FOR SIMULATION MODELING
OF SMEs WITH ARENA®
3.1 Overview
In this chapter, the simulation methodology (the process of applying the
simulation technique) issue will be described step by step to simulate real
manufacturing companies by the ARENA® simulation tool. Many papers have
appeared in the past on the simulation methodology. These papers include only
necessary steps for the general simulation methodology. These generally accepted
steps for a simulation study can be listed as the following;
• Identify the problem.
• Determine the objectives and overall project plan.
• Collect and process real system data.
• Formulate and develop a model.
• Validate the model.
• Select appropriate experimental design.
• Establish experimental conditions for runs and perform simulation runs.
• Documentation and reporting.
• Implementation.
In this thesis, this general simulation methodology is adapted for studying
SMEs as part of a Virtual Enterprise. With the help of prepared methodology
simulation modeling of SMEs is becoming an easy task for modeler. The required
Page 47
29
steps to follow for modeling SMEs will be explained in detail in the following
sections.
3.2 Collecting General System (Company Properties) Data
The main issue for this study can be stated as finding the most appropriate
firm(s) to fulfill a defined manufacturing task. To achieve this objective, firstly
candidate SMEs should be modeled with their current work load. Then new
manufacturing tasks will be experimented in the developed model. To construct the
model, steps which are explained below will be followed by the modeler. Before
starting to collect real system data (process data), the identification tag of the
company (name of the company), its location (address of the company), activity
domain (activity field of the firm), its size and work hour should be defined by the
modeler.
Figure 3.1 Examination of Firm:No1
Page 48
30
To get realistic and accurate results, the model must be successfully
developed. Model development job can be divided into two main parts. One of them
is blocks/modules section which is programming part of tool and the other one is
animation part where animation of simulation is shown. (Figure 2.5) after
determination of main properties of firm the functional description of the system's
components and their interactions with incoming jobs should be created. To achieve
this objective some essential data must be collected. These collected data will be
used for either programming part or animation part of the model. Steps that modeler
should follow for collecting data are;
• Determination of Simulation Parameters: Worker schedule
• Identification of Resource (labor and machine) Capabilities of the Firm: The
resource list must be prepared. Specialization of the workers and machine
types should be written in this list. In this country, because of economical
disadvantages, SMEs occasionally prefer workers who are specialized in
different machines. Because of this disadvantage modeler should pay
attention while collecting the properties of workers. By collected data,
entities should be seized according to related worker before machining.
• Examination of Machines and Machining Sequences of the Parts: The data
about machines give information to the modeler about sequencing rule for
machining.
• Preparation of the Sketch: Sketch of the firm must be drawn as exactly the
same. This sketch will be used for background of the animation. Arena allows
the user to embed MS VISIO® or AutoCAD® sketches within simulation
models.
Page 49
31
Figure 3.2 Examination of Firm:No2
Page 50
32
Figure 3.3 Examination of Firm:No3
3.3 Collecting and Processing Real System (Shop-Floor) Data
In this step, essential minority and a trivial majority which mainly determine
system behavior should be identified. Data preparation should be organized very
carefully in this step. A well known simulation principle is “Garbage In – Garbage
Out”, which means that even a well developed model could not produce close-to-
reality results, if its input data differ from what is present in reality. Statistical
considerations should be taken into account, when describing random factors, e.g.,
random variables. Also this step includes types of probability distributions which are
used to describe random input variables. The items that should be done step by step
while collecting data are the following in sequence;
Page 51
33
• Type of entity and its process cycle should be described.
• Parts of entity and their process sequences should be determined.
o Part List Table should be prepared.
o Process Plan should be analyzed. (Prepared by Flowchart)
• Machining times and input distributions should be determined: The SMEs in
Turkey usually don’t have archives of the business they had, the production
times and product sales. Because of these disadvantages, machining times
should be obtained from operators. Generally exact process time could not be
taken from operators but using different distribution formulas, this difficulty
could be handled. There are different kinds of statistical distribution types
which are used by Arena. General usage of statistical distribution can be
summarized in Table 3.4;
Table 3.1 Statistical Distributions and Their Application Areas [11].
Distributions Applications
Beta
Because of its ability to take on a wide variety of shapes, this
distribution is often used as rough model in the absence of
data.
Continuous
This distribution can be used as an alternative to a theoretical
distribution that has been fitted to the data, such as in data
that have a multimodal profile or where there are significant
outliers.
Discrete
This distribution is frequently used for discrete assignments
such as the job type, the visitation sequence, or the batch
size for arriving entity
Erlang
The Erlang distribution is used in situations in which an
activity occurs in successive phases and each phase has an
exponential distribution.
Exponential
This distribution is often used to model inter-event times in
random arrival and break-down process but it is generally
inappropriate for modeling process delay times.
Page 52
34
Gamma
The gamma is often used to represent the time required to
complete some task (e.g. a machining time or machine repair
time).
Lognormal
The lognormal distribution is used in situations in which the
quantity is the product of a large number of random
quantities. It is also frequently used to represent task times
that have a distribution skewed to the right.
Normal
The normal distribution is used in situations in which the
central limit theorem applies (i.e. quantities that are sums of
other quantities.) because the theoretical range is from -∞ to
+∞, the distribution should not be used for positive quantities
like processing times.
Poison
The Poisson distribution is a discrete distribution that is often
used to model the number of random events occurring in a
fixed interval of time. If the time between successive events is
exponentially distributed, than the number of events that
occur in a fixed time interval has a Poisson distribution.
Triangular
The triangular distribution is commonly used in situations in
which the exact form of the distribution is not known, but
estimates (or guesses) for the minimum, maximum, and most
likely are available. The triangular distribution is easier to use
and explain than other distributions that may be used in this
situation (e.g. the beta, gamma, etc., distribution.)
Uniform
The uniform distribution is used when all values over a finite
range are considered to be equally likely. The uniform
distribution has a larger variance than the other distributions
that are used when information is lacking.
Weibull
The Weibull distribution is widely used in reliability models to
represent the lifetime of a device. This distribution is also
used to represent non-negative task times that are skewed to
the left.
Page 53
35
Figure 3.4 Examination of Firm:No4
• Also arrival times, transfer times between machines, setup times and working
hours should be taken into account by the modeler. Number of hand lifts and
overhead cranes should be determined.
Page 54
36
Figure 3.5 Examination of Firm:No5
3.4 Formulate and Develop a Model
In this step, first of all software program should be selected by modeler.
When all data implement into selected program “a simulation model” will be formed.
A choice between using simulation packages and application-oriented simulators
should be made at this stage.
3.5 Verification & Validation
Verification means checking if the developed program indeed realizes the
operational algorithm of the simulated system. At this stage the modeler should
justify if the developed model operates as the original system does. Validation is the
second stage (after verification) where the developed model is checked for adequate
Page 55
37
presenting of the modeled system. In this case operation of the model is compared
with that of the modeled system. By testing model with probability distributions
(random input variables), the question if the developed model operates as the original
system does should be answered. A positive answer to that question would mean that
simulation results indeed reflect operation of the modeled system in a corresponding
situation. Comparison between real system’s response and simulation model’s
response will help the modeler to see if the simulation run is valid or not.
As it was mentioned in the first step, modeler must collect the historical data
(machining times, production sales, etc.) about SME. Validation and verification
analysis should be only done by making comparison between old data or known data
and experimental results. Old data could be taken from operators in this situation.
Modeler can also collect his/her own data (machining times) by using chronometer
for production of specific entity.
3.6 Establish Experimental Conditions for Model
Experiments are performed on the simulation at this stage in accordance with
the developed plans. Experimental models can be defined as the running conditions
of a simulation model. The Modeler will control the model with intended situations.
These situations can be changed according to the utilization of resources or
foreseeing the future of manufacturing the desired product. In this study, the main
objective of using the simulation tool was to determine the suitable partner for the
VE model. Work load utilization is an important issue while selecting a partner for
VE. While getting information about the partner SME, Super Management of VE
Department would want to see the responses of the company to the different
situations. To see the effect of different scenarios some experiments must be applied
on the model. Firstly, the main manufacturing scenario should be entered into the
model then the modeler will change the system according to the goal of his/her
research. After the verification and validation analysis of the main model, response
of the system under different scenarios will be examined.
Page 56
38
3.7 Analysis and Interpretation of Simulation Results
Simulation results are analyzed and interpreted at this stage that is a basis for
making corresponding decisions (e.g., deciding about the best values of parameters
of the modeled system, or choosing the best control algorithm).
Page 57
39
CHAPTER 4
A SAMPLE APPLICATION FOR SIMULATION MODELING
WITH ARENA®
4.1 Overview
In this chapter, application for simulation methodology will be described by
simulating a real manufacturing company. For a pilot application, a hydraulic
cylinder company in Ankara OSTIM was selected. As mentioned before, model of
SMEs will be used while selecting a partner for virtual enterprise model. This
chapter will guide the modeler while developing a simulation model of SMEs.
Screenshots of templates were used for understanding the development process
better.
The basic model and some experimental models will be developed in this
chapter. After checking validation of system, experiments will be done by changing
sequencing rules of queues. By using the basic model, new products, new process
sequences, new queue rules, etc. could be added to the system.
The aim of this study is to develop the model of SMEs in order to use them to
see the response of the system under desired conditions. In this study several
experiments are done for optimizing the system performance. In addition to these
experiments, the system was forced by new entity task to see the system response.
As mentioned above a hydraulic cylinder company was selected for sample
modeling. The VE management system selects the partner firms for a project by
searching their resource capabilities. In this thesis it is assumed that drive shaft
production job will enter the VE system and operations will be assigned to different
Page 58
40
companies with respect to their resource capabilities. Again it is assumed that the
grinding and heat treatment operations for five drive shafts manufacturing will be
assigned to this particular hydraulic company. By adding this new entity to the
system, the modeler will see the system response before assigning the job in the real
life. Implementation of experiments and results obtained from these experiments will
be explained below
4.2 Collecting General System (Company Properties) Data
The hydraulic cylinder company was selected for this thesis. The main
activity field of the company is manufacturing hydraulic cylinders. The company
indicated that they are also interested in surface hardening and grinding operations of
any other products.
The hydraulic company operates on make-to-order basis. The modeled
system under consideration is a discrete parts manufacturing system. All operations
for manufacturing of hydraulic cylinders are done in the company except “Chrome
Plating” process. Piston Rods should be coated to decrease the effects of atmospheric
conditions and frictional forces. To optimize the system efficiency, all potential
problems should be determined before developing the model.
The hydraulic cylinder company’s manufacturing policy is based on make-to-
order basis; most ordered products were taken as an entity for simulation modeling.
Detailed data of entities will be collected in the next step. Worker schedule was
defined as 8:00 a.m. to 6:00 p.m. with 30 minutes lunch break. If lunch break comes
before the worker finishes his job, he takes his 30 minute break after completing the
work (Figure 4.1).
Page 59
41
Figure 4.1 Worker Schedule
The firms that selected the make-to-order basis couldn’t be modeled on a
limited time basis. In these types of SMEs, models must be built on a number of
entity basis. This means, the simulation run will finish when the manufacturing of the
desired number of parts is completed. Ten replications will be done in this simulation
and simulation will finish when twelve hydraulic cylinders are produced (Figure 4.2).
In the Initialize between Replication tab, statistics and system check boxes were
checked. By this marking, simulation will result in 10 statistically independent and
identical replications and reports, each starting with an empty system at time 0 and
each will finish when the manufacturing process will be done (Replication Length =
Infinite). The random number generator just keeps on going between replications,
making them independent and identically distributed (IID). In this example base time
unit is selected as minutes.
Page 60
42
Figure 4.2 Run Setup Menu
After determination of general properties of the SME, resource capabilities
(machines and workers) of firm should be determined. The company has four manual
(Ø250x1500 mm, Ø250x2500 mm, Ø300x3000 mm, Ø400x3000 mm) and one CNC
turning (Ø400x630 mm), one honing (Ø300x2200 mm), one heat treatment (mid-freq
10 kHz), one grinding (Ø280x2000 mm), one cutting, one drilling and one MIG
welding machine (Table 4.2). Pictures of machines are given in Appendix A. Layout
of the company is shown in Figure B.5. There are also nine technicians working in
this company. Each of them is specialized on a different machine.
Page 61
43
Table 4.1 Workers -Processes Table
Turning Machine
Grinding Machine
Heat Treatment Cutting Honing
MachineDrilling Machine Welding Cleaning Assembling
Worker 1 ● ● ● ● ● Worker 2 ● ● ● ● ● Worker 3 ● ● ● ● ● Worker 4 ● ● ● ● ● Worker 5 ● ● ● ● ● Worker 6 ● ● ● ● ● Worker 7 ● ● ● ● ● Worker 8 ● ● ● Worker 9 ● ● ●
Table 4.2 Machine Capabilities
Machines Category and Type Capacity Power CNC Turning Machine Ø400x630 mm 10 kW
Lathe Machine 1 Ø250x1500 mm 5.5 kW Lathe Machine 2 Ø250x2500 mm 5.5 kW Lathe Machine 3 Ø300x3000 mm 7.5 kW Lathe Machine 4 Ø400x3000 mm 10 kW
Grinding Machine Ø280x2000 mm 6 kW Honing Machine Ø300x2200 mm 5 kW
Vertical Drilling Machine 0-26 mm 2 kW Circular Saw Ø350 mm 2 kW
MGAW Machine 500 amp 15kvA Heat Treatment Machine mid-freq 10 kHz 200 kW
4.2.1 Turning Operation
There are four universal and one CNC turning machine (Table 4.2) (Figure
A.1 – A.5) in the company. Because of some advantages like lower setup times,
higher operating speed, etc, CNC turning machine’s operating time is approximately
three times lower than other lathes. Five technicians work in this section. Weld edge
Page 62
44
preparation, rough turning (Face & Longitudinal), threading and grooving operations
are done by lathe machines.
4.2.2 Welding Operation
Different kinds of bearings can be welded to piston rods. These bearings are
requested by customer according to their usage area. One welding operator works
with MGAW (Metal Gas Arc Welding) machine.
4.2.3 Heat Treatment Process (Induction Surface Hardening)
This operation is done in order to get a hard surface. Especially, parts which
are exposed to tough working conditions will be hardened in industry. In the
hydraulic company, there is one surface hardening machine which has 10 kHz
frequency and 200 kW power (Figure A.8). In hydraulic cylinder manufacturing,
piston rods must be hardened before, the grinding operation. If it is requested, gears
(with modulus 5-40, diameter between 25-3000 mm), pins, bushes, spools,
automotive equipments (with length 30-3000 mm), etc. will be hardened by EMA
induction hardening machine. One technician works with this machine.
4.2.4 Grinding Operation
To get a smooth surface before sending rod batch to chrome plating, piston
rods must be well ground. There is one cylindrical grinding machine which has
Ø280x2000 mm capacity with 6 kW power (Figure A.9). One technician works with
this machine.
4.2.5 Chrome Plating Process
Rods are exposed to atmospheric conditions that corrode them. To overcome
this disturbance, after grinding operation, piston rods are sent for chrome plating.
Page 63
45
Since there is no plating capability in the hydraulic company; rods are sent to another
company which works on Chrome Plating Operations.
4.2.6 Pipe Cutting Process
Pipe cutting process is done by band saw machine which has 920 mm
maximum cutting height. Cylinder barrel length is arranged with respect to stroke
length.
4.2.7 Honing Operation
The honing machine was designed and manufactured by the company. This
machine (Figure A.6, A.7) can operate on a cylinder barrel which has 300 mm
diameter with 2200 mm length. Machine spindle speed can reach maximum 450
rev/mm. There are several honing heads (honing holes dia. 30~300 mm.) which are
mounted to spindle. The machine is used to get well smooth inner surface (For better
contact between seals (Figure 4.3).). One honing operator works with this machine.
Figure 4.3 Hydraulic Cylinder Sealing Parts [14]
Page 64
46
4.2.8 Drilling Operation
Cylinder barrel must be drilled and a mechanism must be mounted these
holes to provide oil flow between gaps. This mechanism adjusts the movement of the
hydraulic cylinders. The hydraulic cylinder types can be divided into two groups
according to their movement types. These are single or double acting hydraulic
cylinders. In single acting cylinders, return of piston rod action is done by the weight
of construction whereas in double acting cylinders, movement of piston rod is done
by pumps. These pumps are usually mounted on to the machine where the pistons are
used. Machine operators will control the movement of hydraulic pistons by feeding
oil to the gaps using these pumps.
4.3 Collecting and Processing Real System (Shop-Floor) Data
In this model, manufacturing process will be studied so it is believed that all
type of entity and its process cycle should be described first. As it is mentioned
above hydraulic cylinder company was selected for this study and their
manufacturing policy is make–to-order policy. Figure A.13 – A.16 shows the firm
product variety. For this model, most requested type which has Ø100 mm internal
barrel diameter and 500 mm stroke was selected. The company has a capacity to
produce different types of cylinders with minimum Ø63 mm and maximum Ø300
mm external diameter and maximum 2200 mm length. After the determination of
entity type, parts of entity and their process plans should be determined. Hydraulic
cylinder’s standard parts list is shown in Figure 4.4.
Page 65
47
Item No. Description Item No. Description
1 Piston Rod 15 Packing Washer 2 Cylinder Barrel 16 Rod Wiper 3 Head end Cap 17 "O" Ring Seal for Ball Check Retainer 4 Cap end cap 18 N/A 5 Rod Bushing 19 Wave Spring 6 Retainer Plate 20 Cylinder Barrel O-Ring 7 Piston 21 Wear Ring 8 Cushion Plunger 22 Tie Rod Flex Loc Nut 9 Cushion adj. Needle 23 Teflon Ring Seal for Cushion adj. Needle
10 Ball Check Retainer 24 N/A 11 Ball Check 25 Jam Nut for Cushion adj. Needle 12 N/A 26 Tie Rod 13 Block Vee Packing 27 Self-Locking Cap Screw 14 Rod Vee Ring Set 28 O-Ring for Floating Cushion
Figure 4.4 Standard Part List [15]
Main part of basic cylinder can be described as;
• Piston rod. (Part 1)
• Piston. (Part 2)
• Cylinder barrel. (Part 3)
• Head end cap. (Part 4)
• Cap end cap. (Part 5)
Page 66
48
Process plan for main parts is shown in Figure 4.5;
Figure 4.5 Process Plan
Machining times were taken from workers or it can be defined by using
chronometer. Generally exact process time should not be taken from operators but
using different distribution formulas may solve this problem. Triangular distribution
is the most suitable distribution type for machining times. The triangular distribution
is commonly used in situations in which the exact form of the distribution is not
known, but estimates (or guesses) for the minimum, maximum, and most likely are
available. Operators could give maximum and minimum process times. By using this
distribution, ARENA® could calculate average values for operation times. For this
pilot application, base time unit was selected as minute.
Page 67
49
Table 4.3 Process Sequence for Piston Rod (Part 1)
Process Sequence for Piston Rod (in minutes) Turning operation TRIA(7, 10, 15) Welding operation TRIA(13, 15, 21 ) Turning operation TRIA(70, 80, 110)
Heat treatment operation TRIA(8, 10, 13) Grinding operation TRIA (22, 25, 32)
Chrome plating operation TRIA (360, 720, 1080) Cleaning operation TRIA(10, 15, 20)
Assembling operation TRIA(30, 45, 60)
Table 4.4 Process Sequence for Piston (Part 2)
Process Sequence for Piston (in minutes) Turning operation TRIA(54, 60, 75) Cleaning operation TRIA(10, 15, 20)
Assembling operation TRIA(30, 45, 60)
Table 4.5 Process Sequence for Cylinder Barrel (Part 3)
Process Sequence for Cylinder Barrel (in minutes) Pipe cutting operation TRIA(7, 10, 12)
Turning operation TRIA(130, 145, 155) Honing operation TRIA(60, 75, 80) Drilling operation TRIA(5,10,12) Cleaning operation TRIA(10, 15, 20)
Assembling operation TRIA(30, 45, 60)
Table 4.6 Process Sequence for Head End Cap (Part 4)
Process Sequence for Head End Cap (in minutes) Turning operation TRIA(120, 150, 165) Cleaning operation TRIA(10, 15, 20)
Assembling operation TRIA(30, 45, 60)
Page 68
50
Table 4.7 Process Sequence for Cap End Cap (Part 5)
Process Sequence for Cap End Cap (in minutes) Turning operation TRIA(15, 20, 25) Cleaning operation TRIA(10, 15, 20)
Assembling operation TRIA(30, 45, 60) Arrival times, transfer times (Table 4.8-4.12), setup times of entities, and
working hours should also be taken into account by modeler. Generally
transportation process in the company is done by hand lifts but there are also two
overhead cranes in the workshop. The values (minimum, mean and maximum
transportation time) are determined by using chronometer.
Table 4.8 Transfer Time Distributions to Stations for Piston Rod
Transfer Time Distributions to Stations for Piston Rod Station Name Route Time Unit
Route From Turning TRIA( 12,15,17 ) Minutes Route From Welding TRIA( 3,4,6 ) Minutes Route From Turning TRIA( 12,15,17 ) Minutes
Route From Hardening TRIA( 3,4,6 ) Minutes Route From Grinding TRIA( 50,60,75 ) Minutes Route From Plating TRIA( 50,60,75 ) Minutes
Route From Cleaning TRIA( 2,3,4 ) Minutes Route From Assembling TRIA( 1,2,3 ) Minutes
Table 4.9 Transfer Time Distributions to Stations for Piston
Transfer Time Distributions to Stations for Piston Station Name Route Time Unit
Route From Turning TRIA( 12,15,17 ) Minutes Route From Cleaning TRIA( 2,3,4 ) Minutes
Route From Assembling TRIA( 1,2,3 ) Minutes
Page 69
51
Table 4.10 Transfer Time Distributions to Stations for Cylinder Barrel
Transfer Time Distributions to Stations for Cylinder Barrel Station Name Route Time Unit
Route From Sawing TRIA( 3,4,6 ) Minutes Route From Turning TRIA( 12,15,17 ) Minutes Route From Honing TRIA( 9,11,13 ) Minutes Route From Drilling TRIA( 3,5,7 ) Minutes Route From Cleaning TRIA( 2,3,4 ) Minutes
Route From Assembling TRIA( 1,2,3 ) Minutes
Table 4.11 Transfer Time Distributions to Stations for Head End Cap
Transfer Time Distributions to Stations for Head End Cap Station Name Route Time Unit
Route From Turning TRIA( 12,15,17 ) Minutes Route From Cleaning TRIA( 2,3,4 ) Minutes
Route From Assembling TRIA( 1,2,3 ) Minutes
Table 4.12 Transfer Time Distributions to Stations for Cap End Cap
Transfer Time Distributions to Stations for Cap End Cap Station Name Route Time Unit
Route From Turning TRIA( 12,15,17 ) Minutes Route From Cleaning TRIA( 2,3,4 ) Minutes
Route From Assembling TRIA( 1,2,3 ) Minutes
4.4 Formulate and Develop a Model
In this study, ARENA® Simulation Tool was used to develop the model.
Statistics and data which were collected in previous steps are entered into Arena®’s
menus. In the basic model, manufacturing of twelve basic hydraulic cylinder types
was modeled. Queue mentality was taken as “Process Type” queue discipline in the
basic model. It means every part will be queued with respect to their process type.
Page 70
52
There are some important points which should be taken into consideration
while modeling this pilot SME. First the modeler must determine his/her modeling
mentality. There are two main simulation methods which could be selected by the
modeler. As it is mentioned before Arena Templates have several modules and
blocks. By the help of these modules and blocks models can be developed. Modules
could be arranged consecutively or separately. Consecutive arrangements are
generally used for basic type of modeling. Since these types of models are non-
flexible, much complex models can not be developed by consecutive block
arrangement. Modeler should use separate block groups to model a firm like SME.
These separate block arrangement can be used for representing each operation. By
this property, machining sequences can be changed or a new entity which has
different and independent machining process can be added to the system. In this
study, machining process was done by using “Station” and “Route” blocks. As it is
clearly seen in Figure B.2 and Figure B.3, there is no link between machine block
groups. Entities are seized by related machines by using sequence module of Arena.
Resources (labor & machine capabilities) of firm should be entered to the Resource
module of Arena. By the help of this module Arena will determine related machine
and the worker with respect to the job type. Because some works (e.g. cleaning,
drilling, etc.) in workshop which do not need specialization can be done by
experienced workers who may be free at that time. When a new entity waits for its
machine, technician should return to his own work after finishing the work he has
without taking the second one. For a sample illustration, in Figure 4.6, the expanded
case of the Arena's Set Module is shown. Here, the sequence of the workers that can
work incase of being idle in the band saw machine (Cell 1), can be seen. Same list
should be prepared for all machines (cells) to determine the corresponding worker(s).
Page 71
53
Figure 4.6 Set Module
Second important point while modeling the pilot SME is developing the batch
for chrome plating process. As it is mentioned above company sends all Piston Rods
which are ready for chrome plating by making batches. Arena uses the Batch &
Separate modules to accomplish this task. This module is intended as the grouping
mechanism within the simulation model. Batches of entities can be permanently or
temporarily grouped. Temporary batches must later be split using the Separate
module. Batches may be made with any specified number of entering entities or may
be matched together based on an attribute. Entities arriving at the Batch module are
placed in a queue until the required number of entities has accumulated. Once
accumulated, a new representative entity is created.
Page 72
54
The modeler must also be careful while modeling the assembly operation.
Arena takes all or specific entity with respect to desired number while making batch
operation. But in the assembly operation, Arena should seize one entity from every
part. To achieve this task, entities should be separated according to their types. The
Match block could be used for synchronizing the entities located in different,
detached queues. When operand Match Attribute is specified, the Match block
synchronizes the advance of entities with matching values of Match Attribute. Two
or more detached queues, each with its own Queue Label, are used in conjunction
with the Match block. When an entity arrives at one of these detached queues, Siman
assigns the value of Match Attribute as the entity’s match code. When all detached
queues associated with a Match block have one or more entities with the same match
code, these entities are released to the Destination Label corresponding to each
Queue Label, or are disposed if no Destination Label is specified. When operand
Match Attribute is defaulted, Siman waits until each of the detached queues
associated with the Match block has one or more entities in it before releasing or
disposing the entities.
In this study, model was built on three main sections which are part arrival,
manufacturing and part disposal.
4.4.1 Part Arrival Section
In the Part arrival section (Figure B.1), entities are created and some
attributes are assigned. After assigning the attributes, entities are routed to their
related machines, by using their process sequences.
4.4.2 Manufacturing Section
In the manufacturing sub-model, all manufacturing processes, related with
machines were modeled separately (Table 4.13). Machining sequences are taken
from “Sequence” module of ARENA®.
Page 73
55
Table 4.13 Resource Names in ARENA®
Resource Names (ARENA® ) Processes & Machines Cell 1 Band Saw Machine Cell 2 Heat Treatment Process Cell 3 Turning Machines Cell 4 Grinding Machine Cell 5 Chrome Plating Process Cell 6 Welding Machine Cell 7 Drilling Machine Cell 8 Honing Machine Cell 9 Cleaning Process Cell 10 Assembling Process
4.4.2.1 Sub-Model of Band Saw Machine
Pipe cutting process is done in this stage. Workers who have this ability and
availability can work with this machine. Setup time for cutting process was taken as
TRIA (8,10,12). By “Route from Cell 1” module, parts are transferred to next related
machine.
4.4.2.2 Sub-Model of Heat Treatment Process
This stage deals with the Surface Hardening process done at this stage.
“Worker 9” works with this machine. Setup time for heat treatment process was
taken as TRIA (5,7,9). Parts are removed from this machine approximately in 2
minutes. By “Route from Cell 2” module, parts are transferred to the next related
machine.
4.4.2.3 Sub-Model of Turning Machines
This is the stage of turning operations done at this stage. Five workers
(Worker 1, Worker 2, Worker 3, Worker 4 and Worker 5) work on lathes. Each of
them works at his own related machine. CNC turning machine’s operating speed is
Page 74
56
approximately three times higher than other lathes. Therefore, machining times for
CNC machine is multiplied by 0.3 constant by ARENA®. Setup time for turning
process was taken as TRIA (12,15,17). Part removal time was taken as TRIA (3,5,8).
By “Route from Cell 3” module, parts are transferred to the next related machine.
4.4.2.4 Sub-Model of Grinding Machines
Grinding operations are done at this stage. “Worker 6” works on this
machine. Setup time for grinding process was taken as TRIA (12,15,17). Part remove
time was taken as TRIA (3,5,8). By “Route from Cell 4” module, parts are
transferred to the next related machine.
4.4.2.5 Sub-Model of Chrome Plating Process
Chrome plating process in which piston rods are sent to chrome plating
company takes place in this stage. Before sending piston rods for plating process,
rods are batched. This process takes minimum six hours and maximum
approximately two days. It depends on company’s work load. Statistical distribution
for this process was taken as TRIA (360,720,1080). By “Route from Cell 5” module,
parts are transferred to the next related machine.
4.4.2.6 Sub-Model of Welding Process
Welding process is done at this stage and “Worker 8” works at this machine.
Statistical distribution for this process was taken as TRIA (13,15,21). By “Route
from Cell 6” module, parts are transferred to the next related machine.
4.4.2.7 Sub-Model of Drilling Machine
Drilling process is done at this stage. Workers who have this ability and
availability can operate this machine. Setup time for drilling process was taken as
Page 75
57
TRIA (8,10,12). By “Route from Cell 7” module, parts are transferred to the next
related machine.
4.4.2.8 Sub-Model of Honing Machine
Honing process is done at this stage. “Worker 7” operates this machine. Setup
time for honing process was taken as TRIA (14,18,20). Part remove time was taken
as TRIA(5,9,11). By “Route from Cell 8” module, parts are transferred to the next
related machine.
4.4.2.9 Sub-Model of Cleaning Process
Cleaning process is done at this stage in which all workers, who are idle, can
clean and checks the finished parts. Statistical distribution for this process was taken
as TRIA (10,15,20). By “Route from Cell 9” module, parts are transferred to the next
related machine.
4.4.2.10 Sub-Model of Assembling Process
Assembling process is done at this stage. Workers who have this ability and
availability can assemble the finished parts. All finished parts are separated
according to entity type, and then entities are seized one by one for assembling
process. Statistical distribution for this process was taken as TRIA (30,45,60). By
“Route from Cell 10” module, parts are transferred to disposal stage.
4.4.3 Disposal Section
In the disposal section (Figure 4.4), entities are disposed and some statistics
about queues, entities, processes and resources are taken. Detailed explanation,
graphical results and statistics can be found in APPENDIX C.1 for basic model.
Page 76
58
4.5 Verification & Validation
Ten replications were done for each model. By using half width, minimum
and maximum values of results, Arena takes the average of each result and gives one
statistical result for each. During validation, owing to the unavailability of data, these
output statistics can only be compared against the conjectural manufacturing time
which is taken from the owner of the company. It can be summarized that twelve
basic cylinder manufacturing approximately takes 4.5 - 5 days. When this
information is compared with the results of “Process Type” experiment (Company’s
manufacturing policy), it can be easily seen that the basic model is valid.
4.6 Experimental Models and Their Results
As it was mentioned before, the main parts of the hydraulic cylinder are “the
piston rod”, “the piston”, “the cylinder barrel”, “the head end cap” and “the cap end
cap”. When the company’s resource capacity is taken into account, these five parts
can be produced without the occurring of any bottleneck except the turning operation
queue. These five main parts have different production plans. Among the plans of
these parts, the only common operation is the turning operation. The piston rod goes
through the turning operation queue twice and the other parts go through once. So it
can clearly be seen that the turning operation’s queue is the place that all parts are
waiting for machining. The modeler can change the responses of the system by
changing the order mentality of the turning operation queue. The firm manager’s
selection for the turning operation queue is “Process Type”. Firstly, this scenario
with ten independent replications was studied. The results of the “Process Type”
experiment can be briefly shown as;
Page 77
59
Table 4.14 Value-Added Time for Entities
Entity Time
VA Time (Minute)
Minimum Maximum Minimum Maximum Average Half Width Average Average Value Value
Part 1 906.66 66,69 753.76 1026.30 707.14 1063.86Part 2 104.38 2,29 97.4473 108.55 62.8794 139.27 Part 3 257.17 4,00 248.95 264.96 181.01 317.25 Part 4 157.18 4,19 147.70 165.27 91.8302 230.09 Part 5 72.3359 2,51 66.9127 76.6641 51.4983 90.6125
0,000
200,000
400,000
600,000
800,000
1000,000
Part 1Part 2Part 3Part 4Part 5
Figure 4.7 Value-Added Time for Entities
Page 78
60
Table 4.15 Waiting Time for Entities
Entity Time
Wait Time (Minute)
Minimum Maximum Minimum Maximum Average Half Width Average Average Value Value
Part 1 1289.23 25,35 1240.61 1331.34 970.97 1606.50Part 2 2244.63 73,77 2048.94 2396.56 1879.91 2590.81Part 3 2067.13 63,92 1915.82 2206.94 1654.55 2383.94Part 4 2186.19 77,34 2006.25 2381.38 1802.57 2573.90Part 5 2266.96 71,94 2083.52 2445.84 1890.68 2672.72
1200,000
1400,000
1600,000
1800,000
2000,000
2200,000
2400,000
Part 1Part 2Part 3Part 4Part 5
Figure 4.8 Waiting Time for Entities
Table 4.16 Transfer Time for Entities
Entity Time
Transfer Time (Minute) Minimum Maximum Minimum Maximum Average Half Width Average Average Value Value
Part 1 174.98 4,3 167.27 183.69 156.83 195.14 Part 2 27.1469 0,26 26.5448 27.7745 23.9937 30.1519Part 3 47.2340 0,55 46.3876 48.7167 43.0453 52.0912Part 4 27.2439 0,25 26.7963 27.9240 24.2148 30.7154Part 5 26.8100 0,31 26.0860 27.3291 23.7454 30.8853
Page 79
61
20,000
40,000
60,000
80,000
100,000
120,000
140,000
160,000
180,000
Part 1Part 2Part 3Part 4Part 5
Figure 4.9 Transfer Time for Entities
Table 4.17 Total Time for Entities
Entity Time
Total Time (Minute) Minimum Maximum Minimum Maximum Average Half Width Average Average Value Value
Part 1 2370.87 69,99 2184.78 2528.99 1967.93 2765.72Part 2 2376.16 73,96 2176.66 2528.50 1984.43 2752.94Part 3 2371.53 64,56 2218.76 2518.82 1992.46 2729.61Part 4 2370.62 75,58 2195.82 2565.50 1973.42 2811.20Part 5 2366.11 73,75 2176.61 2549.03 1992.37 2786.17
2366,000
2368,000
2370,000
2372,000
2374,000
2376,000
2378,000
Part 1Part 2Part 3Part 4Part 5
Figure 4.10 Total Time for Entities
Page 80
62
Table 4.18 Process Times wrt Machines
Processes Time
Accumulated VA Time (Minutes)
Minimum Maximum Average Half Width Average Average
Cell 1 117.82 2,56 111.34 122.35 Cell 2 124.62 2,64 118.72 131.53 Cell 3 3913.94 47,67 3806.87 3998.66 Cell 4 317.30 2,65 311.69 323.33 Cell 5 725.36 66,91 574.01 843.60 Cell 6 194.13 3,29 188.10 200.83 Cell 7 108.99 3,69 100.22 117.73 Cell 8 858.69 14,14 817.77 881.55 Cell 9 885.84 12,1 865.34 908.97 Cell 10 549.41 18,65 513.33 599.72
0,000
500,000
1000,000
1500,000
2000,000
2500,000
3000,000
3500,000
4000,000
Cell 1 ProcessCell 10 ProcessCell 2 ProcessCell 3 ProcessCell 4 ProcessCell 5 ProcessCell 6 ProcessCell 7 ProcessCell 8 ProcessCell 9 Process
Figure 4.11 Process Times wrt Machines
When the results above are examined, it can be seen that total time for
manufacturing of piston rods (Part1) takes 906.66 minutes. The highest value which
follows it belongs to cylinder barrels (Part 3) which is 257.17 minutes. When the
Table 4.18 is examined, it is seen that chrome plating operation (Cell 5) takes 725.36
minutes. So, it is now clearly seen that this huge difference between production time
of piston rods and the other parts is occurred because of chrome plating operation.
Page 81
63
When Table 4.16 is examined, it is clearly seen that the transfer time has no
remarkable effect on the total process time. All machines except lathes are placed in
one part of the company and the replacements between them will not seriously affect
the transfer times of the parts. By this manner, it can be recognized that placements
of machines are appropriate to the work flow of the hydraulic cylinder company. In
the Table 4.16, piston rod’s (Part 1) transfer time – 174.998 minutes - may attract
attention. The most of this time passes at transferring between the hydraulic company
and the plating company. Since the firm is not directly related with this loss time, the
company can not make any better optimization to decrease the transfer times.
When the process times are taken into account it is seen that turning machines
(Cell 3) are the most utilized machines. Replacing the universal turning machines
with the new CNC machines will decrease the total process time of turning
operation. This replacement will also help the company to decrease the total
production time of hydraulic cylinders.
When the waiting times are examined from Table 4.16, it can be seen that
piston rods wait for machining less than the other parts. But still there are other
possibilities to decrease the waiting time of piston rods. To decrease total time for
hydraulic cylinders, different sequencing rules can be tried on the turning queue. The
other developed experiments for optimizing the system are;
• FIFO (First-In-First-Out)
• Piston rods have first priority for turning operation
• Arrange the parts with respect to their process times
o SPT (Shortest Processing Time First)
o LPT (Longest Processing Time First)
These four scenarios were studied with ten independent replications. Detailed
results of these experiments can be found in Appendix C. In order to make a
comparison between company’s manufacturing policy (Process Type) and the other
Page 82
64
four experiments, total manufacturing time and waiting time data are listed in Table
4.19.
Table 4.19 Comparison between Simulation Results.
Base time unit: Minute FIFO
(First In First Out)
Part Priority (Piston Rods
First)
SPT (Shortest
Processing Time First)
LPT (Longest
Processing Time First)
Process Type
Total Time 2595 2172 2481 2805 2808 Part 1 Waiting Time 1096.89 646.54 842.82 1359.45 1289.23 Part 2 Waiting Time 2043.19 1593.48 1851.24 2240.33 2244.63 Part 3 Waiting Time 1886.17 1430.39 1695.76 2075.22 2067.13 Part 4 Waiting Time 1984.99 1526.19 1791.71 2179.36 2186.19 Part 5 Waiting Time 2068.99 1614.64 1879.79 2263.57 2266.96
As it is clearly seen in Table 4.19, “Part Priority” queue mentality gives the
best response for hydraulic cylinder manufacturing. In this manufacturing policy,
piston rods have priority to be machined in turning operation over the other parts. As
it was mentioned before, piston rods are batched and sent to the chrome plating
company which takes minimum six hours to plate. Consequently, giving priority to
the piston rods for turning operation is the best choice for company. By this way,
plating of the piston rods is done simultaneously with manufacturing of other parts.
Among all the sequencing rules analyzed, the “Process Type” sequencing rule has
the worse results compared to the other sequencing rules.
4.7 Experiments for VE Organization
The drive shaft production is tested in the second part of the experiments even
though the "drive shaft”, isn’t offered in the wide range of products at the pilot
company. As it is mentioned above, the company also is interested in surface
hardening by induction and grinding. In this part of the study, it is assumed that
grinding and heat treatment operations of five new entities are assigned to the
Page 83
65
hydraulic cylinder company by the VE management unit. It is also assumed that this
job was assigned 300 minutes after the company started to produce twelve hydraulic
cylinders. This new entity and its process sequences have been experimented on
"Process Type" and "Part Priority" models which were prepared beforehand.
Detailed results of each experiment can be found in Appendix C. The results which
are tabulated for comparison are;
Table 4.20 Comparison between Simulation Results 2.
Process Type Drive Shaft Manuf.
wrt Process Type
Part Priority (Piston Rods
First)
Drive Shaft Manuf.wrt
Part Priority
Total Time 2808 2706 2172 2082 Part 1 Process Time 906.66 894.48 899.11 818.19 Part 2 Process Time 104.38 103.91 103.19 103.16 Part 3 Process Time 257.17 256.71 243.21 242.94 Part 4 Process Time 157.18 157.30 165.86 166.00 Part 5 Process Time 72.3359 71.8896 74.2937 73.9340 Part 6 Process Time --- 49.3255 --- 49.1808
Part 1 Wait Time 1289.23 1299.02 646.54 645.42 Part 2 Wait Time 2244.63 2240.19 1593.48 1510.73 Part 3 Wait Time 2067.13 2062.70 1430.39 1347.87 Part 4 Wait Time 2186.19 2181.52 1526.19 1443.30 Part 5 Wait Time 2266.96 2262.34 1614.64 1532.00 Part 6 Wait Time --- 89.4652 --- 345.18
Process Time Cell 1 117.82 117.82 118.44 118.44 Process Time Cell 2 124.62 216.00 122.61 215.00 Process Time Cell 3 3913.94 3913.94 3908.91 3908.91 Process Time Cell 4 317.30 471.42 311.43 468.22 Process Time Cell 5 725.36 713.84 719.85 638.70 Process Time Cell 6 194.13 194.13 194.35 194.35 Process Time Cell 7 108.99 110.75 106.36 109.34 Process Time Cell 8 858.69 855.44 861.28 860.48 Process Time Cell 9 885.84 893.67 890.63 894.51
Process Time Cell 10 549.41 543.76 535.16 532.60 Total Time of Part 6 --- 150.50 --- 406.07
Page 84
66
New entity (Drive Shaft) was represented as Part 6 in Table 4.20. When the
Table 4.20 is examined it is clearly seen that process times for parts are
approximately same. When the total production time of drive shafts is taken into
account, it is seen that assigned job is finished earlier in “Process Type” mentality. If
the grinding and hardening operations are examined this situation will come out
clearly. Piston rods have priority for machining in grinding and hardening operations
in both queue mentalities. With detailed explanation, in these queues piston rods take
the first place and drive shafts take the second place for machining. In the “Process
Type” model, operation of drive shaft task is almost finished just before the piston
rods arrive. But in the “Part Priority” model, when the drive shafts arrive to the
system, piston rods have already been queued for grinding or hardening operations.
This situation creates the differences in waiting times of the drive shafts. The
company must choose its queue mentality for grinding and hardening machines
according to an assigned due date. It is clearly seen in Table 4.20 that operations of
manufacturing five drive shafts does not affect the total manufacturing time too
much. So VE management can clearly understand that this task would easily be
accomplished by this company. Detailed statistical results and their graphs can be
found in APPENDIX C.
Page 85
67
CHAPTER 5
CONCLUSIONS AND RECOMMENDATIONS FOR FUTURE WORK
The appropriateness of the simulation tool to partner SME selection process
of the VE model was tested in this study. As it was mentioned before, Small-Medium
Size Enterprises (SMEs) seems to be appropriate units to behave like VE partners
due to their lean structure, adaptability to market evolution, active involvement of
versatile human resources, ability to establish sub-contracting relations and good
technological level of their products.
In this study, ARENA simulation tool was used for developing the model of
shop floor activities of pilot SME to see the appropriateness of candidate SMEs for
VE organization. VE management unit will use this tool while making pre-
elimination of SMEs, optimizing the manufacturing plan of the member SMEs,
analyzing the member SMEs with their current and new work load over the existing
one. VE management will analyze these virtual models by checking the output
statistics of ARENA. The default ARENA installation automatically brings up the
Category Overview Report, which gives the modeler access to most important
statistical results such as cost, resource, queues, activity areas, processes, stations,
conveyors, transporters and entity statistics. But also these variables must be defined
while developing the model. The modeler can also keep his/her own tallies by
defining them in his/her model. In this study, firstly, a pilot SME’s shop floor
activity, with its current workload, was modeled and examined. Then four different
scenarios were tested on this base model. By examining the statistical outputs of the
all developed model, the best queue rule which gives better response to given
circumstances, the most utilized resources (machines and workers) and the
Page 86
68
bottlenecks which were occurred during the manufacturing of main parts of hydraulic
cylinder were determined.
Also in this thesis, new jobs were assigned to the company to see the response
of the system under their current workload. According to the goal of the VE
management unit output statistics can be defined while developing the model. By
analyzing the statistical output results of new model, VE management unit can easily
make decision about appropriateness of candidate SMEs. For instance, if VE
management unit examines the total production time of new part which was
subsequently assigned to the candidate SMEs, the most appropriate firm according to
due date of new job can be easily seen. Finally, this study shows that simulation tool
provides remarkable advantages while choosing the partner firm (SME) for VE
System.
The major benefits of this study can be defined as follows;
• Examining member firm with current and assigned work load.
• Give an opportunity to optimize the system’s resources.
• Give an opportunity to select most appropriate firm for the project.
• Give an opportunity to examine the system with respect to the goal of VE
management unit.
• By the developed simulation methodology, modeling of new SME will be
done easily and accurately.
The literature survey revealed that the simulation tool was not used as a part
of VE partner selection process. Since this thesis is the first of its kind and
considering that its subject of the simulation tool was not implemented in the
IMTRG (Integrated Manufacturing Technologies Research Group) before, this
subject has strong prospects for future researches. In the future, this subject can be
further developed in various ways. The following topics are suggested as future
works of this thesis;
Page 87
69
• The usage of simulation tool can be expanded for all types of SMEs. More
complicated manufacturing types can be modeled in order to specialize in
simulation.
• An object-oriented program can be developed and integrated into the
ARENA program in order to develop and edit the model easily.
• If a control unit is developed for the VE system, the simulation tool can be
integrated into this unit by developing a VBasic based program.
Page 88
70
REFERENCES
[1] Paul Kidd, “Agile Manufacturing: Forging New Frontiers”, Addison-Wesley,
1994.
[2] M. T. Martinez, P. Fouletier, K. H. Park, J. Favrel, “Virtual Enterprise-organisation,evolution and control”, Int. J. Production Economics, 74, 225-238, 2001
[3] S.E. Bleeker, “The virtual organization”, Futurist 28, 2, 1994
[4] Davidow WH, Malone MS. The Virtual Corporation: Structuring and
Revitalizing the Corporation for the 21st Century. New York: HarperCollins; 1992
[5] Byrne J. The Virtual Corporation: the Company of the Future will be the Ultimate
in Adaptability, Business Week 1993; 8:37-41
[6] Hormozi AM. Agile Manufacturing: In Proceedings of the 37th International
Conference, American Production and Inventory Control Society, San Diego; 1994.
[7] Nell JG. Enterprise Representation: An analysis of Standards Issues; 1998.
Available at http://www.mel.nist.gov/msidlibrary/doc/jimnell95.pdf
[8] L. Camarinha-Matos, R. Carelli, J. Pellicer, M. Martín, “Towards to the Virtual
Enterprise Food Industry”, in Proceedings of International Conference on Integrated
and Sustainable Industrial Production, Edited by Luis Camarinha-Matos, Chapman &
Hall, Lisboa, Maio de 1997, pp 73-84.
Page 89
71
[9] VE system [On-line], 2003, Available at
http://mis.postech.ac.kr/topic/ve_e.html#_top
[10] Sarı, B.,Kılıç. S. E., “Development of an SME-Based Virtual Enterprise”, 11th
International Conference on Machine Design and Production, 11th International
Machine Design and Production Conference, Antalya, Turkey, 13-15 October 2004,
pp.79-93.
[11] W. David Kelton, Randall P. Sadowski, Deborah A. Sadowski, “Simulation
with Arena”, McGRAW-HILL International Editions, 2002
[12] S. Andradóttir, K. J. Healy, D. H. Withers, and B. L. Nelson, “Introduction to
Modeling and Simulatıon”, Proceedings of the 1997 Winter Simulation Conference
ed., Binghamton, NY 13902-6000, U.S.A, 1997, pp.7-12.
[13] David A. Takus, David M. Profozich, “Arena® Software Tutorial”, Proceedings
of the 1997 Winter Simulation Conference , Sewickley, Pennsylvania, USA, 1997,
pp 541-543.
[14] kianho.com [On-line], 2005, Available at
http://www.kianho.com.sg/hydraulic_cyclinder.gif
[15] flodraulic.com [On-line], 2005, Available at
http://www.flodraulic.com/uah/products/milwaukee.htm
[16] Product Catalog of Erdemler Hydraulic Company, Ankara, Turkey, 2005
Page 90
72
APPENDIX A
MACHINERY CAPABILITIES & PRODUCT TYPES OF
ERDEMLER HYDRAULIC COMPANY
A.1 Machinery Capabilities
The company has four manual lathes (Ø250x1500 mm, Ø250x2500 mm,
Ø300x3000 mm and Ø400x3000 mm), one CNC turning (Ø400x630 mm), one honing
(Ø300x2200 mm), one heat treatment (mid-freq 10 kHz), one grinding (Ø280x2000 mm),
one drilling, one band saw, and one MIG welding machine.
Figure A1 A View of Lathe 1
Page 91
73
Figure A.2 A View of Lathe 2
Figure A.3 A View of Lathe 3
Page 92
74
Figure A.4 A View of Lathe 4
Figure A.5 A View of CNC Lathe
Page 93
75
Figure A.6 A View of Honing Machine
Figure A.7 A View of Honing Operation
Page 94
76
Figure A.8 A View of Heat Treatment Machine
Figure A.9 A View of Grinding Machine
Page 95
77
Figure A.10 A View of Vertical Drilling Machine
Figure A.11 General View of Workshop_1
Page 96
78
Figure A.12 General View of Workshop_2
Page 97
79
A.2 Product Variety
Following catalogs represent the product variety of company. However much
these catalogs show the appropriate dimensions for hydraulic cylinder, stroke dimensions
can be changed according to customer orders.
Figure A.13 Basic Hydraulic Cylinders [16]
Page 98
80
Figure A.14 Three Stage Telescopic Cylinders [16]
Page 99
81
Figure A.15 Four Stage Telescopic Cylinders [16]
Page 100
82
Figure A.16 Five Stage Telescopic Cylinders [16]
Page 101
83
APPENDIX B
MODEL DEVELOPMENT OF
ERDEMLER HYDRAULIC CYLINDER COMPANY
B.1 Modules of Simulation
The basic building blocks for ARENA® models are called modules. These are the
flow chart and data objects that define the process to be simulated and are chosen from
panels in the Project Bar. Modules can be divided into two main groups; Flowchart and
Data. Flowchart modules describe the dynamic processes in the model.
Flowchart modules are defined as nodes or places through which entities flow, or
where entities originate or leave the model. In ARENA® 6.0, there are several templates
(Panels) for developing the models. In the Basic Process panel, the kinds of flowchart
modules available are Create, Dispose, Process, Decide, Batch, Separate, Assign, and
Record; other panels have many additional kinds of flowchart modules. Each type of
flowchart module in the Basic Process panel has a distinctive shape, similar to classical
flowcharting. But in other panels (such as the Advanced Process panel), there are many
more flowchart-module types than there are reasonable shapes, so they're all represented
by simple rectangles. Some panels (like Advanced Transfer) use colors in the rectangles
to distinguish different types of flowchart modules, and some panels (like the specialized
ones for contact centers and packaging) use more elaborate graphics for them. One way
to edit a flowchart module is to double-click on it once it's been placed in the flowchart
view of the model window, to bring up a dialog pertaining to it. Another way to edit
flowchart modules is to select a module type (e.g., click on a Create or a Process
module), either in the Project Bar or in the flowchart view of the model window, and a
Page 102
84
line for each flowchart module of that type in the model shows up in the spreadsheet view
of the model window, where modeler can edit the entries [11].
Data modules define the characteristics of various process elements, like entities,
resources, and queues. They can also set up variables and other types of numerical values
and expressions that pertain to the whole model. Icons for data modules in the Project Bar
look like little spreadsheets. The Basic Process panel's data modules are Entity, Queue,
Resource, Variable, Schedule, and Set (other panels contain additional kinds of data
modules). Entities don't flow through data modules, and data modules aren't dragged into
the model window; rather, data modules exist "behind the scenes" in a model to define
different kinds of values, expressions, and conditions [11].
Figure B.1 Part Arrival Modules
Page 103
85
Figure B.2 Manufacturing Modules Part_1
Page 104
86
Figure B.3 Manufacturing Modules Part_2
Figure B.4 Part Disposal Modules
Page 105
87
B.2 Animation of Simulation
Figure B.5 Layout of Erdemler Hydraulic Company
Page 106
88
Figure B.6 Screen Shot of Simulation
Page 107
89
APPENDIX C
STATISTIC RESULTS OF EXPERIMENTAL RUNS
C.1 Statistical Results of “Process Type” Experiment (Time units: Minute)
Entity
Time
VA Time Minimum Maximum Minimum Maximum
Average Average Value Value
Average HaHalf Width
Part 1 906.66 66,69 753.76 1026.30 707.14 1063.86
Part 2 104.38 2,29 97.4473 108.55 62.8794 139.27
Part 3 257.17 4,00 248.95 264.96 181.01 317.25
Part 4 157.18 4,19 147.70 165.27 91.8302 230.09
Part 5 72.3359 2,51 66.9127 76.6641 51.4983 90.6125
0,000
200,000
400,000
600,000
800,000
1000,000
Part 1Part 2Part 3Part 4Part 5
Figure C.1 Entity-Value Added Time
Page 108
90
Wait Time Minimum Maximum Minimum Maximum
Average Average Value Value
Average Half Width
Part 1 1289.23 25,35 1240.61 1331.34 970.97 1606.50
Part 2 2244.63 73,77 2048.94 2396.56 1879.91 2590.81
Part 3 2067.13 63,92 1915.82 2206.94 1654.55 2383.94
Part 4 2186.19 77,34 2006.25 2381.38 1802.57 2573.90
Part 5 2266.96 71,94 2083.52 2445.84 1890.68 2672.72
1200,000
1400,000
1600,000
1800,000
2000,000
2200,000
2400,000
Part 1Part 2Part 3Part 4Part 5
Figure C.2 Entity-Wait Time
Transfer Time Minimum Maximum Minimum Maximum
Average Average Value Value
Average Half Width
Part 1 174.98 4,30 167.27 183.69 156.83 195.14
Part 2 27.1469 0,26 26.5448 27.7745 23.9937 30.1519
Part 3 47.2340 0,55 46.3876 48.7167 43.0453 52.0912
Part 4 27.2439 0,25 26.7963 27.9240 24.2148 30.7154
Part 5 26.8100 0,31 26.0860 27.3291 23.7454 30.8853
20,000
40,000
60,000
80,000
100,000
120,000
140,000
160,000
180,000
Part 1Part 2Part 3Part 4Part 5
Figure C.3 Entity-Transfer Time
Page 109
91
Total Time Minimum Maximum Minimum Maximum
Average Average Value Value
Average Half Width
Part 1 2370.87 69,99 2184.78 2528.99 1967.93 2765.72
Part 2 2376.16 73,96 2176.66 2528.50 1984.43 2752.94
Part 3 2371.53 64,56 2218.76 2518.82 1992.46 2729.61
Part 4 2370.62 75,58 2195.82 2565.50 1973.42 2811.20
Part 5 2366.11 73,75 2176.61 2549.03 1992.37 2786.17
2366,000
2368,000
2370,000
2372,000
2374,000
2376,000
2378,000
Part 1Part 2Part 3Part 4Part 5
Figure C.4 Entity-Total Time
Process
Time per Entity
VA Time Per Entity Minimum Maximum Minimum Maximum
Average Average Value Value
Average Half Width
Cell 1 Process 9.8185 0,21 9.2783 10.1959 7.2477 11.8391
Cell 10 Process 45.7841 1,55 42.7776 49.9765 30.9991 58.7537
Cell 2 Process 10.3852 0,22 9.8936 10.9609 8.6019 12.8300
Cell 3 Process 54.3603 0,66 52.8731 55.5369 2.1895 160.83
Cell 4 Process 26.4414 0,22 25.9744 26.9445 22.1020 31.8891
Cell 5 Process 725.36 66,91 574.01 843.60 574.01 843.60
Cell 6 Process 16.1777 0,27 15.6752 16.7358 13.4167 20.6857
Cell 7 Process 9.0828 0,31 8.3516 9.8108 5.2613 11.3955
Cell 8 Process 71.5576 1,18 68.1474 73.4626 62.5028 79.4422
Cell 9 Process 14.7640 0,20 14.4223 15.1495 10.3648 19.7326
Page 110
92
0,000
100,000
200,000
300,000
400,000
500,000
600,000
700,000
800,000
Cell 1 ProcessCell 10 ProcessCell 2 ProcessCell 3 ProcessCell 4 ProcessCell 5 ProcessCell 6 ProcessCell 7 ProcessCell 8 ProcessCell 9 Process
Figure C.5 Process-VA Time (Per Entity)
Total Time Per Entity Minimum Maximum Minimum Maximum
Average Average Value Value
Average Half Width
Cell 1 Process 17.3788 3,20 12.9929 27.4544 7.2477 40.0744
Cell 10 Process 214.84 9,61 195.05 237.43 34.9146 353.12
Cell 2 Process 10.3852 0,22 9.8936 10.9609 8.6019 12.8300
Cell 3 Process 54.3603 0,66 52.8731 55.5369 2.1895 160.83
Cell 4 Process 26.4414 0,22 25.9744 26.9445 22.1020 31.8891
Cell 5 Process 725.36 66,91 574.01 843.60 574.01 843.60
Cell 6 Process 16.1777 0,27 15.6752 16.7358 13.4167 20.6857
Cell 7 Process 9.1810 0,28 8.5576 9.8108 5.2613 14.5314
Cell 8 Process 71.5576 1,18 68.1474 73.4626 62.5028 79.4422
Cell 9 Process 43.5447 0,99 41.7080 45.6272 10.4219 144.59
0,000
100,000
200,000
300,000
400,000
500,000
600,000
700,000
800,000
Cell 1 ProcessCell 10 ProcessCell 2 ProcessCell 3 ProcessCell 4 ProcessCell 5 ProcessCell 6 ProcessCell 7 ProcessCell 8 ProcessCell 9 Process
Figure C.6 Process-Total Time (Per Entity)
Page 111
93
Accumulated Time
Accum VA Time Minimum Maximum
Average Average
Average Half Width
Cell 1 Process 117.82 2,56 111.34 122.35
Cell 10 Process 549.41 18,65 513.33 599.72
Cell 2 Process 124.62 2,64 118.72 131.53
Cell 3 Process 3913.94 47,67 3806.87 3998.66
Cell 4 Process 317.30 2,65 311.69 323.33
Cell 5 Process 725.36 66,91 574.01 843.60
Cell 6 Process 194.13 3,29 188.10 200.83
Cell 7 Process 108.99 3,69 100.22 117.73
Cell 8 Process 858.69 14,14 817.77 881.55
Cell 9 Process 885.84 12,10 865.34 908.97
0,000
500,000
1000,000
1500,000
2000,000
2500,000
3000,000
3500,000
4000,000
Cell 1 ProcessCell 10 ProcessCell 2 ProcessCell 3 ProcessCell 4 ProcessCell 5 ProcessCell 6 ProcessCell 7 ProcessCell 8 ProcessCell 9 Process
Figure C.7 Acc. Time-VA Time
Page 112
94
Queue
Time
Waiting Time Minimum Maximum Minimum Maximum
Average Average Value Value
Average Half Width
Assembling.Queue 0.00 0,00 0.00 0.00 0.00 0.00
Cell 1 Process.Queue 7.5603 3,28 2.8213 18.1761 0.00 29.6363
Cell 1 Seize.Queue 1.8877 1,43 0.05422150 7.3291 0.00 29.4176
Cell 10 Process.Queue 169.05 8,47 149.21 189.79 0.00 305.50
Cell 10 Seize.Queue 57.6109 8,68 26.9862 72.6034 10.3890 161.08
Cell 2 Process.Queue 0.00 0,00 0.00 0.00 0.00 0.00
Cell 2 Seize.Queue 112.27 18,51 67.8224 156.62 46.0436 177.60
Cell 3 Process.Queue 0.00 0,00 0.00 0.00 0.00 0.00
Cell 4 Process.Queue 0.00 0,00 0.00 0.00 0.00 0.00
Cell 4 Seize.Queue 99.06 12,74 78.7022 130.16 1.1876 203.85
Cell 5 Process.Queue 0.00 0,00 0.00 0.00 0.00 0.00
Cell 6 Process.Queue 0.00 0,00 0.00 0.00 0.00 0.00
Cell 6 Seize.Queue 43.9427 10,87 20.4109 68.5200 0.00 123.89
Cell 7 Process.Queue 0.0982 0,12 0.00 0.4627 0.00 5.5523
Cell 7 Seize.Queue 16.0859 1,34 13.3646 19.1149 0.00 124.24
Cell 8 Process.Queue 0.00 0,00 0.00 0.00 0.00 0.00
Cell 8 Seize.Queue 284.45 23,31 217.27 326.35 4.9990 623.59
Cell 9 Process.Queue 28.7807 0,95 27.0686 30.6829 0.00 129.57
Cell 9 Seize.Queue 16.9075 1,26 14.5591 19.9008 0.00 112.44
Match.Queue1 0.00 0,00 0.00 0.00 0.00 0.00
Match.Queue2 1935.96 76,26 1711.86 2073.27 1689.02 2083.20
Match.Queue3 1284.39 66,74 1137.08 1419.01 875.84 1766.24
Match.Queue4 1581.12 78,21 1388.77 1752.69 1144.64 2095.56
Match.Queue5 1475.58 74,18 1268.25 1649.97 1211.15 2126.57
Sending Coating.Queue 146.87 1,79 143.26 150.37 0.00 312.28
Worker Seize 3.Queue 251.20 7,54 235.08 269.37 0.00 580.09
0,000
400,000
800,000
1200,000
1600,000
2000,000 Assembling.Queue Cell 1Process.Queue
Cell 1 Seize.Queue Cell 10Process.Queue
Cell 10Seize.Queue
Cell 2Process.Queue
Cell 2 Seize.Queue Cell 3Process.Queue
Cell 4Process.Queue Cell 4 Seize.Queue
Cell 5Process.Queue
Cell 6Process.Queue
Cell 6 Seize.Queue Cell 7Process.Queue
Cell 7 Seize.Queue Cell 8Process.Queue
Cell 8 Seize.Queue Cell 9Process.Queue
Cell 9 Seize.Queue Match.Queue1
Match.Queue2 Match.Queue3
Match.Queue4 Match.Queue5
SendingCoating.Queue
Worker Seize3.Queue
Figure C.8 Waiting Time in Queue
Page 113
95
Resource
Usage
Number Busy Minimum Maximum Minimum Maximum
Average Average Value Value
Average Half Width
Cell 1 Machine 0.04206595 0,00 0.03849521 0.04569837 0.00 1.0000
Cell 10 Machine 0.1962 0,01 0.1743 0.2124 0.00 1.0000
Cell 2 Machine 0.04448825 0,00 0.04072562 0.04707418 0.00 1.0000
Cell 3 New 0.2618 0,01 0.2417 0.2800 0.00 1.0000
Cell 3 Old 1 0.2845 0,02 0.2429 0.3079 0.00 1.0000
Cell 3 Old 2 0.2841 0,01 0.2456 0.3057 0.00 1.0000
Cell 3 Old 3 0.2833 0,02 0.2555 0.3103 0.00 1.0000
Cell 3 Old 4 0.2848 0,02 0.2553 0.3140 0.00 1.0000
Cell 4 Machine 0.1133 0,00 0.1058 0.1211 0.00 1.0000
Cell 5 Machine 0.2578 0,02 0.2150 0.2825 0.00 1.0000
Cell 6 Machine 0.06939450 0,00 0.06270093 0.07521695 0.00 1.0000
Cell 7 Machine 0.03894491 0,00 0.03340633 0.04227824 0.00 1.0000
Cell 8 Machine 0.3067 0,01 0.2830 0.3283 0.00 1.0000
Cell 9 Machine 0.3165 0,01 0.2884 0.3404 0.00 1.0000
Worker 1 0.5205 0,02 0.4627 0.5601 0.00 1.0000
Worker 2 0.4768 0,03 0.4086 0.5561 0.00 1.0000
Worker 3 0.4844 0,02 0.4336 0.5298 0.00 1.0000
Worker 4 0.4967 0,03 0.4088 0.5400 0.00 1.0000
Worker 5 0.4251 0,03 0.3852 0.5145 0.00 1.0000
Worker 6 0.4706 0,02 0.4250 0.5107 0.00 1.0000
Worker 7 0.5468 0,02 0.5031 0.5840 0.00 1.0000
Worker 8 0.2741 0,01 0.2470 0.3019 0.00 1.0000
Worker 9 0.2047 0,02 0.1758 0.2674 0.00 1.0000
0,000
0,100
0,200
0,300
0,400
0,500
0,600
Cell 1 MachineCell 10 MachineCell 2 MachineCell 3 NewCell 3 Old 1Cell 3 Old 2Cell 3 Old 3Cell 3 Old 4Cell 4 MachineCell 5 MachineCell 6 MachineCell 7 MachineCell 8 MachineCell 9 MachineWorker 1Worker 2Worker 3Worker 4Worker 5Worker 6Worker 7Worker 8Worker 9
Figure C.9 Number of Busy Status
Page 114
96
Total Number Seized Minimum Maximum
Average Average
Average Half Width
Cell 1 Machine 12.0000 0,00 12.0000 12.0000
Cell 10 Machine 12.0000 0,00 12.0000 12.0000
Cell 2 Machine 12.0000 0,00 12.0000 12.0000
Cell 3 New 34.3000 2,50 28.0000 40.0000
Cell 3 Old 1 10.1000 1,56 7.0000 14.0000
Cell 3 Old 2 9.4000 0,97 7.0000 11.0000
Cell 3 Old 3 9.2000 1,16 8.0000 12.0000
Cell 3 Old 4 9.0000 1,26 6.0000 11.0000
Cell 4 Machine 12.0000 0,00 12.0000 12.0000
Cell 5 Machine 1.0000 0,00 1.0000 1.0000
Cell 6 Machine 12.0000 0,00 12.0000 12.0000
Cell 7 Machine 12.0000 0,00 12.0000 12.0000
Cell 8 Machine 12.0000 0,00 12.0000 12.0000
Cell 9 Machine 60.0000 0,00 60.0000 60.0000
Worker 1 29.3000 9,19 17.0000 50.0000
Worker 2 17.6000 6,26 13.0000 42.0000
Worker 3 15.6000 6,45 10.0000 41.0000
Worker 4 16.9000 6,57 10.0000 35.0000
Worker 5 18.4000 7,85 9.0000 41.0000
Worker 6 41.7000 1,07 40.0000 44.0000
Worker 7 24.9000 0,79 23.0000 27.0000
Worker 8 27.3000 0,59 26.0000 29.0000
Worker 9 24.3000 0,83 23.0000 26.0000
0,000
10,000
20,000
30,000
40,000
50,000
60,000
Cell 1 MachineCell 10 MachineCell 2 MachineCell 3 NewCell 3 Old 1Cell 3 Old 2Cell 3 Old 3Cell 3 Old 4Cell 4 MachineCell 5 MachineCell 6 MachineCell 7 MachineCell 8 MachineCell 9 MachineWorker 1Worker 2Worker 3Worker 4Worker 5Worker 6Worker 7Worker 8Worker 9
Figure C.10 Total Number Seized (Resources)
Page 115
97
C.2 Statistical Results of “FIFO” Experiment (Time units: Minute)
Entity
Time
VA Time Minimum Maximum Minimum Maximum
Average Average Value Value
Average Half Width
Part 1 899.19 76,56 754.27 1097.23 711.93 1151.96
Part 2 104.58 5,86 89.5653 115.46 66.4546 141.39
Part 3 244.54 8,90 228.53 268.11 171.04 316.26
Part 4 161.28 10,79 133.19 185.11 91.0010 219.97
Part 5 72.6920 1,94 68.4945 76.4258 48.5268 96.8139
0,000
200,000
400,000
600,000
800,000
1000,000
Part 1Part 2Part 3Part 4Part 5
Figure C.11 Entity-Value Added Time
Page 116
98
Wait Time Minimum Maximum Minimum Maximum
Average Average Value Value
Average Half Width
Part 1 1096.89 24,10 1066.96 1165.88 775.21 1472.48
Part 2 2043.19 86,35 1903.83 2297.65 1699.68 2492.13
Part 3 1886.17 93,62 1726.47 2144.83 1525.48 2354.34
Part 4 1984.99 84,06 1834.24 2241.21 1676.76 2393.06
Part 5 2068.99 92,48 1880.42 2333.90 1738.26 2536.64
1000,000
1200,000
1400,000
1600,000
1800,000
2000,000
2200,000
Part 1Part 2Part 3Part 4Part 5
Figure C.12 Entity-Wait Time
Transfer Time Minimum Maximum Minimum Maximum
Average Average Value Value
Average Half Width
Part 1 174.29 3,53 167.65 183.47 158.38 193.62
Part 2 27.0021 0,23 26.4316 27.6021 23.7739 31.5931
Part 3 47.2090 0,44 46.3365 48.0856 42.8026 51.4526
Part 4 27.1930 0,31 26.5079 27.7697 24.1868 30.6048
Part 5 26.9492 0,23 26.1754 27.3029 23.1966 30.4493
20,000
40,000
60,000
80,000
100,000
120,000
140,000
160,000
180,000
Part 1Part 2Part 3Part 4Part 5
Figure C.13 Entity-Transfer Time
Page 117
99
Total Time Minimum Maximum Minimum Maximum
Average Average Value Value
Average Half Width
Part 1 2170.37 90,26 2016.87 2435.50 1757.30 2693.01
Part 2 2174.77 88,02 2041.39 2435.81 1834.82 2628.86
Part 3 2177.92 90,17 2025.25 2433.03 1835.35 2621.92
Part 4 2173.46 84,03 2033.60 2418.68 1835.48 2605.93
Part 5 2168.63 92,39 1984.02 2437.05 1835.06 2625.79
2168,000
2170,000
2172,000
2174,000
2176,000
2178,000
Part 1Part 2Part 3Part 4Part 5
Figure C.14 Entity-Total Time
Process
Time per Entity
VA Time Per Entity Minimum Maximum Minimum Maximum
Average Average Value Value
Average Half Width
Cell 1 Process 9.8916 0,29 9.1266 10.4523 7.2477 11.8375
Cell 10 Process 43.2486 1,36 40.4138 46.2739 31.2931 58.7703
Cell 2 Process 10.1689 0,23 9.6451 10.7015 8.2762 12.3591
Cell 3 Process 53.9265 0,26 53.3301 54.3116 2.1818 163.68
Cell 4 Process 26.5040 0,28 25.7441 26.9779 22.2580 31.7334
Cell 5 Process 724.86 77,02 574.61 921.25 574.61 921.25
Cell 6 Process 16.3889 0,22 15.9118 16.8848 13.7156 20.4682
Cell 7 Process 8.7797 0,32 8.3675 9.6042 5.3566 11.5503
Cell 8 Process 71.0823 0,98 69.0980 73.5098 61.6205 79.1723
Cell 9 Process 14.9636 0,09 14.8512 15.2914 10.1405 19.7326
Page 118
100
0,000
100,000
200,000
300,000
400,000
500,000
600,000
700,000
800,000
Cell 1 ProcessCell 10 ProcessCell 2 ProcessCell 3 ProcessCell 4 ProcessCell 5 ProcessCell 6 ProcessCell 7 ProcessCell 8 ProcessCell 9 Process
Figure C.15 Process-VA Time (Per Entity)
Total Time Per Entity Minimum Maximum Minimum Maximum
Average Average Value Value
Average Half Width
Cell 1 Process 19.0909 2,35 14.5239 25.9779 7.2477 40.0744
Cell 10 Process 200.41 8,61 174.23 216.57 39.0839 329.51
Cell 2 Process 10.1689 0,23 9.6451 10.7015 8.2762 12.3591
Cell 3 Process 53.9265 0,26 53.3301 54.3116 2.1818 163.68
Cell 4 Process 26.5040 0,28 25.7441 26.9779 22.2580 31.7334
Cell 5 Process 724.86 77,02 574.61 921.25 574.61 921.25
Cell 6 Process 16.3889 0,22 15.9118 16.8848 13.7156 20.4682
Cell 7 Process 8.7797 0,32 8.3675 9.6042 5.3566 11.5503
Cell 8 Process 71.0823 0,98 69.0980 73.5098 61.6205 79.1723
Cell 9 Process 40.5685 1,96 36.6917 44.8125 10.3123 144.59
0,000
100,000
200,000
300,000
400,000
500,000
600,000
700,000
800,000
Cell 1 ProcessCell 10 ProcessCell 2 ProcessCell 3 ProcessCell 4 ProcessCell 5 ProcessCell 6 ProcessCell 7 ProcessCell 8 ProcessCell 9 Process
Figure C.16 Process-Total Time (Per Entity)
Page 119
101
Accumulated Time
Accum VA Time Minimum Maximum
Average Average
Average Half Width
Cell 1 Process 118.70 3,49 109.52 125.43
Cell 10 Process 518.98 16,28 484.97 555.29
Cell 2 Process 122.03 2,74 115.74 128.42
Cell 3 Process 3882.71 18,43 3839.77 3910.44
Cell 4 Process 318.05 3,40 308.93 323.73
Cell 5 Process 724.86 77,02 574.61 921.25
Cell 6 Process 196.67 2,66 190.94 202.62
Cell 7 Process 105.36 3,78 100.41 115.25
Cell 8 Process 852.99 11,71 829.18 882.12
Cell 9 Process 897.82 5,62 891.07 917.49
0,000
500,000
1000,000
1500,000
2000,000
2500,000
3000,000
3500,000
4000,000
Cell 1 ProcessCell 10 ProcessCell 2 ProcessCell 3 ProcessCell 4 ProcessCell 5 ProcessCell 6 ProcessCell 7 ProcessCell 8 ProcessCell 9 Process
Figure C.17 Acc. Time-VA Time
Page 120
102
Queue
Time
Waiting Time Minimum Maximum Minimum Maximum
Average Average Value Value
Average Half Width
Assembling.Queue 0.00 0,00 0.00 0.00 0.00 0.00
Cell 1 Process.Queue 9.1993 2,48 5.2457 16.8513 0.00 29.6363
Cell 1 Seize.Queue 2.6304 2,04 0.3041 8.5332 0.00 36.3656
Cell 10 Process.Queue 157.16 7,56 132.57 170.29 0.00 285.54
Cell 10 Seize.Queue 53.3867 7,18 25.4302 60.7270 12.2516 131.29
Cell 2 Process.Queue 0.00 0,00 0.00 0.00 0.00 0.00
Cell 2 Seize.Queue 10.9598 4,53 4.6173 27.6063 0.00 77.1093
Cell 3 Process.Queue 0.00 0,00 0.00 0.00 0.00 0.00
Cell 4 Process.Queue 0.00 0,00 0.00 0.00 0.00 0.00
Cell 4 Seize.Queue 39.3009 10,39 20.8226 71.8776 0.00 144.44
Cell 5 Process.Queue 0.00 0,00 0.00 0.00 0.00 0.00
Cell 6 Process.Queue 0.00 0,00 0.00 0.00 0.00 0.00
Cell 6 Seize.Queue 34.4766 9,38 13.0140 55.4004 0.00 91.1284
Cell 7 Process.Queue 0.00 0,00 0.00 0.00 0.00 0.00
Cell 7 Seize.Queue 11.5151 3,93 3.7100 24.7263 0.00 82.2914
Cell 8 Process.Queue 0.00 0,00 0.00 0.00 0.00 0.00
Cell 8 Seize.Queue 151.41 24,15 84.9378 203.57 0.00 406.07
Cell 9 Process.Queue 25.6048 1,96 21.7497 29.9010 0.00 129.57
Cell 9 Seize.Queue 9.8119 3,71 2.2948 18.4932 0.00 85.4239
Match.Queue1 0.00 0,00 0.00 0.00 0.00 0.00
Match.Queue2 1603.78 99,83 1470.05 1876.94 1231.37 1964.86
Match.Queue3 1133.81 96,10 963.87 1371.30 647.20 1734.21
Match.Queue4 1549.10 82,67 1360.57 1751.19 1212.64 2006.52
Match.Queue5 1602.14 113,56 1315.37 1909.44 1198.83 2040.34
Sending Coating.Queue 175.32 8,38 156.25 189.94 0.00 633.72
Worker Seize 3.Queue 221.74 10,21 199.00 247.48 0.00 507.41
0,000
200,000
400,000
600,000
800,000
1000,000
1200,000
1400,000
1600,000
1800,000 Assembling.Queue Cell 1Process.Queue
Cell 1 Seize.Queue Cell 10Process.Queue
Cell 10Seize.Queue
Cell 2Process.Queue
Cell 2 Seize.Queue Cell 3Process.Queue
Cell 4Process.Queue Cell 4 Seize.Queue
Cell 5Process.Queue
Cell 6Process.Queue
Cell 6 Seize.Queue Cell 7Process.Queue
Cell 7 Seize.Queue Cell 8Process.Queue
Cell 8 Seize.Queue Cell 9Process.Queue
Cell 9 Seize.Queue Match.Queue1
Match.Queue2 Match.Queue3
Match.Queue4 Match.Queue5
SendingCoating.Queue
Worker Seize3.Queue
Figure C.18 Waiting Time in Queue
Page 121
103
Resource
Usage
Number Busy Minimum Maximum Minimum Maximum
Average Average Value Value
Average Half Width
Cell 1 Machine 0.04602584 0,00 0.03995802 0.05226155 0.00 1.0000
Cell 10 Machine 0.2011 0,01 0.1728 0.2248 0.00 1.0000
Cell 2 Machine 0.04732111 0,00 0.03918250 0.05350735 0.00 1.0000
Cell 3 New 0.2871 0,01 0.2519 0.3082 0.00 1.0000
Cell 3 Old 1 0.3063 0,02 0.2642 0.3437 0.00 1.0000
Cell 3 Old 2 0.3066 0,02 0.2694 0.3435 0.00 1.0000
Cell 3 Old 3 0.2998 0,02 0.2452 0.3476 0.00 1.0000
Cell 3 Old 4 0.3042 0,02 0.2494 0.3477 0.00 1.0000
Cell 4 Machine 0.1232 0,01 0.1079 0.1344 0.00 1.0000
Cell 5 Machine 0.2781 0,02 0.2394 0.3071 0.00 1.0000
Cell 6 Machine 0.07612542 0,00 0.06592406 0.08222363 0.00 1.0000
Cell 7 Machine 0.04073814 0,00 0.03760961 0.04606951 0.00 1.0000
Cell 8 Machine 0.3304 0,02 0.2822 0.3626 0.00 1.0000
Cell 9 Machine 0.3476 0,02 0.2996 0.3736 0.00 1.0000
Worker 1 0.5235 0,03 0.4385 0.5727 0.00 1.0000
Worker 2 0.4740 0,02 0.4103 0.5187 0.00 1.0000
Worker 3 0.5019 0,03 0.4393 0.5610 0.00 1.0000
Worker 4 0.5087 0,05 0.3858 0.5928 0.00 1.0000
Worker 5 0.4237 0,03 0.3656 0.4818 0.00 1.0000
Worker 6 0.5131 0,03 0.4409 0.5634 0.00 1.0000
Worker 7 0.5809 0,04 0.5240 0.6705 0.00 1.0000
Worker 8 0.3050 0,02 0.2789 0.3633 0.00 1.0000
Worker 9 0.2530 0,02 0.2152 0.3021 0.00 1.0000
0,000
0,100
0,200
0,300
0,400
0,500
0,600
Cell 1 MachineCell 10 MachineCell 2 MachineCell 3 NewCell 3 Old 1Cell 3 Old 2Cell 3 Old 3Cell 3 Old 4Cell 4 MachineCell 5 MachineCell 6 MachineCell 7 MachineCell 8 MachineCell 9 MachineWorker 1Worker 2Worker 3Worker 4Worker 5Worker 6Worker 7Worker 8Worker 9
Figure C.19 Number of Busy Status
Page 122
104
Total Number Seized Minimum Maximum
Average Average
Average Half Width
Cell 1 Machine 12.0000 0,00 12.0000 12.0000
Cell 10 Machine 12.0000 0,00 12.0000 12.0000
Cell 2 Machine 12.0000 0,00 12.0000 12.0000
Cell 3 New 31.4000 2,08 25.0000 35.0000
Cell 3 Old 1 10.2000 1,30 7.0000 12.0000
Cell 3 Old 2 10.1000 1,53 7.0000 14.0000
Cell 3 Old 3 11.1000 1,28 9.0000 14.0000
Cell 3 Old 4 9.2000 1,30 6.0000 11.0000
Cell 4 Machine 12.0000 0,00 12.0000 12.0000
Cell 5 Machine 1.0000 0,00 1.0000 1.0000
Cell 6 Machine 12.0000 0,00 12.0000 12.0000
Cell 7 Machine 12.0000 0,00 12.0000 12.0000
Cell 8 Machine 12.0000 0,00 12.0000 12.0000
Cell 9 Machine 60.0000 0,00 60.0000 60.0000
Worker 1 27.0000 7,80 14.0000 39.0000
Worker 2 17.2000 6,41 10.0000 39.0000
Worker 3 13.3000 1,58 10.0000 17.0000
Worker 4 13.9000 1,53 11.0000 17.0000
Worker 5 19.5000 7,30 10.0000 35.0000
Worker 6 45.3000 1,17 42.0000 48.0000
Worker 7 23.2000 1,16 21.0000 26.0000
Worker 8 29.8000 1,11 27.0000 31.0000
Worker 9 26.8000 0,94 25.0000 29.0000
0,000
10,000
20,000
30,000
40,000
50,000
60,000
Cell 1 MachineCell 10 MachineCell 2 MachineCell 3 NewCell 3 Old 1Cell 3 Old 2Cell 3 Old 3Cell 3 Old 4Cell 4 MachineCell 5 MachineCell 6 MachineCell 7 MachineCell 8 MachineCell 9 MachineWorker 1Worker 2Worker 3Worker 4Worker 5Worker 6Worker 7Worker 8Worker 9
Figure C.20 Total Number Seized (Resources)
Page 123
105
C.3 Statistical Results of “LPT” Experiment (Time units: Minute)
Entity Time
VA Time Minimum Maximum Minimum Maximum
Average Average Value Value
Average Half Width
Part 1 834.09 92,05 664.03 1021.83 612.91 1051.68
Part 2 103.43 2,49 99.12 110.93 66.4833 141.43
Part 3 250.35 7,81 236.51 270.18 177.55 314.86
Part 4 161.84 10,92 133.88 180.44 90.9149 229.83
Part 5 71.1902 1,90 67.1710 74.8541 52.3367 91.4705
0,000
100,000
200,000
300,000
400,000
500,000
600,000
700,000
800,000
900,000
Part 1Part 2Part 3Part 4Part 5
Figure C.21 Entity-Value Added Time
Page 124
106
Wait Time Minimum Maximum Minimum Maximum
Average Average Value Value
Average Half Width
Part 1 1359.45 20,65 1317.51 1403.63 1052.78 1734.46
Part 2 2240.33 82,01 2097.18 2394.43 1865.14 2615.74
Part 3 2075.22 76,28 1923.00 2234.69 1676.35 2474.50
Part 4 2179.36 87,34 2011.64 2348.94 1842.33 2558.63
Part 5 2263.57 69,55 2128.43 2408.36 1896.70 2650.48
1200,000
1400,000
1600,000
1800,000
2000,000
2200,000
2400,000
Part 1Part 2Part 3Part 4Part 5
Figure C.22 Entity-Wait Time
Transfer Time Minimum Maximum Minimum Maximum
Average Average Value Value
Average Half Width
Part 1 171.76 2,86 165.95 179.34 157.97 190.46
Part 2 27.2115 0,25 26.7483 27.8099 24.5772 31.4286
Part 3 46.8610 0,25 46.3452 47.4245 41.9606 51.9621
Part 4 26.9428 0,24 26.4290 27.5911 23.3938 29.7942
Part 5 26.8869 0,46 25.7572 27.6244 23.1377 30.6754
20,000
40,000
60,000
80,000
100,000
120,000
140,000
160,000
180,000
Part 1Part 2Part 3Part 4Part 5
Figure C.23 Entity-Transfer Time
Page 125
107
Total Time Minimum Maximum Minimum Maximum
Average Average Value Value
Average Half Width
Part 1 2365.30 78,79 2220.29 2526.13 1971.22 2818.39
Part 2 2370.98 83,00 2224.92 2526.58 2014.08 2759.73
Part 3 2372.42 80,10 2213.11 2533.03 1994.46 2819.07
Part 4 2368.14 81,64 2204.00 2515.91 1974.53 2776.45
Part 5 2361.65 68,70 2227.89 2508.32 1990.67 2749.84
2360,000
2362,000
2364,000
2366,000
2368,000
2370,000
2372,000
2374,000
Part 1Part 2Part 3Part 4Part 5
Figure C.24 Entity-Total Time
Process
Time per Entity
VA Time Per Entity Minimum Maximum Minimum Maximum
Average Average Value Value
Average Half Width
Cell 1 Process 9.8853 0,27 9.1266 10.3895 7.2477 11.8375
Cell 10 Process 45.0453 1,04 43.2120 47.1681 33.8167 56.9494
Cell 2 Process 10.2998 0,28 9.4181 10.8156 8.1664 12.3887
Cell 3 Process 54.8115 0,33 54.1431 55.5945 2.3663 160.83
Cell 4 Process 26.3116 0,42 25.5116 27.2520 22.2580 31.7146
Cell 5 Process 648.47 92,55 475.73 836.75 475.73 836.75
Cell 6 Process 16.1299 0,39 15.1030 16.8753 13.3859 20.1673
Cell 7 Process 8.9082 0,20 8.5592 9.4144 5.9743 11.7557
Cell 8 Process 71.7930 0,58 70.6200 73.2115 60.2889 79.5464
Cell 9 Process 15.0016 0,18 14.5434 15.3595 10.2575 19.7326
Page 126
108
0,000
100,000
200,000
300,000
400,000
500,000
600,000
700,000
Cell 1 ProcessCell 10 ProcessCell 2 ProcessCell 3 ProcessCell 4 ProcessCell 5 ProcessCell 6 ProcessCell 7 ProcessCell 8 ProcessCell 9 Process
Figure C.25 Process-VA Time (Per Entity)
Total Time Per Entity Minimum Maximum Minimum Maximum
Average Average Value Value
Average Half Width
Cell 1 Process 19.5211 2,41 16.7055 27.5971 7.2477 40.0744
Cell 10 Process 207.84 7,79 185.47 220.74 37.7737 338.30
Cell 2 Process 10.2998 0,28 9.4181 10.8156 8.1664 12.3887
Cell 3 Process 54.8115 0,33 54.1431 55.5945 2.3663 160.83
Cell 4 Process 26.3116 0,42 25.5116 27.2520 22.2580 31.7146
Cell 5 Process 648.47 92,55 475.73 836.75 475.73 836.75
Cell 6 Process 16.1299 0,39 15.1030 16.8753 13.3859 20.1673
Cell 7 Process 8.9849 0,20 8.5592 9.4144 5.9743 13.0568
Cell 8 Process 71.7930 0,58 70.6200 73.2115 60.2889 79.5464
Cell 9 Process 56.8726 1,73 54.1037 61.0516 10.4764 144.59
0,000
100,000
200,000
300,000
400,000
500,000
600,000
700,000
Cell 1 ProcessCell 10 ProcessCell 2 ProcessCell 3 ProcessCell 4 ProcessCell 5 ProcessCell 6 ProcessCell 7 ProcessCell 8 ProcessCell 9 Process
Figure C.26 Process-Total Time (Per Entity)
Page 127
109
Accumulated Time
Accum VA Time Minimum Maximum
Average Average
Average Half Width
Cell 1 Process 118.62 3,22 109.52 124.67
Cell 10 Process 540.54 12,48 518.54 566.02
Cell 2 Process 123.60 3,37 113.02 129.79
Cell 3 Process 3946.43 23,58 3898.31 4002.80
Cell 4 Process 315.74 5,06 306.14 327.02
Cell 5 Process 648.47 92,55 475.73 836.75
Cell 6 Process 193.56 4,74 181.24 202.50
Cell 7 Process 106.90 2,44 102.71 112.97
Cell 8 Process 861.52 7,00 847.44 878.54
Cell 9 Process 900.10 10,73 872.60 921.57
0,000
500,000
1000,000
1500,000
2000,000
2500,000
3000,000
3500,000
4000,000
Cell 1 ProcessCell 10 ProcessCell 2 ProcessCell 3 ProcessCell 4 ProcessCell 5 ProcessCell 6 ProcessCell 7 ProcessCell 8 ProcessCell 9 Process
Figure C.27 Acc. Time-VA Time
Page 128
110
Queue Time
Waiting Time Minimum Maximum Minimum Maximum
Average Average Value Value
Average Half Width
Assembling.Queue 0.00 0,00 0.00 0.00 0.00 0.00
Cell 1 Process.Queue 9.6358 2,54 7.0203 18.4705 0.00 29.7453
Cell 1 Seize.Queue 1.1414 1,46 0.00 6.8416 0.00 28.0363
Cell 10 Process.Queue 162.80 6,93 142.26 173.57 0.00 296.33
Cell 10 Seize.Queue 55.8379 7,91 26.5668 65.2487 4.9093 153.18
Cell 2 Process.Queue 0.00 0,00 0.00 0.00 0.00 0.00
Cell 2 Seize.Queue 3.3244 1,37 1.7174 7.0431 0.00 38.3241
Cell 3 Process.Queue 0.00 0,00 0.00 0.00 0.00 0.00
Cell 4 Process.Queue 0.00 0,00 0.00 0.00 0.00 0.00
Cell 4 Seize.Queue 44.3412 5,48 33.4935 59.6733 0.00 129.26
Cell 5 Process.Queue 0.00 0,00 0.00 0.00 0.00 0.00
Cell 6 Process.Queue 0.00 0,00 0.00 0.00 0.00 0.00
Cell 6 Seize.Queue 194.31 23,83 126.39 240.29 0.00 350.65
Cell 7 Process.Queue 0.07672821 0,10 0.00 0.3507 0.00 4.2078
Cell 7 Seize.Queue 22.1177 3,03 13.7867 27.8230 0.00 146.15
Cell 8 Process.Queue 0.00 0,00 0.00 0.00 0.00 0.00
Cell 8 Seize.Queue 212.79 25,53 175.09 285.19 0.00 539.07
Cell 9 Process.Queue 41.8710 1,67 39.0878 45.8704 0.00 129.57
Cell 9 Seize.Queue 14.5212 2,20 11.0651 19.8698 0.00 138.31
Match.Queue1 0.00 0,00 0.00 0.00 0.00 0.00
Match.Queue2 1548.37 102,45 1356.93 1749.12 1173.67 2134.62
Match.Queue3 1334.25 85,88 1169.96 1498.12 893.00 1899.30
Match.Queue4 1800.59 80,96 1659.22 1934.33 1405.89 2099.61
Match.Queue5 1437.32 110,43 1236.28 1669.51 1143.94 2161.95
Sending Coating.Queue 191.81 12,92 170.81 214.39 0.00 743.60
Worker Seize 3.Queue 291.09 10,25 268.73 314.74 0.00 650.98
0,000
400,000
800,000
1200,000
1600,000
2000,000 Assembling.Queue Cell 1Process.Queue
Cell 1 Seize.Queue Cell 10Process.Queue
Cell 10Seize.Queue
Cell 2Process.Queue
Cell 2 Seize.Queue Cell 3Process.Queue
Cell 4Process.Queue Cell 4 Seize.Queue
Cell 5Process.Queue
Cell 6Process.Queue
Cell 6 Seize.Queue Cell 7Process.Queue
Cell 7 Seize.Queue Cell 8Process.Queue
Cell 8 Seize.Queue Cell 9Process.Queue
Cell 9 Seize.Queue Match.Queue1
Match.Queue2 Match.Queue3
Match.Queue4 Match.Queue5
SendingCoating.Queue
Worker Seize3.Queue
Figure C.28 Waiting Time in Queue
Page 129
111
Resource Usage
Number Busy Minimum Maximum Minimum Maximum
Average Average Value Value
Average Half Width
Cell 1 Machine 0.04242394 0,00 0.03852163 0.04669416 0.00 1.0000
Cell 10 Machine 0.1935 0,01 0.1731 0.2120 0.00 1.0000
Cell 2 Machine 0.04421608 0,00 0.03767254 0.04860949 0.00 1.0000
Cell 3 New 0.2560 0,01 0.2315 0.2787 0.00 1.0000
Cell 3 Old 1 0.2911 0,02 0.2519 0.3131 0.00 1.0000
Cell 3 Old 2 0.2881 0,01 0.2700 0.3147 0.00 1.0000
Cell 3 Old 3 0.2866 0,01 0.2695 0.3087 0.00 1.0000
Cell 3 Old 4 0.2896 0,02 0.2491 0.3179 0.00 1.0000
Cell 4 Machine 0.1129 0,00 0.1038 0.1210 0.00 1.0000
Cell 5 Machine 0.2298 0,03 0.1782 0.2789 0.00 1.0000
Cell 6 Machine 0.06917913 0,00 0.06441149 0.07500140 0.00 1.0000
Cell 7 Machine 0.03822276 0,00 0.03480842 0.04153037 0.00 1.0000
Cell 8 Machine 0.3081 0,01 0.2835 0.3276 0.00 1.0000
Cell 9 Machine 0.3218 0,01 0.2938 0.3412 0.00 1.0000
Worker 1 0.5730 0,03 0.5086 0.6371 0.00 1.0000
Worker 2 0.5365 0,04 0.4698 0.5979 0.00 1.0000
Worker 3 0.5614 0,03 0.4912 0.6160 0.00 1.0000
Worker 4 0.5594 0,03 0.4954 0.6157 0.00 1.0000
Worker 5 0.4776 0,03 0.4305 0.5231 0.00 1.0000
Worker 6 0.4808 0,03 0.4312 0.5404 0.00 1.0000
Worker 7 0.5150 0,02 0.4761 0.5526 0.00 1.0000
Worker 8 0.2714 0,02 0.2353 0.3025 0.00 1.0000
Worker 9 0.2081 0,02 0.1678 0.2733 0.00 1.0000
0,000
0,100
0,200
0,300
0,400
0,500
0,600
Cell 1 MachineCell 10 MachineCell 2 MachineCell 3 NewCell 3 Old 1Cell 3 Old 2Cell 3 Old 3Cell 3 Old 4Cell 4 MachineCell 5 MachineCell 6 MachineCell 7 MachineCell 8 MachineCell 9 MachineWorker 1Worker 2Worker 3Worker 4Worker 5Worker 6Worker 7Worker 8Worker 9
Figure C.29 Number of Busy Status
Page 130
112
Total Number Seized Minimum Maximum
Average Average
Average Half Width
Cell 1 Machine 12.0000 0,00 12.0000 12.0000
Cell 10 Machine 12.0000 0,00 12.0000 12.0000
Cell 2 Machine 12.0000 0,00 12.0000 12.0000
Cell 3 New 32.4000 0,90 30.0000 34.0000
Cell 3 Old 1 10.4000 0,84 8.0000 12.0000
Cell 3 Old 2 10.1000 0,63 9.0000 11.0000
Cell 3 Old 3 9.7000 0,48 9.0000 11.0000
Cell 3 Old 4 9.4000 0,69 8.0000 11.0000
Cell 4 Machine 12.0000 0,00 12.0000 12.0000
Cell 5 Machine 1.0000 0,00 1.0000 1.0000
Cell 6 Machine 12.0000 0,00 12.0000 12.0000
Cell 7 Machine 12.0000 0,00 12.0000 12.0000
Cell 8 Machine 12.0000 0,00 12.0000 12.0000
Cell 9 Machine 60.0000 0,00 60.0000 60.0000
Worker 1 28.5000 7,65 18.0000 41.0000
Worker 2 19.0000 4,94 14.0000 38.0000
Worker 3 16.0000 0,83 14.0000 18.0000
Worker 4 16.3000 1,39 15.0000 20.0000
Worker 5 23.9000 8,41 14.0000 39.0000
Worker 6 42.3000 1,22 40.0000 45.0000
Worker 7 22.5000 0,38 22.0000 23.0000
Worker 8 26.3000 1,01 24.0000 28.0000
Worker 9 21.2000 0,74 20.0000 23.0000
0,000
10,000
20,000
30,000
40,000
50,000
60,000
Cell 1 MachineCell 10 MachineCell 2 MachineCell 3 NewCell 3 Old 1Cell 3 Old 2Cell 3 Old 3Cell 3 Old 4Cell 4 MachineCell 5 MachineCell 6 MachineCell 7 MachineCell 8 MachineCell 9 MachineWorker 1Worker 2Worker 3Worker 4Worker 5Worker 6Worker 7Worker 8Worker 9
Figure C.30 Total Number Seized (Resources)
Page 131
113
C.4 Statistical Results of “SPT” Experiment (Time units: Minute)
Entity
Time
VA Time Minimum Maximum Minimum Maximum
Average Average Value Value
Average Half Width
Part 1 963.31 123,44 768.39 1236.55 715.34 1274.23
Part 2 107.48 2,79 102.66 114.17 62.3582 135.86
Part 3 243.28 8,94 233.03 272.02 176.79 312.67
Part 4 165.37 9,54 144.64 181.32 89.4096 230.75
Part 5 72.4923 1,89 69.9560 77.3442 50.8373 90.8096
0,000
200,000
400,000
600,000
800,000
1000,000
Part 1Part 2Part 3Part 4Part 5
Figure C.31 Entity-Value Added Time
Page 132
114
Wait Time Minimum Maximum Minimum Maximum
Average Average Value Value
Average Half Width
Part 1 842.82 28,65 788.29 905.41 507.74 1246.30
Part 2 1851.24 117,99 1664.18 2085.35 1464.52 2345.69
Part 3 1695.76 112,99 1518.23 1922.04 1268.33 2150.34
Part 4 1791.71 128,66 1584.24 2096.57 1392.40 2295.52
Part 5 1879.79 111,70 1713.74 2154.71 1501.97 2349.95
800,000
1000,000
1200,000
1400,000
1600,000
1800,000
2000,000
Part 1Part 2Part 3Part 4Part 5
Figure C.32 Entity-Wait Time
Transfer Time Minimum Maximum Minimum Maximum
Average Average Value Value
Average Half Width
Part 1 174.69 1,99 170.97 178.16 161.72 188.76
Part 2 27.0608 0,28 26.4192 27.6557 23.5437 31.0411
Part 3 47.1873 0,39 46.1519 48.0283 42.8284 50.7811
Part 4 27.0681 0,28 26.5564 27.6688 23.8761 29.9698
Part 5 26.8090 0,21 26.1915 27.1985 23.3595 30.6498
20,000
40,000
60,000
80,000
100,000
120,000
140,000
160,000
180,000
Part 1Part 2Part 3Part 4Part 5
Figure C.33 Entity-Transfer Time
Page 133
115
Total Time Minimum Maximum Minimum Maximum
Average Average Value Value
Average Half Width
Part 1 1980.82 115,52 1799.95 2227.94 1560.49 2504.14
Part 2 1985.78 118,60 1802.12 2221.53 1598.59 2501.97
Part 3 1986.23 114,03 1807.42 2227.61 1501.77 2429.81
Part 4 1984.14 125,81 1778.23 2268.88 1549.43 2472.55
Part 5 1979.09 111,40 1818.29 2254.61 1599.45 2459.07
1979,000
1980,000
1981,000
1982,000
1983,000
1984,000
1985,000
1986,000
1987,000
Part 1Part 2Part 3Part 4Part 5
Figure C.34 Entity-Total Time
Process
Time per Entity
VA Time Per Entity Minimum Maximum Minimum Maximum
Average Average Value Value
Average Half Width
Cell 1 Process 9.8251 0,29 9.2783 10.6049 7.2477 11.8375
Cell 10 Process 43.8706 1,29 40.6872 47.2828 31.8357 57.4432
Cell 2 Process 10.3535 0,18 10.0757 10.8262 8.4289 12.3244
Cell 3 Process 56.2461 0,55 55.0253 57.5691 2.1818 163.50
Cell 4 Process 26.6081 0,53 25.1841 27.6701 22.3233 31.3075
Cell 5 Process 777.27 123,75 574.68 1050.09 574.68 1050.09
Cell 6 Process 16.1985 0,38 15.5037 17.1940 13.6076 19.7220
Cell 7 Process 8.6818 0,30 8.0920 9.5201 5.2423 11.4853
Cell 8 Process 71.6199 1,29 69.5691 74.5526 60.3102 79.0853
Cell 9 Process 14.9092 0,17 14.5559 15.2515 10.1180 19.7326
Page 134
116
0,000
100,000
200,000
300,000
400,000
500,000
600,000
700,000
800,000
Cell 1 ProcessCell 10 ProcessCell 2 ProcessCell 3 ProcessCell 4 ProcessCell 5 ProcessCell 6 ProcessCell 7 ProcessCell 8 ProcessCell 9 Process
Figure C.35 Process-VA Time (Per Entity)
Total Time Per Entity Minimum Maximum Minimum Maximum
Average Average Value Value
Average Half Width
Cell 1 Process 17.5587 3,40 12.6907 27.8400 7.2477 40.0744
Cell 10 Process 200.35 6,28 187.60 216.30 34.9146 348.00
Cell 2 Process 10.3535 0,18 10.0757 10.8262 8.4289 12.3244
Cell 3 Process 56.2461 0,55 55.0253 57.5691 2.1818 163.50
Cell 4 Process 26.6081 0,53 25.1841 27.6701 22.3233 31.3075
Cell 5 Process 777.27 123,75 574.68 1050.09 574.68 1050.09
Cell 6 Process 16.1985 0,38 15.5037 17.1940 13.6076 19.7220
Cell 7 Process 8.7648 0,30 8.0920 9.5201 5.2423 18.8100
Cell 8 Process 71.6199 1,29 69.5691 74.5526 60.3102 79.0853
Cell 9 Process 48.5762 0,72 47.4460 50.8955 10.6221 145.97
0,000
100,000
200,000
300,000
400,000
500,000
600,000
700,000
800,000
Cell 1 ProcessCell 10 ProcessCell 2 ProcessCell 3 ProcessCell 4 ProcessCell 5 ProcessCell 6 ProcessCell 7 ProcessCell 8 ProcessCell 9 Process
Figure C.36 Process-Total Time (Per Entity)
Page 135
117
Accumulated Time
Accum VA Time Minimum Maximum
Average Average
Average Half Width
Cell 1 Process 117.90 3,49 111.34 127.26
Cell 10 Process 526.45 15,46 488.25 567.39
Cell 2 Process 124.24 2,18 120.91 129.91
Cell 3 Process 4049.72 39,95 3961.82 4144.98
Cell 4 Process 319.30 6,41 302.21 332.04
Cell 5 Process 777.27 123,75 574.68 1050.09
Cell 6 Process 194.38 4,57 186.04 206.33
Cell 7 Process 104.18 3,59 97.1041 114.24
Cell 8 Process 859.44 15,50 834.83 894.63
Cell 9 Process 894.55 9,93 873.36 915.09
0,000
500,000
1000,000
1500,000
2000,000
2500,000
3000,000
3500,000
4000,000
4500,000
Cell 1 ProcessCell 10 ProcessCell 2 ProcessCell 3 ProcessCell 4 ProcessCell 5 ProcessCell 6 ProcessCell 7 ProcessCell 8 ProcessCell 9 Process
Figure C.37 Acc. Time-VA Time
Page 136
118
Queue
Time
Waiting Time Minimum Maximum Minimum Maximum
Average Average Value Value
Average Half Width
Assembling.Queue 0.00 0,00 0.00 0.00 0.00 0.00
Cell 1 Process.Queue 7.7336 3,46 2.8910 18.5617 0.00 29.6363
Cell 1 Seize.Queue 5.7435 2,42 2.1670 12.3793 0.00 63.3997
Cell 10 Process.Queue 156.48 5,37 146.92 169.02 0.00 298.11
Cell 10 Seize.Queue 51.3830 6,74 31.1368 62.7469 12.2516 130.63
Cell 2 Process.Queue 0.00 0,00 0.00 0.00 0.00 0.00
Cell 2 Seize.Queue 29.6130 16,97 11.2234 81.7446 0.00 152.89
Cell 3 Process.Queue 0.00 0,00 0.00 0.00 0.00 0.00
Cell 4 Process.Queue 0.00 0,00 0.00 0.00 0.00 0.00
Cell 4 Seize.Queue 85.8876 10,45 51.9671 108.39 0.00 184.29
Cell 5 Process.Queue 0.00 0,00 0.00 0.00 0.00 0.00
Cell 6 Process.Queue 0.00 0,00 0.00 0.00 0.00 0.00
Cell 6 Seize.Queue 53.7534 8,79 33.2130 73.0872 0.00 138.09
Cell 7 Process.Queue 0.08302308 0,19 0.00 0.8302 0.00 8.4629
Cell 7 Seize.Queue 10.4889 5,29 0.2029 27.9553 0.00 176.45
Cell 8 Process.Queue 0.00 0,00 0.00 0.00 0.00 0.00
Cell 8 Seize.Queue 213.58 21,56 163.37 269.75 0.00 518.80
Cell 9 Process.Queue 33.6670 0,71 32.5538 36.0340 0.00 129.57
Cell 9 Seize.Queue 14.4346 3,98 8.4121 24.8969 0.00 116.77
Match.Queue1 0.00 0,00 0.00 0.00 0.00 0.00
Match.Queue2 1443.28 135,68 1250.34 1735.41 1204.01 1808.95
Match.Queue3 652.35 123,82 473.43 890.45 13.1262 1159.60
Match.Queue4 1078.46 131,45 829.14 1352.58 581.69 1823.59
Match.Queue5 1571.63 112,47 1389.54 1837.30 1350.61 1866.45
Sending Coating.Queue 146.17 3,97 132.36 153.18 0.00 361.29
Worker Seize 3.Queue 214.46 8,48 202.63 234.97 0.00 869.55
0,000
200,000
400,000
600,000
800,000
1000,000
1200,000
1400,000
1600,000 Assembling.Queue Cell 1Process.Queue
Cell 1 Seize.Queue Cell 10Process.Queue
Cell 10Seize.Queue
Cell 2Process.Queue
Cell 2 Seize.Queue Cell 3Process.Queue
Cell 4Process.Queue Cell 4 Seize.Queue
Cell 5Process.Queue
Cell 6Process.Queue
Cell 6 Seize.Queue Cell 7Process.Queue
Cell 7 Seize.Queue Cell 8Process.Queue
Cell 8 Seize.Queue Cell 9Process.Queue
Cell 9 Seize.Queue Match.Queue1
Match.Queue2 Match.Queue3
Match.Queue4 Match.Queue5
SendingCoating.Queue
Worker Seize3.Queue
Figure C.38 Waiting Time in Queue
Page 137
119
Resource Usage
Number Busy Minimum Maximum Minimum Maximum
Average Average Value Value
Average Half Width
Cell 1 Machine 0.04766179 0,00 0.04288051 0.05302468 0.00 1.0000
Cell 10 Machine 0.2128 0,01 0.1925 0.2364 0.00 1.0000
Cell 2 Machine 0.05020358 0,00 0.04560787 0.05413084 0.00 1.0000
Cell 3 New 0.2722 0,01 0.2399 0.3016 0.00 1.0000
Cell 3 Old 1 0.3415 0,02 0.3037 0.3842 0.00 1.0000
Cell 3 Old 2 0.3423 0,02 0.3044 0.3867 0.00 1.0000
Cell 3 Old 3 0.3435 0,02 0.3129 0.3831 0.00 1.0000
Cell 3 Old 4 0.3362 0,01 0.3110 0.3837 0.00 1.0000
Cell 4 Machine 0.1290 0,01 0.1132 0.1364 0.00 1.0000
Cell 5 Machine 0.3113 0,04 0.2394 0.3933 0.00 1.0000
Cell 6 Machine 0.07855659 0,00 0.07205239 0.08596976 0.00 1.0000
Cell 7 Machine 0.04210823 0,00 0.03744838 0.04760039 0.00 1.0000
Cell 8 Machine 0.3472 0,01 0.3199 0.3728 0.00 1.0000
Cell 9 Machine 0.3614 0,01 0.3271 0.3800 0.00 1.0000
Worker 1 0.5836 0,04 0.4654 0.6676 0.00 1.0000
Worker 2 0.5473 0,03 0.4861 0.6278 0.00 1.0000
Worker 3 0.5649 0,02 0.5186 0.6128 0.00 1.0000
Worker 4 0.5805 0,04 0.4500 0.6627 0.00 1.0000
Worker 5 0.5157 0,03 0.4655 0.6114 0.00 1.0000
Worker 6 0.5493 0,02 0.5075 0.5874 0.00 1.0000
Worker 7 0.6733 0,03 0.6213 0.7225 0.00 1.0000
Worker 8 0.2610 0,02 0.2243 0.3087 0.00 1.0000
Worker 9 0.2423 0,02 0.2085 0.2868 0.00 1.0000
0,000
0,100
0,200
0,300
0,400
0,500
0,600
0,700
Cell 1 MachineCell 10 MachineCell 2 MachineCell 3 NewCell 3 Old 1Cell 3 Old 2Cell 3 Old 3Cell 3 Old 4Cell 4 MachineCell 5 MachineCell 6 MachineCell 7 MachineCell 8 MachineCell 9 MachineWorker 1Worker 2Worker 3Worker 4Worker 5Worker 6Worker 7Worker 8Worker 9
Figure C.39 Number of Busy Status
Page 138
120
Total Number Seized Minimum Maximum
Average Average
Average Half Width
Cell 1 Machine 12.0000 0,00 12.0000 12.0000
Cell 10 Machine 12.0000 0,00 12.0000 12.0000
Cell 2 Machine 12.0000 0,00 12.0000 12.0000
Cell 3 New 29.3000 2,26 25.0000 33.0000
Cell 3 Old 1 10.7000 1,91 7.0000 16.0000
Cell 3 Old 2 10.7000 1,43 7.0000 13.0000
Cell 3 Old 3 10.8000 1,68 8.0000 15.0000
Cell 3 Old 4 10.5000 1,63 7.0000 13.0000
Cell 4 Machine 12.0000 0,00 12.0000 12.0000
Cell 5 Machine 1.0000 0,00 1.0000 1.0000
Cell 6 Machine 12.0000 0,00 12.0000 12.0000
Cell 7 Machine 12.0000 0,00 12.0000 12.0000
Cell 8 Machine 12.0000 0,00 12.0000 12.0000
Cell 9 Machine 60.0000 0,00 60.0000 60.0000
Worker 1 22.8000 2,36 19.0000 30.0000
Worker 2 17.8000 4,48 11.0000 30.0000
Worker 3 17.7000 3,49 11.0000 27.0000
Worker 4 17.8000 3,83 12.0000 27.0000
Worker 5 20.7000 4,19 11.0000 29.0000
Worker 6 47.7000 1,07 46.0000 51.0000
Worker 7 25.7000 1,07 24.0000 28.0000
Worker 8 23.5000 1,23 20.0000 26.0000
Worker 9 22.3000 1,01 20.0000 24.0000
0,000
10,000
20,000
30,000
40,000
50,000
60,000
Cell 1 MachineCell 10 MachineCell 2 MachineCell 3 NewCell 3 Old 1Cell 3 Old 2Cell 3 Old 3Cell 3 Old 4Cell 4 MachineCell 5 MachineCell 6 MachineCell 7 MachineCell 8 MachineCell 9 MachineWorker 1Worker 2Worker 3Worker 4Worker 5Worker 6Worker 7Worker 8Worker 9
Figure C.40 Total Number Seized (Resources)
Page 139
121
C.5 Statistical Results of “Part Priority” Experiment (Time units: Minute)
Entity Time
VA Time Minimum Maximum Minimum Maximum
Average Average Value Value
Average Half Width
Part 1 899.11 84,38 695.26 1072.18 648.49 1118.93
Part 2 103.19 3,83 96.9019 113.62 63.9702 140.50
Part 3 243.21 10,42 213.88 268.65 171.90 313.10
Part 4 165.86 8,81 146.23 179.83 86.8038 228.11
Part 5 74.2937 1,62 71.6465 78.7814 56.5203 94.0810
0,000
200,000
400,000
600,000
800,000
1000,000
Part 1Part 2Part 3Part 4Part 5
Figure C.41 Entity-Value Added Time
Page 140
122
Wait Time Minimum Maximum Minimum Maximum
Average Average Value Value
Average Half Width
Part 1 646.54 17,06 617.39 692.82 334.99 1023.33
Part 2 1593.48 90,70 1372.72 1760.03 1151.98 1979.36
Part 3 1430.39 89,44 1211.62 1617.00 1061.32 1781.04
Part 4 1526.19 92,29 1292.85 1690.82 1119.90 1860.07
Part 5 1614.64 96,17 1383.70 1810.60 1206.94 2006.75
600,000
800,000
1000,000
1200,000
1400,000
1600,000
1800,000
Part 1Part 2Part 3Part 4Part 5
Figure C.42 Entity-Wait Time
Transfer Time Minimum Maximum Minimum Maximum
Average Average Value Value
Average Half Width
Part 1 174.01 3,96 166.89 182.82 156.80 194.38
Part 2 27.2307 0,15 26.9331 27.5444 23.8396 30.1725
Part 3 47.1820 0,49 46.1896 48.6206 42.6337 52.5006
Part 4 27.2315 0,33 26.6256 28.0234 24.2811 30.4435
Part 5 26.7538 0,37 26.0017 27.4144 23.7518 30.7118
20,000
40,000
60,000
80,000
100,000
120,000
140,000
160,000
180,000
Part 1Part 2Part 3Part 4Part 5
Figure C.43 Entity-Transfer Time
Page 141
123
Total Time Minimum Maximum Minimum Maximum
Average Average Value Value
Average Half Width
Part 1 1719.66 92,33 1510.85 1899.56 1237.79 2145.07
Part 2 1723.91 91,34 1506.83 1894.01 1306.59 2081.24
Part 3 1720.79 91,40 1496.20 1903.56 1306.13 2103.11
Part 4 1719.28 88,70 1488.43 1880.00 1293.60 2078.24
Part 5 1715.68 96,19 1485.46 1913.32 1304.94 2098.91
1714,000
1716,000
1718,000
1720,000
1722,000
1724,000
Part 1Part 2Part 3Part 4Part 5
Figure C.44 Entity-Total Time
Process
Time per Entity
VA Time Per Entity Minimum Maximum Minimum Maximum
Average Average Value Value
Average Half Width
Cell 1 Process 9.8702 0,22 9.2783 10.3056 7.2477 11.8391
Cell 10 Process 44.5963 1,10 42.8600 47.1676 31.4217 55.3361
Cell 2 Process 10.2172 0,19 9.7192 10.6702 8.2288 12.7338
Cell 3 Process 54.2904 0,44 53.4434 55.6857 2.2375 163.50
Cell 4 Process 25.9524 0,43 25.1298 26.8204 22.1088 31.6588
Cell 5 Process 719.85 86,31 509.00 889.10 509.00 889.10
Cell 6 Process 16.1954 0,27 15.6698 16.8609 13.3607 20.6857
Cell 7 Process 8.8637 0,26 8.2711 9.4625 5.2423 11.3915
Cell 8 Process 71.7731 1,21 68.9116 73.9331 61.4553 79.5609
Cell 9 Process 14.8438 0,21 14.2179 15.2449 10.1266 19.7326
Page 142
124
0,000
100,000
200,000
300,000
400,000
500,000
600,000
700,000
800,000
Cell 1 ProcessCell 10 ProcessCell 2 ProcessCell 3 ProcessCell 4 ProcessCell 5 ProcessCell 6 ProcessCell 7 ProcessCell 8 ProcessCell 9 Process
Figure C.45 Process-VA Time (Per Entity)
Total Time Per Entity Minimum Maximum Minimum Maximum
Average Average Value Value
Average Half Width
Cell 1 Process 17.4123 3,32 12.7821 27.4544 7.2477 40.0744
Cell 10 Process 204.84 6,08 193.45 217.73 34.9146 332.05
Cell 2 Process 10.2172 0,19 9.7192 10.6702 8.2288 12.7338
Cell 3 Process 54.2904 0,44 53.4434 55.6857 2.2375 163.50
Cell 4 Process 25.9524 0,43 25.1298 26.8204 22.1088 31.6588
Cell 5 Process 719.85 86,31 509.00 889.10 509.00 889.10
Cell 6 Process 16.1954 0,27 15.6698 16.8609 13.3607 20.6857
Cell 7 Process 8.8637 0,26 8.2711 9.4625 5.2423 11.3915
Cell 8 Process 71.7731 1,21 68.9116 73.9331 61.4553 79.5609
Cell 9 Process 37.5082 1,43 33.6654 40.2316 10.2103 144.59
0,000
100,000
200,000
300,000
400,000
500,000
600,000
700,000
800,000
Cell 1 ProcessCell 10 ProcessCell 2 ProcessCell 3 ProcessCell 4 ProcessCell 5 ProcessCell 6 ProcessCell 7 ProcessCell 8 ProcessCell 9 Process
Figure C.46 Process-Total Time (Per Entity)
Page 143
125
Accumulated Time
Accum VA Time Minimum Maximum
Average Average
Average Half Width
Cell 1 Process 118.44 2,70 111.34 123.67
Cell 10 Process 535.16 13,14 514.32 566.01
Cell 2 Process 122.61 2,27 116.63 128.04
Cell 3 Process 3908.91 31,80 3847.92 4009.37
Cell 4 Process 311.43 5,17 301.56 321.85
Cell 5 Process 719.85 86,31 509.00 889.10
Cell 6 Process 194.35 3,23 188.04 202.33
Cell 7 Process 106.36 3,12 99.25 113.55
Cell 8 Process 861.28 14,47 826.94 887.20
Cell 9 Process 890.63 12,67 853.07 914.70
0,000
500,000
1000,000
1500,000
2000,000
2500,000
3000,000
3500,000
4000,000
Cell 1 ProcessCell 10 ProcessCell 2 ProcessCell 3 ProcessCell 4 ProcessCell 5 ProcessCell 6 ProcessCell 7 ProcessCell 8 ProcessCell 9 Process
Figure C.47 Acc. Time-VA Time
Page 144
126
Queue
Time
Waiting Time Minimum Maximum Minimum Maximum
Average Average Value Value
Average Half Width
Assembling.Queue 0.00 0,00 0.00 0.00 0.00 0.00
Cell 1 Process.Queue 7.5421 3,40 2.8510 18.1761 0.00 29.6363
Cell 1 Seize.Queue 1.5637 1,57 0.06079119 7.3291 0.00 29.4176
Cell 10 Process.Queue 160.25 5,22 150.52 172.14 0.00 287.57
Cell 10 Seize.Queue 54.0486 3,45 44.8789 62.0702 22.4141 128.15
Cell 2 Process.Queue 0.00 0,00 0.00 0.00 0.00 0.00
Cell 2 Seize.Queue 9.6781 4,80 2.6472 24.8371 0.00 63.9563
Cell 3 Process.Queue 0.00 0,00 0.00 0.00 0.00 0.00
Cell 4 Process.Queue 0.00 0,00 0.00 0.00 0.00 0.00
Cell 4 Seize.Queue 53.9374 8,89 38.1651 79.6057 0.00 122.41
Cell 5 Process.Queue 0.00 0,00 0.00 0.00 0.00 0.00
Cell 6 Process.Queue 0.00 0,00 0.00 0.00 0.00 0.00
Cell 6 Seize.Queue 41.5254 14,61 8.8189 72.0444 0.00 124.64
Cell 7 Process.Queue 0.00 0,00 0.00 0.00 0.00 0.00
Cell 7 Seize.Queue 7.8328 3,31 1.5411 15.4517 0.00 58.8866
Cell 8 Process.Queue 0.00 0,00 0.00 0.00 0.00 0.00
Cell 8 Seize.Queue 140.32 36,22 82.0376 208.93 0.00 446.60
Cell 9 Process.Queue 22.6644 1,30 19.4475 25.0318 0.00 129.57
Cell 9 Seize.Queue 4.2183 2,32 2.0620 12.2540 0.00 63.8170
Match.Queue1 1.5074 3,13 0.00 13.9123 0.00 83.9826
Match.Queue2 1066.39 111,81 834.79 1242.20 641.51 1451.86
Match.Queue3 562.63 110,07 276.50 800.45 0.00 1228.16
Match.Queue4 987.20 97,97 715.54 1175.78 576.20 1498.88
Match.Queue5 1037.23 140,92 804.97 1367.98 527.82 1532.29
Sending Coating.Queue 148.70 2,99 142.47 155.22 0.00 379.14
Worker Seize 3.Queue 223.78 12,00 194.99 251.85 0.00 619.69
0,000
200,000
400,000
600,000
800,000
1000,000
1200,000 Assembling.Queue Cell 1Process.Queue
Cell 1 Seize.Queue Cell 10Process.Queue
Cell 10Seize.Queue
Cell 2Process.Queue
Cell 2 Seize.Queue Cell 3Process.Queue
Cell 4Process.Queue Cell 4 Seize.Queue
Cell 5Process.Queue
Cell 6Process.Queue
Cell 6 Seize.Queue Cell 7Process.Queue
Cell 7 Seize.Queue Cell 8Process.Queue
Cell 8 Seize.Queue Cell 9Process.Queue
Cell 9 Seize.Queue Match.Queue1
Match.Queue2 Match.Queue3
Match.Queue4 Match.Queue5
SendingCoating.Queue
Worker Seize3.Queue
Figure C.48 Waiting Time in Queue
Page 145
127
Resource
Usage
Number Busy Minimum Maximum Minimum Maximum
Average Average Value Value
Average Half Width
Cell 1 Machine 0.05475624 0,00 0.04844302 0.05897988 0.00 1.0000
Cell 10 Machine 0.2476 0,01 0.2155 0.2734 0.00 1.0000
Cell 2 Machine 0.05670502 0,00 0.05052191 0.06185619 0.00 1.0000
Cell 3 New 0.3380 0,02 0.2957 0.3687 0.00 1.0000
Cell 3 Old 1 0.3678 0,01 0.3381 0.4000 0.00 1.0000
Cell 3 Old 2 0.3570 0,03 0.2872 0.4182 0.00 1.0000
Cell 3 Old 3 0.3678 0,02 0.3161 0.4061 0.00 1.0000
Cell 3 Old 4 0.3766 0,02 0.3484 0.4214 0.00 1.0000
Cell 4 Machine 0.1441 0,01 0.1261 0.1555 0.00 1.0000
Cell 5 Machine 0.3305 0,03 0.2459 0.3967 0.00 1.0000
Cell 6 Machine 0.08984724 0,00 0.07834914 0.0959 0.00 1.0000
Cell 7 Machine 0.04920510 0,00 0.04275448 0.05407141 0.00 1.0000
Cell 8 Machine 0.3987 0,02 0.3446 0.4286 0.00 1.0000
Cell 9 Machine 0.4118 0,02 0.3652 0.4419 0.00 1.0000
Worker 1 0.6204 0,04 0.5154 0.6731 0.00 1.0000
Worker 2 0.5656 0,03 0.5019 0.6238 0.00 1.0000
Worker 3 0.6104 0,04 0.5167 0.6736 0.00 1.0000
Worker 4 0.6176 0,05 0.4965 0.6793 0.00 1.0000
Worker 5 0.5374 0,05 0.4243 0.6833 0.00 1.0000
Worker 6 0.5689 0,04 0.4736 0.6183 0.00 1.0000
Worker 7 0.7073 0,05 0.5875 0.8139 0.00 1.0000
Worker 8 0.3295 0,03 0.2725 0.3967 0.00 1.0000
Worker 9 0.2638 0,03 0.2041 0.3042 0.00 1.0000
0,000
0,100
0,200
0,300
0,400
0,500
0,600
0,700
0,800
Cell 1 MachineCell 10 MachineCell 2 MachineCell 3 NewCell 3 Old 1Cell 3 Old 2Cell 3 Old 3Cell 3 Old 4Cell 4 MachineCell 5 MachineCell 6 MachineCell 7 MachineCell 8 MachineCell 9 MachineWorker 1Worker 2Worker 3Worker 4Worker 5Worker 6Worker 7Worker 8Worker 9
Figure C.49 Number of Busy Status
Page 146
128
Total Number Seized Minimum Maximum
Average Average
Average Half Width
Cell 1 Machine 12.0000 0,00 12.0000 12.0000
Cell 10 Machine 12.0000 0,00 12.0000 12.0000
Cell 2 Machine 12.0000 0,00 12.0000 12.0000
Cell 3 New 30.8000 3,05 25.0000 38.0000
Cell 3 Old 1 10.8000 1,71 7.0000 15.0000
Cell 3 Old 2 10.2000 2,26 6.0000 16.0000
Cell 3 Old 3 10.2000 1,87 7.0000 14.0000
Cell 3 Old 4 10.0000 1,22 8.0000 14.0000
Cell 4 Machine 12.0000 0,00 12.0000 12.0000
Cell 5 Machine 1.0000 0,00 1.0000 1.0000
Cell 6 Machine 12.0000 0,00 12.0000 12.0000
Cell 7 Machine 12.0000 0,00 12.0000 12.0000
Cell 8 Machine 12.0000 0,00 12.0000 12.0000
Cell 9 Machine 60.0000 0,00 60.0000 60.0000
Worker 1 20.9000 5,88 12.0000 37.0000
Worker 2 17.3000 4,03 10.0000 28.0000
Worker 3 17.8000 5,36 9.0000 31.0000
Worker 4 14.4000 3,49 10.0000 27.0000
Worker 5 20.1000 6,06 11.0000 37.0000
Worker 6 46.1000 1,63 43.0000 50.0000
Worker 7 27.6000 1,73 23.0000 31.0000
Worker 8 26.4000 1,66 22.0000 30.0000
Worker 9 25.4000 1,13 23.0000 28.0000
0,000
10,000
20,000
30,000
40,000
50,000
60,000
Cell 1 MachineCell 10 MachineCell 2 MachineCell 3 NewCell 3 Old 1Cell 3 Old 2Cell 3 Old 3Cell 3 Old 4Cell 4 MachineCell 5 MachineCell 6 MachineCell 7 MachineCell 8 MachineCell 9 MachineWorker 1Worker 2Worker 3Worker 4Worker 5Worker 6Worker 7Worker 8Worker 9
Figure C.50 Total Number Seized (Resources)
Page 147
129
C.6 Statistical Results of Drive Shaft manufacturing under “Process Type”
Experiment (Time units: Minute)
Entity
Time
VA Time Minimum Maximum Minimum Maximum
Average Average Value Value
Average Half Width
Part 1 894.48 91,29 669.04 1131.20 625.62 1169.19
Part 2 103.91 2,16 99.93 108.00 63.1553 138.16
Part 3 256.71 3,48 248.33 262.87 182.10 313.27
Part 4 157.30 5,13 144.93 165.97 88.9234 227.16
Part 5 71.8896 2,41 66.4051 77.3461 48.8610 94.9645
Part 6 49.3255 1,38 47.2289 53.8822 42.3375 58.7045
0,000
200,000
400,000
600,000
800,000
1000,000
Part 1Part 2Part 3Part 4Part 5Part 6
Figure C.51 Entity-Value Added Time
Page 148
130
Wait Time Minimum Maximum Minimum Maximum
Average Average Value Value
Average Half Width
Part 1 1299.02 21,36 1247.92 1355.27 969.65 1678.86
Part 2 2240.19 85,95 2042.42 2424.87 1830.64 2622.99
Part 3 2062.70 83,42 1864.60 2235.95 1719.81 2382.08
Part 4 2181.52 90,56 1982.40 2381.61 1776.05 2529.80
Part 5 2262.34 86,45 2035.97 2429.84 1870.99 2606.02
Part 6 89.4652 2,22 84.7536 93.8689 26.4837 174.85
0,000
400,000
800,000
1200,000
1600,000
2000,000
2400,000
Part 1Part 2Part 3Part 4Part 5Part 6
Figure C.52 Entity-Wait Time
Transfer Time Minimum Maximum Minimum Maximum
Average Average Value Value
Average Half Width
Part 1 172.44 2,41 167.50 176.63 156.15 186.47
Part 2 27.1352 0,27 26.5575 27.5060 23.8775 30.1364
Part 3 47.2574 0,57 46.0621 48.5231 41.9034 51.2275
Part 4 26.8448 0,23 26.3481 27.2322 23.4869 30.1191
Part 5 27.0532 0,26 26.6137 27.7139 23.8026 29.7328
Part 6 11.7133 0,23 11.2612 12.2121 9.6216 13.5322
0,000
20,000
40,000
60,000
80,000
100,000
120,000
140,000
160,000
180,000
Part 1Part 2Part 3Part 4Part 5Part 6
Figure C.53 Entity-Transfer Time
Page 149
131
Total Time Minimum Maximum Minimum Maximum
Average Average Value Value
Average Half Width
Part 1 2365.94 87,56 2153.98 2566.86 1919.49 2816.68
Part 2 2371.23 86,24 2176.12 2559.77 1972.51 2787.59
Part 3 2366.67 83,15 2160.44 2534.25 1957.66 2692.84
Part 4 2365.66 92,77 2161.98 2572.63 1971.18 2776.81
Part 5 2361.29 86,49 2135.47 2523.24 1971.94 2705.75
Part 6 150.50 2,89 145.69 159.71 82.2884 243.35
0,000
400,000
800,000
1200,000
1600,000
2000,000
2400,000
Part 1Part 2Part 3Part 4Part 5Part 6
Figure C.54 Entity-Total Time
Process
Time per Entity
VA Time Per Entity Minimum Maximum Minimum Maximum
Average Average Value Value
Average Half Width
Cell 1 Process 9.8185 0,21 9.2783 10.1959 7.2477 11.8391
Cell 10 Process 45.3131 1,25 42.5730 47.7990 30.3799 58.0596
Cell 2 Process 12.7061 0,34 12.2873 13.4850 8.1397 24.9209
Cell 3 Process 54.3603 0,66 52.8731 55.5369 2.1895 160.83
Cell 4 Process 27.7305 0,36 26.9995 28.5613 22.4413 35.8572
Cell 5 Process 713.84 91,35 491.83 956.69 491.83 956.69
Cell 6 Process 16.1777 0,27 15.6752 16.7358 13.4167 20.6857
Cell 7 Process 9.2293 0,23 8.6280 9.8734 5.8779 11.7115
Cell 8 Process 71.2868 0,93 69.0618 73.2587 61.9178 79.0318
Cell 9 Process 14.8945 0,17 14.6112 15.2724 10.1317 19.6895
Page 150
132
0,000
100,000
200,000
300,000
400,000
500,000
600,000
700,000
800,000
Cell 1 ProcessCell 10 ProcessCell 2 ProcessCell 3 ProcessCell 4 ProcessCell 5 ProcessCell 6 ProcessCell 7 ProcessCell 8 ProcessCell 9 Process
Figure C.55 Process-VA Time (Per Entity)
Total Time Per Entity Minimum Maximum Minimum Maximum
Average Average Value Value
Average Half Width
Cell 1 Process 17.3788 3,20 12.9929 27.4544 7.2477 40.0744
Cell 10 Process 210.04 7,02 197.23 227.27 34.9146 352.65
Cell 2 Process 12.7061 0,34 12.2873 13.4850 8.1397 24.9209
Cell 3 Process 54.3603 0,66 52.8731 55.5369 2.1895 160.83
Cell 4 Process 27.7305 0,36 26.9995 28.5613 22.4413 35.8572
Cell 5 Process 713.84 91,35 491.83 956.69 491.83 956.69
Cell 6 Process 16.1777 0,27 15.6752 16.7358 13.4167 20.6857
Cell 7 Process 9.4108 0,33 8.6280 10.1505 5.8779 16.2894
Cell 8 Process 71.2868 0,93 69.0618 73.2587 61.9178 79.0318
Cell 9 Process 44.3362 1,05 41.9028 46.2805 11.0727 143.63
0,000
100,000
200,000
300,000
400,000
500,000
600,000
700,000
800,000
Cell 1 ProcessCell 10 ProcessCell 2 ProcessCell 3 ProcessCell 4 ProcessCell 5 ProcessCell 6 ProcessCell 7 ProcessCell 8 ProcessCell 9 Process
Figure C.56 Process-Total Time (Per Entity)
Page 151
133
Accumulated Time
Accum VA Time Minimum Maximum
Average Average
Average Half Width
Cell 1 Process 117.82 2,56 111.34 122.35
Cell 10 Process 543.76 15,02 510.88 573.59
Cell 2 Process 216.00 5,74 208.88 229.25
Cell 3 Process 3913.94 47,67 3806.87 3998.66
Cell 4 Process 471.42 6,06 458.99 485.54
Cell 5 Process 713.84 91,35 491.83 956.69
Cell 6 Process 194.13 3,29 188.10 200.83
Cell 7 Process 110.75 2,78 103.54 118.48
Cell 8 Process 855.44 11,19 828.74 879.10
Cell 9 Process 893.67 10,24 876.67 916.34
0,000
500,000
1000,000
1500,000
2000,000
2500,000
3000,000
3500,000
4000,000
Cell 1 ProcessCell 10 ProcessCell 2 ProcessCell 3 ProcessCell 4 ProcessCell 5 ProcessCell 6 ProcessCell 7 ProcessCell 8 ProcessCell 9 Process
Figure C.57 Acc. Time-VA Time
Page 152
134
Queue
Time
Waiting Time Minimum Maximum Minimum Maximum
Average Average Value Value
Average Half Width
Assembling.Queue 0.00 0,00 0.00 0.00 0.00 0.00
Cell 1 Process.Queue 7.5603 3,28 2.8213 18.1761 0.00 29.6363
Cell 1 Seize.Queue 1.8877 1,43 0.05422150 7.3291 0.00 29.4176
Cell 10 Process.Queue 164.73 6,75 151.31 182.30 0.00 300.40
Cell 10 Seize.Queue 57.4504 6,44 35.5892 72.2156 0.00 161.26
Cell 2 Process.Queue 0.00 0,00 0.00 0.00 0.00 0.00
Cell 2 Seize.Queue 94.9702 17,74 47.2757 127.45 0.00 209.23
Cell 3 Process.Queue 0.00 0,00 0.00 0.00 0.00 0.00
Cell 4 Process.Queue 0.00 0,00 0.00 0.00 0.00 0.00
Cell 4 Seize.Queue 83.2353 9,53 65.0463 107.35 0.00 198.77
Cell 5 Process.Queue 0.00 0,00 0.00 0.00 0.00 0.00
Cell 6 Process.Queue 0.00 0,00 0.00 0.00 0.00 0.00
Cell 6 Seize.Queue 43.9427 10,87 20.4109 68.5200 0.00 123.89
Cell 7 Process.Queue 0.1815 0,17 0.00 0.6464 0.00 7.7570
Cell 7 Seize.Queue 23.5721 3,27 16.1549 31.2077 0.00 117.25
Cell 8 Process.Queue 0.00 0,00 0.00 0.00 0.00 0.00
Cell 8 Seize.Queue 286.72 20,93 230.56 316.36 4.9990 602.03
Cell 9 Process.Queue 29.4417 0,97 27.1994 31.3166 0.00 128.14
Cell 9 Seize.Queue 16.9829 1,34 14.8218 20.6537 0.00 122.55
Match.Queue1 0.00 0,00 0.00 0.00 0.00 0.00
Match.Queue2 1936.00 86,18 1751.21 2103.88 1738.52 2125.10
Match.Queue3 1272.80 85,94 1089.96 1478.36 819.88 1742.80
Match.Queue4 1580.73 89,59 1396.21 1778.91 1166.87 2134.09
Match.Queue5 1473.81 87,33 1252.52 1684.07 1180.65 2180.78
Sending Coating.Queue 145.02 2,37 137.97 148.60 0.00 328.05
Worker Seize 3.Queue 251.20 7,54 235.08 269.37 0.00 580.09
0,000
400,000
800,000
1200,000
1600,000
2000,000 Assembling.Queue Cell 1Process.Queue
Cell 1 Seize.Queue Cell 10Process.Queue
Cell 10Seize.Queue
Cell 2Process.Queue
Cell 2 Seize.Queue Cell 3Process.Queue
Cell 4Process.Queue Cell 4 Seize.Queue
Cell 5Process.Queue
Cell 6Process.Queue
Cell 6 Seize.Queue Cell 7Process.Queue
Cell 7 Seize.Queue Cell 8Process.Queue
Cell 8 Seize.Queue Cell 9Process.Queue
Cell 9 Seize.Queue Match.Queue1
Match.Queue2 Match.Queue3
Match.Queue4 Match.Queue5
SendingCoating.Queue
Worker Seize3.Queue
Figure C.58 Waiting Time in Queue
Page 153
135
Resource
Usage
Number Busy Minimum Maximum Minimum Maximum
Average Average Value Value
Average Half Width
Cell 1 Machine 0.04172454 0,00 0.03838039 0.04582410 0.00 1.0000
Cell 10 Machine 0.1922 0,01 0.1796 0.2076 0.00 1.0000
Cell 2 Machine 0.07647650 0,00 0.06962779 0.08585977 0.00 1.0000
Cell 3 New 0.2594 0,01 0.2427 0.2807 0.00 1.0000
Cell 3 Old 1 0.2821 0,02 0.2429 0.3082 0.00 1.0000
Cell 3 Old 2 0.2812 0,01 0.2620 0.3096 0.00 1.0000
Cell 3 Old 3 0.2807 0,02 0.2487 0.3103 0.00 1.0000
Cell 3 Old 4 0.2821 0,02 0.2422 0.3140 0.00 1.0000
Cell 4 Machine 0.1669 0,01 0.1547 0.1819 0.00 1.0000
Cell 5 Machine 0.2508 0,03 0.1842 0.3189 0.00 1.0000
Cell 6 Machine 0.06867437 0,00 0.06270093 0.07337133 0.00 1.0000
Cell 7 Machine 0.03919611 0,00 0.03451206 0.04203747 0.00 1.0000
Cell 8 Machine 0.3028 0,01 0.2801 0.3293 0.00 1.0000
Cell 9 Machine 0.3162 0,01 0.2934 0.3432 0.00 1.0000
Worker 1 0.4979 0,04 0.4043 0.5600 0.00 1.0000
Worker 2 0.4586 0,02 0.4196 0.5179 0.00 1.0000
Worker 3 0.4787 0,02 0.4321 0.5095 0.00 1.0000
Worker 4 0.4952 0,03 0.4512 0.5476 0.00 1.0000
Worker 5 0.4289 0,04 0.3772 0.5545 0.00 1.0000
Worker 6 0.5219 0,02 0.4640 0.5535 0.00 1.0000
Worker 7 0.5405 0,03 0.4892 0.6046 0.00 1.0000
Worker 8 0.2815 0,02 0.2345 0.3208 0.00 1.0000
Worker 9 0.2444 0,01 0.2312 0.2591 0.00 1.0000
0,000
0,100
0,200
0,300
0,400
0,500
0,600
Cell 1 MachineCell 10 MachineCell 2 MachineCell 3 NewCell 3 Old 1Cell 3 Old 2Cell 3 Old 3Cell 3 Old 4Cell 4 MachineCell 5 MachineCell 6 MachineCell 7 MachineCell 8 MachineCell 9 MachineWorker 1Worker 2Worker 3Worker 4Worker 5Worker 6Worker 7Worker 8Worker 9
Figure C.59 Number of Busy Status
Page 154
136
Total Number Seized Minimum Maximum
Average Average
Average Half Width
Cell 1 Machine 12.0000 0,00 12.0000 12.0000
Cell 10 Machine 12.0000 0,00 12.0000 12.0000
Cell 2 Machine 17.0000 0,00 17.0000 17.0000
Cell 3 New 34.3000 2,50 28.0000 40.0000
Cell 3 Old 1 10.1000 1,56 7.0000 14.0000
Cell 3 Old 2 9.4000 0,97 7.0000 11.0000
Cell 3 Old 3 9.2000 1,16 8.0000 12.0000
Cell 3 Old 4 9.0000 1,26 6.0000 11.0000
Cell 4 Machine 17.0000 0,00 17.0000 17.0000
Cell 5 Machine 1.0000 0,00 1.0000 1.0000
Cell 6 Machine 12.0000 0,00 12.0000 12.0000
Cell 7 Machine 12.0000 0,00 12.0000 12.0000
Cell 8 Machine 12.0000 0,00 12.0000 12.0000
Cell 9 Machine 60.0000 0,00 60.0000 60.0000
Worker 1 28.7000 9,47 16.0000 50.0000
Worker 2 17.2000 6,13 12.0000 41.0000
Worker 3 15.6000 6,47 10.0000 41.0000
Worker 4 17.1000 6,68 11.0000 35.0000
Worker 5 18.4000 7,87 9.0000 41.0000
Worker 6 44.9000 1,19 42.0000 47.0000
Worker 7 25.4000 0,77 24.0000 27.0000
Worker 8 28.7000 1,01 26.0000 30.0000
Worker 9 30.0000 0,95 28.0000 32.0000
0,000
10,000
20,000
30,000
40,000
50,000
60,000
Cell 1 MachineCell 10 MachineCell 2 MachineCell 3 NewCell 3 Old 1Cell 3 Old 2Cell 3 Old 3Cell 3 Old 4Cell 4 MachineCell 5 MachineCell 6 MachineCell 7 MachineCell 8 MachineCell 9 MachineWorker 1Worker 2Worker 3Worker 4Worker 5Worker 6Worker 7Worker 8Worker 9
Figure C.60 Total Number Seized (Resources)
Page 155
137
C.7 Statistical Results of Drive Shaft manufacturing under “Part Priority”
Experiment (Time units: Minute)
Entity
Time
VA Time Minimum Maximum Minimum Maximum
Average Average Value Value
Average Half Width
Part 1 818.19 97,25 640.21 1023.12 593.65 1064.21
Part 2 103.16 3,89 95.3357 111.75 64.5743 141.60
Part 3 242.94 10,68 212.33 270.70 171.35 312.56
Part 4 166.00 8,90 146.18 181.29 89.0949 230.17
Part 5 73.9340 1,72 69.0666 76.6503 49.0950 97.3219
Part 6 49.1808 1,47 45.8527 53.0108 41.7725 57.9887
0,000
100,000
200,000
300,000
400,000
500,000
600,000
700,000
800,000
900,000
Part 1Part 2Part 3Part 4Part 5Part 6
Figure C.61 Entity-Value Added Time
Page 156
138
Wait Time Minimum Maximum Minimum Maximum
Average Average Value Value
Average Half Width
Part 1 645.42 13,93 621.99 678.31 304.31 960.51
Part 2 1510.73 99,59 1314.48 1723.63 1107.16 1899.42
Part 3 1347.87 111,96 1144.79 1604.40 974.15 1803.29
Part 4 1443.30 98,03 1268.70 1668.84 1088.77 1808.29
Part 5 1532.00 96,01 1349.65 1749.49 1157.64 1927.07
Part 6 345.18 26,39 295.98 427.03 34.0900 480.19
200,000
400,000
600,000
800,000
1000,000
1200,000
1400,000
1600,000
Part 1Part 2Part 3Part 4Part 5Part 6
Figure C.62 Entity-Wait Time
Transfer Time Minimum Maximum Minimum Maximum
Average Average Value Value
Average Half Width
Part 1 173.26 2,31 168.13 178.04 159.89 187.98
Part 2 27.1629 0,27 26.6798 28.0858 23.0749 29.9053
Part 3 47.1743 0,43 45.9738 48.3604 42.3989 52.2332
Part 4 27.1143 0,33 26.2741 27.7025 23.1248 30.1210
Part 5 27.0429 0,29 26.5011 27.6753 22.9567 30.5783
Part 6 11.7049 0,18 11.2842 12.1117 10.3652 13.9255
0,000
20,000
40,000
60,000
80,000
100,000
120,000
140,000
160,000
180,000
Part 1Part 2Part 3Part 4Part 5Part 6
Figure C.63 Entity-Transfer Time
Page 157
139
Total Time Minimum Maximum Minimum Maximum
Average Average Value Value
Average Half Width
Part 1 1636.87 101,55 1453.38 1856.86 1222.42 2043.74
Part 2 1641.04 100,20 1447.11 1848.78 1272.55 2056.97
Part 3 1637.99 104,97 1442.34 1890.87 1271.18 2111.65
Part 4 1636.42 102,41 1443.22 1867.65 1271.16 2059.94
Part 5 1632.98 96,26 1449.90 1848.80 1272.53 2049.74
Part 6 406.07 26,54 357.92 488.54 98.8744 540.94
400,000
600,000
800,000
1000,000
1200,000
1400,000
1600,000
1800,000
Part 1Part 2Part 3Part 4Part 5Part 6
Figure C.64 Entity-Total Time
Process
Time per Entity
VA Time Per Entity Minimum Maximum Minimum Maximum
Average Average Value Value
Average Half Width
Cell 1 Process 9.8702 0,22 9.2783 10.3056 7.2477 11.8391
Cell 10 Process 44.3834 1,03 41.9160 46.4033 30.6150 59.0042
Cell 2 Process 12.6471 0,46 11.9146 13.5431 8.2134 25.3106
Cell 3 Process 54.2904 0,44 53.4434 55.6857 2.2375 163.50
Cell 4 Process 27.5425 0,31 27.0286 28.3320 22.4417 36.6263
Cell 5 Process 638.70 95,03 458.78 844.05 458.78 844.05
Cell 6 Process 16.1954 0,27 15.6698 16.8609 13.3607 20.6857
Cell 7 Process 9.1116 0,25 8.6472 9.8793 5.4811 11.8357
Cell 8 Process 71.7066 0,57 70.4669 72.8216 61.6712 78.4271
Cell 9 Process 14.9085 0,23 14.3817 15.3741 10.1337 19.5356
Page 158
140
0,000
100,000
200,000
300,000
400,000
500,000
600,000
700,000
Cell 1 ProcessCell 10 ProcessCell 2 ProcessCell 3 ProcessCell 4 ProcessCell 5 ProcessCell 6 ProcessCell 7 ProcessCell 8 ProcessCell 9 Process
Figure C.65 Process-VA Time (Per Entity)
Total Time Per Entity Minimum Maximum Minimum Maximum
Average Average Value Value
Average Half Width
Cell 1 Process 17.4123 3,32 12.7821 27.4544 7.2477 40.0744
Cell 10 Process 196.96 10,36 164.80 210.62 34.9146 336.89
Cell 2 Process 12.6471 0,46 11.9146 13.5431 8.2134 25.3106
Cell 3 Process 54.2904 0,44 53.4434 55.6857 2.2375 163.50
Cell 4 Process 27.5425 0,31 27.0286 28.3320 22.4417 36.6263
Cell 5 Process 638.70 95,03 458.78 844.05 458.78 844.05
Cell 6 Process 16.1954 0,27 15.6698 16.8609 13.3607 20.6857
Cell 7 Process 9.1174 0,25 8.6472 9.8793 5.4811 11.8357
Cell 8 Process 71.7066 0,57 70.4669 72.8216 61.6712 78.4271
Cell 9 Process 37.2899 1,95 33.2303 42.8416 10.6921 144.14
0,000
100,000
200,000
300,000
400,000
500,000
600,000
700,000
Cell 1 ProcessCell 10 ProcessCell 2 ProcessCell 3 ProcessCell 4 ProcessCell 5 ProcessCell 6 ProcessCell 7 ProcessCell 8 ProcessCell 9 Process
Figure C.66 Process-Total Time (Per Entity)
Page 159
141
Accumulated Time
Accum VA Time Minimum Maximum
Average Average
Average Half Width
Cell 1 Process 118.44 2,70 111.34 123.67
Cell 10 Process 532.60 12,39 502.99 556.84
Cell 2 Process 215.00 7,83 202.55 230.23
Cell 3 Process 3908.91 31,80 3847.92 4009.37
Cell 4 Process 468.22 5,29 459.49 481.64
Cell 5 Process 638.70 95,03 458.78 844.05
Cell 6 Process 194.35 3,23 188.04 202.33
Cell 7 Process 109.34 3,04 103.77 118.55
Cell 8 Process 860.48 6,84 845.60 873.86
Cell 9 Process 894.51 13,64 862.90 922.44
0,000
500,000
1000,000
1500,000
2000,000
2500,000
3000,000
3500,000
4000,000
Cell 1 ProcessCell 10 ProcessCell 2 ProcessCell 3 ProcessCell 4 ProcessCell 5 ProcessCell 6 ProcessCell 7 ProcessCell 8 ProcessCell 9 Process
Figure C.67 Acc. Time-VA Time
Page 160
142
Queue
Time
Waiting Time Minimum Maximum Minimum Maximum
Average Average Value Value
Average Half Width
Assembling.Queue 0.00 0,00 0.00 0.00 0.00 0.00
Cell 1 Process.Queue 7.5421 3,40 2.8510 18.1761 0.00 29.6363
Cell 1 Seize.Queue 1.5637 1,57 0.06079119 7.3291 0.00 29.4176
Cell 10 Process.Queue 152.58 9,80 122.43 165.18 0.00 290.20
Cell 10 Seize.Queue 51.1057 7,97 29.8664 61.8049 0.00 135.07
Cell 2 Process.Queue 0.00 0,00 0.00 0.00 0.00 0.00
Cell 2 Seize.Queue 13.4934 4,13 4.8011 23.6011 0.00 74.0556
Cell 3 Process.Queue 0.00 0,00 0.00 0.00 0.00 0.00
Cell 4 Process.Queue 0.00 0,00 0.00 0.00 0.00 0.00
Cell 4 Seize.Queue 126.58 10,40 104.22 149.98 0.00 408.47
Cell 5 Process.Queue 0.00 0,00 0.00 0.00 0.00 0.00
Cell 6 Process.Queue 0.00 0,00 0.00 0.00 0.00 0.00
Cell 6 Seize.Queue 41.5254 14,61 8.8189 72.0444 0.00 124.64
Cell 7 Process.Queue 0.00584856 0,01 0.00 0.05848565 0.00 0.7018
Cell 7 Seize.Queue 20.0966 3,99 13.4984 30.3979 0.00 135.69
Cell 8 Process.Queue 0.00 0,00 0.00 0.00 0.00 0.00
Cell 8 Seize.Queue 148.42 39,23 86.2426 249.06 0.00 490.88
Cell 9 Process.Queue 22.3813 1,76 18.8485 27.4676 0.00 129.66
Cell 9 Seize.Queue 5.7547 1,53 2.6809 11.1501 0.00 66.3911
Match.Queue1 5.5094 4,78 0.00 15.0182 0.00 89.3489
Match.Queue2 994.67 87,67 846.71 1195.74 562.06 1453.70
Match.Queue3 464.31 144,40 252.65 740.66 0.00 1213.18
Match.Queue4 914.33 97,24 736.37 1142.92 498.52 1422.43
Match.Queue5 965.68 91,91 762.79 1150.92 633.96 1468.86
Sending Coating.Queue 151.00 4,04 142.43 161.50 0.00 404.95
Worker Seize 3.Queue 223.78 12,00 194.99 251.85 0.00 619.69
0,000
200,000
400,000
600,000
800,000
1000,000 Assembling.Queue Cell 1Process.Queue
Cell 1 Seize.Queue Cell 10Process.Queue
Cell 10Seize.Queue
Cell 2Process.Queue
Cell 2 Seize.Queue Cell 3Process.Queue
Cell 4Process.Queue Cell 4 Seize.Queue
Cell 5Process.Queue
Cell 6Process.Queue
Cell 6 Seize.Queue Cell 7Process.Queue
Cell 7 Seize.Queue Cell 8Process.Queue
Cell 8 Seize.Queue Cell 9Process.Queue
Cell 9 Seize.Queue Match.Queue1
Match.Queue2 Match.Queue3
Match.Queue4 Match.Queue5
SendingCoating.Queue
Worker Seize3.Queue
Figure C.68 Waiting Time in Queue
Page 161
143
Resource
Usage
Number Busy Minimum Maximum Minimum Maximum
Average Average Value Value
Average Half Width
Cell 1 Machine 0.05737095 0,00 0.04639153 0.06598660 0.00 1.0000
Cell 10 Machine 0.2579 0,02 0.2194 0.3094 0.00 1.0000
Cell 2 Machine 0.1040 0,01 0.08466348 0.1144 0.00 1.0000
Cell 3 New 0.3537 0,02 0.2961 0.4078 0.00 1.0000
Cell 3 Old 1 0.3871 0,04 0.3070 0.4625 0.00 1.0000
Cell 3 Old 2 0.3721 0,02 0.3120 0.4115 0.00 1.0000
Cell 3 Old 3 0.3849 0,03 0.3300 0.4637 0.00 1.0000
Cell 3 Old 4 0.3952 0,03 0.3236 0.4710 0.00 1.0000
Cell 4 Machine 0.2268 0,02 0.1943 0.2638 0.00 1.0000
Cell 5 Machine 0.3043 0,03 0.2549 0.3517 0.00 1.0000
Cell 6 Machine 0.0941 0,01 0.08142024 0.1124 0.00 1.0000
Cell 7 Machine 0.05298870 0,00 0.04342342 0.06145381 0.00 1.0000
Cell 8 Machine 0.4169 0,03 0.3523 0.4811 0.00 1.0000
Cell 9 Machine 0.4329 0,03 0.3723 0.4960 0.00 1.0000
Worker 1 0.6294 0,03 0.5670 0.7102 0.00 1.0000
Worker 2 0.6153 0,04 0.5078 0.6765 0.00 1.0000
Worker 3 0.6264 0,04 0.5653 0.6846 0.00 1.0000
Worker 4 0.6304 0,04 0.5465 0.7337 0.00 1.0000
Worker 5 0.5869 0,05 0.4638 0.6716 0.00 1.0000
Worker 6 0.6260 0,06 0.5197 0.7634 0.00 1.0000
Worker 7 0.7019 0,05 0.6016 0.8372 0.00 1.0000
Worker 8 0.3714 0,02 0.3385 0.4103 0.00 1.0000
Worker 9 0.3226 0,04 0.2526 0.4075 0.00 1.0000
0,000
0,100
0,200
0,300
0,400
0,500
0,600
0,700
0,800
Cell 1 MachineCell 10 MachineCell 2 MachineCell 3 NewCell 3 Old 1Cell 3 Old 2Cell 3 Old 3Cell 3 Old 4Cell 4 MachineCell 5 MachineCell 6 MachineCell 7 MachineCell 8 MachineCell 9 MachineWorker 1Worker 2Worker 3Worker 4Worker 5Worker 6Worker 7Worker 8Worker 9
Figure C.69 Number of Busy Status
Page 162
144
Total Number Seized Minimum Maximum
Average Average
Average Half Width
Cell 1 Machine 12.0000 0,00 12.0000 12.0000
Cell 10 Machine 12.0000 0,00 12.0000 12.0000
Cell 2 Machine 17.0000 0,00 17.0000 17.0000
Cell 3 New 30.8000 3,05 25.0000 38.0000
Cell 3 Old 1 10.8000 1,71 7.0000 15.0000
Cell 3 Old 2 10.2000 2,26 6.0000 16.0000
Cell 3 Old 3 10.2000 1,87 7.0000 14.0000
Cell 3 Old 4 10.0000 1,22 8.0000 14.0000
Cell 4 Machine 17.0000 0,00 17.0000 17.0000
Cell 5 Machine 1.0000 0,00 1.0000 1.0000
Cell 6 Machine 12.0000 0,00 12.0000 12.0000
Cell 7 Machine 12.0000 0,00 12.0000 12.0000
Cell 8 Machine 12.0000 0,00 12.0000 12.0000
Cell 9 Machine 60.0000 0,00 60.0000 60.0000
Worker 1 21.1000 6,46 13.0000 39.0000
Worker 2 17.5000 3,82 11.0000 29.0000
Worker 3 17.9000 5,34 10.0000 31.0000
Worker 4 14.8000 3,12 11.0000 26.0000
Worker 5 21.1000 5,99 11.0000 38.0000
Worker 6 44.0000 1,26 41.0000 47.0000
Worker 7 28.5000 2,03 25.0000 34.0000
Worker 8 30.2000 1,81 26.0000 34.0000
Worker 9 30.9000 0,92 29.0000 33.0000
0,000
10,000
20,000
30,000
40,000
50,000
60,000
Cell 1 MachineCell 10 MachineCell 2 MachineCell 3 NewCell 3 Old 1Cell 3 Old 2Cell 3 Old 3Cell 3 Old 4Cell 4 MachineCell 5 MachineCell 6 MachineCell 7 MachineCell 8 MachineCell 9 MachineWorker 1Worker 2Worker 3Worker 4Worker 5Worker 6Worker 7Worker 8Worker 9
Figure C.70 Total Number Seized (Resources)