SIMULATION OF STAGE AND THE HYDROLOGIC BUDGET OF DEVILS LAKE, SAUK COUNTY, WISCONSIN By J.T. Krohelski and W.G. Batten U.S. GEOLOGICAL SURVEY Open-File Report 94-348 Prepared in cooperation with WISCONSIN DEPARTMENT OF NATURAL RESOURCES AND THE TOWN OF BARABOO Madison, Wisconsin 1995
Transcript
SIMULATION OF STAGE AND THE HYDROLOGIC BUDGET OF DEVILS LAKE, SAUK COUNTY, WISCONSIN
By J.T. Krohelski and W.G. Batten
U.S. GEOLOGICAL SURVEY Open-File Report 94-348
Prepared in cooperation withWISCONSIN DEPARTMENT OF NATURAL RESOURCESAND THE TOWN OF BARABOO
Madison, Wisconsin 1995
U.S. DEPARTMENT OF THE INTERIOR
BRUCE BABBITT, Secretary
U.S. GEOLOGICAL SURVEY Gordon P. Eaton, Director
For additional information write to:
District Chief U.S. Geological Survey 6417 Normandy Lane Madison, Wl 53719
Copies of this report can be purchased from:
U.S. Geological SurveyEarth Science Information CenterOpen-File Reports SectionBox 25286, MS 517Denver Federal CenterDenver, CO 80225
Purpose and scope................................................................................................................................................... 2Location and physical setting ................................................................................................................................. 2
Hydrologic-budget components of Devils Lake................................................................................................................ 2Simulation of lake stage and hydrologic budget................................................................................................................ 5
Assumptions and model program........................................................................................................................... 6Model calibration and sensitivity............................................................................................................................ 8Simulations of the effects of possible mitigation plans on lake stage.................................................................... 13
Summary............................................................................................................................................................................ 15References cited................................................................................................................................................................. 18Appendix 1.-Fortran program code to simulate changes in lake stage due to variations in hydrologic-budget
1. Map showing location of Devils Lake and surrounding area, Wisconsin.............................................................. 32. Map showing location and measured ground-water gradients at piezometers in Devils Lake, Wisconsin,
March 5, 1992..................................................................................................................................................... 53. Graph showing relation of lake-stage recession rate to lake evaporation rate for selected periods of no
precipitation or runoff at Devils Lake, Wis., July 1991-September 1992.......................................................... 64. Flowchart showing program steps in hydrologic-budget model of Devils Lake, Wis........................................... 7
5.-11. Graphs showing:5. Model-calculated and measured lake stage and precipitation, Devils Lake, Wis., 1980-92............................ 96. Lake and water-table altitude at the gaging station, Devils Lake, Wis............................................................ 107. Relationship between root mean square difference of measured and model-calculated lake stage and
evaporation and runoff coefficients and ground-water-flow rates in the hydrologic-budget model of Devils Lake, Wis........................................................................................................................................... 11
8. Model-calculated and measured lake stage and precipitation, Devils Lake, Wis., 1991-92............................ 129. Model-calculated lake stage for calibration and withdrawal of 3.28 and 6.56 feet of hypolimnetic
water from Devils Lake, Wis., during the months of September, 1980-92 (mitigation plan 1)................... 1410. Model-calculated lake stage for calibration and withdrawal of 6.56 feet of hypolimnetic water
from Devils Lake, Wis., during September 1986 (mitigation plan 2).......................................................... 1611. Model-calculated lake stage for calibration and withdrawal of 6.56 feet of hypolimnetic water
from Devils Lake, Wis., during August and September and addition of water from the northeastbasin during periods of low lake stage (mitigation plan 3).......................................................................... 17
TABLES
1. Stage, area, and volume, Devils Lake, Wis.............................................................................................................. 42. Net change in lake volume due to runoff, precipitation, and runoff coefficients for selected periods,
Devils Lake, Wis................................................................................................................................................ 43. Model-calculated hydrologic-budget components and measured change in lake volume, Devils Lake, Wis......... 13
Contents III
CONVERSION FACTORS AND VERTICAL DATUM
Multiply
inch (in.)
foot (ft)
mile (mi)
square foot (ft2)
cubic foot (ft3)
square mile (mi2)
acre
acre-foot (acre-ft)
foot per day (ft/d)
gallon per minute
gallon per minute
cubic foot per month (ft3/mo)
By
25.4
0.3048
1.609
0.09290
0.02832
2.590
4.047 xlO'3
1,233
731.52
5.4505
192.5
0.02832
To Obtain
millimeter
meter
kilometer
square meter
cubic meter
square kilometer
square kilometer
cubic meter
centimeter per second
cubic meter per day
cubic foot per day
cubic meter per month
Sea Level: In this report "sea level" refers to the National Geodetic Vertical Datum of 1929 (NGVD of 1929)-a geodetic datum derived from a general adjustment of the first-order level nets of both the United States and Canada, formerly called Sea Level Datum of 1929.
IV Conversion Factors and Vertical Datum
SIMULATION OF STAGE AND THE HYDROLOGIC BUDGET OF DEVILS LAKE, SAUK COUNTY, WISCONSIN
ByJ.J. Krohelski andW.G. Batten
Abstract
Water clarity of Devils Lake, in the Driftless Area of southwestern Wisconsin, has been decreas ing because of blue-green algal blooms. An under standing of the hydrology of Devils Lake is needed to develop a mitigation plan to reduce phosphorus input. A model was developed to test the current understanding of the hydrology of the lake includ ing stage and hydrologic budget and to estimate the effects of proposed mitigation plans on lake stage.
Daily lake stage was simulated in the model by summing estimates of hydrologic-budget compo nents. The Devils Lake hydrologic-budget compo nents are precipitation on the lake surface, evaporation from the lake surface, runoff (consist ing of overland flow to the lake and an intermittent stream flowing into the lake), and ground-water flow into and out of the lake.
The model was calibrated to measured lake stage for the period 1980-92. Simulated stage com pares reasonably well with historical stage data for Devils Lake. The root mean square of the differ ences of simulated and measured daily lake stages for the period 1980-92 is 0.83 foot. Simulated lake stage is very sensitive to small changes in runoff and evaporation coefficients, and ground-water- flow rates used in the model.
The average model-calculated annual amounts of each hydrologic-budget component for the 1980-92 simulation period, in order of increasing volume, are evaporation (791 acre-feet), precipita
tion (973 acre-feet), runoff (1,107 acre-feet), and net ground-water flow, which is out of the lake (1,323 acre-feet).
Three mitigation plans were simulated. Miti gation plan 3, which includes the addition of water from a basin adjacent to the northeastern side of the Devils Lake Basin, allows for withdrawals of hypolimnetic water and maintaining lake stage closer to optimal levels than would result without mitigation.
INTRODUCTION
Devils Lake State Park is one cf the most heavily used State parks in Wisconsin. Water clar ity of Devils Lake has been decreasing because of blue-green algal blooms that develco during late summer and early fall. Phosphorus released from anoxic hypolimnetic sediments fuels these blooms as the enriched bottom water mixes with surface waters during destratification. An understanding of the hydrology of Devils Lake is needed to develop a mitigation plan to reduce this internal cycling of phosphorus. One approach being evaluated by the Wisconsin Department of Natural Resources (WDNR) is late-summer withdrawal of phospho rus-rich water from the bottom of the lake (hypolim- nion) over a multiyear period (Wisconsin Depart ment of Natural Resources, 1988).
In addition to an understanding of the hydrol ogy, an analysis is needed to estimate changes in lake stage caused by proposed withdrawals of water from the lake and variations in hydrologic- budget components. A model can be used to test
Introduction 1
the current understanding of the hydrology and may be useful in assessing the effect of future-pro posed mitigation plans on long-term lake stage.
A study to address the above needs began in October 1991. The study was conducted by the U.S. Geological Survey (USGS) in cooperation with the WDNR and the town of Baraboo.
Two previous studies (Wisconsin Department of Natural Resources, 1988; Dickrell, 1991) have addressed the hydrology of Devils Lake. During 1986-87, seepage meters were used to estimate nutrient loading from ground-water flow into the lake. The seepage-meter data indicated that the amount of ground-water inflow and the location of ground-water-inflow areas are highly variable (Wisconsin Department of Natural Resources, 1988). Dickrell (1991) estimated net ground-water flow by use of a hydrologic-budget approach. Hydrologic-budget components were estimated or measured, and net ground-water flow was calcu lated as a residual. Dickrell estimated net ground- water flow to be -5.1x10⁶ and -4.4 x 106 ft^/month (approximately 0.01 ft/d net ground-water flow from the lake), respectively, for spring and fall 1988.
Purpose and Scope
This report presents the results of the study of the hydrology of Devils Lake. Specifically, the report describes the development and application of a computer model to estimate changes in lake stage due to variations in hydrologic-budget com ponents. Although the report is not meant to be a rigorous presentation of a hydrologic budget, a hydrologic-budget modeling approach was used because the long record of lake-stage data pro vides an opportunity for calibration of a model. The calibrated model was then used to simulate long- term lake-stage variations caused by withdrawal or addition of water.
Location and Physical Setting
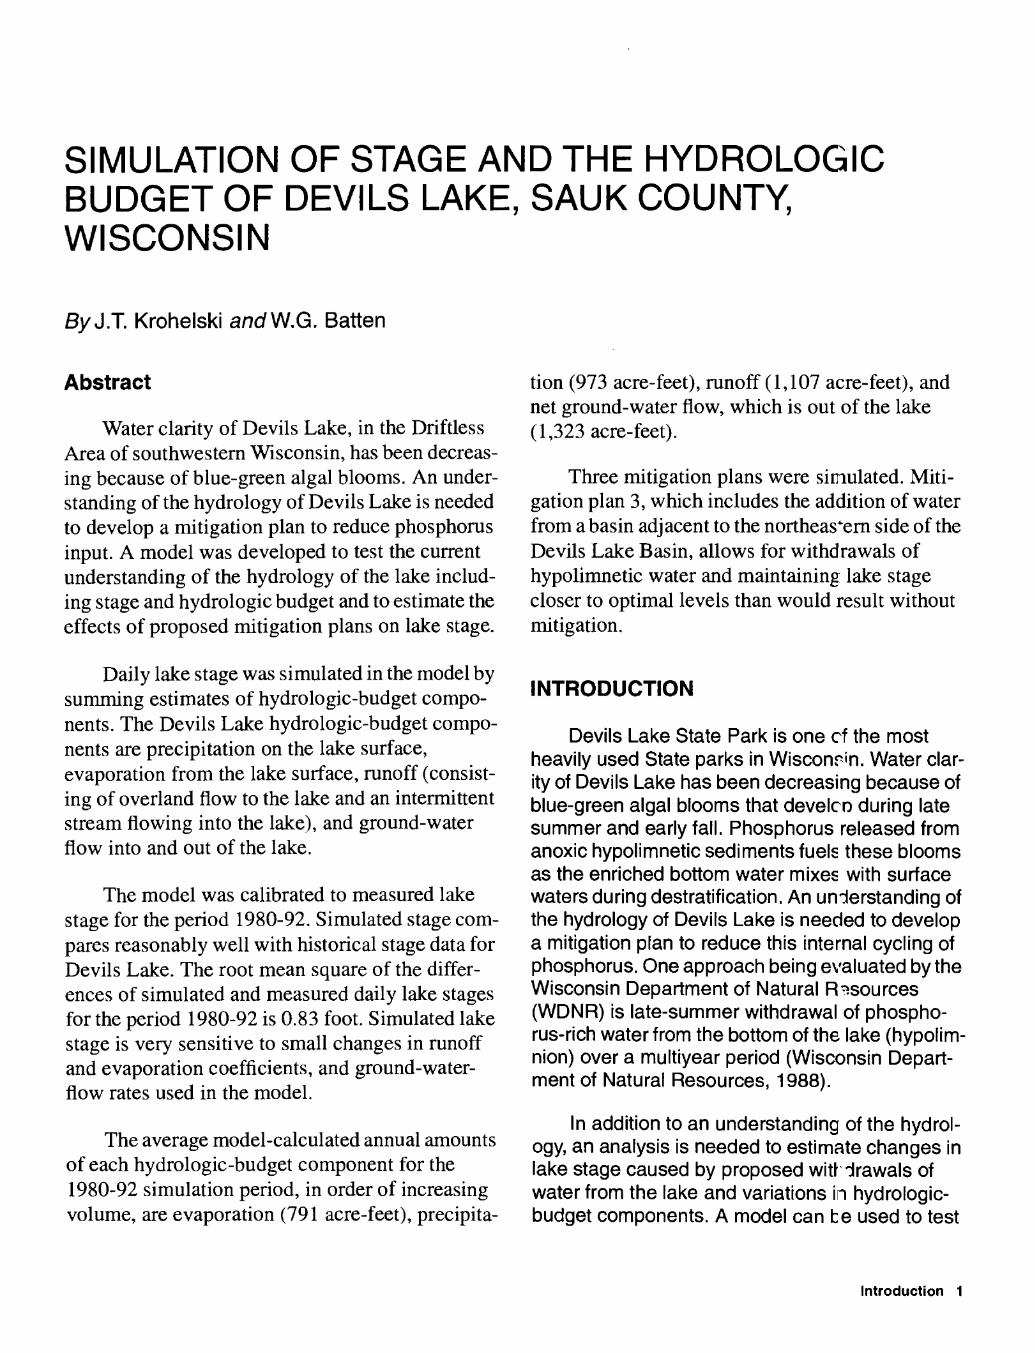
Devils Lake is in the Driftless Area of south western Wisconsin, about 3 mi south of the city of Baraboo (fig. 1). The lake has an area of approxi mately 365 acres, a maximum depth of about 50
ft, and a drainage area of 3.24 mi2 . An intermittent stream flows into the lake from the southwest. No streams flow from the lake. The lake is bounded on the eastern and western shores by steep talus slopes of boulder-sized Precambrian quartzite, and on the northern and southeastern shores by gently sloping beach areas underlain by glacial, fluvial, and lacustrine sediment (At'rg and others, 1990).
HYDROLOGIC-BUDGET COMPONENTS OF DEVILS LAKE
The hydrologic budget of Devils Lake can be described by the following components:
AS = P + RO - E - GW,0'Jt-ilT
where
AS is change in lake storage, P is precipitation falling directly on the
lake, RO is stream inflow and cverland runoff
into the lake, E is water evaporated from the lake
surface, and GWout. in is net ground-water flow.
The sum of the hydrologic-budget compo nents determines the change in lake storage (AS). If the sum is positive there will be a corresponding increase in lake storage which results in an increase in lake stage, area, and volume. The opposite results if the sum is negative. Regression equations, based on the relationshjp between lake stage, area, and volume (table 1), were developed from a bathymetric map. The equations were used to calculate lake stage from a calculated lake area or volume and to calculate lake area from a calcu lated lake stage (Appendix 1).
Historical climate data were obtained from nearby weather stations (Arlington and Baraboo, Wis.). Additional lake-stage, precipitation, and ground-water-level data from a gaging station installed during this study on the no-theast shore of Devils Lake also were obtained. Historic measure ments of lake stage (January 198C-July 16,1991) were made by employees of Devih Lake State Park. In addition, eight piezometer.? were installed around the perimeter of the lake tc determine the
2 Simulation of Stage and the Hydrologic Budget of Devils Lake, Sauk County, Wisconsin
89° 45' 89° 40'
43° 28'
43° 25'
/ Devils Lake Basin \
Base from US Geological Survey Baraboo, 1975 and North Freedom, 1975
4 KILOMETERS
EXPLANATION
- Basin boundary
4 MILES
I II I I
Study area
Figure 1. Location of Devils Lake and surrounding area, Wisconsin.
Hydrologic-Budget Component? of Devils Lake 3
distribution of ground-water inflow and outflow areas.
Precipitation (P) data were obtained from the Baraboo weather station (January 1,1980-July 16, 1991) and from the Devils Lake gaging station (July 17,1991 -September 30,1992). The Baraboo weather station is approximately 3.25 mi north of Devils Lake.
Table 1. Stage, area, and volume. Devils Lake, Wis.
Stage (feet above sea level)
963
960
958
953
948
943
938
933
928
923
918
916
Area (square feet)
15,920,000
15,270,000
14,480,000
13,220,000
12,730,000
12,280,000
11,640,000
10,680,000
7,500,000
5,330,000
2,010,000
0
Volume (cubic feet)
484,890,000
438,110,000
408,360,000
339,130,000
274,260,000
211,740,000
151,950,000
96,170,000
50,950,000
19,030,000
1,340,000
0
Stream inflow and overland runoff and inter flow into the lake were estimated by multiplying the lake-drainage area by precipitation and multiplying that product by a runoff coefficient (C RO)- Calcula tion of runoff coefficient for a single storm was as follows:
C RO = (AS - P x A + E + GWnet)/(P x DA),
where AS is change in lake storage, P is precipita tion, A is lake area, E is evaporation, GWnet is net ground-water flow, and DA is the lake drainage area. From these calculations (table 2), a single average runoff coefficient of 0.21 was estimated. The increase in lake volume resulting from a single storm was then calculated by relating the change in lake stage to lake volume.
Evaporation (E) from the lake surface was estimated by use of pan-evaporation data obtained from the Arlington weather station (not shown),
approximately 20 mi southeast of Devils Lake. The pan-evaporation data for January 1,1980 through September 30,1992, were multiplied by a typical lake/pan coefficient for Wisconsin, to estimate evaporation from the lake surface (Chow, 1964, p. 11-9).
Table 2. Net change in lake volume due tc runoff, precipitation, and runoff coefficients for selected periods, Devils Lake, Wis.
Period (year/month/day)
92/05/11-92/05/12
92/04/08-92/04/1 1
92/04/15-92/04/16
91/11/16-91/11/17
91/11/22-91/11/23
91/11/27-91/11/29
91/12/08-91/12/12
Net change in lake
volume dueto runoff
(cubic feet)
770,000
1,690,000
1,070,000
1,380,000
1,230,000
460,000
1,380,000
Precipitation(inches)
0.81
.82
.97
.85
1.09
.72
1.90
Average
Runoff coefficient
0.12
.27
.15
.54
.22
.08
.10
.21
Ground-water inflow and outflow areas were determined from eight piezometers installed around the northern and southern edges of the lake (fig. 2). Large pieces of quartzi e covering the lake bottom along the eastern and western edges of the lake prevented installation of piezometers in these areas. Measured ground-water gradients indicate that Devils Lake is losing water to the ground-water system at five piezometer sites (fig. 2). A sixth piezometer was dry, possibly because an unsaturated zone was present beneath the lake at this site (the large negative gradient, -0.76, at an adjacent piezometer indicates this possibility). Some ground-water inflow occurs at the south western part of the lake. Similar rerults were also obtained from a piezometer survey by Dickrell (1991). Net ground-water flow, GW(OUt_j n ), is the sum of ground water flowing into the lake and lake water flowing into the ground. The piezometer survey indicates that the amount of lake water flowing into the ground is greater tin an the amount of ground water entering the lake.
4 Simulation of Stage and the Hydrologic Budget of Devils Lake, Sauk County, Wisconsin
gaging station
South Bluff
Base from U.S.Geological Survey Baraboo, 1975
-0.01
O
EXPLANATION
Piezometer location and gradient (dimensionless). Negative gradient indicates flow from the lake to the ground water system.
800I
r 200
_L1600 FEET J
400 METERS
Figure 2. Location and measured ground-water gradients at piezometers in Devil ~ Lake, Wisconsin, March 5, 1992.
Net ground-water-flow rate was estimated by plotting evaporation and lake-stage recession rate during periods of no precipitation (fig. 3). The Y- axis intercept (zero evaporation) of the regression line is equal to net ground-water flow. The net ground-water-flow rate, equivalent to 0.007 ft of lake surface per day, was assumed to be the aver age net ground-water-flow rate (fig. 3). The stan dard error of the intercept is 0.003 ft/d and the
range of the intercept value for the 95-percent con fidence interval is from 0.0002 to 0.01 ft/d. The sig nificance level of the regression line is 0.01.
SIMULATION OF LAKE STAGF: AND HYDROLOGIC BUDGET
A computer model program to simulate changes in lake stage caused by the variation in hydrologic-budget components was written in For-
Simulation of Lake Stage and Hy-Jrologic Budget 5
tran (Appendix 1). The program was used to simu late lake stage for the period January 1, 1980 through September 30, 1992.
0 0.005 0.01 0.015 0.02
EVAPORATION, IN FEET PER DAY
Figure 3. Relation of lake-stage recession rate to lake evaporation rate for selected periods of no precipitation or runoff at Devils Lake, Wis., July 1991-September 1992.
Assumptions and Model Program
The following assumptions were made to allow the use of available climatological data and to simplify the model:
1. Precipitation and evaporation amounts recorded at nearby weather stations were repre sentative of the amounts at Devils Lake.
2. Inflow from the stream at the southwest corner of Devils Lake was assumed negligible during periods of little or no precipitation. This assumption is based on three measurements made during periods of little or no precipitation. Measurements of 0.17 and 0.10 tiP/s were made on August 18,1992 and October 15,1992, respec tively, by the USGS, and a measurement of 0.26 ft3/s was made on June 6,1988, by Dickrell (1991). During periods of precipitation, the inflow from the stream is included in the estimates of runoff coeffi cient.
3. Runoff estimated by use of an average coefficient of 0.21 was representative of the entire period of record. In addition, runoff from snowmelt was assumed over a two-day period, February 15 and March 15. The water equivalen* of total snow fall from December through Februa-y 14 was summed and stored, and the total sum was added to the lake on February 15. Similarly, the water equivalent of snowfall from February 15 to March 14 was summed and stored and wa~ added to the lake on March 15. Runoff to the lake during June, July, and August does not occur if p recipitation during the day of interest was less than 0.5 in. and if precipitation did not fall during the previous day. These conditions must be exceeded to overcome the effects of evapotranspiration and dry soil con ditions and produce runoff.
4. Hydraulic gradient was constant for the active simulation period. Hence, the volume of net ground-water flow was proportional to lake area.
The model program calculates daily lake stage. The major program steps are shown in figure 4. The program first reads precipitation and pan-evaporation data for the entire simulated period. Pan evaporation is multiplied by a coeffi cient to approximate lake-surface evaporation. Values for runoff and evaporation coefficients, ground-water-flow rate, drainage area, and an ini tial lake stage are set in the progran. Then, from current or initial daily lake stage, lake volume and lake area are calculated.
A series of "if statements" are executed in the program to determine the volume of runoff that occurred during the current day. Runoff for three periods, winter (December, January, and Febru ary), spring and fall (March, April, Mey, September, October, and November) and summer (June, July, and August) are treated differently. For winter, runoff volume is summed and added to the lake in two increments; one on February 1F and one on March 15. The volume of runoff on e daily basis is calculated by multiplying the daily water equivalent of snow or rainfall by lake-drainage area and then multiplying that product by the runoff coefficient. For spring and fall months, the volume of runoff for the current day is calculated by multiplying the cur rent daily precipitation by lake-drainage area by the coefficient. Runoff for summer is calculated the
6 Simulation of Stage and the Hydrologic Budget of Devils Lake, Sauk County, Wisconsin
/ READ: DATE / /PAN EVAPORATION/ / PRFTlPITATinN S
NO
YES
\
RUNOFF-PRECIPITATION * DRAINAGE AREA * COEFOENT
AND X PREVIOUS DA)/ ^^).001/^ 1 F
RUNOFF - 0
:
Figure 4. Program steps in hydrologic-budget model of Devils Lake, Wis. (Fortran code and equations are listed in Appendix 1).
Simulation of Lake Stage end Hydrologic Budget 7
same way as for spring and fall unless the current daily precipitation is less than 0.5 in. and there was no precipitation during the previous day. In this case, runoff is not calculated and is assumed to be zero for that day.
Finally, the lake stage for the start of the next day is calculated by adding precipitation and watershed runoff to, and subtracting evaporation and net ground-water flow from, the current daily lake stage. The next daily lake stage is then calcu lated in the model, starting with the calculation of a new lake storage volume.
Model Calibration and Sensitivity
Runoff and evaporation coefficients and ground-water-flow rate were varied over a reason able range until the root mean square (rms) of the differences between measured lake stage and model-calculated lake stage were minimized. The lowest rms was 0.83 ft and resulted when the runoff coefficient was 0.21, the average calculated value (table 2), the pan-evaporation coefficient was 0.69, and the ground-water-flow rate was increased from 0.007 ft/d, the calculated coeffi cient based on lake stage recession periods, to 0.01 ft/d. The value of ground-water-flow rate is approximately the value estimated by Dickrell (1991).
Simulated stage compares reasonably well with historical stage data for Devils Lake (fig. 5). Long-term trends in the measured stage of Devils Lake indicate a gradual increase from 1980 to the end of 1986, a decrease to about 1988 and, then a fairly constant stage through 1992. These trends are also apparent in the simulated lake stage. The measured daily lake stage, however, does not always compare well with the simulated daily lake stage. Reasons for this are in all of the assump tions and necessary simplifications discussed in the previous section. The two most critical assumptions seem to be that precipitation mea sured at the Baraboo weather station is represen tative of precipitation measured at Devils Lake and that a single runoff coefficient of 0.21 can be used to calculate runoff to the lake.
An average runoff coefficient cannot be used to accurately calculate daily runoff because runoff is affected by antecedent moisture conditions and evapotranspiration, both of which can vary daily. Estimates of a runoff coefficient, calculated from data collected during this study, varied from 0.08 to 0.54. Furthermore, the ground-water-flow rate used is constant throughout model simulation. Figure 6 shows that the head difference between lake stage and the water table varies throughout the period of record, indicating that e variable ground-water-flow rate is probably necessary for accurate simulation of short-term net ground-water flow.
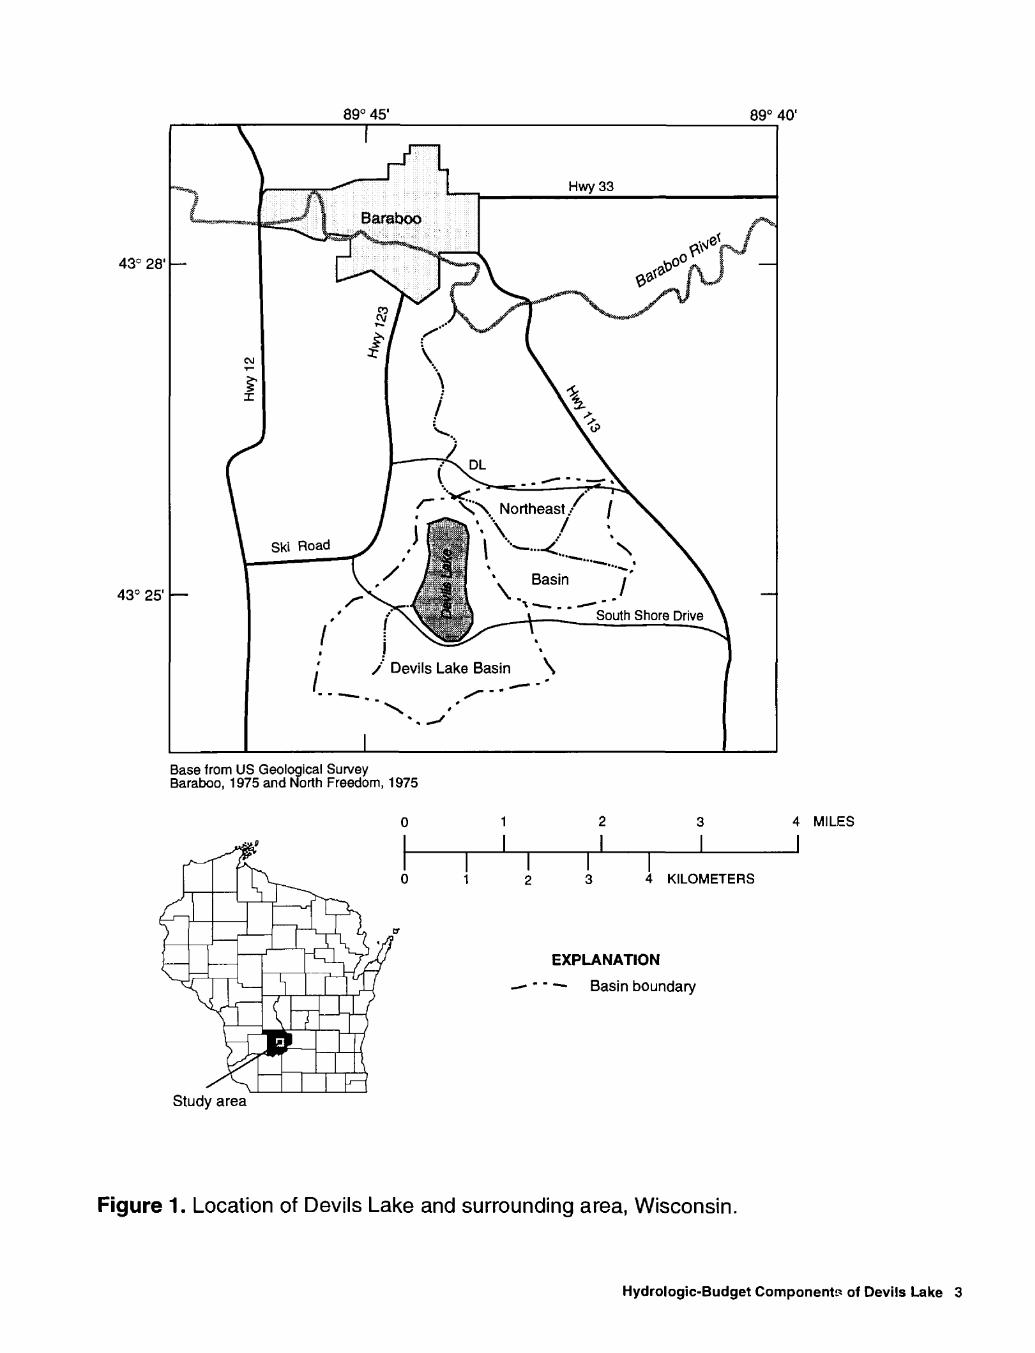
Sensitivity of the model was tested by chang ing values for runoff and evaporation coefficients, and ground-water-flow rate individua'ly while keep ing the other two values constant. It was found that the simulated lake stage is very sensitive even to small changes in all three of these values (fig. 7). A 10-percent change in any of these values causes a change of greater than 1 ft in the rms of the differences of simulated and measured lake stage.
A simulation was done in which precipitation data were restricted to data collected at Devils Lake (fig. 8), to further test the model calibration. The simulation covered the period July 17, 1991 through September 30, 1992.Trends in the simu lated stage again compare well with the measured lake stage; however, discrepancies in daily fluctu ations are large. These discrepancies cannot be attributed to errors in precipitation measurement because precipitation, except for the winter months, was recorded at the lake. Moreover, at least for the summer months, the discrepancies are probably not caused by model-simulation errors in evaporation or net ground-water flow from the lake. This is shown by comparison of the slopes of the simulated and measured lake-stage hydrographs, which are almost ident'cal during extended recessions in July and Aug-ist 1991 and May-August 1992. These nearly identical slopes indicate that the combined simulatec' rates of evaporation and net ground-water flow for this period are accurate. Comparison of the hydro- graph slopes for the winter of 1991-P2, however, indicates that the rate of simulated g-ound-water
8 Simulation of Stage end the Hydrologic Budget of Devils Lake, Sauk County, Wisconsin
CO 3 o ff CO a T
970
969
-
to
111 o GL en Q.
961
960
1980
19
81
1982
19
83
1984
19
85
1986
19
87
1988
19
89
1990
19
91
1992
ID a (Q £
Fig
ure
5.
Mod
el-c
alcu
late
d an
d m
easu
red
lake
sta
ge a
nd p
reci
pita
tion,
Dev
ils L
ake,
Wis
., 19
80-9
2.
a o 3 a w sr 8 a a. r+
3" a> X Q.
-i g_
o (fi o'
0) Q.
1 a to ET * f JT O
o 8 o 3
CO 5'
964.
0
963.
5 -
963.
0 -
962.
5 -
962.
0 -
_ LU £96
1.5
LU g
CD K LU
LU
961.
0
960.
5
960.
0
959.
5
959.
0
958.
5
958.
0
Mis
sing
re
cord
Lake
Mis
sing
re
cord
Mis
sing
re
cord
O
N
1991
M
1992
Figu
re 6
. La
ke a
nd w
ater
-tab
le a
ltitu
de a
t the
gag
ing
stat
ion,
Dev
ils L
ake,
Wis
.
RUNOFF COEFFICIENT EVAPORATION COEFFICIENT
4.0
3.5
3.0
LJJO 2.5LJJ CC LJJ
2.0
s1.5
O OCC
1.0 -
0.5 -
00.008
0.1 0.2 0.3 0.4 0.5 0.6 0.7 0.8
Root mean square difference for calibrated model = 0.83 feet
0.009 0.010 0.011
GROUND-WATER-FLOW RATE, IN FEET PER DAY
0.9 1.0
0.012
EXPLANATION
+ GROUND-WATER RATE
A EVAPORATON COEFFICIENT
RUNOFF COEFFICIENT
Figure 7. Relationship between root mean square difference of measured and model-calculated lake stage and evaporation and runoff coefficients and ground- water-flow rates in the hydrologic-budget model of Devils Lake, Wis.
Simulation of Lake Stage and Hyc'rologic Budget 11
(0 3 c_ a 5 (Q
(D
Q>
3
Q.
Q.
^
O_
O
(Q o'
CD
Q.
I f
U> ST (0 0> c ?r O o u> 5'
965.
0
964.
5 -
C/3
111 O D. a cr D.
960.
0
Figu
re 8
. M
odel
-cal
cula
ted
and
mea
sure
d la
ke s
tage
and
pre
cipi
tatio
n, D
evils
Lak
e, W
is.,
1991
-92.
flow from the lake is greater than the measured rate. In addition, at times the average runoff coeffi cient of 0.21 is probably too high to simulate accu rately storm events. For example, the major storm in September 1992 produced runoff too low to cause the simulated increase in stage (fig. 8).
The annual change in model-calculated lake volume compares well to the annual change in measured-lake volume for most years (table 3). The annual residual, defined as the yearly differ ence between the model-calculated and measured change in lake storage ranges from -389 to 250 acre-ft, and the mean is -13 acre-ft. The measured change in lake volume was calculated by relating the change in lake stage (the difference in lake stage at the beginning of the year and the end of the year) to lake volume.
The relative amounts of each hydrologic- budget component are also shown in table 3. The average model-calculated yearly amounts for the simulation period, 1980-92, in order of increasing volume are evaporation (791 acre-ft), precipitation (973 acre-ft), runoff (1,107 acre-ft), and ground- water flow out of the lake (1,323 acre-ft).
Simulations of the Effects of Possible Mitigation Plans on Lake Stage
The model was used to Simula*^ three possi ble mitigation plans to reduce the cycling of phos phorus in the lake. The plans involved withdrawing from, or adding water to, the lake. The purpose of the withdrawals or additions is to remove phospho rus-rich hypolimnetic water while maintaining lake stage at an optimum level for recreational use. For each mitigation plan, the Fortran program code (Appendix 1) was modified.
Mitigation plan 1 is to withdraw phosphorus- rich water from near the lake bottom (hypolimnetic water) during late summer (Richard Lathrop, Wis consin Department of Natural Resources, Bureau of Research, oral commun., 1991). Figure 9 shows the effects of removing water from the lake at two different rates during the months of September for 1980-92 and compares the results to the calibra tion stage for the same period. The hydrographs of simulated lake stage are shown as a result of with drawing the volume of water occup:ed by the low ermost 3.28 and 6.56 ft of lake dep'h every September. The volumes of the lowermost 3.28
Table 3. Model-calculated hydrologic-budget components and measured change in lake volume, Devils Lal e, Wis. [all values are in acre-feet]
Model calculated
Water year 1
1980
1981
1982
1983
1984
1985
1986
1987
1988
1989
1990
1991
Average
Precipitation
864
816
1,053
938
1,290
1,229
837
912
817
956
875
1,083
973
Evaporation
720
689
687
707
836
772
858
1,071
781
784
797
787
791
Net ground- water flow
1,307
1,307
1,306
1,319
1,328
1,355
1,359
1,345
1,319
1,310
1,309
1,311
1,323
Surface runoff
929
917
1,261
1,075
1,468
1,355
941
1,027
965
1,071
998
1,273
1,107
Change in volume
-233
-263
322-14
594
457-438
-476
-318
-69
-233
258-34
Measured change in volume
-292
0
359-11
415
373-348
-440
-493
320-483
338-22
Residual
59-263
-37
-3
179
84-90
-36
175-389
250-80
-13
October 1 through September 30.
Simulation of Lake Staga and Hyd-ologic Budget 13
eg 3
c_ a o IQ
(D
D)
966
o IQ o'
CD
1 a a I at ET 0) D) C
JT O o o 3
(A
950
1980
1981
1982
1983
1984
1985
1986
1987
1988
19
8919
9019
9119
92
Figu
re 9
. M
odel
-cal
cula
ted
lake
sta
ge fo
r ca
libra
tion
and
with
draw
al o
f 3.2
8 an
d 6.
56 fe
et o
f hyp
olim
netic
w
ater
from
Dev
ils L
ake,
Wis
., du
ring
the
mon
ths
of S
epte
mbe
r, 19
80-9
2 (m
itiga
tion
plan
1).
and 6.56 depths are 5,600,000 and 16,300,000 ft3 , respectively. For withdrawal of the 3.28 ft and 6.56 ft volumes during September, water must be pumped continuously at rates of 972 and 2,800 gallons per minute, respectively. The lake stage is approximately 3.98 and 11.03 ft lower, respec tively, than the simulated lake stage with no with drawals (calibration stage) at the end of this period. If 95 percent of the 6.56 ft volume were returned, the simulated lake stage at the end of the 1980-92 period is approximately 0.5 ft lower than the simulated lake stage with no withdrawals.
Mitigation plan 2 is to withdraw water in Sep tember but only during years of high stages. The effects of removing the 6.56 ft volume during Sep tember 1986, a high-stage period, in relation to the calibration stage are shown in figure 10. The results indicate that even in 1992 (6 years after the 1986 withdrawal) lake stage is more than 1.0 ft lower than it would be had the withdrawal not occurred.
Both of these simulated mitigation plans would lower the lake stage to levels unacceptable for optimal recreation use. An optimal lake stage for recreation is assumed to be 963.75 ft above sea level, which is the approximate elevation of the end of asphalt closest to the lake at the boat landing.
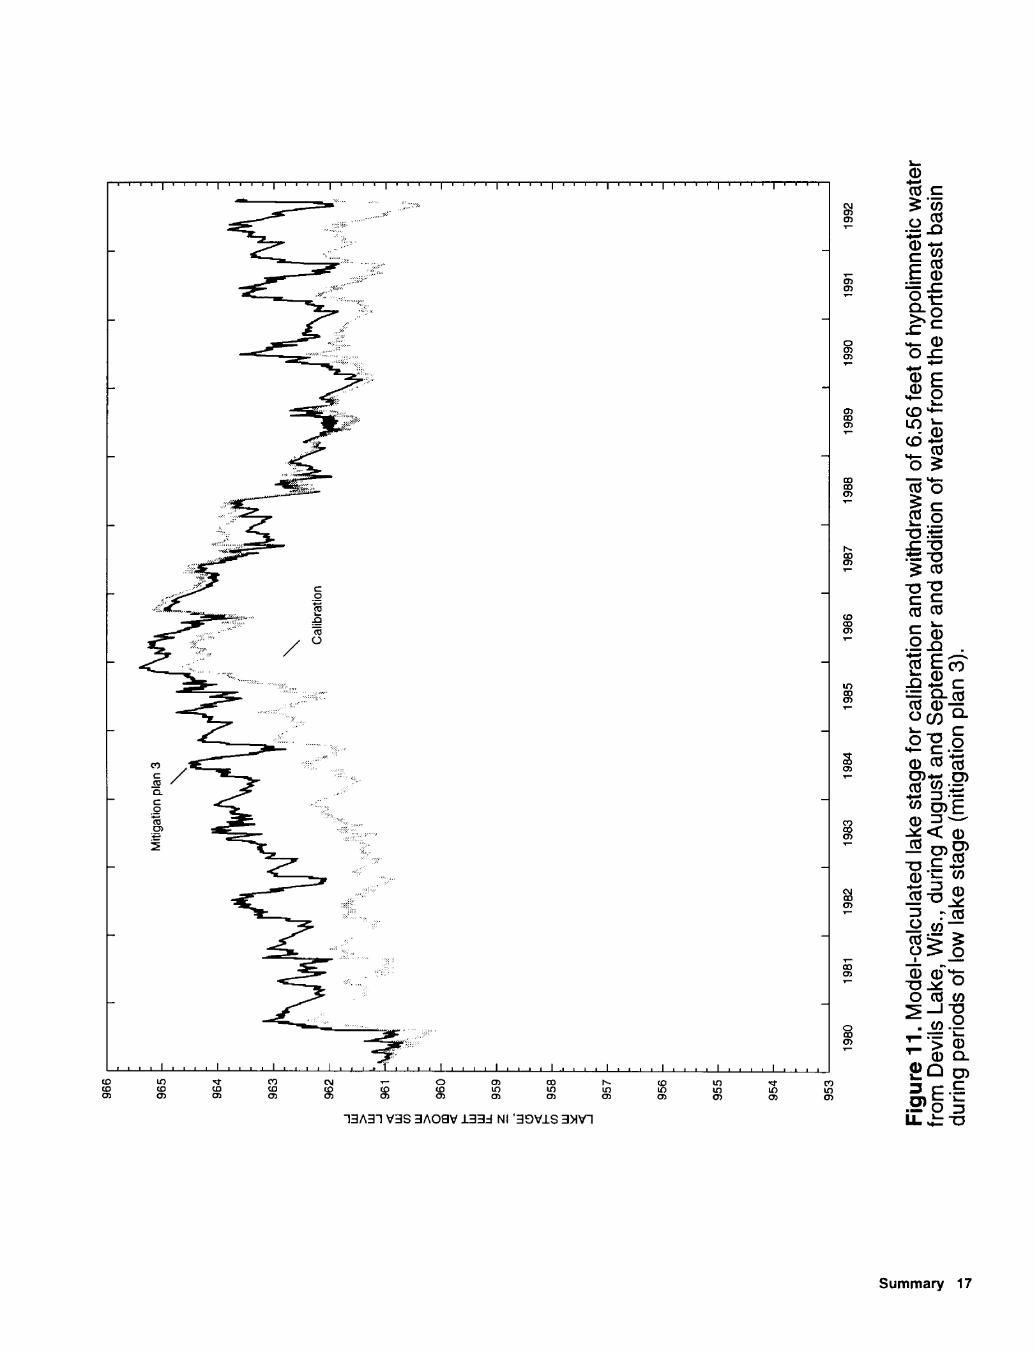
A third mitigation plan is to maintain an optimal lake stage while withdrawing hypolimnetic water in August and September. Water withdrawn would be replaced with water from the intermittent stream in the watershed northeast of the Devils Lake water shed (fig. 1) by means of a control structure. The intermittent stream flows from east to west until it turns north, where it comes within about 200 ft of the northern side of Devils Lake. The drainage area of this watershed upstream of the proposed diversion point is 1.65 mi2 . The Fortran program code was modified to account for available runoff that could be diverted from this basin to Devils Lake.
Mitigation plan 3 is simulated as follows: (1) Withdraw the 6.56 ft volume during August and September; (2) whenever lake stage is below a stage of 962.00, water is not withdrawn but is added from the northeastern basin; (3) add water from the northeastern basin equal to the amount
withdrawn during August and September, if the lake stage is greater than 963.00; a nd (4) no water will be added if the stage is greater than 963.75 (the optimal lake stage) from the northeastern basin, but will still be withdrawn during August and September. In figure 11, the resultr of this simula tion are shown for the period 1980-92, along with the calibration stage for the same period. In gen eral, the effect of mitigation plan 3 is to increase lake stage during periods when lake stage would normally be low (that is, without the addition of water from the northeastern basin) and to de crease lake stage when lake stage would normally be high (that is, without the withdrawal of hypolim netic water). Mitigation plan 3 increases or decreases lake stage to maintain th^ optimal stage of 963.75.
SUMMARY
An understanding of the hydrology of Devils Lake is needed to develop a mitigetion plan to reduce phosphorus input. A model that can be used to estimate changes in lake stage resulting from variation in hydrologic-budget components and withdrawals of water from the lake was devel oped to test current understanding of lake hydrol ogy and was used to simulate thre3 possible mitigation plans.
Daily lake stage is simulated in the model by summing estimates of hydrologic-budget compo nents. The Devils Lake hydrologic-budget compo nents are precipitation on the lake surface, evaporation from the lake surface, runoff (consist ing of overland flow to the lake and an intermittent stream flowing into the lake), and around-water flow into and out of the lake. Amounts of precipita tion and pan evaporation (multiplied by a coeffi cient) recorded at the nearby weat'~er stations in Baraboo and Arlington, respectively, were used to estimate these components. A gaging station installed at the lake measured precipitation for July 1991 through September 30,1992. A runoff coeffi cient was multiplied by daily precip'tation and drainage area to estimate the runo* component. The method of calculating runoff volume was varied seasonally: the water equivalent of daily snowfall during the winter was summed and released to the lake on February 15 and March 15,
Summary 15
_ a 0 (Q
(D
0) Q.
n
O_
O to o'
on in ST O O
966
965
964
963
962
961
LU s s CO
LU §
960
LU
LU LU 3
959
958
957
956
955
954
953
Cal
ibra
tion
With
draw
al o
f 6.
56 fe
et
durin
g S
epte
mbe
r 19
86
1980
19
81
1982
19
83
1984
19
85
1986
19
87
1988
19
89
1990
19
91
1992
Figu
re 1
0. M
odel
-cal
cula
ted
lake
sta
ge fo
r ca
libra
tion
and
with
draw
al o
f 6.5
6 fe
et o
f hyp
olim
netic
wat
er
from
Dev
ils L
ake,
Wis
., du
ring
Sep
tem
ber
1986
(m
itiga
tion
plan
2).
w i ni 2
HI
HI
_l
HI
CO
HI
966
965
964
96
3
962
961
2
960
959
Lif
C3 CO
958
HI
957
956
955
95
4
953
II
II
I
1980
19
81
1982
19
83
1984
19
85
1986
19
87
1988
19
89
1990
19
91
1992
Figu
re 1
1. M
odel
-cal
cula
ted
lake
sta
ge f
or c
alib
ratio
n an
d w
ithdr
awal
of
6.56
feet
of
hypo
limne
tic w
ater
fr
om D
evils
Lak
e, W
is.,
durin
g A
ugus
t an
d S
epte
mbe
r an
d ad
ditio
n of
wat
er fr
om t
he n
orth
east
bas
in
durin
g pe
riods
of
low
lake
sta
ge (
miti
gatio
n pl
an 3
).
and runoff was calculated for the summer months when precipitation exceeded 0.5 in. on the day of interest or when precipitation had fallen on the pre vious day. Net ground-water flow leaving the lake was calculated by multiplying the current lake area by a coefficient.
The model was calibrated by comparing model-calculated and measured lakes stages for the period 1980-92. The root mean square of the differences of simulated and measured daily lake stage for the period 1980-92 is 0.83 ft. Simulated lake stage is very sensitive to small changes in the evaporation and runoff coefficients and the ground-water-flow rate. A 10-percent change in the values of the coefficients or ground-water-flow rate causes the root mean square of the differ ences of simulated and measured lake stage to be greater than 1 ft.
The average model-calculated yearly volume for the simulation period 1980-92, in order of increasing volume, is evaporation (791 acre-ft), precipitation (973 acre-ft), runoff (1,107 acre-ft), and net ground-water flow which is out of the lake (1,323 acre-ft).
The model was used to simulate three possi ble mitigation plans to reduce the cycling of phos phorus in the lake. Mitigation plans 1 and 2 would lower lake stage to levels unacceptable for optimal recreation use. Mitigation plan 3, wh:ch includes the diversion of water from a nearby watershed to Devils Lake, allows for withdrawing hypolimnetic water and maintaining lake stage closer to optimal levels than would be possible without mitigation.
REFERENCES CITED
Attig, J.W., Clayton, Lee, Lange, K.I., and Maker, L.J., 1990, The Ice Age geology of Devils Lake State Park: Wiscon sin Geological and Natural History Survey Educational Series 35, 32 p.
Chow, V.T., 1964, Handbook of applied hydrology: New York, McGraw-Hill [variable pagination].
Dickrell, T.J., 1991, Groundwater-lake interaction at Devils Lake, Sauk County, Wisconsin: Madison, University of Wisconsin, Master's thesis, 62 p.
Wisconsin Department of Natural Resources, 1988, A two- year study of Devils Lake-results and management implications: 97 p.
18 Simulation of Staga and the Hydrologic Budgat of Devils Lake, Sauk County, Wisconsin
APPENDIX
Appendix 19
APPENDIX 1. FORTRAN PROGRAM CODE TO SIMULATE CHANGES IN LAKH STAGE DUE TO VARIATIONS IN HYDROLOGIC-BUDGET COMPONENTS
C CC PRECIP IS PRECIPITATION FROM BARABOO OR GAGE (INCHES) C PI IS DIRECT PRECIPITATION ON LAKE (FEET) C RO IS RUNOFF FROM DRAINAGE AREA (CUBIC FEET) C EVAP IS PAN EVAPORATION FROM ARLINGTON (INCHES) C EO IS EVAPORATION FROM LAKE SURFACE (FEET) C GW IS NET GROUND-WATER FLOW (FEET PER DAY) C SUM IS THE TOTAL PRECIPITATION USED TO CALCULATE RUNOFF C FROM SNOWMELT (FEET) C AREA IS TOTAL LAKE AREA (SQUARE FEET) C STOR IS LAKE STORAGE (CUBIC FEET) C PUMP IS AMOUNT PUMPED FROM LAKE (FEET) C LL IS DAILY LAKE LEVEL (FEET ABOVE MEAN SEA LEVEL) CC READ IN DATE AND PRECIP AND EVAP IN INCHES C