27
MAS Staff Paper No. 31 June 2004 Singapore's Unique Monetary Policy: How Does It Work?

MAS Staff Paper No. 31
June 2004
Singapore's UniqueMonetary Policy:
How Does It Work?

SINGAPORE’S UNIQUE MONETARY POLICY: HOW DOES IT WORK?*
BY
ERIC PARRADO
JUNE 2004 * THIS PAPER WAS PREVIOUSLY PUBLISHED AS AN INTERNATIONAL MONETARY FUND (IMF) WORKING PAPER (NO. 04/10). THE RESEARCH WAS IN PART INITIATED BY ISSUES ARISING FROM THE 2002 IMF ARTICLE IV CONSULTATION IN SINGAPORE. MR. PARRADO, AN ECONOMIST IN THE IMF MONETARY AND FINANCIAL SYSTEMS DEPARTMENT, WAS WITH THE ASIA AND PACIFIC DEPARTMENT WHEN THIS PAPER WAS WRITTEN. HELPFUL COMMENTS WERE RECEIVED FROM BURKHARD DREES, JOSHUA FELMAN, KHOR HOE EE, WILLIAM LEE, SAM OULIARIS, EDWARD ROBINSON, SCOTT ROGER, SUPAAT SAKTIANDI, PHILIP SCHELLEKENS, ABDELHAK SENHADJI, CELINE SIA, AND MARK STONE. THE VIEWS EXPRESSED IN THIS PAPER ARE THOSE OF THE AUTHOR AND SHOULD NOT BE INTERPRETED AS THOSE OF THE IMF OR THE MONETARY AUTHORITY OF SINGAPORE. INTERNATIONAL MONETARY FUND JEL CLASSIFICATION NUMBER: E31, E52, E58, F41 KEYWORDS: EXCHANGE RATE, INFLATION, MONETARY POLICY RULES, SINGAPORE Author’s E-mail Address: [email protected]

MAS Staff Paper No. 31 June 2004
MONETARY AUTHORITY OF SINGAPORE i
ABSTRACT
The Monetary Authority of Singapore, instead of relying on short-term interest rates or monetary aggregates as its monetary policy instrument, conducts policy by managing the trade-weighted exchange rate index (TWI). This paper investigates how this operating procedure actually works. For empirical purposes, it assumes the authorities follow a reaction function that aims the TWI at stabilizing expected inflation and maintaining output at potential. A partial adjustment mechanism is included to dampen the actual changes in the exchange rate. The estimates confirm that the major focus of monetary policy in Singapore is controlling inflation. The estimated changes in the TWI track the actual change relatively well, and the estimated parameters are as expected. Accordingly, they support the hypothesis that monetary policy in Singapore can be described by a forward-looking policy rule that reacts to both inflation and output volatility. The results suggest that Singapore’s monetary policy has mainly reacted to large deviations in the target variables, which is consistent with monetary policy’s medium-term orientation.

MAS Staff Paper No. 31 June 2004
MONETARY AUTHORITY OF SINGAPORE ii
TABLE OF CONTENTS ABSTRACT i TABLE OF CONTENTS ii 1. INTRODUCTION 1 2. CURRENT MONETARY FRAMEWORK 3 A. Narrative Description of MAS’ Policies 4 3. SOURCES OF OUTPUT AND INFLATION VOLATILITY 7
A. Inflation Variance Decomposition 7 B. Output Variance Decomposition 9
4. MONETARY POLICY REACTION FUNCTION 11 5. NEW PHILLIPS CURVE FOR SINGAPORE 17
6. CONCLUSION 19 REFERENCES 21 Tables 1. CPI Inflation Decomposition 8 2. Industrial Production Decomposition 9 3. MAS Reaction Function, Baseline 13 4. MAS Reaction Function, High Inflation Volatility Case 14 5. MAS Reaction Function, High Output Gap Volatility Case 14 Figures 1a. CPI Versus TWI 4 1b. Real GDP Versus TWI 4 2. MAS Target Variation in the TWI Versus Actual TWI 15 3. New Phillips Curve for Singapore 18

MAS Staff Paper No. 31 June 2004
MONETARY AUTHORITY OF SINGAPORE 1
1. INTRODUCTION 1. With increasing globalization and rising international capital flows, determining the appropriate monetary policy is becoming more complex for small open economies such as Singapore. The challenge for policymakers is to assess the different trade-offs among policy objectives, evaluate which economic developments are likely to be the most important in the medium term, identify the key constraints on the operating regime, and gauge the necessary degree of monetary policy transparency. In this context, Singapore has adopted a unique monetary framework centered on managing the exchange rate, aimed primarily at promoting price stability as the basis for sustainable economic growth. Operationally, the policy framework of the Monetary Authority of Singapore (MAS) is focused on managing the Singapore dollar against an undisclosed currency basket. 2 This paper investigates the monetary policy process in Singapore, by estimating a reaction function that characterizes how the monetary policy stance has reacted historically to shifts in underlying economic fundamentals, especially expected inflation and its determinants. The analysis looks beyond the changes in the trade-weighted nominal exchange rate index (TWI), a proxy for the actual policy instrument, to changes in macroeconomic variables that have had an empirically significant impact on the ultimate objectives of monetary policy, and therefore may have influenced the monetary policy stance. This analysis proceeds in three steps. First, a variance decomposition exercise assesses the key macroeconomic factors that affect inflation and economic activity in the short to medium run. Second, a forward-looking reaction function is specified and estimated to assess how historical changes in the trade-weighted nominal exchange rate have responded to changes in the deviation of output and inflation from their respective targets. Finally, a New Phillips Curve is computed with the objective of establishing a stable relationship to forecast inflation. 3 The variance decomposition results suggest that numerous factors affect inflation. Output growth plays an important role in explaining CPI inflation forecast errors in the short-to medium term, while the trade-weighted nominal exchange rate becomes more influential from the third quarter. As to the historical conduct of monetary policy, and consistent with the variance decomposition analysis, the estimated reaction function suggests that policy has had a forward-looking orientation aimed at stabilizing both inflation and output. Its good historical fit suggests that this computed reaction function

MAS Staff Paper No. 31 June 2004
MONETARY AUTHORITY OF SINGAPORE 2
could provide a useful yardstick to characterize monetary policy in Singapore. In addition, forecast of future inflation via the New Phillips Curve appears to be a useful instrument in the setting of monetary policy. 4 These results attempt to contribute to a better understanding of Singapore’s unique monetary policy, supporting the continued efforts made by the MAS to improve the transparency of its monetary framework, and thus to enhance the effectiveness its monetary policy. Greater clarity on the impact of economic fundamentals on the policy stance would result in a more transparent policy framework that could help secure policy credibility and enrich public understanding of how policy works. 5 The paper is organized as follows. Section 2 describes the current monetary/exchange rate policy framework in Singapore, and provides a brief summary of its operation during the past two decades. Section 3 presents the results of a variance decomposition analysis to determine the sources of output and inflation volatility. Section 4 specifies and estimates a policy reaction function for Singapore. Section 5 provides evidence supporting the use of a New Phillips Curve to understand inflation dynamics in Singapore. The final section summarizes the results and their implications for monetary policy.

MAS Staff Paper No. 31 June 2004
MONETARY AUTHORITY OF SINGAPORE 3
2. CURRENT MONETARY FRAMEWORK
6 The main objective of monetary policy is to maintain price stability to ensure sustainable growth:
The primary objective of monetary policy is to ensure low inflation as a sound basis for sustained economic growth. In Singapore, monetary policy is centered on the management of the exchange rate, rather than money supply or interest rates. This reflects the fact that, in the small and open Singapore economy, the exchange rate is the most effective tool in maintaining price stability.1
7 Since 1981, the MAS has managed the Singapore dollar exchange rate against an undisclosed trade-weighted basket of currencies of Singapore’s major trading partners and competitors. The composition of this basket is reviewed and revised periodically to take into account changes in Singapore’s trade patterns, but details concerning the index and the boundaries of the target band are not disclosed. The MAS guides the exchange rate to appreciate or depreciate depending mainly on whether expected inflationary pressures are strong or weak, respectively. Recognizing the lags in monetary policy, the MAS gauges the appropriate policy stance and operates in a forward-looking manner by taking into account trends and anticipated developments in the domestic economy and external environment. MAS’ policies have been accompanied by recent efforts to increase disclosure and enhance transparency, through the release of the Monetary Policy Statement and the analysis of economic developments in its Macroeconomic Review. 8 The MAS implements its exchange rate policy through direct sales or purchases of the U.S. dollar in the foreign exchange market. Supplementing its foreign exchange intervention operations, money market operations serve to offset short-term fluctuations in banking liquidity. The money market tools available include foreign exchange swaps, interbank lending/borrowing, and sales/purchases or repurchase agreements in government securities.
1 Monetary Authority of Singapore (2001a).
MAS Staff Paper No. 31 June 2004
MONETARY AUTHORITY OF SINGAPORE 4
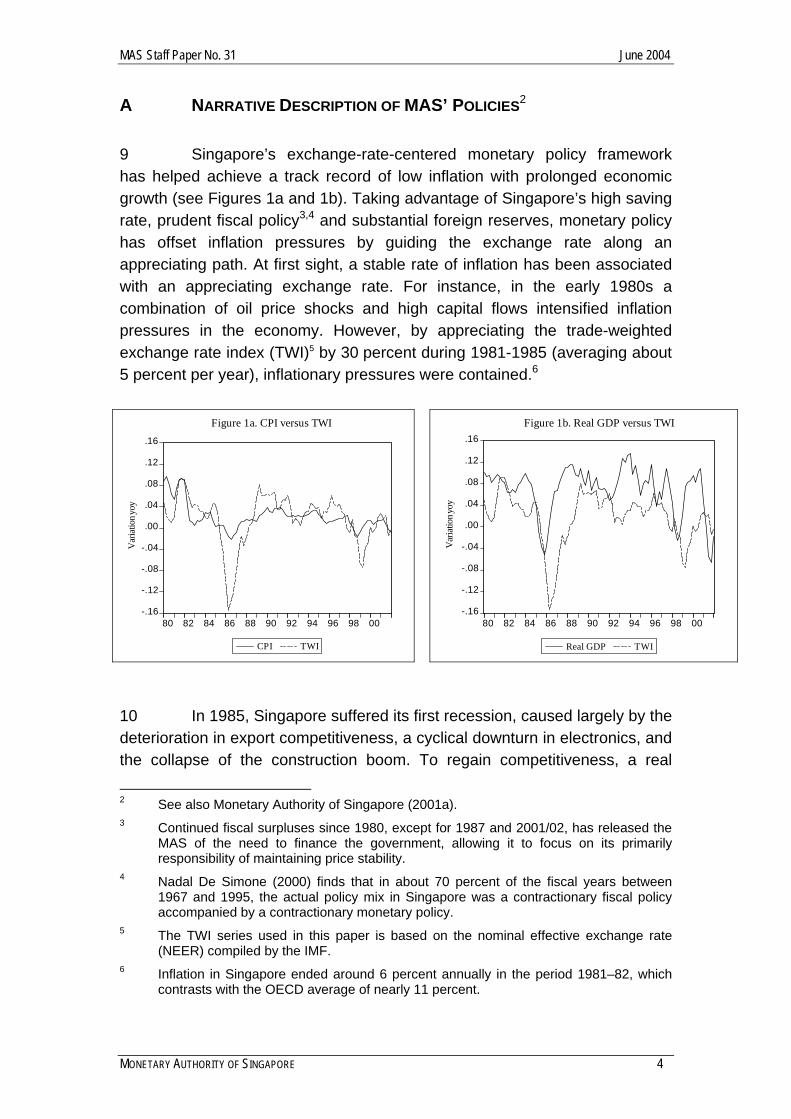
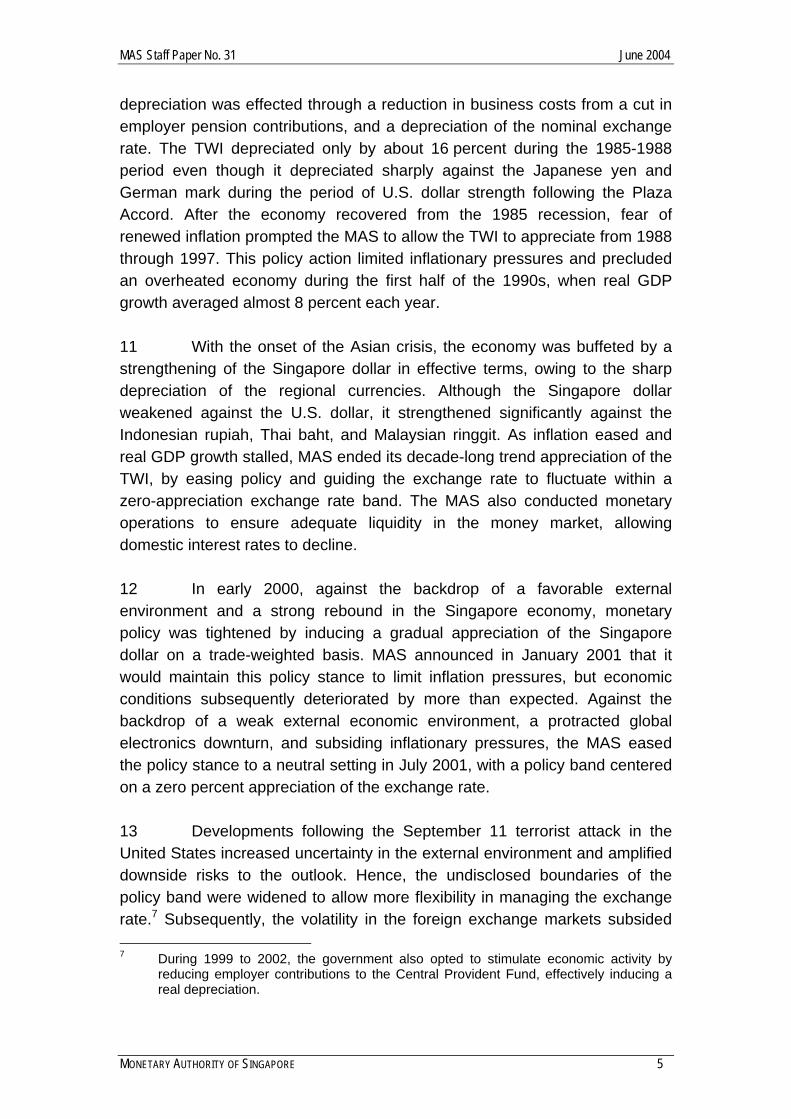
A NARRATIVE DESCRIPTION OF MAS’ POLICIES2 9 Singapore’s exchange-rate-centered monetary policy framework has helped achieve a track record of low inflation with prolonged economic growth (see Figures 1a and 1b). Taking advantage of Singapore’s high saving rate, prudent fiscal policy3,4 and substantial foreign reserves, monetary policy has offset inflation pressures by guiding the exchange rate along an appreciating path. At first sight, a stable rate of inflation has been associated with an appreciating exchange rate. For instance, in the early 1980s a combination of oil price shocks and high capital flows intensified inflation pressures in the economy. However, by appreciating the trade-weighted exchange rate index (TWI)5 by 30 percent during 1981-1985 (averaging about 5 percent per year), inflationary pressures were contained.6
-.16
-.12
-.08
-.04
.00
.04
.08
.12
.16
80 82 84 86 88 90 92 94 96 98 00
CPI TWI
Var
iatio
n yoy
Figure 1a. CPI versus TWI
-.16
-.12
-.08
-.04
.00
.04
.08
.12
.16
80 82 84 86 88 90 92 94 96 98 00
Real GDP TWI
Var
iatio
n yoy
Figure 1b. Real GDP versus TWI
10 In 1985, Singapore suffered its first recession, caused largely by the deterioration in export competitiveness, a cyclical downturn in electronics, and the collapse of the construction boom. To regain competitiveness, a real
2 See also Monetary Authority of Singapore (2001a). 3 Continued fiscal surpluses since 1980, except for 1987 and 2001/02, has released the
MAS of the need to finance the government, allowing it to focus on its primarily responsibility of maintaining price stability.
4 Nadal De Simone (2000) finds that in about 70 percent of the fiscal years between 1967 and 1995, the actual policy mix in Singapore was a contractionary fiscal policy accompanied by a contractionary monetary policy.
5 The TWI series used in this paper is based on the nominal effective exchange rate (NEER) compiled by the IMF.
6 Inflation in Singapore ended around 6 percent annually in the period 1981–82, which contrasts with the OECD average of nearly 11 percent.
MAS Staff Paper No. 31 June 2004
MONETARY AUTHORITY OF SINGAPORE 5
depreciation was effected through a reduction in business costs from a cut in employer pension contributions, and a depreciation of the nominal exchange rate. The TWI depreciated only by about 16 percent during the 1985-1988 period even though it depreciated sharply against the Japanese yen and German mark during the period of U.S. dollar strength following the Plaza Accord. After the economy recovered from the 1985 recession, fear of renewed inflation prompted the MAS to allow the TWI to appreciate from 1988 through 1997. This policy action limited inflationary pressures and precluded an overheated economy during the first half of the 1990s, when real GDP growth averaged almost 8 percent each year. 11 With the onset of the Asian crisis, the economy was buffeted by a strengthening of the Singapore dollar in effective terms, owing to the sharp depreciation of the regional currencies. Although the Singapore dollar weakened against the U.S. dollar, it strengthened significantly against the Indonesian rupiah, Thai baht, and Malaysian ringgit. As inflation eased and real GDP growth stalled, MAS ended its decade-long trend appreciation of the TWI, by easing policy and guiding the exchange rate to fluctuate within a zero-appreciation exchange rate band. The MAS also conducted monetary operations to ensure adequate liquidity in the money market, allowing domestic interest rates to decline. 12 In early 2000, against the backdrop of a favorable external environment and a strong rebound in the Singapore economy, monetary policy was tightened by inducing a gradual appreciation of the Singapore dollar on a trade-weighted basis. MAS announced in January 2001 that it would maintain this policy stance to limit inflation pressures, but economic conditions subsequently deteriorated by more than expected. Against the backdrop of a weak external economic environment, a protracted global electronics downturn, and subsiding inflationary pressures, the MAS eased the policy stance to a neutral setting in July 2001, with a policy band centered on a zero percent appreciation of the exchange rate. 13 Developments following the September 11 terrorist attack in the United States increased uncertainty in the external environment and amplified downside risks to the outlook. Hence, the undisclosed boundaries of the policy band were widened to allow more flexibility in managing the exchange rate.7 Subsequently, the volatility in the foreign exchange markets subsided 7 During 1999 to 2002, the government also opted to stimulate economic activity by
reducing employer contributions to the Central Provident Fund, effectively inducing a real depreciation.
MAS Staff Paper No. 31 June 2004
MONETARY AUTHORITY OF SINGAPORE 6
even though significant global uncertainty remains. The width of the band has been narrowed, but the overall thrust of monetary policy has continued with a neutral stance until April 2004, when the MAS announced a shift of policy towards a gradual and modest appreciation of the TWI. 14 With this background, the next sections analyze the determinants of inflation as a basis for specifying a policy reaction function that could reproduce these historical shifts in the policy stance. The impact of the direct effects of the exchange rate on inflation and its indirect effects through output changes will shed light on the transmission channels of monetary policy. The estimated reaction function would be used to gauge how changes in economic fundamentals influence changes in the monetary policy stance, as reflected in the changes in the TWI.

MAS Staff Paper No. 31 June 2004
MONETARY AUTHORITY OF SINGAPORE 7
3. SOURCES OF OUTPUT AND INFLATION VOLATILITY
15 This section presents a variance decomposition analysis to determine the key macroeconomic factors that affect inflation and economic activity, and particularly to assess the impact of the trade-weighted exchange rate index. To determine the variance decomposition, a vector autoregressive (VAR) approach is used.8 The model uses six variables to describe the Singapore economy: industrial production, the consumer price index (CPI), a world commodity price index, a foreign interest rate, a domestic interest rate, and the trade-weighted exchange rate index (TWI). The sample period runs from January 1991 to April 2002.9 16 Two variables are assumed to be exogenous: the world commodity price index and the foreign interest rate. The world commodity price index is included to control for the systematic component of the policy rule so that exogenous monetary policy changes can be identified. In other words, the world commodity price is introduced as a forecasting indicator for economic activity and general price developments.10 The empirical model also incorporates a foreign interest rate, given by the U.S. Federal Funds rate, to capture changes in international financial conditions. This variable is included to control for the component of domestic monetary policy that reacts to foreign monetary policy innovations.
A. INFLATION VARIANCE DECOMPOSITION 17 Real domestic activity (industrial output) plays the most important role in explaining price level fluctuations (accounting for over 50 percent of the 8 Note that variables in this section that are labeled as monetary policy shock are not
computed with a policy reaction function. They are, instead, random components that cannot be explained by the variables in the VAR.
9 The VAR is performed using log differences in 12 months, except for the two interest rates, which are in levels. In terms of optimal lags, different tests recommend diverse number of lags. For example, the likelihood ratio test (LRT) and the Akaike Information Criterion (AIC) suggest the use of twelve lags; while the Schwarz Bayesian Criterion (SBC) and the Hannan-Quinn Criterion (HQC) advise the use of one lag. This model is specified with twelve lags.
10 Many studies have found that including commodity prices helps to resolve the so-called price puzzle usually found in the VAR literature, where contractionary monetary policy shocks are related to increases (rather than decreases) in the price level. See Sims (1992), Cushman and Zha (1997), Kim (1999), and Kim and Roubini (2000), among others.

MAS Staff Paper No. 31 June 2004
MONETARY AUTHORITY OF SINGAPORE 8
Table 1. CPI Inflation Decomposition (1991:01–2002:04) Horizon Std.
Error ∆World
Commodity Price Index
∆Industrial Production
CPI Inflation
Foreign Interest
Rate
Domestic Interest
Rate
∆TWI
1 0.003 4.627 1.865 93.508 0.000 0.000 0.000 6 0.006 7.069 48.292 25.123 7.242 3.594 8.679
12 0.010 7.560 55.603 9.248 2.958 1.701 22.930 18 0.012 11.737 49.568 8.900 5.277 1.664 22.854 24 0.015 8.726 45.062 6.412 20.066 2.476 17.257
Source: IMF staff estimates.
variance in the first year; see Table 1). The monetary policy shock, given by changes in the TWI has relatively little impact on CPI inflation initially, but becomes more influential after the third quarter (close to 20 percent).11 The latter result is consistent with MAS (2001b), which concludes that in the first stage pass-through (the impact from TWI fluctuations to import prices) there are some lags in the short run and it is complete in the long run. In particular, ceteris paribus, a 1 percent depreciation in the TWI would increase import prices by about 0.25 percent by the fourth quarter. Subsequently, in the second stage pass-through, in which domestic firms would be expected to pass on to consumers the costs incurred from TWI fluctuations, there seems to be a weaker relationship between import prices and consumer prices. These results are also consistent with Taylor (2000) and Gagnon and Ihrig (2001). They argue that the recently-observed declines in the pass-through to aggregate prices are the result of a low inflation environment. In a low inflation economy like Singapore, the emphasis of the monetary authority on controlling inflation could have reduced the ability of firms to pass on changes in costs and, hence, it could explain the relatively small impact of the TWI on the CPI in the short run.
18 An alternative explanation for the moderated impact of TWI fluctuations on the CPI in the short run is the presence of indirect channels through which the exchange rate may affect the CPI. For instance, in the assessment of the relationship between the exchange rate and inflation, the output variable used in the variance decomposition may also be capturing one of the indirect monetary policy channels and thus, lead to possible simultaneity effects. In particular, appreciating the TWI may reduce inflation
11 Using quarterly data and GDP in place of industrial production, the exchange rate
shock continued to have a relatively low explanatory power for CPI inflation, reaching a maximum of 7.9 percent in the sixth quarter.
MAS Staff Paper No. 31 June 2004
MONETARY AUTHORITY OF SINGAPORE 9
Table 2. Industrial Production Decomposition (1991:01–2002:04) Horizon Std.
Error ∆World
Commodity Price Index
∆Industrial Production
CPI Inflation
Foreign Interest
Rate
Domestic Interest
Rate
∆TWI
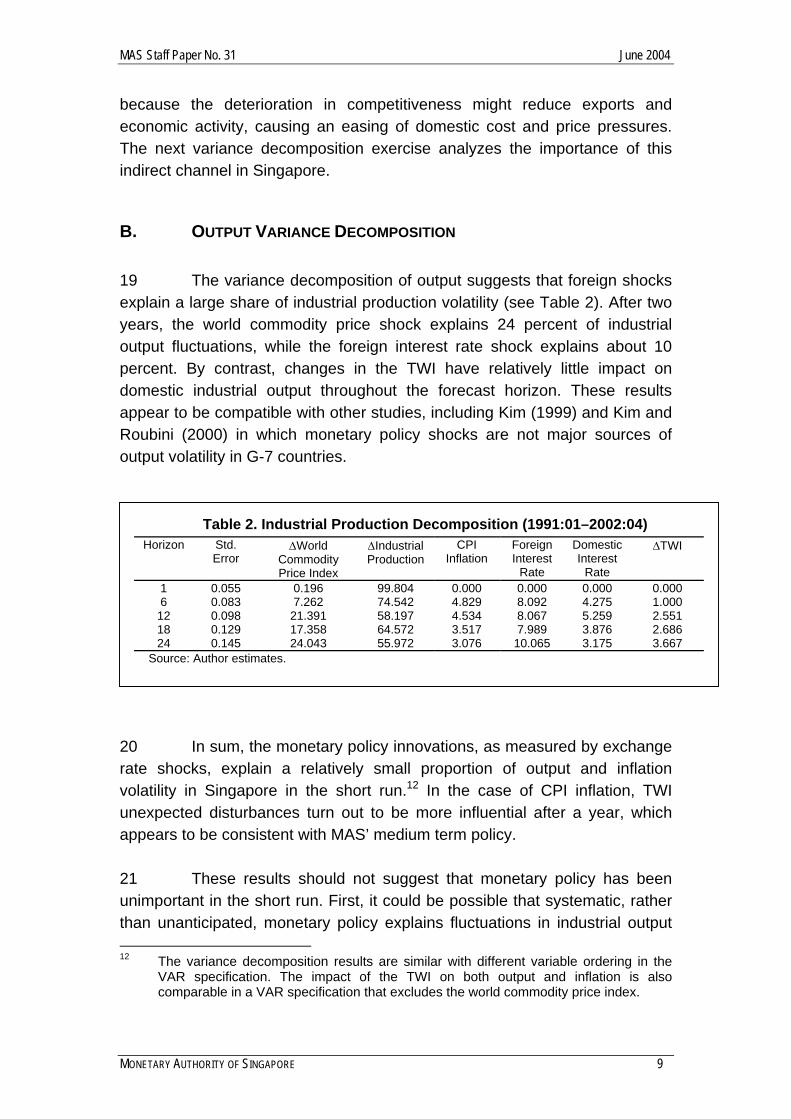
1 0.055 0.196 99.804 0.000 0.000 0.000 0.000 6 0.083 7.262 74.542 4.829 8.092 4.275 1.000 12 0.098 21.391 58.197 4.534 8.067 5.259 2.551 18 0.129 17.358 64.572 3.517 7.989 3.876 2.686 24 0.145 24.043 55.972 3.076 10.065 3.175 3.667
Source: Author estimates.
because the deterioration in competitiveness might reduce exports and economic activity, causing an easing of domestic cost and price pressures. The next variance decomposition exercise analyzes the importance of this indirect channel in Singapore.
B. OUTPUT VARIANCE DECOMPOSITION 19 The variance decomposition of output suggests that foreign shocks explain a large share of industrial production volatility (see Table 2). After two years, the world commodity price shock explains 24 percent of industrial output fluctuations, while the foreign interest rate shock explains about 10 percent. By contrast, changes in the TWI have relatively little impact on domestic industrial output throughout the forecast horizon. These results appear to be compatible with other studies, including Kim (1999) and Kim and Roubini (2000) in which monetary policy shocks are not major sources of output volatility in G-7 countries.
20 In sum, the monetary policy innovations, as measured by exchange rate shocks, explain a relatively small proportion of output and inflation volatility in Singapore in the short run.12 In the case of CPI inflation, TWI unexpected disturbances turn out to be more influential after a year, which appears to be consistent with MAS’ medium term policy. 21 These results should not suggest that monetary policy has been unimportant in the short run. First, it could be possible that systematic, rather than unanticipated, monetary policy explains fluctuations in industrial output 12 The variance decomposition results are similar with different variable ordering in the
VAR specification. The impact of the TWI on both output and inflation is also comparable in a VAR specification that excludes the world commodity price index.
MAS Staff Paper No. 31 June 2004
MONETARY AUTHORITY OF SINGAPORE 10
and CPI inflation. Second, the monetary policy shock may not be perfectly identified. In other words, there may be some news about economic activity and inflation that the monetary authority uses but it is not summarized in the information set of the model. Finally, variance decomposition exercises do not isolate the effect of a one-time shock to monetary policy on current and future values of output and inflation. As Clarida and Gertler (1997) put it “variance decomposition exercises are silent on the importance of the policy feedback rule.” The next section addresses this latter issue.

MAS Staff Paper No. 31 June 2004
MONETARY AUTHORITY OF SINGAPORE 11
4. MONETARY POLICY REACTION FUNCTION 22 This section specifies and estimates a reaction function for changes in the monetary policy instrument, as proxied by the trade-weighted exchange rate index (TWI). The conventional empirical policy reaction functions, where a domestic interest rate or monetary aggregate is the policy variable, are modified to allow the monetary policy stance to be characterized by changes in the TWI.13 23 The policy reaction function would work as follows: assume that within each operating period the MAS has a target for the change in the TWI,
*te∆ , that is based on the state of the economy. Let it also be assumed that
the MAS cares about stabilizing inflation and output, while allowing for the possibility that the MAS adjusts its policy response to anticipated inflation and output. Specifically:
[ ]( ) [ ]( )_
* * *| |t t n t t m te e E E y yβ π π γ+ +∆ = ∆ + Ω − + Ω − , (1)
where _
e∆ is the long-run equilibrium change in the TWI, t nπ + is the rate of
inflation between periods t and t+n, t my + is real output (or industrial
production) between periods t and t+m, and *π and *y are the targets for
inflation and output, respectively. In particular, *y is defined as the equilibrium level of output that would arise if wages and prices were perfectly flexible. Additionally, E is the expectation operator and tΩ is the information available to the policy maker. 24 To capture concerns about potentially disruptive shifts in the exchange rate, it is assumed that the exchange rate is adjusted only partially to its target level: ( ) *
11t t t te e eρ ρ υ−∆ = − ∆ + ∆ + , (2)
13 In general, major central banks use a short-term interest rate as an operating
instrument of monetary policy; however, in the case of Singapore, the MAS uses the trade-weighted nominal exchange rate as its monetary policy instrument.

MAS Staff Paper No. 31 June 2004
MONETARY AUTHORITY OF SINGAPORE 12
where the parameter [ ]0,1ρ ∈ captures the degree of exchange rate
smoothing. The exogenous random shock to the exchange rate, tυ , is assumed to be i.i.d.
25 To define an estimable equation, let _
*eα βπ= ∆ − and *t tx y y= − ,
then equation (1) can be written as:
[ ] [ ]* | |t t n t t m te E E xα β π γ+ +∆ = + Ω + Ω . (3)
So, combining equation (3) with the partial adjustment mechanism (2) and eliminating the unobserved forecast variables yields:
( ) ( ) ( ) 11 1 1t t n t m t te x eρ α ρ βπ ρ γ ρ ε+ + −∆ = − + − + − + ∆ + , (4)
where the error term tε is a linear combination of the forecast errors of
inflation and output, and the exogenous disturbance tυ . 26 Let tu be a vector of variables (set of instruments) within the
policymaker’s information set (i.e., t tu ∈Ω ) that are orthogonal to tε . Possible
elements of tu include any lagged variables that help forecast inflation and output, as well as any contemporaneous variables that are uncorrelated with the current exchange rate shock tυ . In particular, the choice of instruments used in this paper includes 1 to 6, 9, and 12 lags of CPI inflation, industrial production gap, and the TWI. 27 Thus, since [ ]| 0t tE uε = , the following equation can be estimated
using the Generalized Method of Moments (GMM) with an optimal weighting matrix:14
( ) ( ) ( ) 11 1 1 | 0t t n t m t tE e x e uρ α ρ βπ ρ γ ρ+ + −∆ − − − − − − − ∆ = . (5)
14 The use of an optimal weighting matrix implies that GMM estimates are robust to
heteroskedasticity and autocorrelation of unknown form. It is worth noting that the GMM technique requires no information about the exact distribution of the error term which, in general, is assumed to be drawn from a normal distribution.

MAS Staff Paper No. 31 June 2004
MONETARY AUTHORITY OF SINGAPORE 13
Table 3. MAS Reaction Function (1991:01–2002:04), Baseline Alternative Inflation
Target Horizons α β γ ρ 2R p-value J-test
Current Inflation (n = 0) 0.005
(0.82) 0.975 (2.56)
0.137 (1.28)
0.838 (32.44)
0.86 0.66 16.87
Expected Inflation (n = 6) -0.006 (-0.79)
1.44 (3.37)
0.235 (2.30)
0.831 (30.27)
0.83
0.75 15.47
Expected Inflation (n = 9) -0.008 (-0.91)
1.891 (3.41)
0.423 (3.07)
0.847 (37.80)
0.86
0.85 13.70
Expected Inflation (n = 12) -0.005 (-0.41)
1.824 (2.34)
0.525 (2.49)
0.871 (40.68)
0.86 0.77 15.06
Notes: • t statistics are in parenthesis. • The set of instruments includes 1 to 6, 9, and 12 lags of CPI inflation, industrial production gap, and the TWI.
• The target horizon is assumed to be fixed for the output gap (m=0). Source: IMF staff estimates.
28 Equation (5) is estimated over the sample period from 1991:01 to 2002:04 with year-on-year CPI inflation, detrended industrial output (using the Hodrick-Prescott filter), and the year-on-year change in the TWI. Elements of
tu are lagged values of CPI inflation, output, inflation, and the TWI. The forward-looking horizons are varied (values n and m in the case of inflation and industrial output, respectively) to assess the policy horizon.15 29 Assuming a forward-looking horizon of nine months (n = 9)—that shows the most significant statistical levels—the coefficients associated with expected inflation are positive and significant (see Table 3). They indicate that in response to a one-percent rise in expected inflation, the TWI is appreciated by 1.89 percent, implying a real exchange rate appreciation of 0.89 percent, ceteris paribus. In other words, the real exchange rate is temporarily altered to affect aggregate demand, and thus, inflation. The coefficient associated with the industrial output gap is also positive and significant, suggesting that the monetary authority reacts by appreciating the exchange rate by 0.42 percent when domestic output is one percent above potential. Finally, the coefficient that captures policy inertia is high (ρ ≅ 0.85), indicating that monetary policy adjusts the exchange rate slowly to its projected target level.16
15 Alternative target horizons for industrial output did not change the results. 16 The rationale for this behavior could be given by concerns of increasing vulnerabilities
in financial markets or uncertainty about the effects of sudden exchange rate changes on financial markets or the economy.

MAS Staff Paper No. 31 June 2004
MONETARY AUTHORITY OF SINGAPORE 14
Table 4. MAS Reaction Function (1991:01–2002:04), High Inflation Volatility Excluding observations (=0) if CPI inflation is within 1 standard deviation
Alternative Inflation Target Horizons
α β γ ρ 2R p-value J-test
Current Inflation (n = 0) 0.013 (2.22)
0.590 (1.49)
0.153 (1.36)
0.843 (30.68)
0.88 0.64 17.22
Expected Inflation (n = 6) -0.001 (-0.09)
1.452 (3.76)
0.384 (3.45)
0.831 (32.06)
0.88 0.74 15.63
Expected Inflation (n = 9) 0.000 (0.05)
1.736 (3.73)
0.377 (3.01)
0.828 (33.53)
0.88 0.82 14.25
Expected Inflation (n = 12) 0.002 (0.20)
1.711 (2.54)
0.274 (1.79)
0.852 (41.45)
0.89 0.77 15.10
Notes: • t statistics are in parenthesis. • The set of instruments includes 1 to 6, 9, and 12 lags of CPI inflation, industrial production gap, and the TWI.
• The target horizon is assumed to be fixed for the output gap (m=0). Source: IMF staff estimates.
Table 5. MAS Reaction Function (1991:01–2002:04), High Output Volatility Excluding observations (=0) if industrial output is within 1 standard deviation
Alternative Inflation Target Horizons
α β γ ρ 2R p-value J-test
Current Inflation (n = 0) 0.005
(0.84) 0.968 (2.68)
0.251 (2.19)
0.833 (33.42)
0.88 0.66 16.95
Expected Inflation (n = 6) -0.010 (-1.18)
1.630 (3.53)
0.364 (3.12)
0.829 (34.61)
0.87 0.76 15.23
Expected Inflation (n = 9) -0.012 (-1.35)
2.115 (3.62)
0.558 (3.73)
0.840 (42.34)
0.86 0.87 13.15
Expected Inflation (n = 12) -0.001 (-0.06)
1.395 (2.24)
0.549 (3.10)
0.854 (44.91)
0.88 0.73 15.83
Notes: • t statistics are in parenthesis. • The set of instruments includes 1 to 6, 9, and 12 lags of CPI inflation, industrial production gap, and the TWI.
• The target horizon is assumed to be fixed for the output gap (m=0). Source: IMF staff estimates.
30 These results are corroborated by two additional exercises that test the hypothesis that the monetary policy reacts mainly to large shocks. In particular, Tables 4 and 5 include only large fluctuations (larger than one standard deviation) in CPI inflation and industrial output, respectively. These tables confirm the hypothesis that monetary policy in Singapore reacts to large changes in inflation and large output gaps as the coefficients associated to both variables continue to be significant. On the other hand, regressions (not reported here) suggest that monetary policy hardly responds to shocks that are small (i.e., within one standard deviation).

MAS Staff Paper No. 31 June 2004
MONETARY AUTHORITY OF SINGAPORE 15
31 The reaction function estimates suggest that controlling inflation has been the major focus of monetary policy in Singapore. The estimates support the hypothesis that monetary policy can be described by a forward-looking policy rule that aims the TWI at stabilizing expected inflation and maintaining output at potential.17 In particular, the reaction function includes an implicit inflation targeting component that Clarida, Galí, and Gertler (1999) have argued is a critical feature of good monetary policy management. Moreover, the relative size of the CPI inflation and output coefficients suggest that monetary policy has placed a relatively high degree of importance on maintaining low and stable inflation. However, a key requirement for implementing this forward-looking policy rule is for the policymaker to have the capacity to forecast inflation accurately (see Section 5).18
-.04
-.02
.00
.02
.04
-.12
-.08
-.04
.00
.04
.08
91 92 93 94 95 96 97 98 99 00
Residual Actual Fitted
Resid
ual
Variation in the TW
I
Figure 2. MAS Target Variation in the TWI versus Actual TWI
17 The J-statistics (Hansen (1982)) imply that the over-identifying restrictions of these
models are not rejected. 18 The output gap enters the instrument set for expected inflation. Therefore, the
coefficient associated to the output gap reflects the influence on the TWI that is independent of its predictive power for inflation.

MAS Staff Paper No. 31 June 2004
MONETARY AUTHORITY OF SINGAPORE 16
32 To gauge the fit and historical accuracy of the estimated reaction function, Figure 2 plots the estimated target of changes in the TWI described by equation (5) against the actual changes from 1991 through April 2001. The target tracks the actual change in the exchange rate relatively well, suggesting that the model provides a reasonable description of monetary/exchange rate policy in Singapore during this period. 33 The forecast errors indicate that at the inception of the Asian crisis, the estimated reaction function continued to track actual changes in monetary policy well. However, policy clearly shifted in 1998 and 1999. In particular, at the beginning of 1998, the model suggests that policy was somewhat tighter than the rule would have projected, when the real economy was stagnating and inflation was low.19 Conversely, policy was somewhat easier at the end of 1998 and beginning of 1999, when prices were recovering from the negative trend in previous quarters. 34 One of the key difficulties confronting policymakers is to understand inflation dynamics and, thus, predict inflation accurately even in periods with low uncertainty. Indeed, many central banks rely on forecasts of future inflation to set monetary policy despite embracing different policy frameworks. There are models that use marginal costs or some measure of economic activity as the main explanatory variable of inflation. There are also representations to forecast inflation based on traditional Phillips curves,20 *p models,21 or real interest rate gap models.22 However, as Stock and Watson (1999) point out, inflation forecasts based on Phillips curves generally have been more accurate than forecasts produced by other macroeconomic variables, including interest rates, monetary aggregates, and commodity prices. The next section presents empirical results using the so-called New Phillips Curve (NPC) framework for analyzing inflation.
19 At that time, although most market commentators agreed that Asian currencies were
massively undervalued, few predicted a rebound so soon. 20 See King and Watson (1994) and, more recently, Haldane and Quah (1999). 21 See, among others, Kool and Tatom (1994) and Gerlach and Svensson (2001). 22 For recent work, see Woodford (2003).
MAS Staff Paper No. 31 June 2004
MONETARY AUTHORITY OF SINGAPORE 17
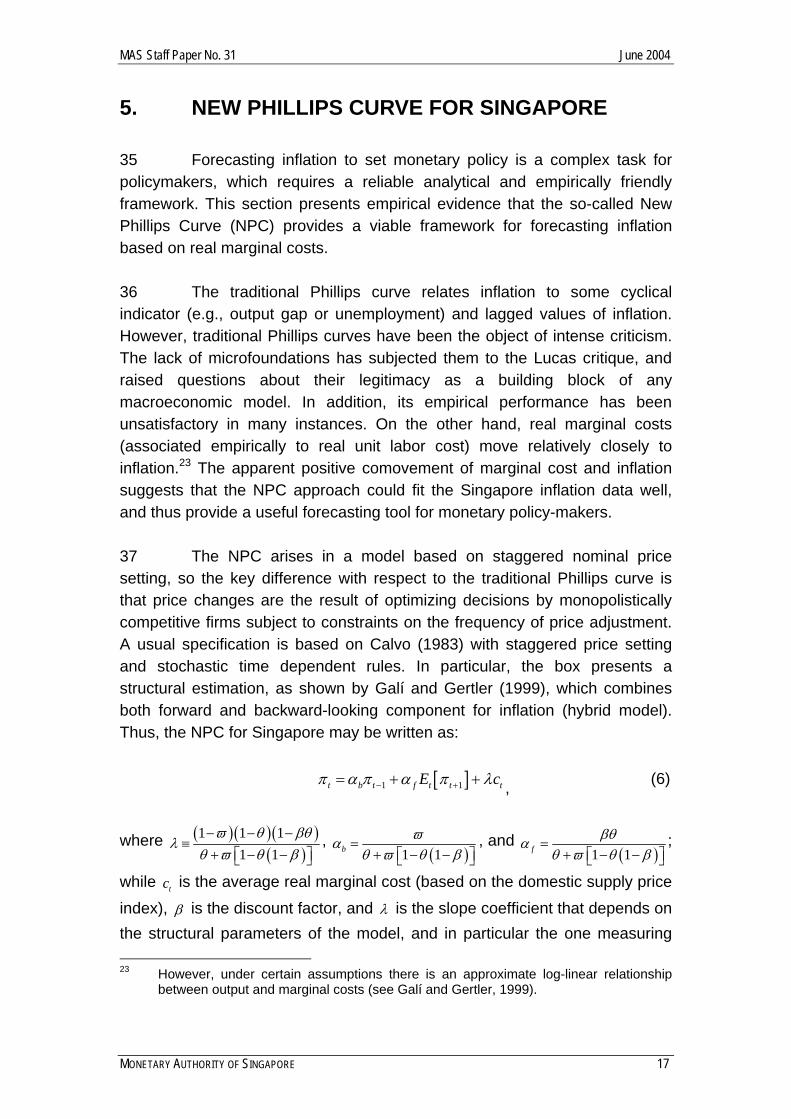
5. NEW PHILLIPS CURVE FOR SINGAPORE 35 Forecasting inflation to set monetary policy is a complex task for policymakers, which requires a reliable analytical and empirically friendly framework. This section presents empirical evidence that the so-called New Phillips Curve (NPC) provides a viable framework for forecasting inflation based on real marginal costs. 36 The traditional Phillips curve relates inflation to some cyclical indicator (e.g., output gap or unemployment) and lagged values of inflation. However, traditional Phillips curves have been the object of intense criticism. The lack of microfoundations has subjected them to the Lucas critique, and raised questions about their legitimacy as a building block of any macroeconomic model. In addition, its empirical performance has been unsatisfactory in many instances. On the other hand, real marginal costs (associated empirically to real unit labor cost) move relatively closely to inflation.23 The apparent positive comovement of marginal cost and inflation suggests that the NPC approach could fit the Singapore inflation data well, and thus provide a useful forecasting tool for monetary policy-makers. 37 The NPC arises in a model based on staggered nominal price setting, so the key difference with respect to the traditional Phillips curve is that price changes are the result of optimizing decisions by monopolistically competitive firms subject to constraints on the frequency of price adjustment. A usual specification is based on Calvo (1983) with staggered price setting and stochastic time dependent rules. In particular, the box presents a structural estimation, as shown by Galí and Gertler (1999), which combines both forward and backward-looking component for inflation (hybrid model). Thus, the NPC for Singapore may be written as:
[ ]1 1t b t f t t tE cπ α π α π λ− += + + , (6)
where ( )( )( )( )
1 1 11 1
ϖ θ βθλ
θ ϖ θ β− − −
≡+ − −
, ( )1 1b
ϖαθ ϖ θ β
=+ − −
, and ( )1 1f
βθαθ ϖ θ β
=+ − −
;
while tc is the average real marginal cost (based on the domestic supply price
index), β is the discount factor, and λ is the slope coefficient that depends on the structural parameters of the model, and in particular the one measuring 23 However, under certain assumptions there is an approximate log-linear relationship
between output and marginal costs (see Galí and Gertler, 1999).

MAS Staff Paper No. 31 June 2004
MONETARY AUTHORITY OF SINGAPORE 18
the degree of price rigidity, as measured by θ (the fraction of firms that keep their prices constant). The model allows for a fraction of firms, ϖ , that function as backward-looking price setters. 38 Using quarterly data for the period 1981:01 to 2002:01, the main predictions of the hybrid model appear to be satisfied. In particular, the coefficient associated to the marginal cost is positive (0.025) and significantly different from zero. The estimated parameters related to the degree of price rigidity (0.743) suggest that the average duration of prices in Singapore is around 4 quarters. 39 The estimates imply that the backward-looking price setters have been less important than forward-looking ones in influencing the dynamics of inflation in Singapore. The estimate of ϖ , the fraction of forward-looking price setters, is around 0.464 leading to backward and forward-looking components for inflation, of bα and fα around 0.4 and 0.6, respectively.
40 Since the estimated inflation rate tracks the actual rate relatively well, the NPC model could be useful to avoid large forecast errors and consequently prevent monetary policy mistakes (see Figure 3). Consequently, expected changes in inflation would be reflected with less uncertainty in the MAS’ policy objectives.
-.02
-.01
.00
.01
.02
.03
-.04
.00
.04
.08
.12
82 84 86 88 90 92 94 96 98 00
Residual Actual Fitted
Figure 3. New Phillips Curve versus Actual Inflation
Resid
ual
Variation in the C
PI

MAS Staff Paper No. 31 June 2004
MONETARY AUTHORITY OF SINGAPORE 19
6. CONCLUSIONS 41 For many open economies, the exchange rate is often required to help buffer frequent shocks from foreign exchange markets due to increasingly volatile capital flows. A key challenge for Singapore’s exchange rate-centered monetary policy framework is to ensure that market perceptions of monetary policy changes are not colored by market noise stemming from the operation of increasingly complex financial and foreign exchange markets.24 A monetary policy framework with more explicit reference to the behavior of economic fundamentals could help the public and market participants to understand better the monetary policy stance, with less explicit attention to short-term changes in the exchange rate. 42 The evidence analyzed in this paper suggests: (1) inflation volatility is caused by several macroeconomic factors, with a relatively little impact of the TWI on CPI inflation initially, but becomes more influential in the medium term; (2) the estimated reaction function suggests that monetary policy in Singapore has had a forward-looking orientation toward stabilizing inflation and output; and (3) the New Phillips Curve fits the data well, suggesting its use as a tool to understand inflation dynamics in Singapore. 43 In particular, the analysis suggests that Singapore’s monetary policy has adjusted the TWI against significant deviations in the implicit target variables, which is consistent with monetary policy’s medium-term orientation. The good historical fit suggests that this computed reaction function could provide a useful yardstick to characterize monetary policy in Singapore. 44 Thus, the current macroeconomic environment, where inflation is subdued, offers an opportunity to better anchor inflation expectations by conveying how medium-term trends and recent developments can affect price stability. MAS has already embarked on this road through recent efforts to increase disclosure and enhance transparency, such as the publication of a semiannual Monetary Policy Statement, and, more recently, through the
24 Regarding the increase in the volatility of the Singapore dollar after the Asian Crisis,
Saktiandi, et al. (2003) has explored its impact on the behavior of key macroeconomic variables. The results of that work find that the higher volatility of the exchange rate has not affected the stability of macroeconomic fundamentals, including trade flows.
MAS Staff Paper No. 31 June 2004
MONETARY AUTHORITY OF SINGAPORE 20
analysis in its Macroeconomic Review. Further steps along these lines would help ensure the smooth functioning of monetary policy in Singapore.25
25 Since 2001, the MAS has published its Macroeconomic Review, which appears twice a
year, in conjunction with the release of the MAS Monetary Policy Statement (MPS). Its main objectives are: “ . . . to provide information on the Economics Department’s analysis and assessment of the GDP growth and inflation developments in the Singapore economy, and in doing so, to share with market participants, analysts, and the wider public, the basis for the policy decision articulated in the MPS.”

MAS Staff Paper No. 31 June 2004
MONETARY AUTHORITY OF SINGAPORE 21
REFERENCES Calvo, Guillermo (1983), “Staggered Prices in a Utility Maximizing Framework,” Journal of Monetary Economics, Vol. 12, No. 3, pp. 383–98. Clarida, Richard, and Mark Gertler (1997), “How the Bundesbank Conducts Monetary Policy,” in Reducing Inflation: Motivation and Strategy, ed. by Christina Romer and David Romer (Chicago: University of Chicago Press). Clarida, Richard, Jordi Galí, and Mark Gertler (1999), “The Science of Monetary Policy: A New Keynesian Perspective,” Journal of Economic Literature, Vol. 37, No. 4, pp. 1661–707. Cushman, David, and Tao Zha (1997), “Identifying Monetary Policy in a Small Open Economy under Flexible Exchange Rates,” Journal of Monetary Economics, Vol. 39, No. 3, pp. 433–48. Fung, Ben (2002), “A VAR Analysis of the Effects of Monetary Policy in East Asia,” BIS Working Paper 119 (Basel: Bank for International Settlements). Gagnon, Joseph and Jane Ihrig (2001), “Monetary Policy and Exchange Rate Pass-Through,” International Finance Discussion Papers 704 (Washington DC: Board of Governors of the Federal Reserve System). Galí, Jordi and Mark Gertler (1999), “Inflation Dynamics: A Structural Econometric Analysis, Journal of Monetary Economics, Vol. 44, No. 2, pp. 195–222. Gerlach, Stefan, and Lars Svensson (2001), “Money and Inflation in the Euro Area: A Case for Monetary Indicators,” BIS Working Paper 98 (Basel: Bank for International Settlements). Haldane, Andrew, and Danny Quah (1999), “UK Phillips Curves and Monetary Policy,” Journal of Monetary Economics, Vol. 44, No. 2, pp. 259–78. Hansen, Lars (1982), “Large Sample Properties of Generalized Method of Moments Estimators,” Econometrica, Vol. 50, No. 4, pp. 1029–54.

MAS Staff Paper No. 31 June 2004
MONETARY AUTHORITY OF SINGAPORE 22
Kim, Soyoung (1999), “Do Monetary Policy Shocks Matter in the G-7 Countries? Using Common Identifying Assumptions about Monetary Policy across Countries,” Journal of International Economics, Vol. 48, No. 2, pp. 387–412. ———, and Nouriel Roubini (2000), “Exchange Rate Anomalies in the Industrial Countries: A Solution with a Structural VAR Approach,” Journal of Monetary Economics, Vol. 45, No. 3, pp. 561–86. King, Robert, and Mark Watson (1994), “The Post-War U.S. Phillips Curve: A Revisionist Econometric History,” Carnegie-Rochester Conference on Public Policy, Vol. 41, pp. 157–219. Kool, Clemens, and John Tatom (1994), “The P-Star Model in Five Small Economies,” Federal Reserve Bank of St. Louis Quarterly Review, pp. 11–29. Monetary Authority of Singapore (1998), Economic Issues (Singapore). ——— (2000), “A Survey of Singapore’s Monetary Policy,” Occasional Paper No. 18 (Singapore). ——— (2001a), “Singapore’s Exchange Rate Policy.” ——— (2001b), Quarterly Bulletin, Vol. III, Issue 3, October. ——— (2002), Macroeconomic Review, Vol. 1, Issues 1 and 2. Saktiandi, Supaat, Angela Phang, Ng Heng Tiong and Edward Robinson (2003), “Investigating the Relationship Between Exchange Rate Volatility and Macroeconomic Volatility in Singapore,” MAS Staff Paper No. 25 (Singapore). Nadal De Simone (2000), “Monetary and Fiscal Policy Interaction in a Small Open Economy: The Case of Singapore,” Asian Economic Journal, Vol. 14, No. 2, pp. 211-31. Parrado, Eric, and Andrés Velasco (2001), “Alternative Monetary Rules in the Open Economy: A Welfare-Based Approach,” in Inflation Targeting: Design, Performance, Challenges, ed. by Norman Loayza and Raimundo Soto (Santiago: Central Bank of Chile).

MAS Staff Paper No. 31 June 2004
MONETARY AUTHORITY OF SINGAPORE 23
——— (2002), “Optimal Interest Rate Policy in a Small Open Economy,” NBER Working Paper No. 8721 (Cambridge, Massachusetts: National Bureau of Economic Research). Sbodorne, Argia (1999), “Prices and Unit Labor Costs: A New Test of Price Stickiness,” (unpublished; New Jersey: Rutgers University). Sims, Christopher (1992), “Interpreting the Macroeconomic Time Series Facts: The Effects of Monetary Policy,” European Economic Review, Vol. 36, No. 5, pp. 975-1000. Stock, James, and Mark Watson (1999), “Forecasting Inflation,” Journal of Monetary Economics, Vol. 44, No. 2, pp. 293–335. Taylor, John (1993), “Discretion versus Policy Rules in Practice,” Carnegie-Rochester Conference Series on Public Policy, Vol. 39, pp.195–214. ——— (2000), “Low Inflation, Pass-Through, and the Pricing Power of Firms,” European Economic Review, Vol. 44, No. 7, pp.1389–408. Woodford, Michael (2003), “A Neo-Wicksellian Framework for the Analysis of Monetary Policy,” in Interest & Prices (Princeton: Princeton University Press).


