Supplementary Figure 1. Sample IV measurement. Top panel: Piezo ramp during a segment of the IV measurement. Bottom panel: Voltage applied to the tip (blue) and current flowing into the substrate (red) as a function of time for a single TDO4 trace in PC (same trace as in above panel). At -0.4V, a current of 0.4 µA is measured, while at +0.4V, the current is very small.
TDO4 Histograms at +/-180mV in TCB:
Supplementary Figure 2. Log-binned conductance histograms for TDO4 measured in 1,2,4-Trichlorobenzene at +/- 180mV using 100 bins/decade. In contrast with the data shown in Figure 1b, there is no change in conductance at the two different polarities.
Non-polar solvent with insulated tip
Measurements of 4,4''-Diamino-p-terphenyl were carried out in phenyl octane (PO, non-
polar) and in propylene carbonate (PC, polar) with a coated tip (glue coated for PO, and wax
coated for PC). We collected 3000 conductance traces at +450mV and -450mV in both PC and
PO (Figure S2). A clear shift in conductance is observed in PC while no change is seen in PO.
We also note that 4,4''-Diamino-p-terphenyl has previously been shown to conduct through the
highest occupied molecular orbital (HOMO)1; its conductance shifts up at positive tip biases in
PC.
Supplementary Figure 3. Log-binned conductance histograms for 4,4”-diamino-p-terphenyl in (a) propylene carbonate (PC) and (b) phenyl octane (PO) created using 100 bins/decade. Both measurements were made with an insulated tip at 450mV and at -450mV. A clear polarity dependence is observed only in PC.
TDO4 IVs measured in propylene carbonate with an additional electrolyte
Supplementary Figure 4. Two-dimensional IV histogram for TDO4 measured in propylene carbonate with an additional 0.1M of tetrabutylammonium perchlorate. Histogram is constructed from 2671 traces.
Supplementary Figure 5. Cyclic voltammogram taken using the break-junction geometry with a solution of 1mM ferrocene in propylene carbonate (there is no added supporting electrolyte). An insulated gold tip serves as our working electrode while a large gold substrate serves as our counter electrode. Conductance histograms for TDO3-TDO5 in TCB
Supplementary Figure 6. Conductance histograms for TDO3-5 measured 1,2,4-trichlorobenzene (TCB). All histograms were measured prior to IV curves being collected.
Supplementary Figure 7. Two-dimensional IV histograms for TDO3-TDO5 in propylene carbonate (a-c) and 1,2,4-trichlorobenzene (d-e). Histograms were constructed from the number of traces indicated in the figures. Average IV curves are overlaid as solid black lines.
Supplementary Figure 8. Two-dimensional IV histograms for 4,4’-bipyridine (1), 4-4’’-diamino-p-terphenyl (2), and 2,9-dithiadecane (3) in propylene carbonate (a-c) and 1,2,4-trichlorobenzene (d-e). Histograms were constructed from the number of traces indicated in the figures. Average IV curves are overlaid as solid black lines.
Supplementary Figure 9. Two-dimensional IV histograms for 4,4’-bipyridine (1) in additional polar media: (a) an ionic liquid (DEME-TFSI) and (b) H2O. Histograms were constructed from the number of traces indicated in the figures. Average IV curves are overlaid as solid black lines. II. Experimental Determination of Orbital Alignment
In order to determine the orbital alignment and orbital coupling strength in TDO4 single-
molecule junctions, we make use of the following recently developed technique2:
1) Measure the conductance, G, and the derivative of conductance with respect to voltage
(dG/dV) for a single molecule junction.
2) Obtain analytical expressions for these two quantities in terms of orbital energy and orbital
coupling strength.
3) Iteratively solve a pair of non-linear equations to determine the two values.
G and dG/dV are obtained by using a modified break-junction technique, similar to that of the IV
measurements (see above). However, instead of applying a saw-tooth bias ramp while the tip is
held at a fixed distance from the substrate, an additional AC voltage (65 mV at 16 kHz and 130
mV at 14 kHz in PC and TCB respectively) is applied on top of a DC voltage (-220 mV and 500
mV in PC and TCB respectively). As with IV measurements, we only analyze traces that have a
molecule present in the junction while the hold is applied. We do this by checking that the
conductance of the junction (just prior to the AC voltage being applied) falls within a standard
deviation of the conductance histogram peak.
The frequency domain representation of the current while the AC voltage is applied is
obtained using the discrete Fourier transform. The zero frequency signal corresponds to the DC
current while the signal at the fundamental frequency (16 kHz and 14 kHz) corresponds to the
AC current. The AC current consists of two components: the first is the tunneling current
through the molecular junction and the second is the result of the capacitive coupling of the
electrodes. We only consider the current in phase with the applied AC voltage in order to discard
the capacitive component. We also measure currents resulting from any non-linearity in the
conductance-voltage relationship; these are measured at the second harmonic frequency (32 kHz
and 28 kHz). In order to see explicitly what is responsible for this signal, the current through the
junction is Taylor expanded around the DC value up to third order terms to yield:
22 2 2
2
1 1 1(V ) Sin( t) Cos(2 t)
4 8 4DCDC DCDC
DC AC AC AC AC AC ACVV VV
dG d G dGI I V G V V VdV dV dV
ω ω= + + + −
Here, I is the current through the junction, VDC is DC bias voltage, VAC is the amplitude of the
AC voltage, and ωAC is the frequency of AC voltage.
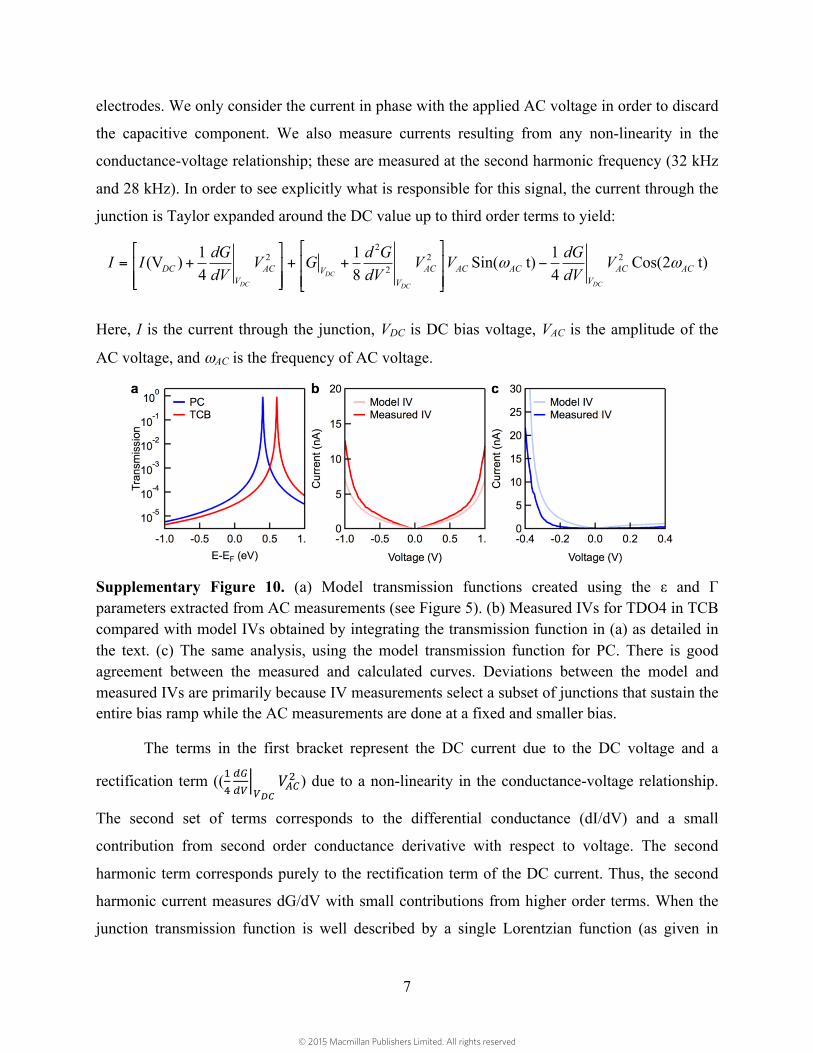
Supplementary Figure 10. (a) Model transmission functions created using the ε and Γ parameters extracted from AC measurements (see Figure 5). (b) Measured IVs for TDO4 in TCB compared with model IVs obtained by integrating the transmission function in (a) as detailed in the text. (c) The same analysis, using the model transmission function for PC. There is good agreement between the measured and calculated curves. Deviations between the model and measured IVs are primarily because IV measurements select a subset of junctions that sustain the entire bias ramp while the AC measurements are done at a fixed and smaller bias.
The terms in the first bracket represent the DC current due to the DC voltage and a
rectification term ((������ ���
���� ) due to a non-linearity in the conductance-voltage relationship.
The second set of terms corresponds to the differential conductance (dI/dV) and a small
contribution from second order conductance derivative with respect to voltage. The second
harmonic term corresponds purely to the rectification term of the DC current. Thus, the second
harmonic current measures dG/dV with small contributions from higher order terms. When the
junction transmission function is well described by a single Lorentzian function (as given in
equation (2) of the manuscript), we can derive an analytic expression for the AC current that is in
phase with the applied AC voltage at the fundamental frequency in terms of ε and Γ. Note that in
this analysis, we explicitly include the dependence of the resonance position on the voltage
through the α parameter as described in the main text. This gives one non-linear equation with
two unknown parameters. Similarly, we derive a second analytic expression for the current at the
second harmonic in terms of ε and Γ. Although not shown explicitly above, we include terms up
to sixth order for the Taylor series expansion. We solve these two non-linear equations using a
non-linear least squares solver algorithm to determine ε and Γ in a single molecule junction.
Rectification and Single-Lorentzian Model:
Supplementary Figure 11. Single Lorentzian model. (a) Single Lorentzian transmission function created using ε = 0.4 eV and Γ = 7 meV. (b) Rectification ratio (Ion/Ioff, RR) as a function of applied voltage using the analytic expression from above. Within our model, we find RRs > 500 as the applied bias nears the value of the zero-bias molecular resonance in agreement with experiment.
In cases where transmission can be indeed modeled as a single Lorentzian function over a
reasonably wide energy range, we are able to obtain an analytic expression for the rectification
ratio at a given voltage. Assuming a transmission function of the form:
� � � � ������ � � � ����� � ����
as defined in the main text. Assuming α=0.5, we find:
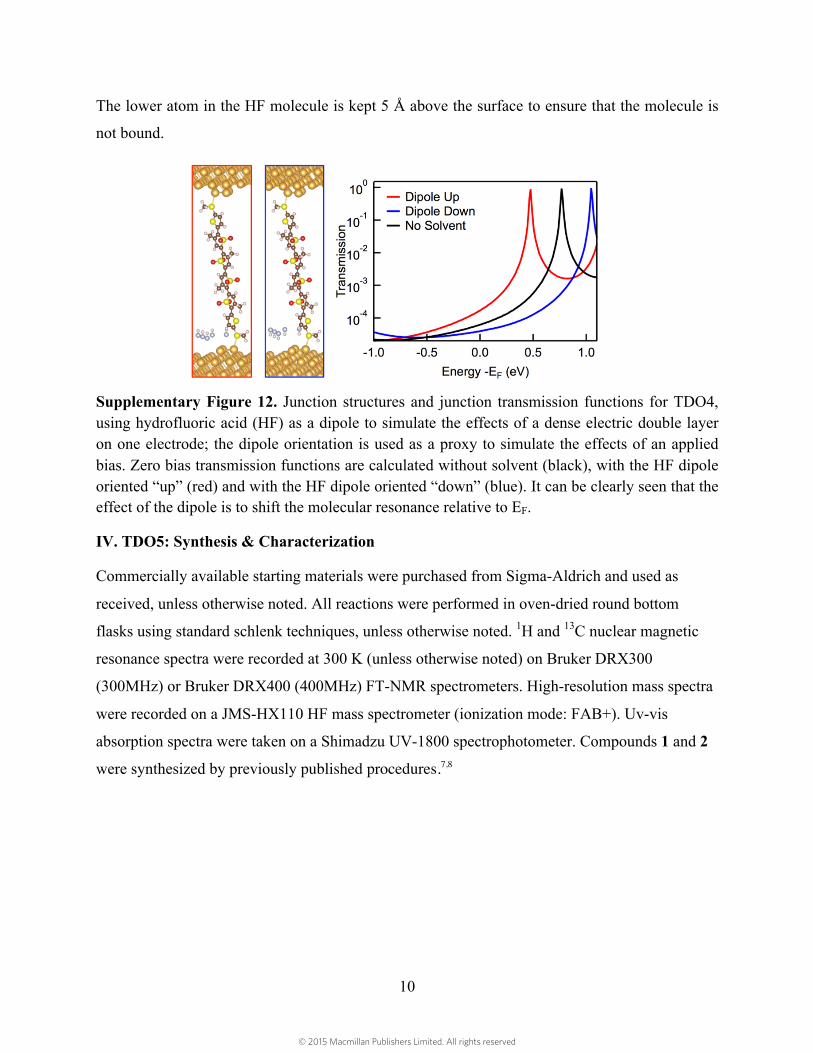
The lower atom in the HF molecule is kept 5 Å above the surface to ensure that the molecule is
not bound.
�
Supplementary Figure 12. Junction structures and junction transmission functions for TDO4, using hydrofluoric acid (HF) as a dipole to simulate the effects of a dense electric double layer on one electrode; the dipole orientation is used as a proxy to simulate the effects of an applied bias. Zero bias transmission functions are calculated without solvent (black), with the HF dipole oriented “up” (red) and with the HF dipole oriented “down” (blue). It can be clearly seen that the effect of the dipole is to shift the molecular resonance relative to EF.
IV. TDO5: Synthesis & Characterization
Commercially available starting materials were purchased from Sigma-Aldrich and used as
received, unless otherwise noted. All reactions were performed in oven-dried round bottom
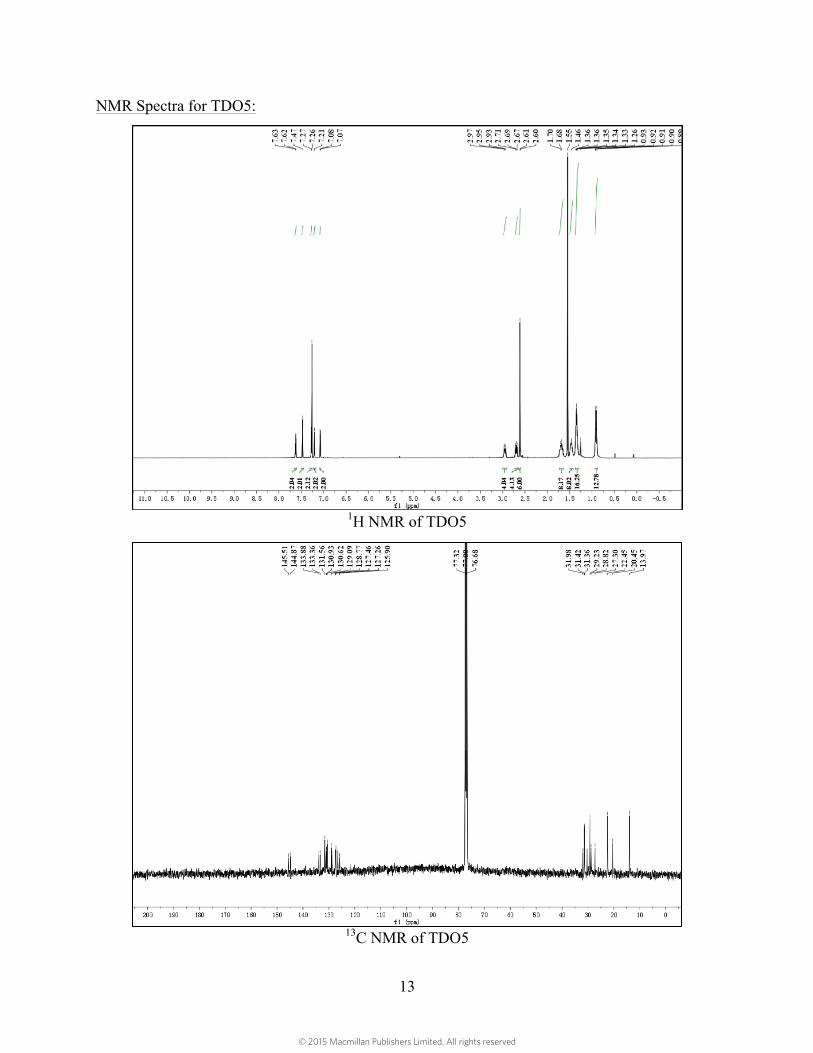
flasks using standard schlenk techniques, unless otherwise noted. 1H and 13C nuclear magnetic
resonance spectra were recorded at 300 K (unless otherwise noted) on Bruker DRX300
(300MHz) or Bruker DRX400 (400MHz) FT-NMR spectrometers. High-resolution mass spectra
were recorded on a JMS-HX110 HF mass spectrometer (ionization mode: FAB+). Uv-vis
absorption spectra were taken on a Shimadzu UV-1800 spectrophotometer. Compounds 1 and 2
were synthesized by previously published procedures.7,8
calcd for C54H68O10S9: 1165.70. Found (M+Na)+: 1186.68.
Supplementary Figure 13. (a) Cyclic voltammogram of TDO5 performed using a 10mM solution of TDO5 with 100mM tetrabutylammonium hexafluorophosphate (t-Bu4NPF6) as supporting electrolyte in dichloromethane. The measurement was made using a standard three-electrode set up, with Pt disk, Pt wire, and Ag/AgCl electrodes serving as the working electrode, counter electrode, and reference electrode, respectively. For calibration, the redox potential of ferrocene/ferrocenium (Fc/Fc+) was measured under the same conditions, and is located at 0.31V relative to the Ag/AgCl electrode. (b) UV-vis spectrum of TDO5 performed using a 10µM solution of TDO5 in dichloromethane.
1 Quek, S.Y., Choi, H.J., Louie, S.G., & Neaton, J.B., Length Dependence of Conductance in Aromatic Single-Molecule Junctions. Nano Lett. 9 (11), 3949-3953 (2009).
2 Adak, O., Korytar, R., Joe, A.Y., Evers, F., & Venkataraman, L., Impact of Electrode Density of States on Transport through Pyridine-Linked Single Molecule Junctions. arXiv:1504.00242 (2015).
3 Quek, S.Y. et al., Amine-gold linked single-molecule circuits: Experiment and theory. Nano Lett. 7 (11), 3477-3482 (2007).
4 Perdew, J.P., Burke, K., & Ernzerhof, M., Generalized Gradient Approximation Made Simple. Phys. Rev. Lett. 77 (18), 3865-3868 (1996).
5 Neaton, J.B., Hybertsen, M.S., & Louie, S.G., Renormalization of molecular electronic levels at metal-molecule interfaces. Phys. Rev. Lett. 97 (21), 216405 (2006).
6 Liu, Z.-F. et al., Control of Single-Molecule Junction Conductance of Porphyrins via a Transition-Metal Center. Nano Lett. 14 (9), 5365-5370 (2014).
7 Amir, E. et al., Synthesis and characterization of soluble low-bandgap oligothiophene-[all]-S,S-dioxides-based conjugated oligomers and polymers. Journal of Polymer Science Part A: Polymer Chemistry 49 (9), 1933-1941 (2011).
8 Barbarella, G. et al., Bright Oligothiophene N-Succinimidyl Esters for Efficient Fluorescent Labeling of Proteins and Oligonucleotides. Bioconjugate Chemistry 17 (1), 58-67 (2005).
9 Amir, E. & Rozen, S., Synthesis of [all]-S,S-dioxide oligothiophenes using HOF center dot CH3CN. Angew. Chem. Int. Ed. 44 (45), 7374-7378 (2005).