12
Credit Suisse Asian Investment Conference 20-21 March 2018 Singtel: Asia’s Leading Commuications Group

Credit Suisse Asian Investment Conference 20-21 March 2018
Singtel: Asia’s Leading Commuications Group
Forward looking statement – Important note
The following presentation contains forward looking statements by the management of SingaporeTelecommunications Limited ("Singtel"), relating to financial trends for future periods, compared to theresults for previous periods.
Some of the statements contained in this presentation that are not historical facts are statements of futureexpectations with respect to the financial conditions, results of operations and businesses, and relatedplans and objectives. Forward looking information is based on management's current views andassumptions including, but not limited to, prevailing economic and market conditions. These statementsinvolve known and unknown risks and uncertainties that could cause actual results, performance or eventsto differ materially from those in the statements as originally made. Such statements are not, and shouldnot be construed as a representation as to future performance of Singtel. In particular, such targets shouldnot be regarded as a forecast or projection of future performance of Singtel. It should be noted that theactual performance of Singtel may vary significantly from such targets.
“S$” means Singapore dollars, "A$" means Australian dollars and “US$” means United States dollars unlessotherwise indicated. Any discrepancies between individual amounts and totals are due to rounding.
2
Asia’s leading communications group
3
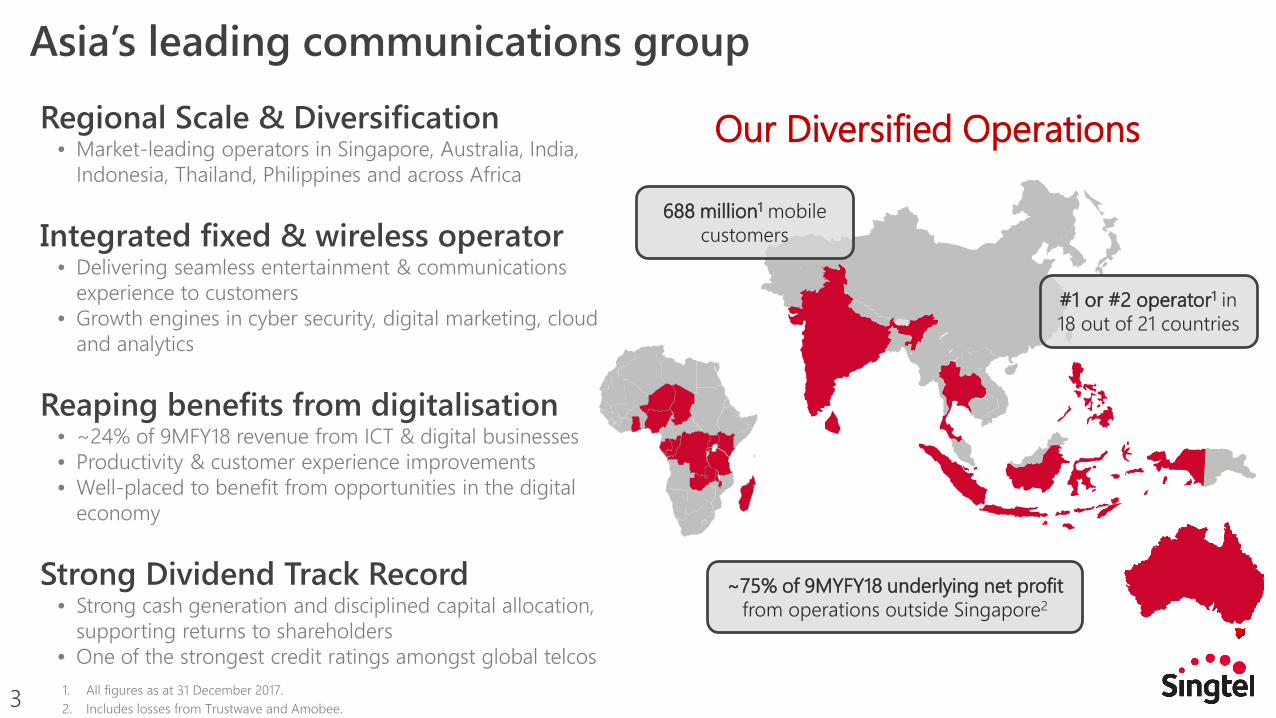
688 million1 mobile customers
#1 or #2 operator1 in 18 out of 21 countries
~75% of 9MYFY18 underlying net profit from operations outside Singapore2
Regional Scale & Diversification• Market-leading operators in Singapore, Australia, India,
Indonesia, Thailand, Philippines and across Africa
Integrated fixed & wireless operator• Delivering seamless entertainment & communications
experience to customers• Growth engines in cyber security, digital marketing, cloud
and analytics
Reaping benefits from digitalisation• ~24% of 9MFY18 revenue from ICT & digital businesses• Productivity & customer experience improvements• Well-placed to benefit from opportunities in the digital
economy
Strong Dividend Track Record• Strong cash generation and disciplined capital allocation,
supporting returns to shareholders• One of the strongest credit ratings amongst global telcos
Our Diversified Operations
1. All figures as at 31 December 2017.2. Includes losses from Trustwave and Amobee.

Our group strategy and key business segments
4
Group ConsumerDiversified portfolio of telecom assetsoffering consumer related functionsincluding mobile, broadband & Pay TV
Group EnterpriseAsia’s leading telco and ICT servicesprovider
Cyber security
Cloud computing
Business mobility
Data centres
Smart cities
IT services
Group Digital LifeNew engines of growth in the digitalspace
Digital marketing
Over-the-top video
Data analytics
VISIONTo be Asia Pacific’s best communications technology company
TRANSFORMATION STRATEGYStrengthen & drive growth from the core | Create innovative, differentiated digital services
GOALSCreate sustainable long-term growth | Deliver superior returns to shareholders | Create positive impact on stakeholders
Three pronged approach to Singtel transformation
5
Digitising core operating model
Value-added services & partnerships to
build digital ecosystem &
enhance the core
Building new standalone businesses where we have a right
to play

Digitising core operating model – driving productivity and better customer experience
6
2,056 2,061 2,141 2,225
811 840877
929
Q4FY17
2,868
Q3FY18
3,154
Q2FY18
3,018
Q1FY18
2,901
My Singtel users My Optus users
17%
20%
Q2FY18
17%18%
Q1FY18 Q3FY18
16%
17%
Q4FY17
12%
16%
OptusSingtel
Q3FY18
58%
55%
Q2FY18
59%
51%
Q1FY18
61%
50%
Q4FY17
54%
50%
Singtel Optus
1. Customers who access the My Singtel or My Optus app at least once a month2. Includes mobile, broadband and Pay TV services. 3. Self-help transactions include activation, recharge, payments, usage & billing enquiries.
Monthly active app users1 % of online sales transactions2
% of self-help transactions2,3
7
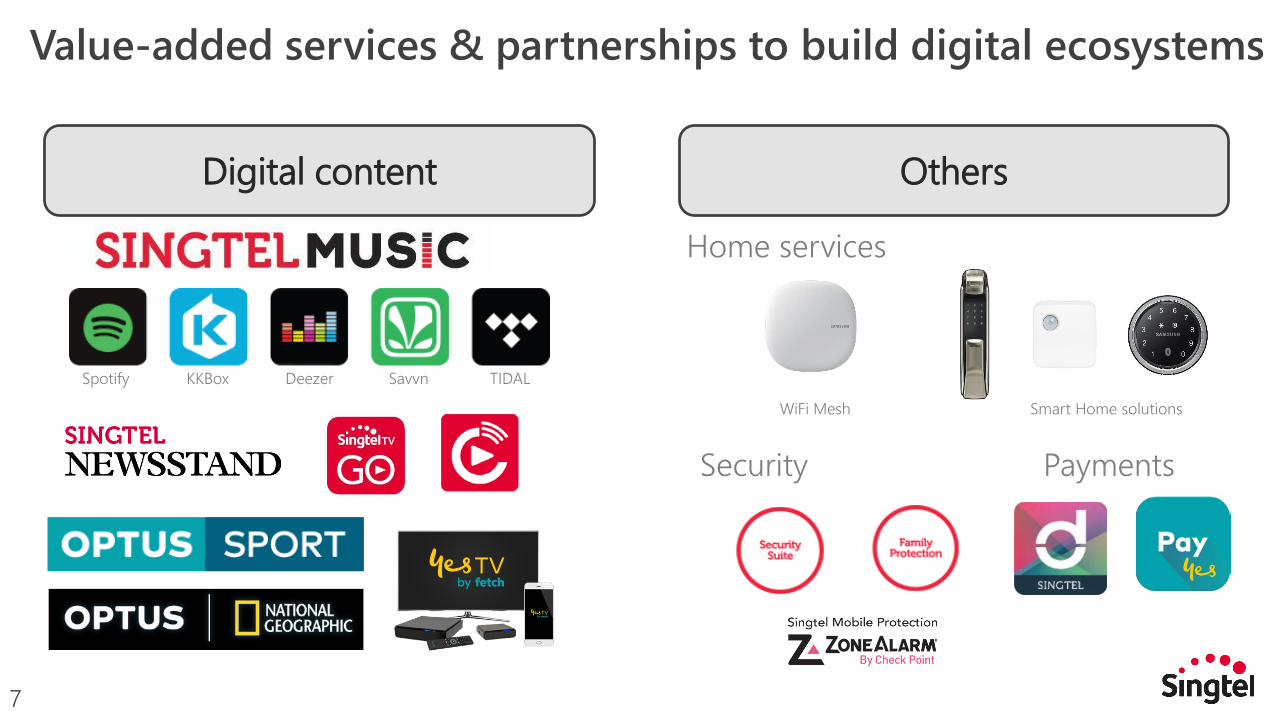
Digital content Others
Spotify KKBox Deezer Savvn TIDAL
Home services
Smart Home solutions
Payments
WiFi Mesh
Security
Value-added services & partnerships to build digital ecosystems
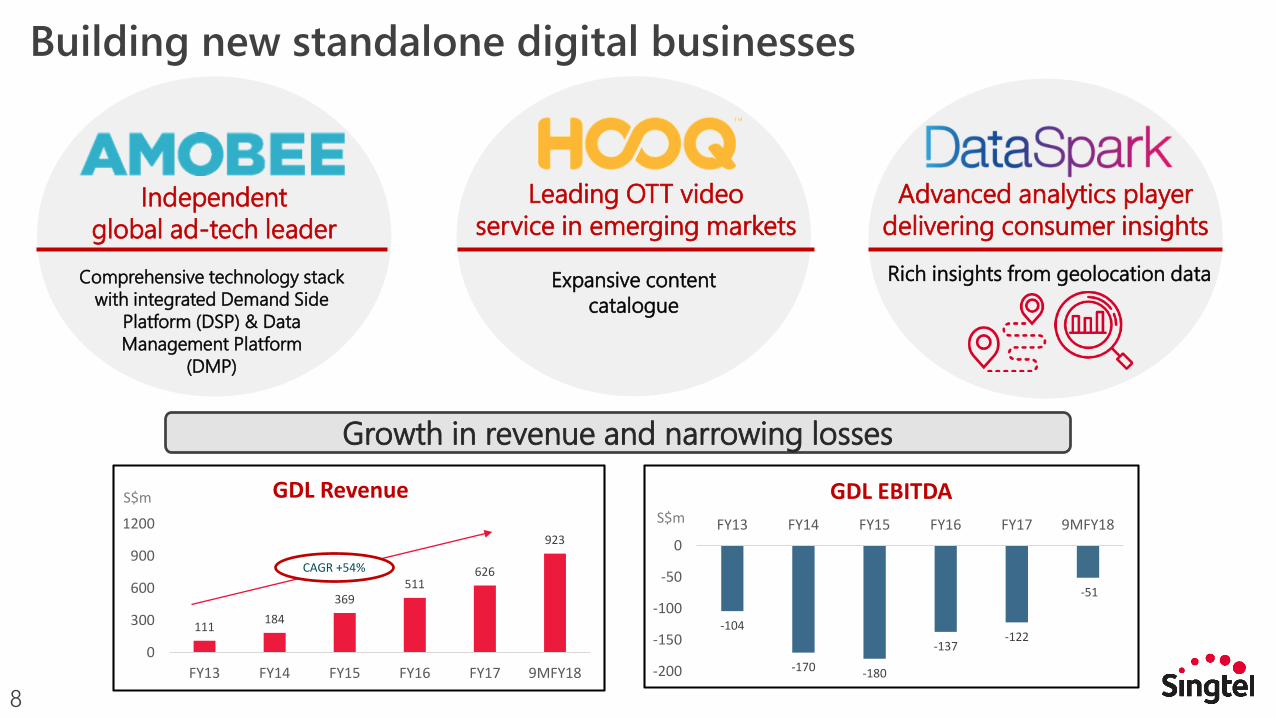
Building new standalone digital businesses
8
Independent global ad-tech leader
Comprehensive technology stack with integrated Demand Side
Platform (DSP) & Data Management Platform
(DMP)
Rich insights from geolocation data
Advanced analytics playerdelivering consumer insights
Leading OTT video service in emerging markets
Expansive content catalogue
S$m
111 184369
511626
923
0
300
600
900
1200
FY13 FY14 FY15 FY16 FY17 9MFY18
GDL RevenueS$m
CAGR +54%
-104
-170 -180
-137-122
-51
-200
-150
-100
-50
0FY13 FY14 FY15 FY16 FY17 9MFY18
GDL EBITDAS$m
Growth in revenue and narrowing losses

Cyber security
End-to-end managed services across the protection stack and security operations
Managed services
Help companies in the day-to-day running of their ICT infrastructure
Cloud solutions
Differentiated cloud platforms and service offerings
Smart Nation
Lead partner for Singapore's Smart Nation program
9
Leveraging new growth engines in digital enterprise

Stable core and diversified operations support strong cash generation…
10
13,20512,404
16,71116,961
9MFY189MFY17FY17FY16
S$’m
Group EBITDAS$’m
Group RevenueS$’m
Group free cash flow
….…
3,8543,689
4,9985,013
9MFY189MFY17FY17FY16
….…
2,806
2,291
3,054
2,718
9MFY189MFY17FY17FY16
….…
+7% +5%+23%
-2% Stable+12%
698580
490 2241,816
9MFY17
2,004
FY17
1,5921,514
2,604
1,906
2,711
2,131
9MFY18FY16
Regional associate’s pre-tax earnings
….…
S$’m +4%
Airtel pre-tax earnings
-9%
Ex-Airtel +5%
Ex-Airtel +12%

… & attractive returns for shareholders
11
6.8 6.8 6.8 6.8 6.8 6.8
10.0 10.0 10.7 10.7 10.7
3.0
FY15
17.5
FY14
16.8
FY13
9.8
FY17
17.516.8
FY16
17.5
1HFY18
78%91% 86%
117%106%
74% 74% 74% 73% 73%
Full year DPS as % of FCF1
Full year DPS as % of underlying EPS
Sing
apor
e ce
nts p
er sh
are
Interim dividend Final dividend Special dividend
1. Free cash flow after interest and tax.
Dividend Policy: 60 – 75% of underlying net profit


