CASTELL6N (SPAIN) SINTERING MECHANISMS OF PORCELAIN STONEWARE TILES C. Zanelli(l), M. Raimondo?', M. Dondi(l), G. Guarini?', P.M. Tenorio Cavalcante'" OlCNR-ISTEC, Institute of Science and Technology for Ceramics, Faenza (Italy); (2)COPPE-UFRJ, Rio de Janeiro (Brazil) ABSTRACT The sintering of porcelain stoneware tiles - a low porosity product with excellent technical performances produced in slabs up to 1 m' - is accomplished in roller kilns with fast cycles «60 min) at maximum temperatures in the 1180-1240°C range. The main limit in further development of this product is its residual porosity, consisting of 2-8% closed pores, that is detrimental to its mechanical and tribological properties as well as the resistance to stains of polished tiles. Several industrial and experimental bodyformulations werestudied by isothermal and constant rate optical thermodilatometry, quantitative XRPD, SEM and BET, in order to understand which mechanisms are active during the whole sintering path. In the initial stage, a strong reduction of specific surface occurs with negligible shrinkage, suggesting that surfacediffusion is the leading mechanism below 1000°C. The main transformations are breakdown of clay minerals with formation of amorphous components, then over 1000 °C mullite and viscous phase. In the intermediate step, densification is accomplished with increasing ratefrom 1050 to 1200°C, being a viscous flow the basic mechanism. However, the maximum shrinkage at each temperature is not related to the amount of viscous phase, so densification seems to be mainly governed by viscosity of the liquid phase. In thefinal stage, a moreor less conspicuous coarsening is observed, essentially over 1175°C, with development of coarse pores. Then a decreasing densification rate is contrasted by a coarsening mechanism, promoted by the wide rangeof pore and particle sizes of green compacts, and an important role is probably played by changes in the solubility of solids and gases in the liquid phase. P.GI - 247
Transcript
CASTELL6N (SPAIN)
SINTERING MECHANISMS OF PORCELAINSTONEWARE TILES
C. Zanelli(l), M. Raimondo?', M. Dondi(l), G. Guarini?', P.M. Tenorio Cavalcante'"
OlCNR-ISTEC, Institute of Science and Technology for Ceramics, Faenza (Italy);(2)COPPE-UFRJ, Rio de Janeiro (Brazil)
ABSTRACT
The sintering of porcelain stoneware tiles - a low porosity product with excellenttechnical performances produced in slabs up to 1 m' - is accomplished in roller kilns with fastcycles «60 min) at maximum temperatures in the 1180-1240°C range. The main limit infurther development of this product is its residual porosity, consisting of 2-8% closed pores,that is detrimental to its mechanical and tribological properties as well as the resistance tostains of polished tiles. Several industrial and experimental bodyformulations werestudied byisothermal and constant rate optical thermodilatometry, quantitative XRPD, SEM and BET,in order to understand which mechanisms are active during the whole sintering path. In theinitial stage, a strong reduction of specific surface occurs with negligible shrinkage, suggestingthat surface diffusion is the leading mechanism below 1000°C. The main transformations arebreakdown of clay minerals with formation of amorphous components, then over 1000 °Cmullite and viscous phase. In the intermediate step, densification is accomplished withincreasing ratefrom 1050 to 1200°C, being a viscousflow the basic mechanism. However, themaximum shrinkage at each temperature is not related to the amount of viscous phase, sodensification seems to be mainly governed by viscosity of the liquid phase. In thefinal stage, amoreor less conspicuous coarsening is observed, essentially over 1175°C, with development ofcoarse pores. Then a decreasing densification rate is contrasted by a coarsening mechanism,promoted by the wide rangeof pore and particle sizes of green compacts, and an important roleis probably played by changes in the solubility of solids and gases in the liquid phase.
P.GI - 247
atQUALIWYL2004
1. INTRODUCTION
CASTELL6N (SPAIN)
Porcelain stoneware is a glass-bonded material with excellent technicalperformances for ceramic tiles, such as mechanical, wear, frost and chemicalresistance. In the last decade, the growth rate of the global production of porcelainstoneware tiles increased more than other ceramic products; in fact, the technicalproperties of porcelain stoneware, coupled with even more improved aestheticappearance, gave it a prominent role on the tile market!".
Porcelain stoneware bodies consist mainly of a mixture of ball clays (30-40%), alkalinefeldspars (40-50%), and quartz sands (10-15%). Their chemical composition may varydepending on the kind of fluxes (sodium or potassium feldspars) and their ratio, the possibleuse of sintering aids (i.e. alkaline-earth compounds, such as dolomite, talc or wollastonite) orglass-ceramic frits (e.g. CaO-Zr02-SiCh, CaO-MgO-SiCh, BaO-Ab03-SiCh systemsj"".
The tiles are sintered by fast single firing «60 minutes cold-to-cold, ==1200°C ofmaximum temperature and 5-10 minutes soaking time) and the resulting phasecomposition consists of crystalline phases, both new formed (mullite) and residualones (quartz, feldspars) embedded in an abundant glassy matrix.I':",
The main standard requirement for porcelain stoneware is a very low waterabsorption «0.5% according to ISO 13006) that is largely fulfilled, being <0.1% in theproducts. In the industrial sintering process, a residual closed porosity cannot be completelyremoved - ranging usually from 2 to 8% - consisting of both small «10 11m) spheroidal, gasfilled pores and irregularly shaped, coarser pores (up to 5011m) probably resulting fromcoalescence of smaller ones'?". This is the main limit in further development of porcelainstoneware because is detrimental to the flexural modulus of rupture (max 80 MPa), Young'smodulus (max 75 CPa), abrasion resistance (no less than 110 mm' of materials removedaccording to ISO 10545-6) and particularly resistance to stains of polished tiles.
The densification is achieved by particle rearrangement and viscous flow,occurring over 1100°C, with a linear shrinkage around 8 cm/ m. Many sinteringmechanisms are contemporarily active (melting, pore coalescence and coarsening,etc.) due to a wide range of pore and particle size in the green compacts, makingdifficult any efficacious design of the microstructure of porcelain stoneware.However, the densification appears to be rate-controlled by the strong dependence ofmelt viscosity on temperature and by the solubility of solids in the liquid phase.Nevertheless, in the final stage, coarsening and solubility of gases filling the closedpores become the most important phenomena affecting the microstructure'",
The aim of this study is to understand better the mechanisms active during the wholesintering path of porcelain stoneware tiles, in order to achieve a phenomenological modelof the process. In fact, notwithstanding the considerable innovation in the industrial firingtechnology (e.g. use of roller kilns, accurate control of temperature, great flexibility intime / temperature curves) the sintering process is still developed with an empiricalapproach (i.e. trial-and-error in the design of both sintering curve and body formulation).A scientific viewpoint is now necessary to accomplish any further material enhancement.
2. MATERIALS AND METHODS
Two samples of industrial bodies (ATP and AT) and five simplified compositionswere studied: prevalently sodium (Na and NaB) or potassium (K and KB) and mixed
P.GI - 248
CASTELL6N (SPAIN) QUALI02JL2004
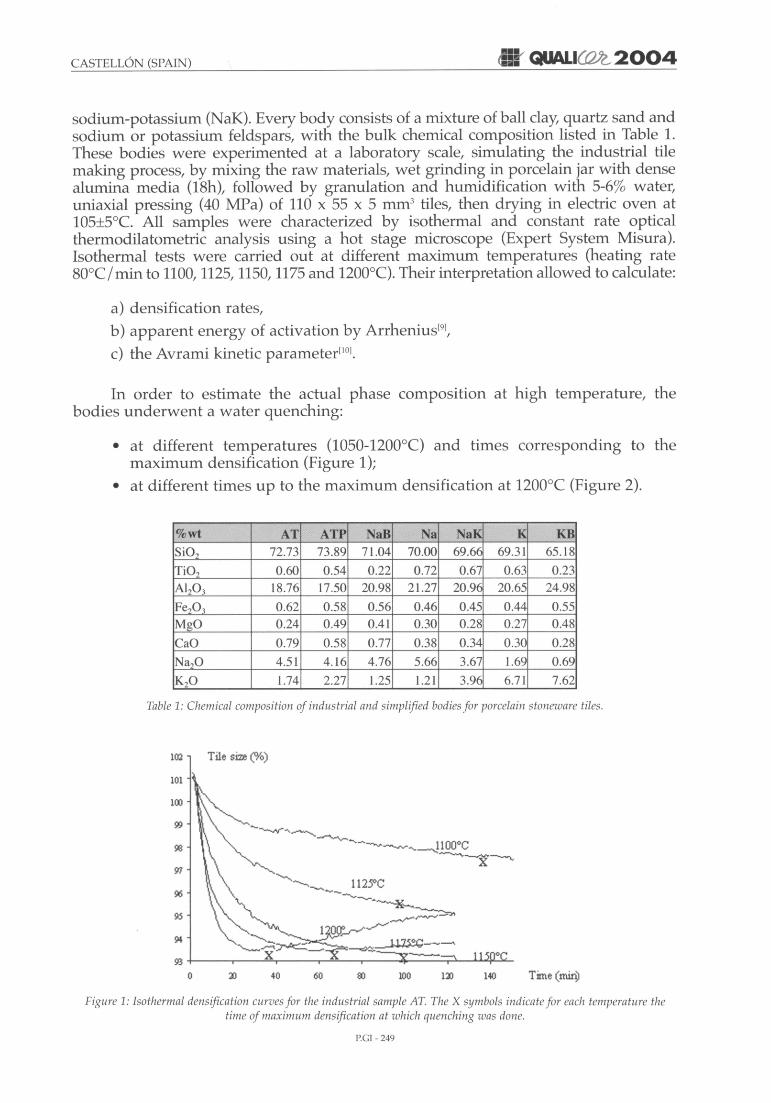
sodium-potassium (NaK). Every body consists of a mixture of ball clay, quartz sand andsodium or potassium feldspars, with the bulk chemical composition listed in Table 1.These bodies were experimented at a laboratory scale, simulating the industrial tilemaking process, by mixing the raw materials, wet grinding in porcelain jar with densealumina media (18h), followed by granulation and humidification with 5-6% water,uniaxial pressing (40 MPa) of 110 x 55 x 5 mrrr' tiles, then drying in electric oven at105±5°C. All samples were characterized by isothermal and constant rate opticalthermodilatometric analysis using a hot stage microscope (Expert System Misura).Isothermal tests were carried out at different maximum temperatures (heating rate80°C / min to 1100,1125, 1150,1175and 1200°C). Their interpretation allowed to calculate:
a) densification rates,
b) apparent energy of activation by Arrhenius'?',
c) the Avrami kinetic parameter'!".
In order to estimate the actual phase composition at high temperature, thebodies underwent a water quenching:
• at different temperatures (1050-1200°C) and times corresponding to themaximum densification (Figure 1);
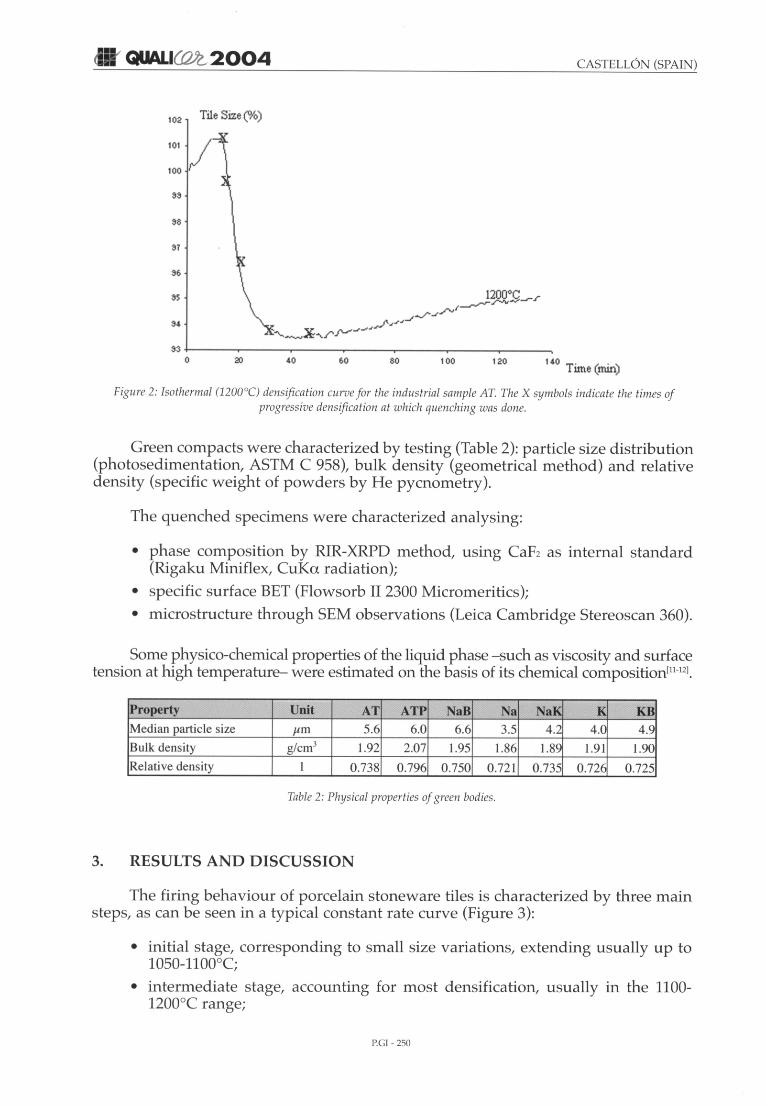
• at different times up to the maximum densification at 1200°C (Figure 2).
%wt AT ATP NaB Na NaK K KBSi02 72.73 73.89 7 1.04 70.00 69.66 69.3 1 65. 18
Table 1: Chemical composition of industrial and simplified bodies for porcelain stoneware tiles.
102 Tile size(%)
101
100
95
Time(tniIV140IJ)100so6040
93-i-----r-~;_----r~'--_,_-~~-~l.-...u....l~'
o
Figure 1: Isothermal densification curves for the industrial sample AT. The X symbols indicatefor each temperature thetime of maximum densification at which quenching was done.
P.GT - 249
CASTELL6 (SPAIN)
102 Tile Size(%)
101/100
SS
S8
S7
S6
S5
Sol
40 60 80 100 120
Figure 2: Isothermal (1200°C) densification curvefor the industrial sample AT. The X symbols indicate the times ofprogressive densificaiion at which quenching was done.
Green compacts were characterized by testing (Table 2): particle size distribution(photosedimentation, ASTM C 958), bulk density (geometrical method) and relativedensity (specific weight of powders by He pycnometry).
The quenched specimens were characterized analysing:
• phase composition by RIR-XRPD method, using CaF2 as internal standard(Rigaku Miniflex, CuKa radiation);
• specific surface BET (Flowsorb II 2300 Micromeritics);
• microstruc ture through SEM observations (Leica Cambridge Stereoscan 360).
Some physico-chemical properties of the liquid phase - such as viscosity and surfacetension at high temperature- were estimated on the basis of its chemical composition'"!",
Property Unit AT ATP NaB Na NaK K KBMed ian part icle size Jim 5.6 6.0 6.6 3.5 4.2 4.0 4.9
Bul k de nsity g/cnr' 1.92 2.07 1.95 1.86 1.89 1.91 1.90
Relative density 1 0.738 0.796 0.750 0.721 0.735 0.726 0.725
Table 2: Physical properties of green bodies .
3. RESULTS AND DISCUSSION
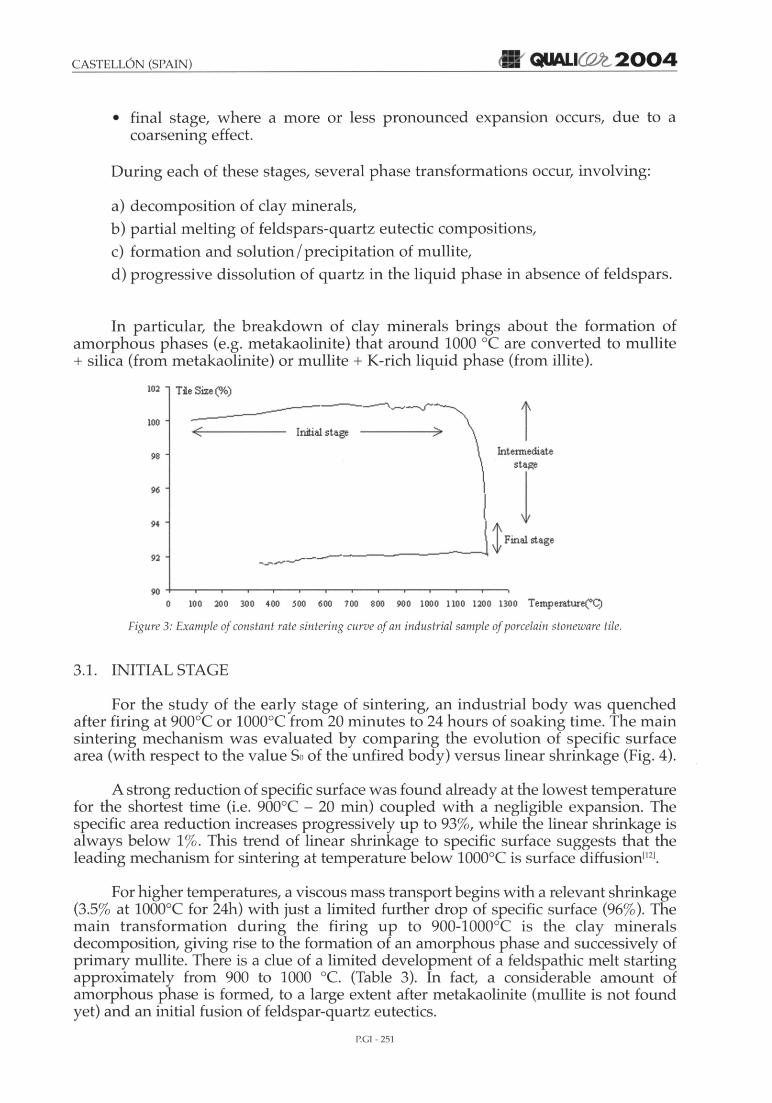
The firing behaviour of porcelain stoneware tile s is characterized by three mainsteps, as can be seen in a typical constant rate curve (Figure 3):
• initial stage, corresponding to small size variations, extending usually up to1050-1100°C;
• intermediate stage, accounting for most densification, usually in the 11001200°C range;
P.GI - 250
CASTELL6N (SPAIN) = QUALI(Ql2.,2004
• final stage, where a more or less pronounced expansion occurs, due to acoarsening effect.
During each of these stages, several phase transformations occur, involving:
a) decomposition of clay minerals,
b) partial melting of feldspars-quartz eutectic compositions,
c) formation and solution/ precipitation of mullite,
d) progressive dissolution of quartz in the liquid phase in absence of feldspars.
In particular, the breakdown of clay minerals brings about the formation ofamorphous phases (e.g. metakaolinite) that around 1000 "C are converted to mullite+ silica (from metakaolinite) or mullite + K-rich liquid phase (from illite).
Figure 3: Example of constant rate sintering curve of an industrialsample of porcelain stoneware tile.
3.1. INITIAL STAGE
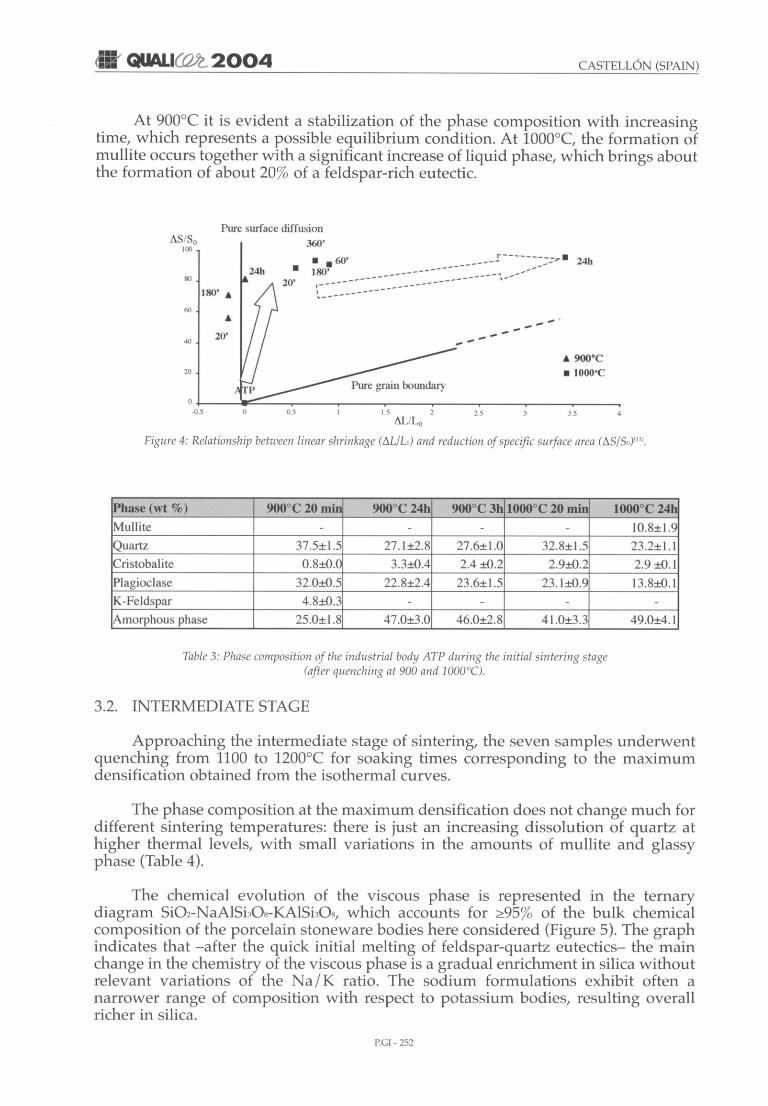
For the study of the early stage of sintering, an industrial body w as quenchedafter firing at 9000 e or 10000 e from 20 minutes to 24 hours of soaking time. The mainsin tering mechanism w as evaluated by comparing the evolution of specific surfacearea (with respect to the value Soof the unfired body) versus linear shrinkage (Fig. 4).
A strong reduction of specific surface was found already at the lowest temperaturefor the shortest time (i.e. 9000 e - 20 min) coupled with a negligible expansion . Thespecific area reduction increases progressively up to 93%, while the linear shrinkage isalways below 1%. This trend of linear shrinkage to specific surface su ggests that theleading mechanism for sintering at temperature below 10000 e is surface diffusion'!".
For higher temperatures, a viscous mass transport begins with a relevant shrinkage(3.5% at 10000 e for 24h) with just a limited further drop of specific surface (96%). Themain transformation during the firing up to 900-1000 oe is the clay mineralsdecomposition, giving rise to the formation of an amorphous phase and successively ofprimary mullite. There is a clue of a limited development of a feldsp athic melt startingapproximately from 900 to 1000 "C. (Table 3). In fact, a considerable amount ofamorphous phase is formed, to a large extent after metakaolinite (mullite is not foundyet) and an initial fusion of feld spar-quartz eutectics.
P.GI - 251
• QUALI(@L2004 CASTELL6N (SPAIN)
At 900°C it is evident a stabilization of the phase composition with increasingtime, which represents a possible equilibrium condition. At 1000°C, the formation ofmullite occurs together with a significant increase of liquid phase, which brings aboutthe formation of about 20% of a feldspar-rich eutectic.
43.5
--'---
2 5
_--------s--- -_--=::.:, . 24h------ - -~~- -
1.5
•• 60'• 180'
05
24h
Pure surface diffusion360 '
20'
180' ~
o +-----IIF------r--__r_---.-----~-----,------r--__r_-_____.-0.5
20
60
80
40
dS/So100
dLlLo
Figure 4: Relationship between linearshrinkage(I1L/Lo) and reduction of specific surfacearea (115/50)1131.
Phase (w t %) 900°C 20 min 900°C 24h 900°C 3h 1000°C 20 min 1000°C 24h
Amorphous phase 25.0±1.8 47.0±3.0 46.0±2.8 41.0±3.3 49.0±4. l
Table 3: Phase composition of the industrial body ATP during the initial sintering stage(after quenching at 900 and 1000°C).
3.2. INTERMEDIATE STAGE
Approaching the intermediate stage of sintering, the seven samples underwentquenching from 1100 to l200°C for soaking times corresponding to the maximumdensification obtained from the isothermal curves.
The phase composition at the maximum densification does not change much fordifferent sin tering temperatures: there is just an increasing dissolution of quartz athigher thermal levels, w ith sm all variations in the amounts of mullite and glassyphase (Table 4).
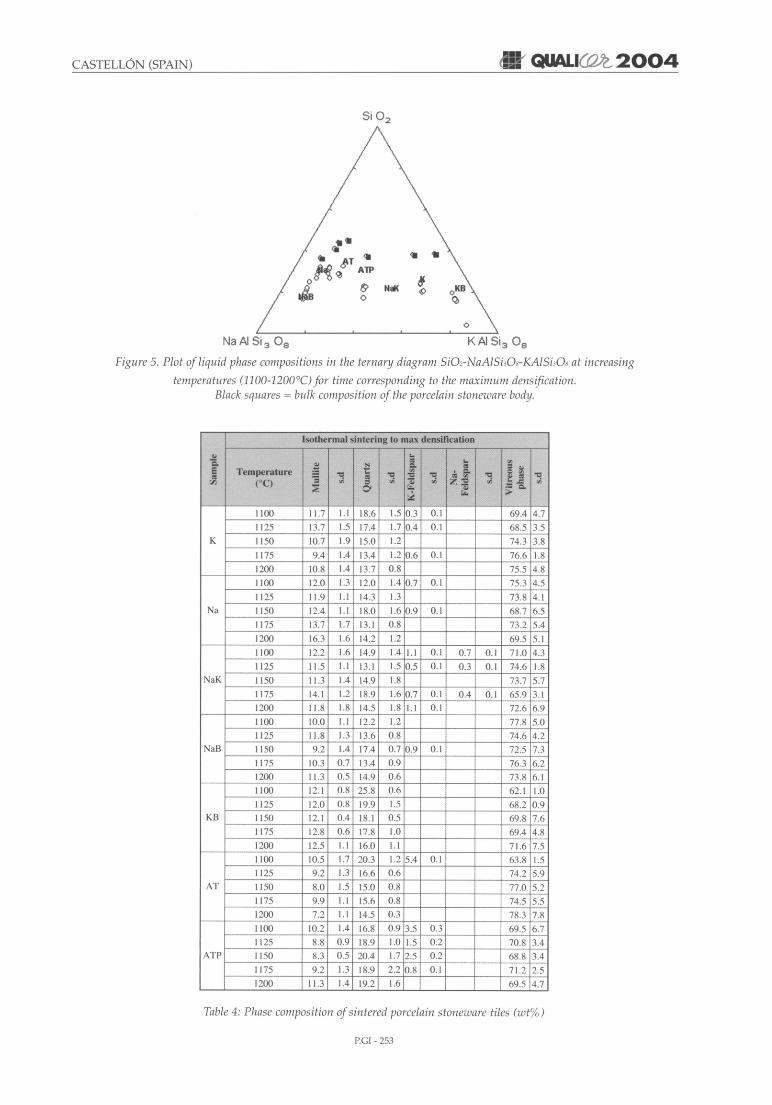
The chemical evolution of the viscous phase is represented in the ternarydiagram Si02-NaAISbOs-KAISbOs, which accounts for ~95% of the bulk chemicalcomposition of the porcelain stonew are bodies here considered (Figure 5). The graphindicates that -after the quick initial melting of feldspar-quartz eutectics- the mainchange in the chemistry of the viscous phase is a gradual enrichment in silica withoutrelevant variations of the Na/K ratio. The sodium formulations exhibit often anarrower range of composition with respect to potassium bodies, resulting overallricher in silica.
PCI - 252
CASTELL6N (SPAIN)
<itA-
til ~T"~~ AlP
t & tlaKIBiB 0
..
!I QUALlCO/G2004
Na AI Si 3 0 8 K AI Si3 0 8
Figure 5. Plot of liquid phase compositions in the ternary diagram Si02-NaAISi30s-KAISi30s at increasing
temperatures (1100-1200 °C) for time corresponding to the maximum densification.Black squares= bulk composition of the porcelain stoneware body.
Table 4: Phase composition of sintered porcelain stoneware tiles (wt%)
P.CI - 253
QUALIWl.,2004 CASTELL6N (SPAIN)
20 ,18 ~
_AT
4-, ---o---ATP
16 , --.--K"........
, ,- -tr- - KBen
14, ....
~, , -<>--NaKc, ,
~ --- .. . . Na'0
0 12 ,, " . - . 0- - - NaB........10 ~-'-" ,
.E',
en 8 ..... .. _- '.60 --o 6 ..........en
:> 4
2
0
1080 1100 1120 1140 1160 1180 1200 1220
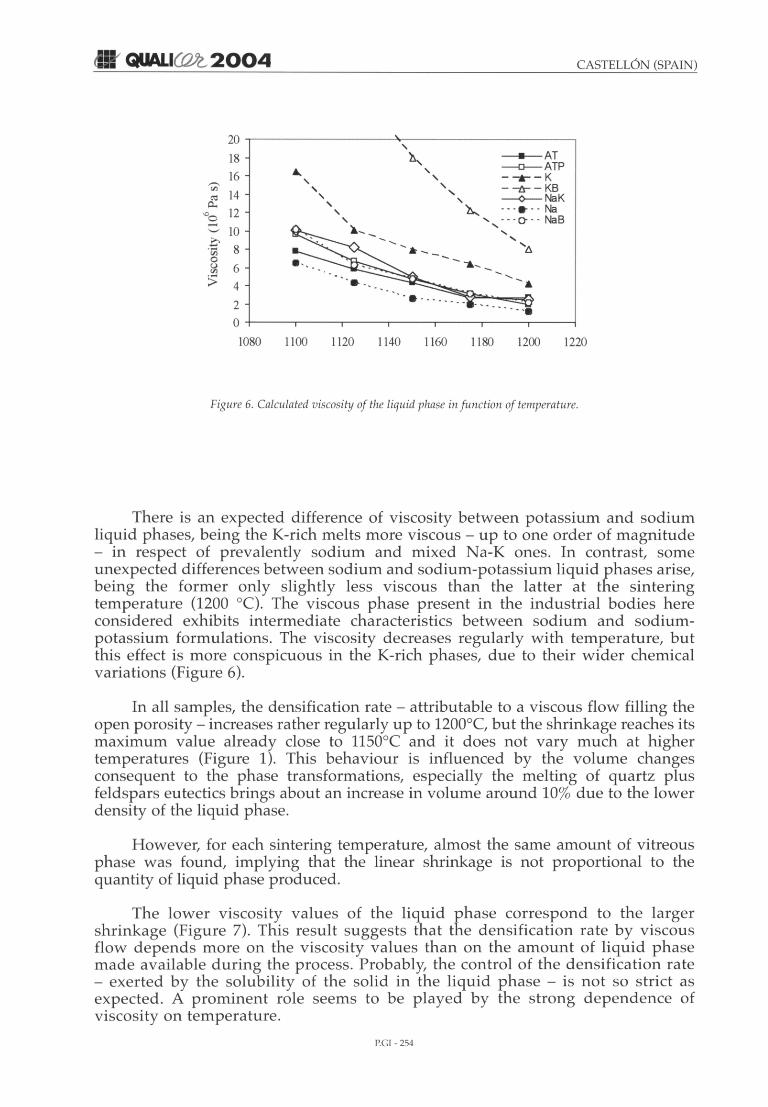
Figure 6. Calculated viscosity of the liquid phase in jun ction of temperature.
There is an expected difference of viscosity between potassium and sodiumliquid phases, being the K-rich melts more viscous - up to one order of magnitude- in respect of prevalently sodium and mixed Na-K ones. In contrast, someunexpected differences between sodium and sodium-potassium liquid phases arise,being the former only slightly less viscous than the latter at the sinteringtemperature (1200 °C). The viscous phase present in the industrial bodies hereconsidered exhibits intermediate characteristics between sodium and sodiumpotassium formulations. The viscosity decreases regularly with temperature, butthis effect is more conspicuous in the K-rich phases, due to their wider chemicalvariations (Figure 6).
In all samples, the densification rate - attributable to a viscous flow filling theopen porosity - increases rather regularly up to 1200°C, but the shrinkage reaches itsmaximum value already close to 1150°C and it does not vary much at highertemperatures (Figure 1). This behaviour is influenced by the volume changesconsequent to the phase transformations, especially the melting of quartz plusfeldspars eutectics brings about an increase in volume around 10% due to the lowerdensity of the liquid phase.
However, for each sintering temperature, almost the same amount of vitreousphase was found, implying that the linear shrinkage is not proportional to thequantity of liquid phase produced.
The lower viscosity values of the liquid phase correspond to the largershrinkage (Figure 7). This result suggests that the densification rate by viscousflow depends more on the viscosity values than on the amount of liquid phasemade available during the process. Probably, the control of the densification rate- exerted by the solubility of the solid in the liquid phase - is not so strict asexpected. A prominent role seems to be played by the strong dependence ofviscosity on temperature.
P.C! - 254
CASTELL6N (SPAIN) = QUALI((2JL2004
Viscosity (MPes)
18
16 b.
14
12
10
8 0
6
4
2 Linear shrinkage(MJL)
0
0.02 0.03 0.04 0.05 0.06 0.07 0.08 0.09
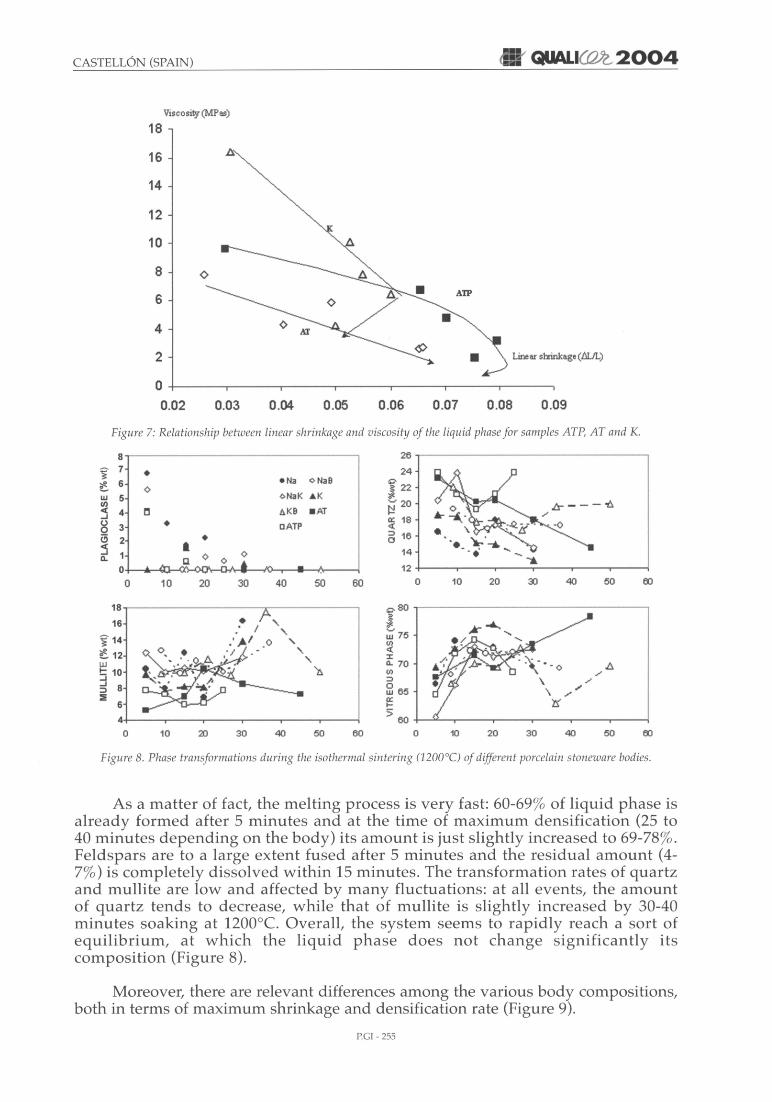
Figure 7: Relationshipbetween linear shrinkageand viscosity of the liquid phase for samples ATp, AT and K.
8 26
j 7 • 24
~ 6 e Na oNaB~ 22o
w 5 (>NaK A K *en "o,J 20 .Is- ----t:.< 4 0 AKB . AT ~..J
Figure8. Phase transformations during the isothermal sintering (1200°C) of different porcelain stonewarebodies.
As a matter of fact, the melting process is very fast: 60-69 % of liquid phase isalready formed after 5 minutes and at the time of maximum densification (25 to40 minutes depending on the body) its amount is just slightly increased to 69-78%.Feldspars are to a la rge extent fused after 5 minutes and the residual amount (47%) is completely dissolved within 15 minutes . The transformation rates of quartzand mullite are lo w an d affected by many fluctuations: at all even ts, the amountof quartz tends to decrease, while that of mullite is sligh tly increased by 30-40minutes soakin g at 1200 °C. Overall, the system seems to rapidly reach a sor t ofequ ilib r iu m , at w h ich the liquid phase does not change sign if ican tly itscomposition (Figure 8).
Moreo ver, there are relevant differences among the various body compositions,both in terms of m aximum shrinkage and densification rate (Figure 9).
P.CI - 255
QUALIa»L2004 CASTELL6N (SPAIN)
Time min)
100999897969594
93929190
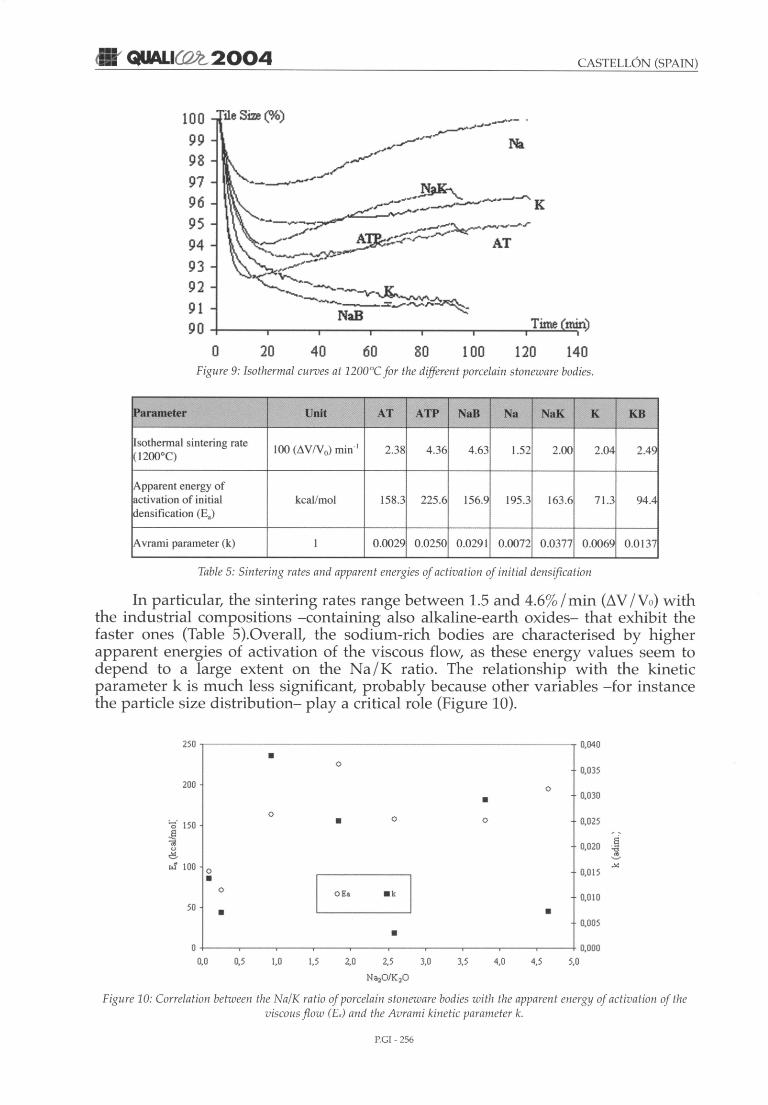
o 20 40 60 80 100 120 140Figure 9: Isothermal curves at 1200°Cfor the different porcelain stoneware bodies.
Table 5: Sintering rates and apparent energies of activation of initial densification
In particular, the sintering rates range between 1.5 and 4.6% I min (/1V IVa ) withthe industrial compositions -containing also alkaline-earth oxides- that exhibit thefaster ones (Table 5).Overall, the sodium-rich bodies are characterised by higherapparent energies of activation of the viscous flow, as these energy values seem todepend to a large extent on the Na/K ratio. The relationship with the kineticparameter k is much less significant, probably because other variables -for instancethe particle size distribution- playa critical role (Figure 10).
250 0,040
• 00,035
200 0
• 0,030
00 0,025:C' 150 • 0
.§ eca 0,020u :.ac ~
.s 100 ~
0 0,015•I
0 OEa . k 0,01050 • •
0,005
•0 0,000
0,0 0,5 1,0 1,5 2,0 2,5 3,0 3,5 4,0 4,5 5,0
Na20/K20
Figure 10: Correlation between the Na/K ratio of porcelainstonewarebodies with the apparen t energtJ of activation of theviscous flow (Ea) and the Avrami kinetic parameter k.
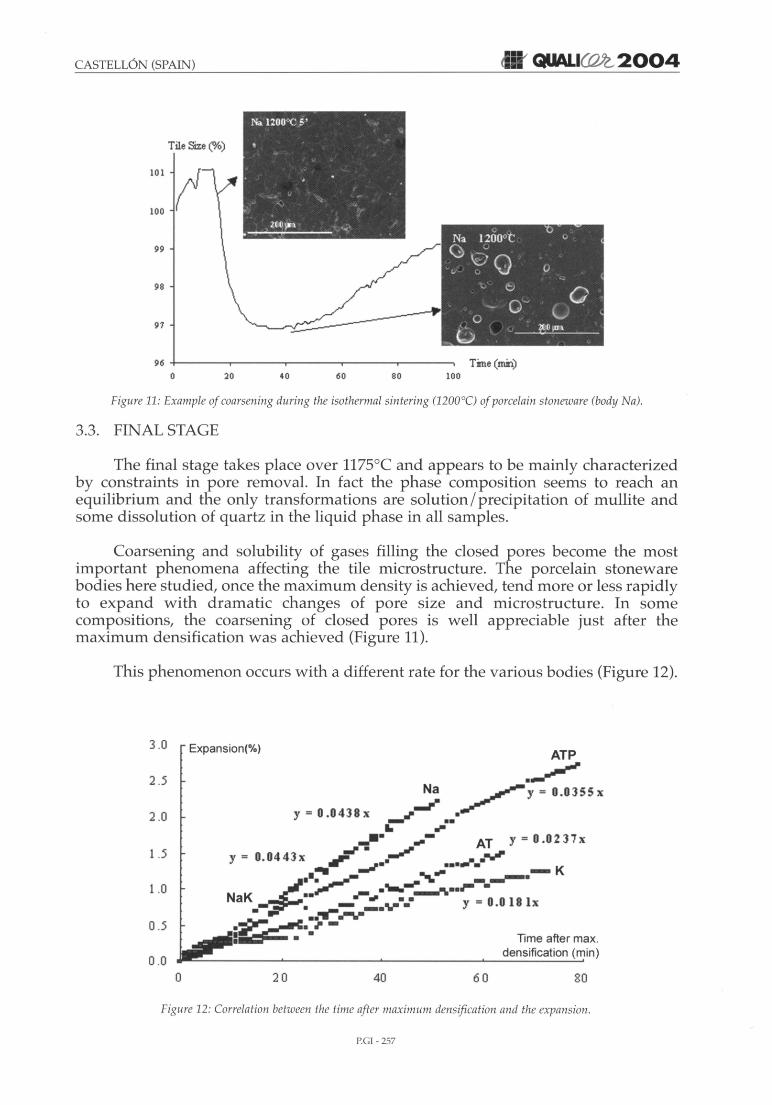
Figure 11: Example of coarsening during the isothermal sintering (1200°C) of porcelain stoneware (body Na).
3.3. FINAL STAGE
The final stage takes place over 1175°C and appears to be mainly characterizedby constraints in pore removal. In fact the phase composition seems to reach anequilibrium and the only transformations are solution/ precipitation of mullite andsome dissolution of quartz in the liquid phase in all samples.
Coarsening and solubility of gases filling the closed pores become the mostimportant phenomena affecting the tile microstructure. The porcelain stonewarebodies here studied, once the maximum density is achieved, tend more or less rapidlyto expand with dramatic changes of pore size and microstructure. In somecompositions, the coarsening of closed pores is well appreciable just after themaximum densification was achieved (Figure 11).
This phenomenon occurs with a different rate for the various bodies (Figure 12).
80
Time after max.densification (min)
604020
ATP
.~~ ~Y = 0.0355x
y = 0.0438x...",. •••. ..__• .",.- AT Y = 0.02 37x
..l'. .""J'Y = 0.0443x .... ""., •...,....."IJ. - K
~.•. ----- ---.""'- .1 --.••"" •
NaK •• ,r=O.0181x• • - _..... J
;~.:i!C--. ---.
Expansion(%)
o
2 .0
2 .5
0.5
3.0
1.0
1.5
0 .0
Figure 12: Correlation between the time after maximum densification and the expansion.
PGl - 257
• QUALICWL2004 CASTELL6N (SPAIN)
0 .0 5
NaK
•0 .04
~--.,;~~CQ.) 0 .0312~
.~
ra0
t.)
0 .02
•
0 .011 .0 2 .0 3 .0 4 .0 5 .0
Vis co s ity 0 f li qui d Phas e ( 1 0 6 Pas )
Figure 13: Correlation between the viscosity of the liquid phase and the coarsening rate of porcelain stoneware (body NaK).
The faster coarsening rates occur in the sodium-rich batches, so a fairdependence on the Na/K ratio of the liquid phase exists, though with the exceptionof sample NaK (Figure 13). The coarsening of microstructure is accompanied by aprogressive deformation of the tile, due to an incipient slumping, whose origin isconnected to the very large amount of liquid phase (> 70% weight) and to theconsequent 'buoyancy' effects on residual crystalline grains.
Therefore, the amount of residual porosity in the final step depends on thecontrasting effects of two competing mechanisms: a decreasing densification rateagainst an increasing coarsening rate.
4. CONCLUSIONS
Different mechanisms are active during the sintering of porcelain stoneware tilesand each of them is accompanied by a complex evolution of both phase compositionand chemical composition of the liquid phase.
The most important are:
• surface diffusion, accounting for a strong reduction of specific surface withnegligible shrinkage in the early stage (below 1000°C) where the maintransformations involve the breakdown of clay minerals leading to theformation of amorphous components which, starting from about 1000°C, giverise to mullite and/ or a viscous phase.
• viscous flow, responsible of densification occurring mainly in the 1100-1200°Crange, which is promoted by the fast development, approximately over
PCI - 258
CASTELL6N (SPAIN) QUALllWG2004
1050°C, of an abundant liquid phase, whose composition corresponds tofeldspars-quartz eutectics.
• pore coarsening, contrasting the decreasing sintering rate in the final stage(>1175°C) and resulting in swelling/bloating for prolonged firing.
The maximum densification achievable increases progressively in the 1050-1200°Crange, while the melting of feldspars-quartz eutectics occurs already at 900°C and alarge mass of viscous phase is present over 1000°C. However, the firing shrinkage is notproportional to the amount of liquid phase. This picture suggests that densificationdepends essentially on the viscosity of the liquid phase, which exhibits limited changesin composition with time and seems to be mainly affected by temperature.
The sintering rate is very fast up to 70-80% of pore removal, accounting for 2-5%volumetric shrinkage per minute at 1200°C. The apparent energy of activation for viscousflow is higher in sodium bodies (157-226 kcal/ mol) than in potassium ones (71-94 kcal/ mol).
Coarsening and solubility of gases filling the closed pores are the prevalentmechanisms affecting the tile microstructure in the final stage of sintering. Porcelainstoneware bodies tend to expand for prolonged firing, though this phenomenonoccurs in the different bodies with a variable rate. In some compositions, anoteworthy pore coarsening appears just after the maximum densification wasachieved. In this critical step, the amount of residual porosity seems to depend on thecompeting effects of decreasing densification rate against increasing coarsening rate.
REFERENCES
[1] T. Manfredini, c.c. Pellacani, M. Romagnoli, Porcelainized stoneware tiles, Am. Ceram. Soc. Bull 74 (1995) 76-79
[2] F. Matteucci, M. Dondi, G. Guarini, Effect of soda-lime glass on sintering and technological properties ofporcelain stoneware tiles. Ceramics International, 28 (2003) 873-880.
[3] G. Baldi, E. Generali, D. Settembre Blundo, Preparazione, Caratterizzazione ed applicazione industriale di unvetroceramico appartenente al sistema Zr02-CaO-Si02 (ZCS) come componente in impasti da gresporcellanato, Ceramurgia 30 (2000) 161-171.
[4] G. Biffi, Porcelainized Stoneware, Gruppo Editoriale Faenza, Italy, 1996
[5] M. Dondi, G. Ercolani, M. Marsigli, C. Melandri and C. Mingazzini, The chemical composition of porcelainstoneware tiles and its influence on microstructure and mechanical properties. Interceram, 48 [2] (1999) 75-83.
[6] E. Sanchez, M. J Orts, K. garcia-Ten, V. Cantavella, Porcelain tile composition effect on phase formation andend product, Am. Ceram. Soc. Bull. 80 (6) (2001) 43-49
[7] C. Leonelli, F. Bondioli, P.Veronesi, M. Romagnoli, T. Manfredini, G.c. Pellacani, V. Cannillo: Enhancing themechanical properties of porcelain stoneware tiles: a microstructure approach, J. Eur. Ceram. Soc., 21 (2001),785-793
[8] P. Reijnen, Pore growth and elimination during sintering of silicate ceramics, cfi/Ber. DKG 73 (1996) 594-598.
[9] S. Cho Yong, W.A. Schulze, R. Vasantha: Crystallization kinectics and Properties of NonstoichiometricCordierite-Based Thick-film Dielectrics, J. Am. Ceram. Soc. 82 [3] (1999) 3186-92.
[11] T. Lakatos, L-G. Johansson, B. Simmingsk61d, Viscosity temperature relations in the glass system Si02-A1203Na20-K20-CaO-MgO in the composition range of technical glasses, Glass Technology 13 [3] (1972) 88-95.
[12] F. Cambier, A. Leriche, Vitrification, Materials Science and Technology - A Comprehensive Treatment, Voll7BProcessing of Ceramics Part II (1996) VCH
[13] R.M. German, "Overview of Key Directions and Problems in Computational and Numerical Techniques inPowder Metallurgy", (199~)